Sociolinguistically Informed Interpretability:
A Case Study on Hinglish Emotion Classification
Abstract
Emotion classification is a challenging task in NLP due to the inherent idiosyncratic and subjective nature of linguistic expression, especially with code-mixed data. Pre-trained language models (PLMs) have achieved high performance for many tasks and languages, but it remains to be seen whether these models learn and are robust to the differences in emotional expression across languages. Sociolinguistic studies have shown that Hinglish speakers switch to Hindi when expressing negative emotions and to English when expressing positive emotions. To understand if language models can learn these associations, we study the effect of language on emotion prediction across 3 PLMs on a Hinglish emotion classification dataset. Using LIME Ribeiro et al. (2016) and token level language ID, we find that models do learn these associations between language choice and emotional expression. Moreover, having code-mixed data present in the pre-training can augment that learning when task-specific data is scarce. We also conclude from the misclassifications that the models may overgeneralise this heuristic to other infrequent examples where this sociolinguistic phenomenon does not apply.
Disclaimer: This paper contains some examples of language use that readers may find offensive.
1 Introduction
An open-ended goal of the NLP community is to develop language technologies robust to the vast and various idiosyncrasies of authentic human communication. Understanding emotion requires knowledge of the subtleties of linguistic expression and inherent human subjectivity, making emotion classification a challenging task. It is further complicated when working with code-mixed utterances. Every language participating in code-mixed communication comes with its own cultural and linguistic baggage that oversees the verbalization of emotion Kachru (1978); Hershcovich et al. (2022). The adoption of pre-trained language models (PLMs) has improved performance across the board for this task, but the PLMs still remain black boxes. While research in interpretability aims to address this shortcoming, most analyses remain centered around English Ruder et al. (2022). In this work, we aim to make explicit what associations are learned when PLMs are trained on code-mixed data, and whether established differences in linguistic expression across languages indeed influence model prediction.
We approach this interpretability problem through the lens of sociolinguistics. In particular, we focus on Hindi-English (Hinglish) code-mixing, prevalent in India and in the Indian diaspora Orsini (2015). In a study on Hindi-English bilinguals on Twitter, Rudra et al. (2016) observed that English was the language of choice for expression of a positive emotion and Hindi was more used for negative emotion. Moreover, Hindi was the preferred language for swearing online, a finding also echoed by Agarwal et al. (2017). Rudra et al. (2016) explain the reason behind this to be the fact that bilinguals prefer to express strong emotions Dewaele (2010) and swear Dewaele (2007) in L1, which happens to be Hindi for most Hinglish speakers. Conversely, Rudra et al. (2016) speculate that since English is the language of aspiration in India, it becomes the preferred language for positive emotion.
In this context, we formulate our main questions as: (RQ1) Are PLMs likely to associate different emotions with different languages? (RQ2) Are English tokens more likely to influence a model to predict a positive emotion? (RQ3) Are Hindi tokens more likely to influence a model to predict a negative emotion, and if so, what is the role of Hindi swear words? To this end, we fine-tune 3 different PLMs on a Hinglish emotion classification dataset and leverage LIME and token-level language identification for an interpretability analysis.
2 Related Work
Code-Mixing
Previous works in emotion classification and sentiment analysis have demonstrated that processing code-mixed text is more difficult than monolingual text Sitaram et al. (2019); Zaharia et al. (2020); Yulianti et al. (2021). This is in part due to the complexities of processing emotion from two different languages with varying socio-cultural and grammatical structures at play Younas et al. (2020); Sasidhar et al. (2020); Ilyas et al. (2023). In this context, Doğruöz et al. (2021) published a survey on the linguistic and social perspectives on code-mixing for language technologies. They emphasized the importance of incorporating the social context of a code-mixed language pair into systems processing code-mixed text.
Interpretability with LIME
LIME (Local Interpretable Model-Agnostic Explanations) Ribeiro et al. (2016) is a popular tool for interpretability that is model agnostic and employable for classification tasks. It learns a linear classifier locally around a model’s prediction, leveraging token weights (also learned by the linear classifier) to assign a "LIME score" between 1 and -1 to each token. A positive score indicates that the token influenced the model towards the predicted label, and a negative score indicates that the token influenced the model to not predict that label. We leverage LIME due to its availability and easy-to-use implementations, for instance in the Language Interpretability Tool (LIT; Tenney et al., 2020), which we used for this work. Previous work has also indicated the accuracy of its approximation of the models and its ability to provide human-friendly explanations Madsen et al. (2022); Hajiyan et al. (2023).
3 Methodology
Dataset
We utilize a dataset for sentiment analysis of code-mixed tweets by Patwa et al. (2020), later annotated with emotion labels by Ghosh et al. (2023). Each example is annotated with the six basic Ekman emotions Ekman et al. (1999) - joy, sadness, fear, surprise, disgust and anger. When an example does not fit any of these emotions, or expresses no emotion, it is labelled as others. This dataset contains 14,000 examples in the train set, 3,000 in the validation, and 3,000 in the test set. For this work, we randomly sample 1,000 examples from the validation set to enable manual verification of the automatic token tagging described below, maintaining the default distribution across labels (see Appendix B).
Models
We fine-tune 3 different PLMs for the task of emotion classification with the Hinglish training data:
-
•
XLMR Conneau et al. (2020), pre-trained on Common Crawl, spanning 100 languages, including English and Hindi, both in the Devanagari script and additional romanized Hindi.
-
•
IndicBERT v2 Doddapaneni et al. (2022), pre-trained on data from 24 Indic languages, including Hindi and English that is local to the Indian subcontinent. For Hindi, this model has only seen the Devanagari script, and no romanized Hindi.
-
•
HingRoBERTa Nayak and Joshi (2022), an XLM-R model that has been further pre-trained on romanized, code-mixed Hindi-English. Thus, in addition to having seen romanized Hindi, this model is specifically intended for code-mixed text.
The full details on model training and performance are given in Appendix A.
Token Tagging
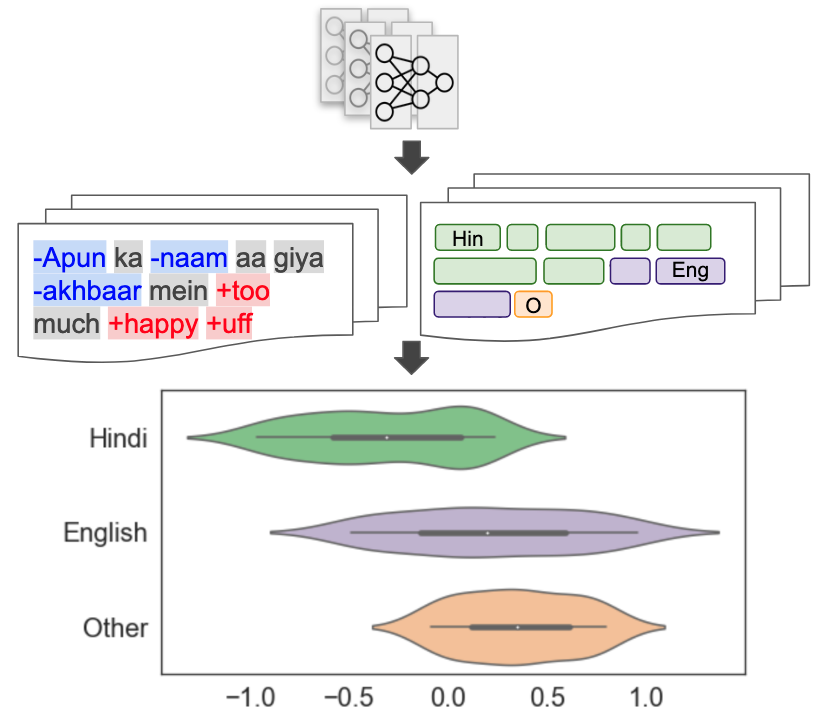
For each of the 1,000 samples (20,835 tokens in total) drawn from the validation set, we first obtain LIME scores for each token using LIT Tenney et al. (2020). We then run the samples through CodeSwitch Sarkar (2020), a Hinglish language identification tool which tags each token as Hindi, English, or Other, to get the language ID tags.111Besides the Hindi and English labels, CodeSwitch also tags tokens as ”Named-Entity”, ”Foreign words”, and ”Other” for punctuation, emojis, and other non-textual tokens. For this work, we combine these 3 additional tags into one category.
4 Results and Analysis
First, to answer whether the models learn to meaningfully distinguish between languages for emotion prediction (RQ1), we examine the distributions of LIME scores across each language ID tag (English, Hindi, Other). Concretely, we inspect the frequency with which tokens received a positive or a negative LIME score in our sample, for each language. We then conduct a test of independence to determine whether these two variables have some dependency. Table 1 shows the -values for the entire sample. For all models, we find this dependence to be statistically significant (), indicating that there is some influence of language over the LIME scores. We also confirm this with a 1-Way ANOVA test, which can be found in Appendix C, along with our entire statistical analysis.
Next, we examine this dependency on a more granular level to determine whether the presence of English tokens influence the Hinglish emotion classification models to predict more positive emotions (RQ2), and whether Hindi tokens influence them to predict negative emotions (RQ3). We observe the distribution of language ID across LIME scores for examples that the models predicted as joy, anger, and sadness. These labels were selected in particular as they have the most examples in the dataset (after others), and provide the positive (joy) and negative (anger and sadness) polarity discussed in the sociolinguistics literature.
| -values | ||||
|---|---|---|---|---|
| Model | Entire Sample | Joy | Anger | Sadness |
| XLM-R | 7.06e-12 | 1.44e-15 | 6.18e-7 | 1.78e-3 |
| IndicBERT | 1.22e-22 | 3.28e-4 | 1.69e-5 | 3.30e-1 |
| HingRoBERTa | 3.30e-7 | 4.00e-18 | 1.71e-8 | 2.18e-5 |
(RQ2) Do English tokens influence models to predict positive emotions?
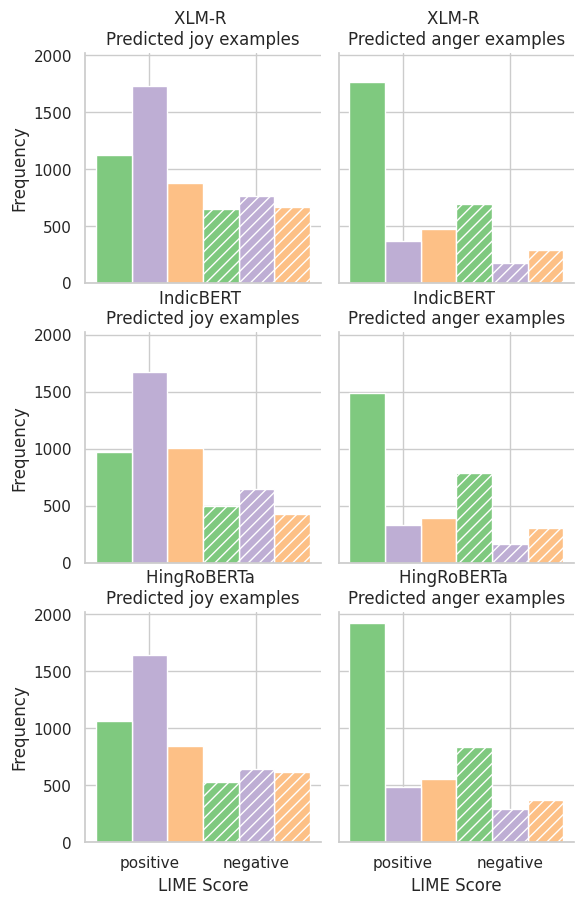
Figure 2 shows which languages tend to have more positive and more negative LIME scores. As observed for joy, English tokens have the highest frequency with positive LIME scores. Table 1 shows that there is a significant dependency between language ID and LIME score for all models. Thus, English tokens influence the model significantly more than Hindi and Others when predicting joy.
(RQ3) Do Hindi tokens influence models to predict negative emotions?
When predicting anger, Table 1 again shows that there is dependency between language ID and LIME score for all models. From Figure 2, we can see that Hindi tokens influence the model significantly towards predicting anger. When predicting sadness, however, we only observe significance with the XLM-R and HingRoBERTa models, but not with IndicBERT. Moreover, for XLM-R, the -value is not much lower than the threshold. Thus, we cannot make strong conclusions for this label.
| Token | Lang_ID | Swear Word?222As decided by a native speaker, and also compared with the lexicon lists of Hindi and English swear words used by Agarwal et al. (2017). |
|---|---|---|
| Fuck | eng | Yes |
| Chutiye | hin | Yes |
| Fakeionist | eng | No |
| Bsdk | hin | Yes |
| Sadly | eng | No |
| Bakwas | hin | No |
| Kutta | hin | Yes |
| Gaddar | hin | No |
| Shame | eng | No |
| Sala | hin | Yes |
Swear Words
Previous works demonstrate that Hinglish speakers prefer to swear in Hindi over English, in a code-mixed setting Rudra et al. (2016); Agarwal et al. (2017). To check whether this finding is similarly echoed by our fine-tuned models, we examine the top 10 tokens with the highest LIME scores when predicting a negative emotion (anger, sadness, disgust, fear), across all models (see Table 2). While the first among these is an English swear word (owing to it being the most used swear word by Hinglish speakers online Agarwal et al. (2017)) there are 4 Hindi swear words in this list of tokens. As such, we can see that the models not only learn the negative connotation of the Hindi swear words, but also that these Hindi swear words are the most negative of all other tokens, regardless of language, thus confirming observations from the sociolinguistics literature.
5 Discussion
From the section above, it can be concluded that the models are able to distinguish patterns of speaker preference detailed by Rudra et al. (2016) when predicting emotion for code-mixed data. English tokens influence the models more towards predicting a positive emotion, and Hindi tokens influence the models more towards predicting a negative emotion. An example of this is provided in Figure 3, where all the models exhibit a strong degree of influence from the English tokens in their prediction of the joy label. At the same time, most of the tokens assigned a negative LIME score come from Hindi.
For sadness, we surmise that a shortage of training data is responsible for models’ failure to learn meaningful differences across the languages. About 10% of the entire dataset consists of examples labelled sadness. In contrast, joy is 30% and anger is about 20% (see Appendix B). Even with less data, however, we still observe a dependency between language and LIME score with HingRoBERTa. It is the only model we examine with code-mixed data present in the pre-training. Thus, when there is less data for a model to learn these associations, it can help to have code-mixed data in the pre-training.
5.1 Do PLMs overgeneralize these learnt associations?
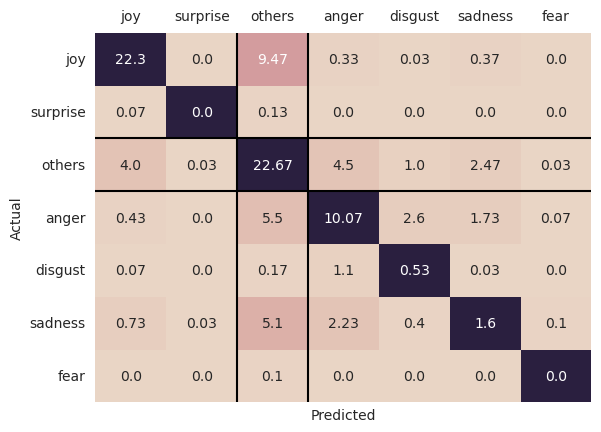
McCoy et al. (2019) found that language models can adapt to heuristics that are valid for frequent cases and fail on the less frequent ones. In a similar vein, we investigate whether these sociolinguistic associations learnt by the models overgeneralise to the less frequent examples where this phenomenon is not seen. We examine instances where the models have misclassified examples labelled as joy and anger, highlighted in Figure 4.
For both joy and anger, the models generally either predict another label of the same emotional polarity (for example, disgust instead of anger), or they predict them as others. The dataset is highly imbalanced, and thus we can say that although the models can discern the polarity difference between positive and negative emotion labels (as seen in Figure 4 where the values in the lower left and upper right quadrants are low), they struggle with granular distinctions between them.
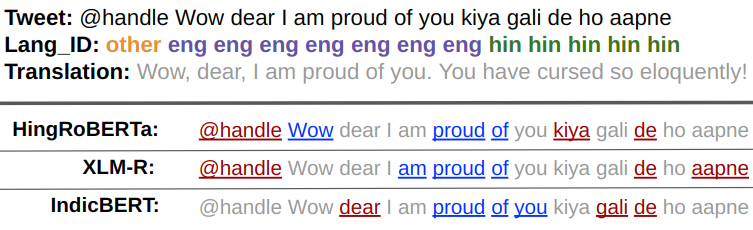
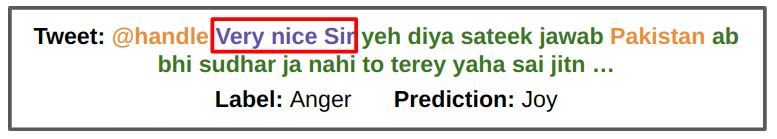
We also manually look into the few instances where joy examples were assigned a negative emotion label, and anger examples were assigned a positive emotion label. Out of the total instances, 15 involve scenarios where either Hindi words with a negative connotation led the model to attribute a negative label to joy, or English words with a positive connotation influenced the model to assign a positive emotion label to anger. This suggests that examples featuring English words indicating positive emotions on their own can mislead the model into predicting a positive emotion label despite an overall negative tone in the expression (and vice versa for Hindi words), as illustrated in Figure 5.
On a broader scale, we examine the distribution of English, Hindi and Other tokens in the misclassified joy and anger examples. As seen in Table 3, the normalised frequency of Hindi tokens is higher in the misclassified joy examples than the overall distribution. Consequently, more Hindi tokens have a positive LIME score. Thus, McCoy et al. (2019)’s conclusions stated earlier are echoed here as well. While the extreme cases where the models overgeneralise to predict an emotion label of the opposite polarity are few, there is a bias learnt in the models against predicting joy for Hindi tokens. For examples labelled anger, although there is less difference seen in the frequency of English tokens in the misclassified examples, more English tokens have a positive LIME score. Thus, a similar bias against predicting anger for English could be inferred.
Overall, the fact that these associations are learnt by the models, to the extent that they can overgeneralise them, could also be seen as substantiating the sociolinguistic phenomena. If speakers tend to switch to Hindi to express negative emotions, the ability of language models to detect this reinforces the existence of such a tendency. This also encourages deeper engagement between sociolinguistics and interpretability, with both fields offering valuable insights to each other.
| Joy | |||
|---|---|---|---|
| Distribution of tokens in all examples | |||
| All examples | Correct | Misclassified | |
| English | 0.40 | 0.44 | 0.32 |
| Hindi | 0.34 | 0.29 | 0.44 |
| Other | 0.26 | 0.27 | 0.24 |
| Distribution of tokens assigned a positive LIME score | |||
| All examples | Correct | Misclassified | |
| English | 0.43 | 0.48 | 0.32 |
| Hindi | 0.32 | 0.28 | 0.42 |
| Other | 0.25 | 0.24 | 0.32 |
| Anger | |||
| Distribution of tokens in all examples | |||
| All examples | Correct | Misclassified | |
| English | 0.15 | 0.14 | 0.17 |
| Hindi | 0.63 | 0.65 | 0.61 |
| Other | 0.22 | 0.21 | 0.22 |
| Distribution of tokens assigned a positive LIME score | |||
| All examples | Correct | Misclassified | |
| English | 0.15 | 0.13 | 0.18 |
| Hindi | 0.64 | 0.68 | 0.60 |
| Other | 0.21 | 0.19 | 0.23 |
6 Conclusion
In this work, we use sociolinguistics theories to understand what PLMs learn when training emotion classifiers for code-mixed data. We found that the models indeed learn the differences in language use and emotional expression detailed in the sociolinguistics literature. Concretely, these are the associations of English tokens with positive emotions, and Hindi tokens with negative emotions. Adding code-mixed data to the pre-training can help augment this learning when task-specific data is scarce. However, the models can overgeneralise this learning to infrequent examples where it does not apply. In future work, it would be interesting to see if this understanding can be leveraged to help improve systems designed for code-mixed languages.
7 Acknowledgements
The computational resources and services used in this work were provided by the VSC (Flemish Supercomputer Center), funded by the Research Foundation - Flanders (FWO) and the Flemish Government - department EWI (for Kushal Tatariya and Miryam de Lhoneux). Heather Lent and Johannes Bjerva are supported by the Carlsberg Foundation, under the Semper Ardens: Accelerate programme (project nr. CF21-0454).
References
- Agarwal et al. (2017) Prabhat Agarwal, Ashish Sharma, Jeenu Grover, Mayank Sikka, Koustav Rudra, and Monojit Choudhury. 2017. I may talk in english but gaali toh hindi mein hi denge : A study of english-hindi code-switching and swearing pattern on social networks. In 2017 9th International Conference on Communication Systems and Networks (COMSNETS), pages 554–557.
- Conneau et al. (2020) Alexis Conneau, Kartikay Khandelwal, Naman Goyal, Vishrav Chaudhary, Guillaume Wenzek, Francisco Guzmán, Edouard Grave, Myle Ott, Luke Zettlemoyer, and Veselin Stoyanov. 2020. Unsupervised cross-lingual representation learning at scale. In Proceedings of the 58th Annual Meeting of the Association for Computational Linguistics, pages 8440–8451, Online. Association for Computational Linguistics.
- Dewaele (2007) Jean-Marc Dewaele. 2007. Blistering barnacles! what language do multilinguals swear in?! Sociolinguistic Studies, 5.
- Dewaele (2010) Jean-Marc Dewaele. 2010. Emotions in multiple languages. Palgrave Macmillan, Basingstoke.
- Doddapaneni et al. (2022) Sumanth Doddapaneni, Rahul Aralikatte, Gowtham Ramesh, Shreya Goyal, Mitesh M. Khapra, Anoop Kunchukuttan, and Pratyush Kumar. 2022. Indicxtreme: A multi-task benchmark for evaluating indic languages.
- Doğruöz et al. (2021) A. Seza Doğruöz, Sunayana Sitaram, Barbara E. Bullock, and Almeida Jacqueline Toribio. 2021. A survey of code-switching: Linguistic and social perspectives for language technologies. In Proceedings of the 59th Annual Meeting of the Association for Computational Linguistics and the 11th International Joint Conference on Natural Language Processing (Volume 1: Long Papers), pages 1654–1666, Online. Association for Computational Linguistics.
- Ekman et al. (1999) Paul Ekman et al. 1999. Basic emotions. Handbook of cognition and emotion, 98(45-60):16.
- Ghosh et al. (2023) Soumitra Ghosh, Amit Priyankar, Asif Ekbal, and Pushpak Bhattacharyya. 2023. Multitasking of sentiment detection and emotion recognition in code-mixed hinglish data. Knowledge-Based Systems, 260:110182.
- Hajiyan et al. (2023) Hooria Hajiyan, Heidar Davoudi, and Mehran Ebrahimi. 2023. A comparative analysis of local explainability of models for sentiment detection. In Proceedings of the Future Technologies Conference (FTC) 2022, Volume 3, pages 593–606, Cham. Springer International Publishing.
- Hershcovich et al. (2022) Daniel Hershcovich, Stella Frank, Heather Lent, Miryam de Lhoneux, Mostafa Abdou, Stephanie Brandl, Emanuele Bugliarello, Laura Cabello Piqueras, Ilias Chalkidis, Ruixiang Cui, Constanza Fierro, Katerina Margatina, Phillip Rust, and Anders Søgaard. 2022. Challenges and strategies in cross-cultural NLP. In Proceedings of the 60th Annual Meeting of the Association for Computational Linguistics (Volume 1: Long Papers), pages 6997–7013, Dublin, Ireland. Association for Computational Linguistics.
- Ilyas et al. (2023) Abdullah Ilyas, Khurram Shahzad, and Muhammad Kamran Malik. 2023. Emotion detection in code-mixed roman urdu - english text. ACM Trans. Asian Low-Resour. Lang. Inf. Process., 22(2).
- Kachru (1978) Braj B. Kachru. 1978. Toward structuring code-mixing: An indian perspective. International Journal of the Sociology of Language, 1978(16):27–46.
- Madsen et al. (2022) Andreas Madsen, Siva Reddy, and Sarath Chandar. 2022. Post-hoc interpretability for neural nlp: A survey. ACM Comput. Surv., 55(8).
- McCoy et al. (2019) Tom McCoy, Ellie Pavlick, and Tal Linzen. 2019. Right for the wrong reasons: Diagnosing syntactic heuristics in natural language inference. In Proceedings of the 57th Annual Meeting of the Association for Computational Linguistics, pages 3428–3448, Florence, Italy. Association for Computational Linguistics.
- Nayak and Joshi (2022) Ravindra Nayak and Raviraj Joshi. 2022. L3Cube-HingCorpus and HingBERT: A code mixed Hindi-English dataset and BERT language models. In Proceedings of the WILDRE-6 Workshop within the 13th Language Resources and Evaluation Conference, pages 7–12, Marseille, France. European Language Resources Association.
- Orsini (2015) Francesca Orsini. 2015. Dil maange more: Cultural contexts of hinglish in contemporary india. African Studies, 74(2):199–220.
- Patwa et al. (2020) Parth Patwa, Gustavo Aguilar, Sudipta Kar, Suraj Pandey, Srinivas PYKL, Björn Gambäck, Tanmoy Chakraborty, Thamar Solorio, and Amitava Das. 2020. SemEval-2020 task 9: Overview of sentiment analysis of code-mixed tweets. In Proceedings of the Fourteenth Workshop on Semantic Evaluation, pages 774–790, Barcelona (online). International Committee for Computational Linguistics.
- Ribeiro et al. (2016) Marco Túlio Ribeiro, Sameer Singh, and Carlos Guestrin. 2016. "why should I trust you?": Explaining the predictions of any classifier. CoRR, abs/1602.04938.
- Ruder et al. (2022) Sebastian Ruder, Ivan Vulić, and Anders Søgaard. 2022. Square one bias in NLP: Towards a multi-dimensional exploration of the research manifold. In Findings of the Association for Computational Linguistics: ACL 2022, pages 2340–2354, Dublin, Ireland. Association for Computational Linguistics.
- Rudra et al. (2016) Koustav Rudra, Shruti Rijhwani, Rafiya Begum, Kalika Bali, Monojit Choudhury, and Niloy Ganguly. 2016. Understanding language preference for expression of opinion and sentiment: What do Hindi-English speakers do on Twitter? In Proceedings of the 2016 Conference on Empirical Methods in Natural Language Processing, pages 1131–1141, Austin, Texas. Association for Computational Linguistics.
- Sarkar (2020) Sagor Sarkar. 2020. Code switch.
- Sasidhar et al. (2020) T Tulasi Sasidhar, Premjith B, and Soman K P. 2020. Emotion detection in hinglish(hindi+english) code-mixed social media text. Procedia Computer Science, 171:1346–1352. Third International Conference on Computing and Network Communications (CoCoNet’19).
- Sitaram et al. (2019) Sunayana Sitaram, Khyathi Raghavi Chandu, Sai Krishna Rallabandi, and Alan W. Black. 2019. A survey of code-switched speech and language processing. CoRR, abs/1904.00784.
- Tenney et al. (2020) Ian Tenney, James Wexler, Jasmijn Bastings, Tolga Bolukbasi, Andy Coenen, Sebastian Gehrmann, Ellen Jiang, Mahima Pushkarna, Carey Radebaugh, Emily Reif, and Ann Yuan. 2020. The language interpretability tool: Extensible, interactive visualizations and analysis for NLP models. In Proceedings of the 2020 Conference on Empirical Methods in Natural Language Processing: System Demonstrations, pages 107–118, Online. Association for Computational Linguistics.
- Younas et al. (2020) Aqsa Younas, Raheela Nasim, Saqib Ali, Guojun Wang, and Fang Qi. 2020. Sentiment analysis of code-mixed roman urdu-english social media text using deep learning approaches. In 2020 IEEE 23rd International Conference on Computational Science and Engineering (CSE), pages 66–71.
- Yulianti et al. (2021) Evi Yulianti, Ajmal Kurnia, Mirna Adriani, and Yoppy Setyo Duto. 2021. Normalisation of indonesian-english code-mixed text and its effect on emotion classification. International Journal of Advanced Computer Science and Applications, 12(11).
- Zaharia et al. (2020) George-Eduard Zaharia, George-Alexandru Vlad, Dumitru-Clementin Cercel, Traian Rebedea, and Costin Chiru. 2020. UPB at SemEval-2020 task 9: Identifying sentiment in code-mixed social media texts using transformers and multi-task learning. In Proceedings of the Fourteenth Workshop on Semantic Evaluation, pages 1322–1330, Barcelona (online). International Committee for Computational Linguistics.
Appendix A Model Details
We used Huggingface to fine-tune the pre-trained language models described in Section 3 on the emotion classification dataset. Our hyperparameters are listed in Table 4 and the performance of our models over the development set are in Table 5, below.
| Hyperparameter | Value |
|---|---|
| Dropout | 0.2 |
| Learning Rate | 2e-05 |
| Number of Epochs | 50 |
| Batch Size | 32 |
| Model | Accuracy |
|---|---|
| XLM-R | 0.57 |
| IndicBERT | 0.55 |
| HingRoBERTa | 0.58 |
Appendix B Label Distributions
The sample of 1,000 examples used in the analysis was selected by maintaining the label distribution from the validation set. The distribution is detailed in Table 6.
| Label Distributions | ||
|---|---|---|
| Our Sample | Validation Set | |
| others | 347 | 1048 |
| joy | 325 | 973 |
| anger | 204 | 607 |
| sadness | 102 | 307 |
| disgust | 19 | 55 |
| surprise | 2 | 6 |
| fear | 1 | 4 |
| Total | 1,000 | 3,000 |
Appendix C Statistical Analysis
C.1
We performed a test of independence on the samples for each model to understand the relationship between the two variables - language ID and LIME score. We constructed the contingency tables with the frequencies of how many times each language ID label - eng, hin and other had a positive or a negative LIME score. We did this for the entire sample to confirm a dependency between those variables. We further examined this dependency on a more granular level by conducting the same test for examples that were predicted as joy, anger and sadness by the models. The contingency table for the entire sample is in Table 7, and per label is in Table 8.
| Contingency Tables - All Samples | ||||||
| XLM-R | IndicBERT | HingRoBERTa | ||||
| Positive | Negative | Positive | Negative | Positive | Negative | |
| English | 3658 | 2264 | 3840 | 2082 | 3728 | 2194 |
| Hindi | 5759 | 4242 | 5914 | 4087 | 6127 | 3874 |
| Other | 2709 | 2203 | 3281 | 1631 | 2843 | 2069 |
| Contingency Tables - Per Label | ||||||
| Joy | ||||||
| XLM-R | IndicBERT | HingRoBERTa | ||||
| Positive | Negative | Positive | Negative | Positive | Negative | |
| English | 1730 | 759 | 1669 | 643 | 1643 | 639 |
| Hindi | 1127 | 648 | 974 | 500 | 1061 | 527 |
| Other | 876 | 668 | 1010 | 429 | 849 | 618 |
| Anger | ||||||
| XLM-R | IndicBERT | HingRoBERTa | ||||
| Positive | Negative | Positive | Negative | Positive | Negative | |
| English | 365 | 173 | 332 | 165 | 482 | 288 |
| Hindi | 1760 | 689 | 1487 | 789 | 1926 | 840 |
| Other | 473 | 293 | 393 | 307 | 551 | 370 |
| Sadness | ||||||
| XLM-R | IndicBERT | HingRoBERTa | ||||
| Positive | Negative | Positive | Negative | Positive | Negative | |
| English | 248 | 139 | 176 | 80 | 233 | 135 |
| Hindi | 596 | 258 | 389 | 187 | 597 | 272 |
| Other | 187 | 129 | 135 | 49 | 169 | 143 |
C.2 ANOVA and Tukey HSD
C.2.1 Entire Sample
| ANOVA - All Samples | |
|---|---|
| Model | -value |
| XLM-R | 2.09e-31 |
| IndicBERT | 3.35e-45 |
| HingRoBERTa | 3.97e-20 |
The -values from the ANOVA results are in Table 9. They confirm results that for the entire sample size, there is dependency between language and LIME score for all models. The key difference between our ANOVA and the tests is that, while the treats LIME score polarity as a categorical variable (positive versus negative scores), in our ANOVA we directly compute over the numerical values, ranging from -1 to 1.
In order to better understand the relationship between languages (i.e., Hindi versus English; Hindi versus Other; English versus Other), we also performed an additional post-hoc Tukey HSD Test to test which pairs of language ID have means that are significantly different from each other. Results for all samples are in Table 10. For all models, the means for Hindi and English tokens are meaningfully different from each other, and thus we can say that all models are able to distinguish between these two languages. For XLM-R, we cannot reject the null hypothesis that hin and other have independent distributions, and for IndicBERT, we cannot reject that eng and other have independent distributions. It is only for HingRoBERTa that we can reject the null hypothesis for all pairs of language ID. Thus, HingRoBERTa, having seen code-mixed data in the pre-training, is the only one that can meaningfully distinguish across eng, hin and other.
| Tukey HSD - All Samples | ||||||
| XLMR | ||||||
| group1 | group2 | meandiff | p-adj | lower | upper | reject |
| en | hin | -0.013 | 0 | -0.0157 | -0.0102 | True |
| en | other | -0.0156 | 0 | -0.0188 | -0.0124 | True |
| hin | other | -0.0026 | 0.0854 | -0.0055 | 0.0003 | False |
| -values: [1.218e-11, 1.218e-11, 8.538e-02] | ||||||
| IndicBERT | ||||||
| group1 | group2 | meandiff | p-adj | lower | upper | reject |
| en | hin | -0.0144 | 0 | -0.0169 | -0.0118 | True |
| en | other | -0.0027 | 0.095 | -0.0057 | 0.0003 | False |
| hin | other | 0.0117 | 0 | 0.009 | 0.0144 | True |
| -values: [1.22E-11, 9.50E-02, 1.22E-11] | ||||||
| HingRoBERTa | ||||||
| group1 | group2 | meandiff | p-adj | lower | upper | reject |
| en | hin | -0.0069 | 0 | -0.0096 | -0.0042 | True |
| en | other | -0.0126 | 0 | -0.0158 | -0.0095 | True |
| hin | other | -0.0057 | 0 | -0.0086 | -0.0029 | True |
| -values: [4.29E-09, 1.22E-11, 8.12E-06] | ||||||
C.2.2 Per Label
| ANOVA - Per Label | |||
|---|---|---|---|
| Model | Joy | Anger | Sadness |
| XLM-R | 2.09e-31 | 2.86e-10 | 1.25e-2 |
| IndicBERT | 1.53e-19 | 3.20e-7 | 5.57e-1 |
| HingRoBERTa | 3.74e-37 | 1.74e-9 | 2.14e-3 |
We also conduct ANOVA tests for one positive label (joy) and two negative labels anger, sadness, to see whether there is agreement with the results. Table 11 shows the -values for each model. Both ANOVA and find dependency between language and LIME score for the joy and anger labels. Moreover, for sadness, both ANOVA and also agree that there is a significant dependency of language and LIME score with HingRoBERTa, and for IndicBERT there is no dependency. Where they differ slightly is with XLM-R, where there is no dependency found with the ANOVA test, but with , the -value is slightly below the significance threshold.
A further fine-grained analysis of these conclusions is presented with Tukey HSD in Tables 12, 13 and 14. To summarise the results per label:
-
1.
Joy For both XLM-R and IndicBERT, hin and other have no meaningful difference, but do show significant distinction between hin and eng. HingRoBERTa, on the other hand, is able to distinguish between all language ID tags.
-
2.
Anger We see a significant difference between all language ID pairs and across all models for anger.
-
3.
Sadness No meaningful difference is observed between hin and eng for both XLM-R and HingRoBERTa, and for IndicBERT, there is no meaningful difference across any of the language ID pairs.
| Tukey HSD - Joy | ||||||
| XLMR | ||||||
| group1 | group2 | meandiff | p-adj | lower | upper | reject |
| en | hin | -0.0222 | 0 | -0.0281 | -0.0164 | True |
| en | other | -0.0284 | 0 | -0.0345 | -0.0223 | True |
| hin | other | -0.0062 | 0.0717 | -0.0127 | 0.0004 | False |
| -values: [0, 0, 0.718] | ||||||
| IndicBERT | ||||||
| group1 | group2 | meandiff | p-adj | lower | upper | reject |
| en | hin | -0.0218 | 0 | -0.0277 | -0.0158 | True |
| en | other | -0.0169 | 0 | -0.0229 | -0.011 | True |
| hin | other | 0.0048 | 0.2004 | -0.0018 | 0.0114 | False |
| -values: [0, 8.56E-11, 2.00E-01] | ||||||
| HingRoBERTa | ||||||
| group1 | group2 | meandiff | p-adj | lower | upper | reject |
| en | hin | -0.0198 | 0 | -0.0257 | -0.0139 | True |
| en | other | -0.0326 | 0 | -0.0387 | -0.0266 | True |
| hin | other | -0.0129 | 0 | -0.0194 | -0.0063 | True |
| -values: [8.54E-13, 8.42E-13, 1.15E-05] | ||||||
| Tukey HSD - Anger | ||||||
|---|---|---|---|---|---|---|
| XLMR | ||||||
| group1 | group2 | meandiff | p-adj | lower | upper | reject |
| en | hin | 0.0076 | 0.0411 | 0.0002 | 0.015 | True |
| en | other | -0.0103 | 0.0152 | -0.019 | -0.0016 | True |
| hin | other | -0.0179 | 0 | -0.0243 | -0.0115 | True |
| -values: [4.11E-02, 1.52E-02, 1.83E-10] | ||||||
| IndicBERT | ||||||
| group1 | group2 | meandiff | p-adj | lower | upper | reject |
| en | hin | -0.0129 | 0.0003 | -0.0207 | -0.0051 | True |
| en | other | -0.0216 | 0 | -0.0308 | -0.0124 | True |
| hin | other | -0.0087 | 0.0076 | -0.0155 | -0.0019 | True |
| -values: [3.23E-04, 1.37E-07, 1.37E-07] | ||||||
| HingRoBERTa | ||||||
| group1 | group2 | meandiff | p-adj | lower | upper | reject |
| en | hin | 0.008 | 0.0184 | 0.0011 | 0.0149 | True |
| en | other | -0.0092 | 0.0258 | -0.0175 | -0.0009 | True |
| hin | other | -0.0172 | 0 | -0.0236 | -0.0107 | True |
| -values: [1.84E-02, 2.58E-02, 1.50E-09] | ||||||
| Tukey HSD - Sadness | ||||||
|---|---|---|---|---|---|---|
| XLMR | ||||||
| group1 | group2 | meandiff | p-adj | lower | upper | reject |
| en | hin | -0.0003 | 0.9955 | -0.0092 | 0.0085 | False |
| en | other | -0.0117 | 0.0323 | -0.0227 | -0.0008 | True |
| hin | other | -0.0114 | 0.0139 | -0.0209 | -0.0019 | True |
| -values: [0.996, 0.032, 0.014] | ||||||
| IndicBERT | ||||||
| group1 | group2 | meandiff | p-adj | lower | upper | reject |
| en | hin | -0.004 | 0.5855 | -0.0135 | 0.0055 | False |
| en | other | -0.0008 | 0.9868 | -0.0131 | 0.0114 | False |
| hin | other | 0.0032 | 0.7648 | -0.0075 | 0.0139 | False |
| -values: [0.585, 0.987, 0.765] | ||||||
| HingRoBERTa | ||||||
| group1 | group2 | meandiff | p-adj | lower | upper | reject |
| en | hin | -0.0011 | 0.9558 | -0.0104 | 0.0081 | False |
| en | other | -0.0149 | 0.0067 | -0.0263 | -0.0034 | True |
| hin | other | -0.0137 | 0.003 | -0.0236 | -0.0039 | True |
| -values: [0.956, 0.007, 0.003] | ||||||