captionUnknown document class \WarningFilterlatexA float is stuck
Femtosecond trimer quench cycled at megahertz rates in the unconventional charge-density wave material 1T′-TaTe2
Abstract
Ultrafast optical switching of materials properties is of great relevance both for future technological applications as well as gaining fundamental physical insights to microscopic couplings and nonequilibrium phenomena. Transition-metal dichalcogenides (TMDCs) combine photo-sensitivity with strong correlations, furthering rich phase diagrams and enhanced tunability. Owing to its chemical composition, 1T′-TaTe2 exhibits an electronically and structurally unique set of charge-density waves (CDWs), featuring increased conductivity and a reduced prominence of amplitude modes. Compared to other charge-ordered TMDCs, only very few studies addressed the ultrafast response of this material to optical excitation. In particular, the question whether such unconventional properties translate to unusual quench dynamics remains largely unresolved. Here, we investigate the structural dynamics in 1T′-TaTe2 by means of ultrafast nanobeam electron diffraction. The experiments are carried out with a tailored sample design that allows for excitation at repetition rate, higher than any structural phase transformation probed thus far. Harnessing the enhanced resolution and sensitivity of this approach, we reveal a strongly directional cooperative atomic motion during the one-dimensional quench of the low-temperature trimer lattice. These dynamics are completed within less than , substantially faster than reported previously. In striking contrast, the periodic lattice distortion of the room-temperature phase is unusually robust against high-density electronic excitation. In conjunction with the known sensitivity of 1T′-TaTe2 to chemical doping, we thus expect the material to serve as a versatile platform for tunable structural control by optical stimuli.
I Introduction
Tailoring electronic properties by chemical doping is a central element of current semiconductor technology. Beyond established applications, transition metal dichalcogenides (TMDCs), strongly correlated materials in a chalcogen-metal-chalcogen trilayer structure [1], promise novel functionality [2], as comparably small modifications of the electronic state can evoke large effects via couplings to phononic, orbital or spin degrees of freedom [3, 4]. In these compounds, the quasi-two-dimensional characteristics in conjunction with strong electron-phonon interactions favour the occurrence of various correlated phases [5], including charge density waves (CDWs) coupled to a periodic lattice distortion (PLD) [6]. The corresponding low-energy band gap is highly susceptible to external stimuli [7, 8, 9, 10] or subtle alterations of the chemical composition [11, 12] and atomic configurations [13].
Alongside structural tunability, TMDCs have proven interesting targets for the functionalization of non-equilibrium photodoping [4, 14, 15] and in optoelectronics [16]. Probing the interplay of structural and electronic excitations [17, 18, 19, 20, 21, 22, 23, 24, 25, 26, 27, 28, 29, 30, 31, 32, 33, 34, 35, 36, 37, 38, 39, 40, 41, 42, 43, 44, 45, 46, 47, 48, 49, 50, 47, 51, 52, 53, 54, 55, 56, 57], ultrafast measurement schemes frequently uncover underlying fundamental processes. In the past, pulsed laser excitation has not only been used to drive transitions between different CDW phases [36, 37, 38, 39, 40, 41, 43, 44, 42, 45, 52, 53, 47, 48, 49, 50, 46, 51], but also to transiently induce [54] or enhance CDW order [55] as well as distinct types of disorder [44, 45, 52, 46], prompt dimensional crossovers [49, 50, 46], and to drive materials into thermodynamically inaccessible metastable states [56, 57, 58].
To date, the investigation of ultrafast CDW dynamics and phase transitions in TMDCs largely focused on sulphur- and selenium-based compounds [30, 31, 32, 33, 34, 35, 36, 37, 38, 39, 40, 41, 42, 43, 44, 45, 47, 48, 46, 49, 50, 47, 51]. In contrast, the CDW phases in TMD tellurides have only recently become the subject of ultrafast studies [59, 60, 61, 62, 63]. In these materials, an enhanced hybridization of the tellurium p- with the metal d-bands decisively alters the transition metal valence and thus the electronic texture [64, 65]. Among other features, this results in large PLD amplitudes in superstructures shared by 1T′-VTe2, 1T′-NbTe2 and 1T′-TaTe2, which are stable at room temperature and above [66, 67, 68].
This chemical perspective on CDW formation and the corresponding emergence of tightly-bound zigzag chains [64] particularly applies to 1T′-TaTe2 [69, 70, 68], the compound with the most pronounced structural distortions. In this material, the trimerization even persists up to highest temperatures, i.e., an undistorted phase is absent from the phase diagram. Upon cooling, a second transition brings about a unique phase [67, 71, 72, 73] that is in competition with other structural instabilities at surfaces and in few-layer systems [74, 75, 76]. Remarkably, the formation of the phase results in a decrease of the electrical resistivity [77], as opposed to related transitions in other TMDCs where the opening of the CDW band gap promotes the conventional insulating behavior [1, 78, 7, 43, 79, 80].
Its unique phase diagram and the associated unusual macroscopic properties call for further investigations of the CDW phases in 1T′-TaTe2. In equilibrium, the origin of the low-temperature butterfly-like structure has been linked to an anisotropic phononic softening [67, 68], driven by Fermi-surface nesting [81, 82]. Few ultrafast experiments studied non-equilibrium dynamics in this material, finding an only weak amplitude mode [61] and a considerably slower partial PLD suppression [60] compared to dynamics in other strongly-correlated materials [36, 37, 38, 39, 40, 41, 43, 44, 42, 45, 52, 53, 47, 48, 49, 50, 46, 51, 83, 62, 63, 84]. However, possible microscopic origins for a slower response remain to be explored, and a complete quench of the phase has yet to be observed. Moreover, also the sensitivity of the periodicities to photodoping both at low and at high temperatures is of considerable interest.
In this work, we address these open questions in an investigation of the laser-induced dynamics in 1T′-TaTe2 with high resolution and high sensitivity. Specifically, we elucidate the transformation from the to the phase by means of ultrafast nanobeam electron diffraction (nano-UED). Using an unprecedented repetition rate of , we find that the structural dynamics unfold more than ten times faster than previously reported. Furthermore, the timescale of the structural quench is a strong function of excitation fluence, with a transient suppression of the lattice distortion completed as fast as . Approaching the threshold excitation, the phase transition proceeds within , indicative of a softening of the corresponding structural mode. In contrast, we identify an atypical resilience of the high-temperature superstructure to the optical excitation, revealing the coexistence of seemingly similar types of structural order with completely different origins suspended within the same host material.
II Experiment
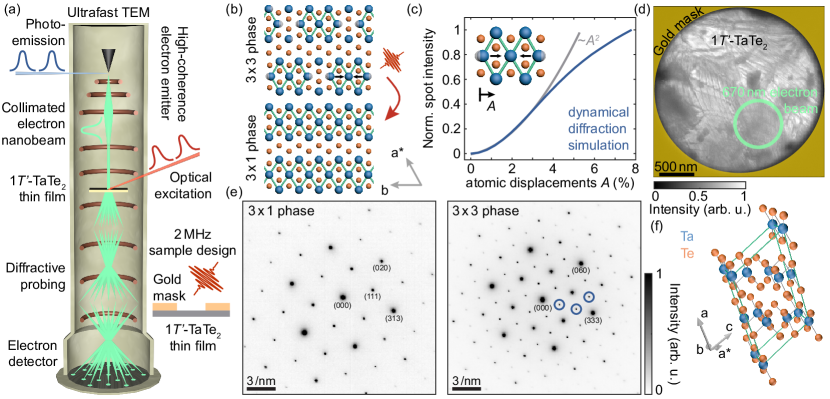
In the experiments, we excite a 1T′-TaTe2 thin-film in the low-temperature phase with ultrashort laser pulses ( wavelength, duration, between and fluence), and probe the subsequent dynamics with collimated ultrashort electron pulses ( energy, duration, beam diameter). To this end, the Göttingen Ultrafast Transmission Electron Microscope [UTEM, Fig. 1(a), see also Methods] is equipped with a tip-shaped emitter whose nanometric size results in an exceptionally high transverse beam coherence [85]. The small effective source size promotes picometer beam emittances [85] and high reciprocal-space resolution even for particularly narrow, collimated electron beams with nanometer diameters [46]. The instrument thus enables high-resolution ultrafast electron diffraction without spatial averaging over microscopic sample heterogeneity. Importantly, a tailored sample design [c.f. Fig. 1(d)] facilitates optimized thermal dissipation [48, 46], which in turn allows us to study the reversible dynamics at a repetition rate of , higher than in any previous measurement of a structural phase transition. In this way, our measurements drastically enhance the sensitivity to low-intensity features and eliminate common issues in the stroboscopic investigation of thin material films [86].
II.1 CDW phases in 1T′-TaTe2
The basic monoclinic structure of 1T′-TaTe2 is a commensurate distortion of the 1T symmetry commonly found in TMDCs. This room-temperature phase exhibits a tripling of the (hypothetical) undistorted unit cell along the lattice vector a* and a three-fold layer stacking sequence [Fig. 1(f)] [67, 73]. This formation of zigzag chains predominantly results in atomic displacements in a direction perpendicular to the lattice vector b [Fig. 1(b)] with an amplitude that amounts to up to of the average interatomic distance. Below a temperature of , a further distortion, mainly oriented along the b-direction, transforms the crystal into the phase [67, 71, 72]. Both phases, as well as the transition between them, primarily involve re-configurations of the tantalum sublattice [67] and band structure, suggesting an orbital-selective mechanism connected to the PLD formation [87].
II.2 Femtosecond structural melting
In a first measurement series, we characterise the structural dynamics upon laser excitation of the phase at different fluences. We set the electron beam to perpendicular incidence onto the material layers spanned by the vectors b and a*, probing reciprocal space in the [] zone axis [see Fig. 1(e) for the corresponding electron diffractograms of both phases]. In these images, diffraction spots with (where is an integer) correspond to the undistorted structure [hereafter referred to as main lattice spots, see Appendix B for a more detailed description of the reciprocal lattice]. In contrast, the distortion produces the weaker reflections in-between, analogously to the second-order CDW spots observed in the distorted phases of related 1T polytype TMDCs [1]. Dynamical diffraction simulations supply a quantitative relationship between measured intensities and the PLD amplitude, thus presenting a precise measure of the order parameter for the to transition [c.f. Fig. 1(c), and Appendix C].
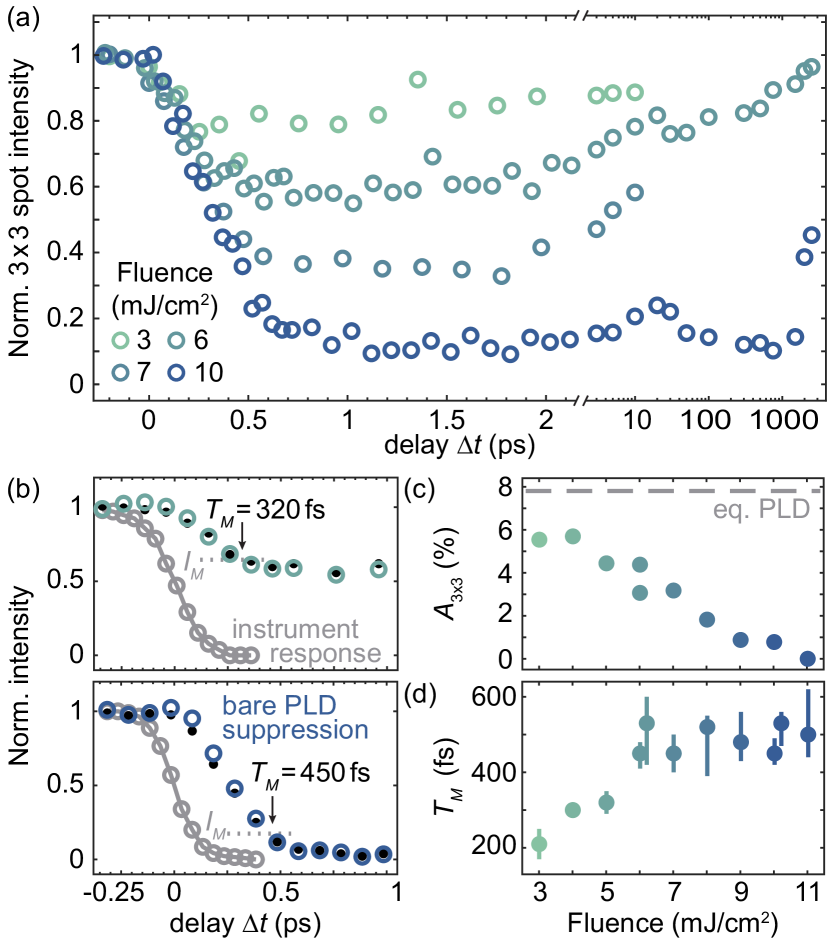
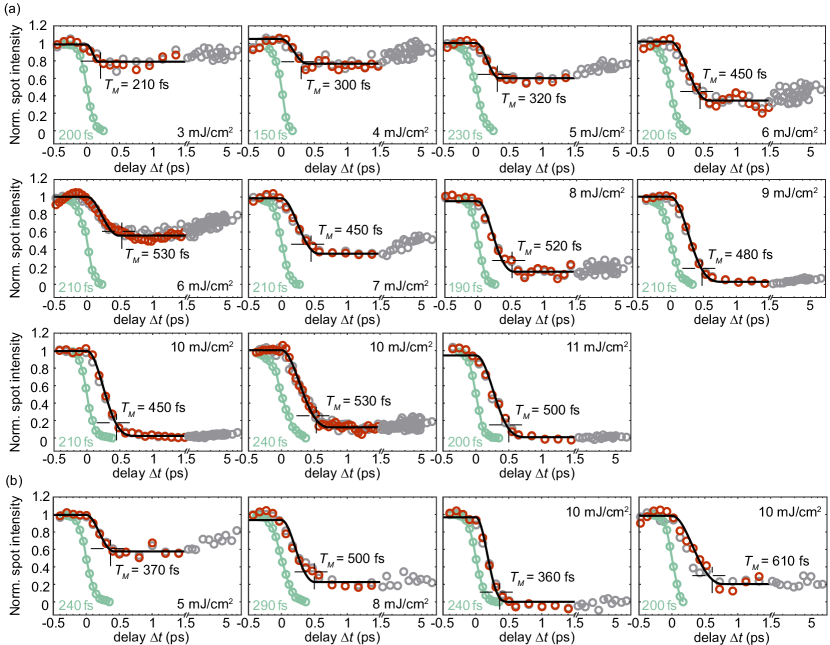
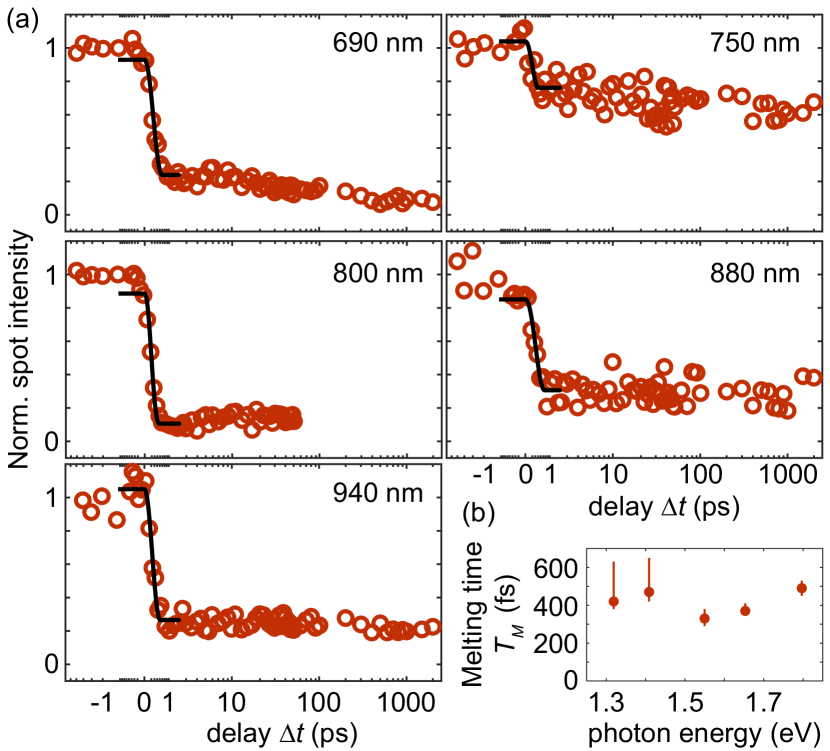
Tracking the intensities of the satellites at variable temporal delay between the laser pump and the electron probe pulses yields the curves shown in Fig. 2(a) [see also Appendix C and Fig. 5]. Therein, the observed temporal characteristics of the optically-induced structural dynamics spans four orders of magnitude. Following a rapid femtosecond suppression of the PLD amplitude, we observe a partial recovery after [Fig. 2(b)] for low and intermediate pump fluences. For fluences above , on the other hand, the intensities remain suppressed, evidencing the transition into the phase. From here, the initial state is re-established after only , leaving sufficient time for further relaxation and heat dissipation before the arrival of the subsequent pump pulse after . Overall, we find no significant dependence of the dynamics on the excitation wavelength in the visible spectral range [c.f. Fig. 6].
A critical parameter retrieved from such delay curves is the switching time of the structural transition as it is linked to the degrees of freedom involved in the phase formation, thereby elucidating microscopic origins of the symmetry-broken state also in thermal equilibrium [83]. Femtosecond features of the dynamics frequently approach the temporal resolution of ultrafast electron diffraction experiments given by the electron pulse length. Typically, both the exact temporal overlap as well as the pulse shape and duration are indirectly inferred from reference measurements on separate samples. Here, we provide a quantitative approach to the determination of the ultrafast instrument response function, which we believe will serve as highly valuable benchmark for future ultrafast imaging and diffraction studies. Specifically, harnessing the versatility of the UTEM, we spectroscopically determine the inelastic scattering of electrons by the pump-induced optical near-field at the sample surface [88, 89, 90] [see Appendix E and Fig. 8]. This instantaneous field-driven interaction not only allows us to determine time zero, but also yields a precise measure of the electron pulse shape. In particular, we record such reference measurements alongside every delay curve, showing consistent electron pulse durations of about . The corresponding instrument response functions can be used to exemplify how an instantaneous signal drop would be probed [grey curves in Fig. 2(b)]. Its clear temporal separation from the measured delay curves [black points in Fig. 2(b)] demonstrates that the laser-induced phase switch is quantitatively resolved. For completeness, measuring the precise electron pulse shape allows for a deconvolution of the recorded signal by the instrument response [colored circles], which, as expected, yields only a small correction.
Generally, the temporal suppression of the PLD amplitude evolves in a manner expected for a displacive excitation of the nuclei after a sudden quench of the electronic subsystem [91]. However, a fit of the corresponding cosinusoidal function slightly underestimates the changes to the PLD amplitude in the first few hundred femtoseconds of the dynamics, both for the measured as well as the deconvoluted delay curves [see Fig. 5]. This observation hints at either anharmonicities in the displacive potential or a (partial) contribution from an impulsive mechanism [92] during the initial stage of the dynamics. Consequently, we quantify the melting times directly in terms of the measured intensity evolution, evaluating the time delay for a relative suppression of with respect to the minimum value for each fluence. We find PLD quenching times as small as , more than ten times faster than previously reported ( decay time to intensity level in ref. [60]). These results underline the strongly-correlated nature of the phase, which, accordingly, can be rapidly quenched via an optically-induced electronic transition. Furthermore, the quench time increases upon approaching the phase transition threshold, reaching a plateau at for a complete phase switch [Fig. 2(d)]. Previously, a slowing-down of structural dynamics in CDW systems on sub-picosecond timescales was linked to a softening of the corresponding structural mode [84], and also identified in all-optical measurements of 1T′-TaTe2 [61]. Indeed, a comparatively flat potential landscape close to the critical point of the transition is expected to minimize the forces driving the required structural modifications, particularly for second-order and weakly first-order transitions [93]. Moreover, faster dynamics could result from spatial carrier dynamics within the depth of the surface-excited film, while above-threshold excitation was shown to switch the PLD completely also for a comparably thick 1T-TaS2 film [48]. Given the significant discrepancy between our findings and those of Ref. [60], some comments on a possible explanation are warranted. As a possible source of a delayed response in probing a mesoscopic sample, spatiotemporal carrier dynamics resulting from heterogeneous excitation, e.g. at edges, may be a contributing factor. In contrast, as our wavelength-dependent data indicate, differences in optical excitation are likely not responsible for these dissimilar timescales.
II.3 Phase transformation mechanism
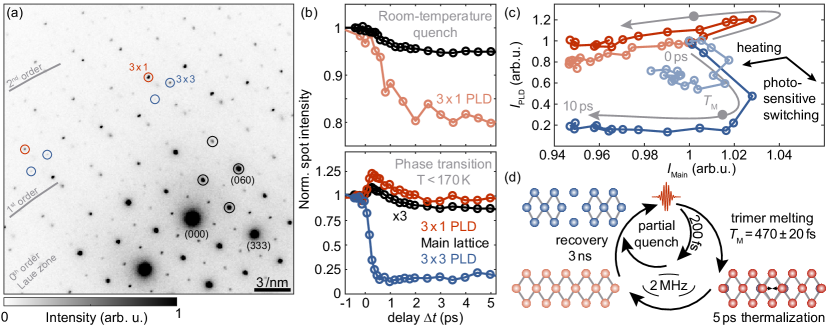
Beyond this precise temporal characterization of the phase transition, the stability of the high-temperature phase in thermal equilibrium naturally questions the photodoping sensitivity of the periodicity that is present in both the low- as well as the high-temperature structure. In a second measurement series, we therefore more closely investigate the microscopic processes during the dynamics, accessing the different Fourier components of the and the modifications individually. To this end, we change the relative angle of incidence between the electron beam and the sample surface by approximately , probing the more intense ’first-order’ superstructure spots. Specifically, these spots are situated in the first-order Laue zone (FOLZ) and at one third of the distance between neighbouring main lattice reflections, owing to the tripling of the unit cell both within as well as perpendicular to the individual material layers [Fig. 3(a)].
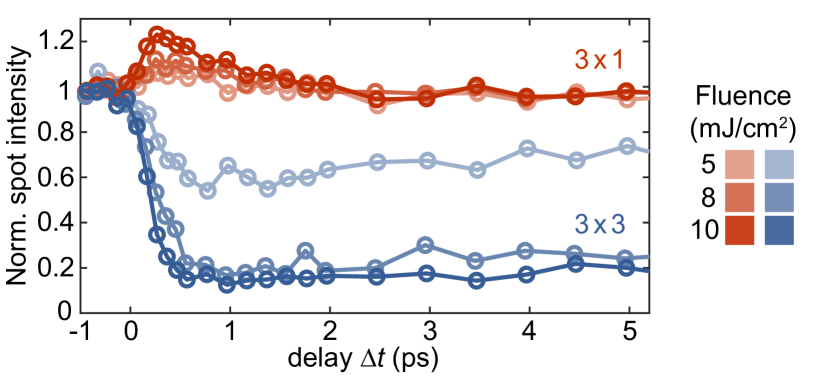
After laser excitation, the spots are suppressed within , similar to their second-order counterparts, followed by a few-picosecond recovery for intermediate pump fluences [cf. Fig. 3(b) and Fig. 7]. In contrast, the delay curves of the lattice periodicities [red curves in Fig. 3(b)] display the same timescales as for the low-temperature periodicities, but otherwise opposite behaviour. The early-stage dynamics are characterised by an intensity increase of up to for the highest pump fluence, followed by a slower, few-picosecond suppression. These fastest features, however, are only an indirect consequence of the melting, as we find a similar behaviour for the main lattice spots [black curves in Fig. 3(b)]. During the phase transformation, the relative weight of both of these periodicities in the Fourier representation of the crystal lattice is enhanced, such that diffracted intensity is re-distributed from the low- to the high-temperature reflections, leading to the observed intensity overshoot.
Based on these observations, we deduce that the phase transformation proceeds as illustrated in Fig. 3(d). The optical excitation induces a quench specifically of the trimerization oriented along the lattice vector b, i.e., of the type. The atomic displacements along the perpendicular direction, on the other hand, remain largely unaffected and persist even in the out-of-equilibrium state shortly after time zero. The presumed distinction between a soft and a stable crystal axis after every pump-probe cycle becomes apparent by comparing the PLD delay curves to those of the ”photoinert” main lattice symmetries [black curves in Fig. 3(b)]. A joint temporal evolution along a close-to-horizontal trajectory in the representation displayed in Fig. 3(c) signifies a phonon-induced peak suppression, indicative solely of an overall rise in lattice temperature, i.e., the Debye-Waller effect [23, 31]. Variations towards the lower-right corner of the diagram, on the other hand, is evidence of a strong photo-sensitivity and the associated trimer quench. Clearly, the high-temperature distortion can be assigned to the former case, while the low-temperature PLD is of the latter type. This remarkable difference has immediate consequences also for the non-equilibrium pathway between both phases. Specifically, we observe no sign of transient disorder during the phase transformation, while also the out-of-plane periodicity is unaffected by the optical excitation [cf. Fig. S4]. As a result, the phase switching unfolds completely reversibly also after a full suppression of the low-temperature order, resulting in a unidirectional transition between a three- and a two-dimensional superstructure, induced by the drive.
III Discussion
The unusually large PLD amplitudes of up to in the room-temperature phase and in the low-temperature phase of 1T′-TaTe2 suggest an almost molecular description of the crystal structure, possibly outside the typical description of CDW phases [64, 65, 69, 70, 68]. While the photosensitivity of the distortions is the same as found for the CDW phases of other TMDCs, the remarkable stability of the phase, both with respect to the excitation of the low-temperature PLD as well as the synonymous absence of the 1T polytype in thermal equilibrium, supports this picture. The difference between the two superperiodicities in this regard even extends to highly non-equilibrium scenarios, as apparent from a reference measurement where we directly excite the phase at room temperature. Instead of a femtosecond CDW quench corroborated by a transient intensity overshoot of the main lattice reflections, analogously to the phase transition at low temperatures, we again solely find a thermalisation of the entire lattice also for comparably high excitation densities of [Fig. 3(b) and (c)]. In other words, the PLD is unusually stable against photodoping throughout the entire phase diagram of the material, and not even a sudden increase of the electronic temperature to several thousand Kelvin as typically achieved by pulsed laser excitation [94] suffices to transiently suppress the order.
Our results underline that the two superstructures supported by the material originate from completely different driving forces, i.e., a perturbational and thus highly tunable distortion interwoven with a robust and only superficially related lattice trimerization. Thus, a femtosecond quench of the phase is either not achievable, or might require an orbital-selective excitation at different photon energies [87, 60]. This unique characteristic among the CDW phases in TMDCs opens up interesting perspectives on exploring the origins of CDW formation in a broader sense. In particular, the phase appears to be the structural analogue of the in the other group-V compounds in terms of PLD amplitude, temperature-dependence and photosensitivity [66, 95, 62, 63]. One may therefore speculate whether the additional distortion in 1T′-TaTe2 may serve as a platform to tune the optically-induced behaviour of the material by changing the orbital texture, partially substituting the tellurium atoms with selenium in 1T-TaSeTe. In thermal equilibrium, the phase was shown to occur for doping levels down to , followed by closely related but incommensurate distortions for lower tellurium contents [96].
IV Conclusion
Ultrafast pencil-beam electron diffraction enables a precise mapping of the laser-induced dynamics in 1T′-TaTe2 free from the influence of structural heterogeneity. Our results suggest a close correspondence between the driving mechanisms responsible for the CDW formation at low temperatures to other related CDW phases. At the same time, the characteristics of the high-temperature phase further exemplifies the unique position of the material within the family of TMDCs, warranting further investigations in the ultrafast time domain by, e.g., selectively exciting specific electronic transitions. Furthermore, the peculiar phase diagram render 1T′-TaTe2 a promising component in heterostructures combining different layered materials [97, 98]. The pronounced contrast enhancement and the possibility to further minimize the electron probe beam diameter offered by megahertz driving will extend the experimental possibilities to investigate non-equilibrium dynamics in such systems. Finally, we anticipate that the precise determination to the electron pulse shape in conjunction with the high temporal resolution of nano-UED will advance the quantitative characterization of ultrafast structural dynamics and the underlying fundamental processes for a wide range of materials and heterostructures.
Acknowledgements.
The authors thank L.C. da Camara Silva for technical support in the specimen preparation, and M. Sivis for technical support in focused ion beam milling. Furthermore, we gratefully acknowledge insightful discussions with S. Mathias, J.H. Gaida, F. Kurtz, M. Franz and I. Vinograd, as well as continued support from the Göttingen UTEM team. This work was funded by the Deutsche Forschungsgemeinschaft (DFG, German Research Foundation) in the Collaborative Research Centre “Atomic scale control of energy conversion” (217133147/SFB 1073, project A05) and via resources from the Gottfried Wilhelm Leibniz Prize (RO 3936/4-1).Appendix A Experimental details
A.1 Ultrafast Transmission Electron Microscopy
The Göttingen UTEM is based on a ‘JEOL JEM-2100F’, equipped with a ZrO/W Schottky emitter [85]. Access to the ultrafast time domain is enabled by operating the electron source below the threshold for continuous electron emission, gating the linear photoemission of femtosecond electron pulses with pulsed laser illumination incident on the emitter tip (‘Light Conversion CARBIDE’, pulse duration, wavelength after frequency doubling, repetition rate). For the optical excitation of the sample, a part of the laser output is fed into an optical parametric amplifier (‘Light Conversion ORPHEUS F’), and converted to a wavelength between and .
The data is recorded by varying the relative timing between the laser pump and the electron probe pulses in the sample plane, integrating over the average response of the sample to the optical stimulus for at every temporal delay following the stroboscopic principle. The resulting time-resolved diffractograms and the real-space images of the specimen were recorded with a direct electron detector (‘Direct Electron DE-16’), and processed by an electron counting algorithm, while static diffractograms were taken with a CCD camera (‘Gatan Orius’). For the pulse length measurements, we used a hybrid pixel detector based on the Timepix chip architecture (‘Amsterdam Scientific Instrument EMCheeta’), attached behind an electron spectrometer and energy filtering device (‘CEOS CEFID’).
A.2 Sample preparation
The specimen was prepared by Ultramicrotomy from a commercially available 1T′-TaTe2 single crystal (‘HQ graphene’). 1T′-TaTe2 thin-films with a nominal thickness of were transferred onto a silicon nitride membrane prepared for high-repetition rate driving by covering the backside of the sample carrier with an opaque gold film (thickness ) via sputtering. Electron-transparency within a field-of-view was ensured by placing the 1T′-TaTe2 thin-film atop a hole drilled by ion beam milling, resulting in the sample geometry displayed in Fig. 1.
Appendix B Indexing of diffraction patterns
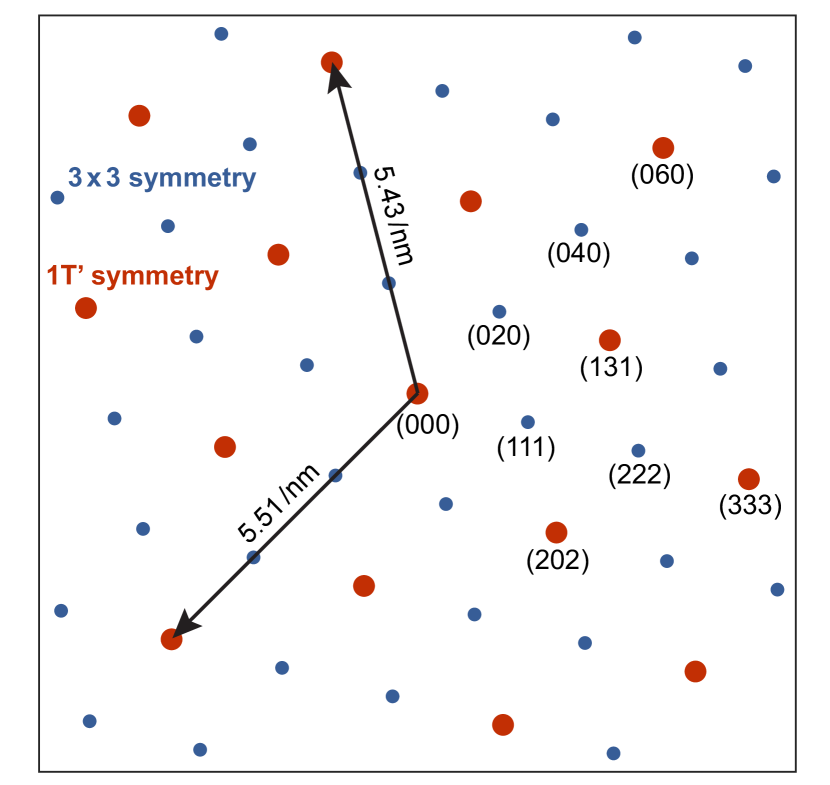
As described in the main text, the periodic lattice distortions in 1T′-TaTe2 are commensurate with the underlying, hypothetical 1T structure. As such, it is possible to describe the entire three-dimensional crystal in all phases with only three lattice vectors as a monoclinic crystal system, as opposed to the incommensurate phases found in other TMDC’s (where the PLD superlattice is usually accounted for by two additional lattice vectors). In our experiments, we record diffractograms under perpendicular incidence with respect to the individual material layers. In these images, the brightest reflections in a close to hexagonal arrangement are a signature of the reminiscent 1T polytype when illuminated in the [] zone axis. For the choice of a monoclinic unit cell, however, this setting corresponds to the [] zone axis, and the diffractograms require a different indexing of the depicted lattice planes, while considering systematic absences associated with the space group of 1T′-TaTe2, that is, (spacegroup 12, cell choice 1 in ref. [99]). Specifically, the [] zone axis generally only features those spots where , while, additionally, only reflections with , for , for , for , for , and for are symmetry-allowed (where is an integer). Fig. 4(a) shows the resulting positions of reciprocal lattice points in the zero-order Laue zone, as recorded in the experiments for the phase, and the corresponding indices . Reflections with describe the undistorted 1T periodicities, and, in this projection of the reciprocal lattice and distinct from the 1T polytype, the hexagons comprised out of spots with comparable distances to the direct beam are slightly distorted. Reflections in-between correspond to the superperiodicity, analogously to the second-order CDW spots in the CDW phases of, e.g., 1T-TaS2 and 1T-TaSe2 [1]. First-order reflections of both phases appear in the first-order Laue zone, i.e., either at larger wave vectors or upon tilting the sample. For the unit cell, their indexing fulfills in addition to for the and for the spots.
Appendix C Experimental delay curves and phase switching times
The intensity of the diffraction spots is a precise measure of the order parameter for the to transition, as it is intrinsically linked to the PLD amplitude. A precise determination of the relationship between the two quantities, however, must rely on dynamical diffraction simulations [100] [c.f. Fig. 1(c) in the main text, and ref. [46] for a more detailed description]. Considering the structural refinement described in ref. [67], and averaging over an equal distribution in both sample thickness (ranging from to ) and sample orientation ( total width around the specified zone axis), these simulations reproduce the expected quadratic behaviour for small PLD amplitudes [101], and deviations for larger distortions.
In our experiments, we evaluate the brightest spots situated in the ZOLZ at every temporal delay of the dynamics, while additionally considering the phononic background in the images. For the latter, we subtract the average inelastic scattering at late temporal delays and at a wave vector with a comparable magnitude from the individual delay curve of every reflection, before calculating the mean temporal response to the optical excitation by averaging over all individual delay curves. This procedure results in the complete suppression of intensity when pumping above the phase transition threshold. The corresponding average delay curves for every pump fluence and excitation wavelength are displayed in Fig. 5 (grey data points) and Fig. 6, respectively. We derive the bare temporal response [red data points in Fig. 5] of the PLD from a deconvolution of these curves with the instrument response function (green) measured directly before recording every individual delay scan (see also below in the corresponding section).
As described in the main text, the time constant associated with the dynamics of the to phase transformation could typically be extracted by assuming a displacive excitation mechanism [91], fitting to a squared cosinusoidal function where
| (1) |
Therein, with being the minimum reminiscent spot intensity after the PLD melting time .
We find that the fitting results [black curves in Fig. 5 and 6(a)] systematically underestimate the dynamics directly after time zero, such that, instead, we define based on the temporal delay where the average PLD spot intensity first falls below a value that corresponds to of the overall intensity drop at the respective fluence. The error bars displayed in Fig. 2(d) in the main text are derived by estimating the noise level in terms of the intensity fluctuations recorded before time zero, translating into the according uncertainty in determining the temporal delay associated with the criterion.
Appendix D Temporal evolution of first-order PLD diffraction spot intensities
Both superperiodicities feature a three-fold stacking sequence [67], such that first-order PLD spots require tilting the electron beam away from perpendicular incidence onto the individual material tri-layers. A representative electron diffractogram is depicted in Fig. 3(a) in the main text. The temporal response of these spots to the optical excitation is depicted in Fig. 7. The first-order spots (blue curves) are suppressed similarly to the second-order reflections, i.e., we observe a sub-picosecond suppression followed by a slower intensity recovery. In contrast, the periodicities display an initial intensity increase of up to more than during the melting of the low-temperature PLD, indicative of the redistribution of scattered intensity from the suppressed to the spots. The overshoot is followed by a slower, few-picosecond thermalization of the system and the corresponding intensity decay originating from the Debye-Waller effect [23, 31].
Appendix E Electron pulse duration and instrument response function
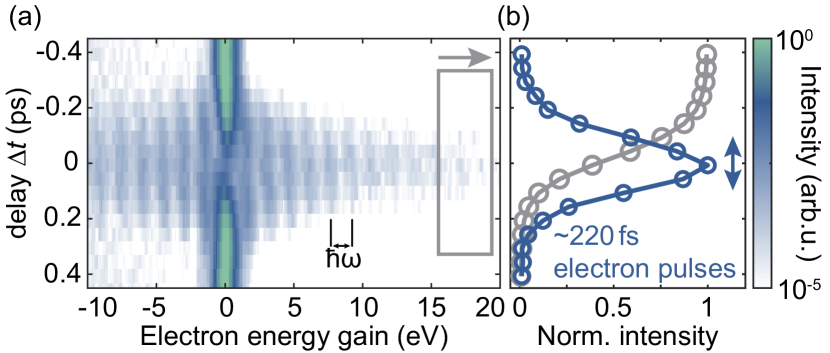
The electron pulse duration is obtained by measuring the instantaneous inelastic interaction of the electron pulses with the optical near-field at the surface of the specimen (Photon-induced near-field electron microscopy, PINEM [88, 89, 102, 90]). Therein, individual electrons either gain or lose energy in multiple integers of the photon energy, leading to characteristic sidebands in the electron spectra when they are in spatiotemporal overlap with the laser illumination [cf. Fig. 8(a)]. Scanning the temporal delay between the electron and the laser pulses in the sample plane, and summing up the intensity scattered into the outermost sideband at every temporal delay then gives a precise measure of the electron pulse duration [considering that the electron pulses are significantly longer than the laser pulses, Fig. 8(b)]. Similarly, the temporal instrument response function, i.e., how the experimental setup would resolve a step-like temporal materials response to the optical excitation, can be obtained by a cumulative summation of the electron energy gain side, synonymous to an integration of the electron pulse shape along the temporal axis. The resulting instrument response functions are displayed in Fig. 2(b) in the main text and in Fig. 5.
Appendix F Temporal evolution of the diffraction spot shape
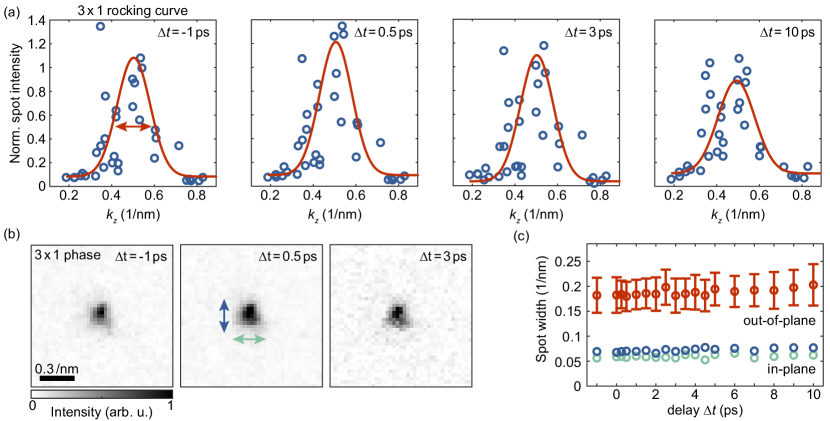
In the recorded diffractograms, the long-range coherence of the CDW is encoded in the temporal evolution of the shape of the individual CDW diffraction spots. As such, disorder along the in-plane direction would result in a broadening of the corresponding reflections. In our experiments, such a broadening is absent regardless of the laser pump fluence, indicating that the phase transformation does not involve the formation of topological defects [c.f. Fig. 9(b) and (c)]. Similarly, the out-of-plane coherence, i.e., the CDW stacking sequence, can be inferred from a reconstruction of the CDW rocking curve [Fig. 9(a)]. To this end, electron diffractograms recorded under tilted-beam conditions feature multiple Laue zones [c.f. Fig. 3(a)] that allow to densely sample the CDW diffraction spot shape at different out-of-plane momenta [46]. For the image series displayed in Fig. 9, we assume that the most intense spots in our images are situated in the first-order Laue zone at an out-of-plane momentum corresponding to the threefold CDW stacking sequence. The resulting rocking curves are shown in Fig. 9(a). Generally, the occurrence of possible disorder along the layer direction is more difficult to resolve than comparable in-plane processes due to the strong influence of dynamical scattering on diffracted intensities. Nevertheless, a dimensional crossover during the dynamics would result in a pronounced intensity increase that is distributed homogeneously along the out-of-plane momentum [46]. As such a dynamics is absent in our data, we conclude that the optical excitation does not induce transient disorder during the dynamics. Instead, the observed transient intensity overshoot and the subsequent suppression described in the main text maintains the three-dimensional shape of the diffraction spots throughout the entire dynamics.
References
- Wilson et al. [1975] J. A. Wilson, F. J. Di Salvo, and S. Mahajan, Charge-density waves and superlattices in the metallic layered transition metal dichalcogenides, Advances in Physics 24, 117 (1975).
- Jariwala et al. [2014] D. Jariwala, V. K. Sangwan, L. J. Lauhon, T. J. Marks, and M. C. Hersam, Emerging Device Applications for Semiconducting Two-Dimensional Transition Metal Dichalcogenides, ACS Nano 8, 1102 (2014), 24476095 .
- Tokura et al. [2017] Y. Tokura, M. Kawasaki, and N. Nagaosa, Emergent functions of quantum materials, Nature Physics 13, 1056 (2017).
- Basov et al. [2017] D. N. Basov, R. D. Averitt, and D. Hsieh, Towards properties on demand in quantum materials, Nature Materials 16, 1077 (2017).
- Li et al. [2021] W. Li, X. Qian, and J. Li, Phase transitions in 2D materials, Nature Reviews Materials 6, 829 (2021).
- Rossnagel [2011] K. Rossnagel, On the origin of charge-density waves in select layered transition-metal dichalcogenides, Journal of Physics: Condensed Matter 23, 213001 (2011).
- Yoshida et al. [2015] M. Yoshida, R. Suzuki, Y. Zhang, M. Nakano, and Y. Iwasa, Memristive phase switching in two-dimensional 1T-TaS2 crystals, Science Advances 1, e1500606 (2015).
- Ugeda et al. [2016] M. M. Ugeda, A. J. Bradley, Y. Zhang, S. Onishi, Y. Chen, W. Ruan, C. Ojeda-Aristizabal, H. Ryu, M. T. Edmonds, H.-Z. Tsai, A. Riss, S.-K. Mo, D. Lee, A. Zettl, Z. Hussain, Z.-X. Shen, and M. F. Crommie, Characterization of collective ground states in single-layer NbSe2, Nature Physics 12, 92 (2016).
- Schmitt et al. [2022] D. Schmitt, J. P. Bange, W. Bennecke, A. AlMutairi, G. Meneghini, K. Watanabe, T. Taniguchi, D. Steil, D. R. Luke, R. T. Weitz, S. Steil, G. S. M. Jansen, S. Brem, E. Malic, S. Hofmann, M. Reutzel, and S. Mathias, Formation of moiré interlayer excitons in space and time, Nature 608, 499 (2022).
- Jarc et al. [2023] G. Jarc, S. Y. Mathengattil, A. Montanaro, F. Giusti, E. M. Rigoni, R. Sergo, F. Fassioli, S. Winnerl, S. Dal Zilio, D. Mihailovic, P. Prelovšek, M. Eckstein, and D. Fausti, Cavity-mediated thermal control of metal-to-insulator transition in 1T-TaS2, Nature 622, 487 (2023).
- Ang et al. [2013] R. Ang, Y. Miyata, E. Ieki, K. Nakayama, T. Sato, Y. Liu, W. J. Lu, Y. P. Sun, and T. Takahashi, Superconductivity and bandwidth-controlled Mott metal-insulator transition in 1T-TaS2-xSex, Physical Review B 88, 115145 (2013).
- Luo et al. [2016] H. Luo, W. Xie, J. Tao, I. Pletikosic, T. Valla, G. S. Sahasrabudhe, G. Osterhoudt, E. Sutton, K. S. Burch, E. M. Seibel, J. W. Krizan, Y. Zhu, and R. J. Cava, Differences in Chemical Doping Matter: Superconductivity in Ti1– xTaxSe2 but Not in Ti1–xNbxSe2, Chemistry of Materials 28, 1927 (2016).
- Sung et al. [2023] S. H. Sung, N. Agarwal, I. E. Baggari, Y. M. Goh, P. Kezer, N. Schnitzer, Y. Liu, W. Lu, Y. Sun, L. F. Kourkoutis, J. T. Heron, K. Sun, and R. Hovden, Endotaxial Stabilization of 2D Charge Density Waves with Long-range Order (2023), arxiv:2307.04587 [cond-mat] .
- de la Torre et al. [2021] A. de la Torre, D. M. Kennes, M. Claassen, S. Gerber, J. W. McIver, and M. A. Sentef, Colloquium: Nonthermal pathways to ultrafast control in quantum materials, Reviews of Modern Physics 93, 041002 (2021).
- Bao et al. [2022] C. Bao, P. Tang, D. Sun, and S. Zhou, Light-induced emergent phenomena in 2D materials and topological materials, Nature Reviews Physics 4, 33 (2022).
- Mak and Shan [2016] K. F. Mak and J. Shan, Photonics and optoelectronics of 2D semiconductor transition metal dichalcogenides, Nature Photonics 10, 216 (2016).
- Siders et al. [1999] C. W. Siders, A. Cavalleri, K. Sokolowski-Tinten, Cs. Tóth, T. Guo, M. Kammler, M. H. von Hoegen, K. R. Wilson, D. von der Linde, and C. P. J. Barty, Detection of Nonthermal Melting by Ultrafast X-ray Diffraction, Science 286, 1340 (1999).
- Lindenberg et al. [2000] A. M. Lindenberg, I. Kang, S. L. Johnson, T. Missalla, P. A. Heimann, Z. Chang, J. Larsson, P. H. Bucksbaum, H. C. Kapteyn, H. A. Padmore, R. W. Lee, J. S. Wark, and R. W. Falcone, Time-Resolved X-Ray Diffraction from Coherent Phonons during a Laser-Induced Phase Transition, Physical Review Letters 84, 111 (2000).
- Sokolowski-Tinten et al. [2003] K. Sokolowski-Tinten, C. Blome, J. Blums, A. Cavalleri, C. Dietrich, A. Tarasevitch, I. Uschmann, E. Förster, M. Kammler, M. Horn-von-Hoegen, and D. von der Linde, Femtosecond X-ray measurement of coherent lattice vibrations near the Lindemann stability limit, Nature 422, 287 (2003).
- Siwick et al. [2003] B. J. Siwick, J. R. Dwyer, R. E. Jordan, and R. J. D. Miller, An Atomic-Level View of Melting Using Femtosecond Electron Diffraction, Science 302, 1382 (2003).
- Beaud et al. [2014] P. Beaud, A. Caviezel, S. O. Mariager, L. Rettig, G. Ingold, C. Dornes, S.-W. Huang, J. A. Johnson, M. Radovic, T. Huber, T. Kubacka, A. Ferrer, H. T. Lemke, M. Chollet, D. Zhu, J. M. Glownia, M. Sikorski, A. Robert, H. Wadati, M. Nakamura, M. Kawasaki, Y. Tokura, S. L. Johnson, and U. Staub, A time-dependent order parameter for ultrafast photoinduced phase transitions, Nature Materials 13, 923 (2014).
- Gerber et al. [2017] S. Gerber, S.-L. Yang, D. Zhu, H. Soifer, J. A. Sobota, S. Rebec, J. J. Lee, T. Jia, B. Moritz, C. Jia, A. Gauthier, Y. Li, D. Leuenberger, Y. Zhang, L. Chaix, W. Li, H. Jang, J.-S. Lee, M. Yi, G. L. Dakovski, S. Song, J. M. Glownia, S. Nelson, K. W. Kim, Y.-D. Chuang, Z. Hussain, R. G. Moore, T. P. Devereaux, W.-S. Lee, P. S. Kirchmann, and Z.-X. Shen, Femtosecond electron-phonon lock-in by photoemission and x-ray free-electron laser, Science 357, 71 (2017).
- Waldecker et al. [2017] L. Waldecker, R. Bertoni, H. Hübener, T. Brumme, T. Vasileiadis, D. Zahn, A. Rubio, and R. Ernstorfer, Momentum-resolved view of electron-phonon coupling in multilayer WSe2, Physical Review Letters 119, 036803 (2017).
- Wall et al. [2018] S. Wall, S. Yang, L. Vidas, M. Chollet, J. M. Glownia, M. Kozina, T. Katayama, T. Henighan, M. Jiang, T. A. Miller, D. A. Reis, L. A. Boatner, O. Delaire, and M. Trigo, Ultrafast disordering of vanadium dimers in photoexcited VO2, Science 362, 572 (2018).
- Sie et al. [2019] E. J. Sie, C. M. Nyby, C. D. Pemmaraju, S. J. Park, X. Shen, J. Yang, M. C. Hoffmann, B. K. Ofori-Okai, R. Li, A. H. Reid, S. Weathersby, E. Mannebach, N. Finney, D. Rhodes, D. Chenet, A. Antony, L. Balicas, J. Hone, T. P. Devereaux, T. F. Heinz, X. Wang, and A. M. Lindenberg, An ultrafast symmetry switch in a Weyl semimetal, Nature 565, 61 (2019).
- Tauchert et al. [2022] S. R. Tauchert, M. Volkov, D. Ehberger, D. Kazenwadel, M. Evers, H. Lange, A. Donges, A. Book, W. Kreuzpaintner, U. Nowak, and P. Baum, Polarized phonons carry angular momentum in ultrafast demagnetization, Nature 602, 73 (2022).
- Filippetto et al. [2022] D. Filippetto, P. Musumeci, R. K. Li, B. J. Siwick, M. R. Otto, M. Centurion, and J. P. F. Nunes, Ultrafast electron diffraction: Visualizing dynamic states of matter, Reviews of Modern Physics 94, 045004 (2022).
- Buzzi et al. [2018] M. Buzzi, M. Först, R. Mankowsky, and A. Cavalleri, Probing dynamics in quantum materials with femtosecond X-rays, Nature Reviews Materials 3, 299 (2018).
- Alcorn et al. [2023] F. M. Alcorn, P. K. Jain, and R. M. van der Veen, Time-resolved transmission electron microscopy for nanoscale chemical dynamics, Nature Reviews Chemistry , 1 (2023).
- Storeck et al. [2020] G. Storeck, J. G. Horstmann, T. Diekmann, S. Vogelgesang, G. von Witte, S. V. Yalunin, K. Rossnagel, and C. Ropers, Structural dynamics of incommensurate charge-density waves tracked by ultrafast low-energy electron diffraction, Structural Dynamics 7, 034304 (2020).
- Otto et al. [2021] M. R. Otto, J.-H. Pöhls, L. P. René de Cotret, M. J. Stern, M. Sutton, and B. J. Siwick, Mechanisms of electron-phonon coupling unraveled in momentum and time: The case of soft phonons in TiSe2, Science Advances 7, eabf2810 (2021).
- Cremons et al. [2017] D. R. Cremons, D. A. Plemmons, and D. J. Flannigan, Defect-mediated phonon dynamics in TaS2 and WSe2, Structural Dynamics 4, 044019 (2017).
- Mann et al. [2016] A. Mann, E. Baldini, A. Odeh, A. Magrez, H. Berger, and F. Carbone, Probing the coupling between a doublon excitation and the charge-density wave in TaS2 by ultrafast optical spectroscopy, Physical Review B 94, 115122 (2016).
- Perfetti et al. [2008] L. Perfetti, P. A. Loukakos, M. Lisowski, U. Bovensiepen, M. Wolf, H. Berger, S. Biermann, and A. Georges, Femtosecond dynamics of electronic states in the Mott insulator 1T-TaS2 by time resolved photoelectron spectroscopy, New Journal of Physics 10, 053019 (2008).
- Rohwer et al. [2011] T. Rohwer, S. Hellmann, M. Wiesenmayer, C. Sohrt, A. Stange, B. Slomski, A. Carr, Y. Liu, L. M. Avila, M. Kalläne, S. Mathias, L. Kipp, K. Rossnagel, and M. Bauer, Collapse of long-range charge order tracked by time-resolved photoemission at high momenta, Nature 471, 490 (2011).
- Eichberger et al. [2010] M. Eichberger, H. Schäfer, M. Krumova, M. Beyer, J. Demsar, H. Berger, G. Moriena, G. Sciaini, and R. J. D. Miller, Snapshots of cooperative atomic motions in the optical suppression of charge density waves, Nature 468, 799 (2010).
- Erasmus et al. [2012] N. Erasmus, M. Eichberger, K. Haupt, I. Boshoff, G. Kassier, R. Birmurske, H. Berger, J. Demsar, and H. Schwoerer, Ultrafast Dynamics of Charge Density Waves in 4Hb - TaSe2 Probed by Femtosecond Electron Diffraction, Physical Review Letters 109, 167402 (2012).
- Sohrt et al. [2014] C. Sohrt, A. Stange, M. Bauer, and K. Rossnagel, How fast can a Peierls-Mott insulator be melted?, Faraday Discussions 171, 243 (2014).
- Han et al. [2015] T.-R. T. Han, F. Zhou, C. D. Malliakas, P. M. Duxbury, S. D. Mahanti, M. G. Kanatzidis, and C.-Y. Ruan, Exploration of metastability and hidden phases in correlated electron crystals visualized by femtosecond optical doping and electron crystallography, Science Advances 1, e1400173 (2015).
- Haupt et al. [2016] K. Haupt, M. Eichberger, N. Erasmus, A. Rohwer, J. Demsar, K. Rossnagel, and H. Schwoerer, Ultrafast Metamorphosis of a Complex Charge-Density Wave, Physical Review Letters 116, 016402 (2016).
- Le Guyader et al. [2017] L. Le Guyader, T. Chase, A. H. Reid, R. K. Li, D. Svetin, X. Shen, T. Vecchione, X. J. Wang, D. Mihailovic, and H. A. Dürr, Stacking order dynamics in the quasi-two-dimensional dichalcogenide 1T-TaS2 probed with MeV ultrafast electron diffraction, Structural Dynamics 4, 044020 (2017).
- Zong et al. [2018] A. Zong, X. Shen, A. Kogar, L. Ye, C. Marks, D. Chowdhury, T. Rohwer, B. Freelon, S. Weathersby, R. Li, J. Yang, J. Checkelsky, X. Wang, and N. Gedik, Ultrafast manipulation of mirror domain walls in a charge density wave, Science Advances 4, eaau5501 (2018).
- Sun et al. [2018] K. Sun, S. Sun, C. Zhu, H. Tian, H. Yang, and J. Li, Hidden CDW states and insulator-to-metal transition after a pulsed femtosecond laser excitation in layered chalcogenide 1T-TaS2-xSex, Science Advances 4, eaas9660 (2018).
- Laulhé et al. [2017] C. Laulhé, T. Huber, G. Lantz, A. Ferrer, S. O. Mariager, S. Grübel, J. Rittmann, J. A. Johnson, V. Esposito, A. Lübcke, L. Huber, M. Kubli, M. Savoini, V. L. R. Jacques, L. Cario, B. Corraze, E. Janod, G. Ingold, P. Beaud, S. L. Johnson, and S. Ravy, Ultrafast Formation of a Charge Density Wave State in 1T-TaS2: Observation at Nanometer Scales Using Time-Resolved X-Ray Diffraction, Physical Review Letters 118, 247401 (2017).
- Vogelgesang et al. [2018] S. Vogelgesang, G. Storeck, J. G. Horstmann, T. Diekmann, M. Sivis, S. Schramm, K. Rossnagel, S. Schäfer, and C. Ropers, Phase ordering of charge density waves traced by ultrafast low-energy electron diffraction, Nature Physics 14, 184 (2018).
- Domröse et al. [2023] T. Domröse, T. Danz, S. F. Schaible, K. Rossnagel, S. V. Yalunin, and C. Ropers, Light-induced hexatic state in a layered quantum material, Nature Materials 22, 1345 (2023).
- Ji et al. [2020] S. Ji, O. Grånäs, K. Rossnagel, and J. Weissenrieder, Transient three-dimensional structural dynamics in 1T-TaSe2, Physical Review B 101, 094303 (2020).
- Danz et al. [2021] T. Danz, T. Domröse, and C. Ropers, Ultrafast nanoimaging of the order parameter in a structural phase transition, Science 371, 371 (2021).
- Chen et al. [2016] P. Chen, Y.-H. Chan, X.-Y. Fang, S.-K. Mo, Z. Hussain, A.-V. Fedorov, M. Y. Chou, and T.-C. Chiang, Hidden Order and Dimensional Crossover of the Charge Density Waves in TiSe2, Scientific Reports 6, 37910 (2016).
- Cheng et al. [2022] Y. Cheng, A. Zong, J. Li, W. Xia, S. Duan, W. Zhao, Y. Li, F. Qi, J. Wu, L. Zhao, P. Zhu, X. Zou, T. Jiang, Y. Guo, L. Yang, D. Qian, W. Zhang, A. Kogar, M. W. Zuerch, D. Xiang, and J. Zhang, Light-induced dimension crossover dictated by excitonic correlations, Nature Communications 13, 963 (2022).
- Zhang et al. [2022a] Y. Zhang, X. Shi, M. Guan, W. You, Y. Zhong, T. R. Kafle, Y. Huang, H. Ding, M. Bauer, K. Rossnagel, S. Meng, H. C. Kapteyn, and M. M. Murnane, Creation of a novel inverted charge density wave state, Structural Dynamics 9, 014501 (2022a).
- Zong et al. [2019a] A. Zong, A. Kogar, Y.-Q. Bie, T. Rohwer, C. Lee, E. Baldini, E. Ergeçen, M. B. Yilmaz, B. Freelon, E. J. Sie, H. Zhou, J. Straquadine, P. Walmsley, P. E. Dolgirev, A. V. Rozhkov, I. R. Fisher, P. Jarillo-Herrero, B. V. Fine, and N. Gedik, Evidence for topological defects in a photoinduced phase transition, Nature Physics 15, 27 (2019a).
- Horstmann et al. [2020] J. G. Horstmann, H. Böckmann, B. Wit, F. Kurtz, G. Storeck, and C. Ropers, Coherent control of a surface structural phase transition, Nature 583, 232 (2020).
- Kogar et al. [2020] A. Kogar, A. Zong, P. E. Dolgirev, X. Shen, J. Straquadine, Y.-Q. Bie, X. Wang, T. Rohwer, I.-C. Tung, Y. Yang, R. Li, J. Yang, S. Weathersby, S. Park, M. E. Kozina, E. J. Sie, H. Wen, P. Jarillo-Herrero, I. R. Fisher, X. Wang, and N. Gedik, Light-induced charge density wave in LaTe3, Nature Physics 16, 159 (2020).
- Singer et al. [2016] A. Singer, S. K. K. Patel, R. Kukreja, V. Uhlíř, J. Wingert, S. Festersen, D. Zhu, J. M. Glownia, H. T. Lemke, S. Nelson, M. Kozina, K. Rossnagel, M. Bauer, B. M. Murphy, O. M. Magnussen, E. E. Fullerton, and O. G. Shpyrko, Photoinduced Enhancement of the Charge Density Wave Amplitude, Physical Review Letters 117, 056401 (2016).
- Stojchevska et al. [2014] L. Stojchevska, I. Vaskivskyi, T. Mertelj, P. Kusar, D. Svetin, S. Brazovskii, and D. Mihailovic, Ultrafast Switching to a Stable Hidden Quantum State in an Electronic Crystal, Science 344, 177 (2014).
- Gerasimenko et al. [2019] Y. A. Gerasimenko, I. Vaskivskyi, M. Litskevich, J. Ravnik, J. Vodeb, M. Diego, V. Kabanov, and D. Mihailovic, Quantum jamming transition to a correlated electron glass in 1T-TaS2, Nature Materials 18, 1078 (2019).
- Maklar et al. [2023] J. Maklar, J. Sarkar, S. Dong, Y. A. Gerasimenko, T. Pincelli, S. Beaulieu, P. S. Kirchmann, J. A. Sobota, S. Yang, D. Leuenberger, R. G. Moore, Z.-X. Shen, M. Wolf, D. Mihailovic, R. Ernstorfer, and L. Rettig, Coherent light control of a metastable hidden state, Science Advances 9, eadi4661 (2023).
- Nakamura et al. [2020] A. Nakamura, T. Shimojima, Y. Chiashi, M. Kamitani, H. Sakai, S. Ishiwata, H. Li, and K. Ishizaka, Nanoscale Imaging of Unusual Photoacoustic Waves in Thin Flake VTe2, Nano Letters 20, 4932 (2020).
- Siddiqui et al. [2021] K. M. Siddiqui, D. B. Durham, F. Cropp, C. Ophus, S. Rajpurohit, Y. Zhu, J. D. Carlström, C. Stavrakas, Z. Mao, A. Raja, P. Musumeci, L. Z. Tan, A. M. Minor, D. Filippetto, and R. A. Kaindl, Ultrafast optical melting of trimer superstructure in layered 1T’-TaTe2, Communications Physics 4, 1 (2021).
- Hu et al. [2022] T. C. Hu, Q. Wu, Z. X. Wang, L. Y. Shi, Q. M. Liu, L. Yue, S. J. Zhang, R. S. Li, X. Y. Zhou, S. X. Xu, D. Wu, T. Dong, and N. L. Wang, Optical spectroscopy and ultrafast pump-probe study of the structural phase transition in 1T’-TaTe2, Physical Review B 105, 075113 (2022).
- Tuniz et al. [2023] M. Tuniz, D. Soranzio, D. Bidoggia, D. Puntel, W. Bronsch, S. L. Johnson, M. Peressi, F. Parmigiani, and F. Cilento, Ultrafast all-optical manipulation of the charge-density-wave in VTe2 (2023), arxiv:2305.03528 [cond-mat] .
- Suzuki et al. [2023] T. Suzuki, Y. Kubota, N. Mitsuishi, S. Akatsuka, J. Koga, M. Sakano, S. Masubuchi, Y. Tanaka, T. Togashi, H. Ohsumi, K. Tamasaku, M. Yabashi, H. Takahashi, S. Ishiwata, T. Machida, I. Matsuda, K. Ishizaka, and K. Okazaki, Ultrafast control of the crystal structure in a topological charge-density-wave material, Physical Review B 108, 184305 (2023).
- Canadell et al. [1992] E. Canadell, S. Jobic, R. Brec, J. Rouxel, and M.-H. Whangbo, Importance of short interlayer TeTe contacts for the structural distortions and physical properties of CdI2-type layered transition-metal ditellurides, Journal of Solid State Chemistry 99, 189 (1992).
- Sharma et al. [2002] S. Sharma, L. Nordström, and B. Johansson, Stabilization of charge-density waves in 1T-TaX2 (X=S,Se,Te): First-principles total energy calculations, Physical Review B 66, 195101 (2002).
- Bronsema et al. [1984] K. D. Bronsema, G. W. Bus, and G. A. Wiegers, The crystal structure of vanadium ditelluride, V1+xTe2, Journal of Solid State Chemistry 53, 415 (1984).
- Sörgel et al. [2006] T. Sörgel, J. Nuss, U. Wedig, R. K. Kremer, and M. Jansen, A new low temperature modification of TaTe2—Comparison to the room temperature and the hypothetical 1T-TaTe2 modification, Materials Research Bulletin Special Issue Dedicated to Prof. Gerard Ferey, 41, 987 (2006).
- Katayama et al. [2023] N. Katayama, Y. Matsuda, K. Kojima, T. Hara, S. Kitou, N. Mitsuishi, H. Takahashi, S. Ishiwata, K. Ishizaka, and H. Sawa, Observation of local atomic displacements intrinsic to the double zigzag chain structure of 1T-MTe2 ( M = V , Nb , Ta ), Physical Review B 107, 245113 (2023).
- Gao et al. [2018] J. J. Gao, J. G. Si, X. Luo, J. Yan, F. C. Chen, G. T. Lin, L. Hu, R. R. Zhang, P. Tong, W. H. Song, X. B. Zhu, W. J. Lu, and Y. P. Sun, Origin of the structural phase transition in single-crystal TaTe2, Physical Review B 98, 224104 (2018).
- Petkov et al. [2020] V. Petkov, K. Chapagain, J. Yang, S. Shastri, and Y. Ren, Exotic bonding interactions and coexistence of chemically distinct periodic lattice distortions in the charge density wave compound TaTe2, Physical Review B 102, 024111 (2020).
- Feng et al. [2016] J. Feng, A. Tan, S. Wagner, J. Liu, Z. Mao, X. Ke, and P. Zhang, Charge modulation and structural transformation in TaTe2 studied by scanning tunneling microscopy/spectroscopy, Applied Physics Letters 109, 021901 (2016).
- Chen et al. [2018] C. Chen, H.-S. Kim, A. S. Admasu, S.-W. Cheong, K. Haule, D. Vanderbilt, and W. Wu, Trimer bonding states on the surface of the transition-metal dichalcogenide 1T’-TaTe2, Physical Review B 98, 195423 (2018).
- El Baggari et al. [2020] I. El Baggari, N. Sivadas, G. M. Stiehl, J. Waelder, D. C. Ralph, C. J. Fennie, and L. F. Kourkoutis, Direct Visualization of Trimerized States in 1T’-TaTe2, Physical Review Letters 125, 165302 (2020).
- Kar et al. [2021] I. Kar, K. Dolui, L. Harnagea, Y. Kushnirenko, G. Shipunov, N. C. Plumb, M. Shi, B. Büchner, and S. Thirupathaiah, Experimental Evidence of a Stable 2H Phase on the Surface of Layered 1T’-TaTe2, The Journal of Physical Chemistry C 125, 1150 (2021).
- Hwang et al. [2022] J. Hwang, Y. Jin, C. Zhang, T. Zhu, K. Kim, Y. Zhong, J.-E. Lee, Z. Shen, Y. Chen, W. Ruan, H. Ryu, C. Hwang, J. Lee, M. F. Crommie, S.-K. Mo, and Z.-X. Shen, A Novel Superstructure in Epitaxially Grown 1T-TaTe2, Advanced Materials 34, 2204579 (2022).
- Di Bernardo et al. [2023] I. Di Bernardo, J. Ripoll-Sau, J. A. Silva-Guillén, F. Calleja, C. G. Ayani, R. Miranda, E. Canadell, M. Garnica, and A. L. Vázquez de Parga, Metastable Polymorphic Phases in Monolayer TaTe2, Small , 2300262 (2023).
- Chen et al. [2017] H. Chen, Z. Li, L. Guo, and X. Chen, Anisotropic magneto-transport and magnetic properties of low-temperature phase of TaTe2, Europhysics Letters 117, 27009 (2017).
- Mulazzi et al. [2010] M. Mulazzi, A. Chainani, N. Katayama, R. Eguchi, M. Matsunami, H. Ohashi, Y. Senba, M. Nohara, M. Uchida, H. Takagi, and S. Shin, Absence of nesting in the charge-density-wave system 1 T-VS2 as seen by photoelectron spectroscopy, Physical Review B 82, 075130 (2010).
- Sun et al. [2020] Y. Sun, T. Dai, Z. He, W. Zhou, P. Hu, S. Li, and S. Wu, Memristive phase switching in two-dimensional 1T-VSe2 crystals, Applied Physics Letters 116, 033101 (2020).
- Meng et al. [2020] F. B. Meng, Z. Liu, L. X. Yang, M. Z. Shi, B. H. Ge, H. Zhang, J. J. Ying, Z. F. Wang, Z. Y. Wang, T. Wu, and X. H. Chen, Metal-insulator transition in organic ion intercalated VSe2 induced by dimensional crossover, Physical Review B 102, 165410 (2020).
- Luo et al. [2021] Y.-C. Luo, Y.-Y. Lv, R.-M. Zhang, L. Xu, Z.-A. Zhu, S.-H. Yao, J. Zhou, X.-X. Xi, Y. B. Chen, and Y.-F. Chen, Subtle effect of doping on the charge density wave in TaTe2 - ( = 0.028 – 0.123 ) crystals revealed by anisotropic transport measurements and Raman spectroscopy, Physical Review B 103, 064103 (2021).
- Lin et al. [2022] Y. Lin, M. Huber, S. Rajpurohit, Y. Zhu, K. M. Siddiqui, D. H. Eilbott, L. Moreschini, P. Ai, J. D. Denlinger, Z. Mao, L. Z. Tan, and A. Lanzara, Evidence of nested quasi-one-dimensional Fermi surface and decoupled charge-lattice orders in layered TaTe2, Physical Review Research 4, L022009 (2022).
- Hellmann et al. [2012] S. Hellmann, T. Rohwer, M. Kalläne, K. Hanff, C. Sohrt, A. Stange, A. Carr, M. M. Murnane, H. C. Kapteyn, L. Kipp, M. Bauer, and K. Rossnagel, Time-domain classification of charge-density-wave insulators, Nature Communications 3, 10.1038/ncomms2078 (2012).
- Yusupov et al. [2010] R. Yusupov, T. Mertelj, V. V. Kabanov, S. Brazovskii, P. Kusar, J.-H. Chu, I. R. Fisher, and D. Mihailovic, Coherent dynamics of macroscopic electronic order through a symmetry breaking transition, Nature Physics 6, 681 (2010).
- Feist et al. [2017] A. Feist, N. Bach, N. Rubiano da Silva, T. Danz, M. Möller, K. E. Priebe, T. Domröse, J. G. Gatzmann, S. Rost, J. Schauss, S. Strauch, R. Bormann, M. Sivis, S. Schäfer, and C. Ropers, Ultrafast transmission electron microscopy using a laser-driven field emitter: Femtosecond resolution with a high coherence electron beam, Ultramicroscopy 176, 63 (2017).
- Kazenwadel et al. [2023] D. Kazenwadel, N. Neathery, S. Prakash, A. Ariando, and P. Baum, Cooling times in femtosecond pump-probe experiments of phase transitions with latent heat, Physical Review Research 5, 043077 (2023).
- Mitsuishi et al. [2023] N. Mitsuishi, Y. Sugita, T. Akiba, Y. Takahashi, M. Sakano, K. Horiba, H. Kumigashira, H. Takahashi, S. Ishiwata, Y. Motome, and K. Ishizaka, Unveiling the orbital-selective electronic band reconstruction through the structural phase transition in TaTe2 (2023), arxiv:2306.15627 [cond-mat] .
- Barwick et al. [2009] B. Barwick, D. J. Flannigan, and A. H. Zewail, Photon-induced near-field electron microscopy, Nature 462, 902 (2009).
- Feist et al. [2015] A. Feist, K. E. Echternkamp, J. Schauss, S. V. Yalunin, S. Schäfer, and C. Ropers, Quantum coherent optical phase modulation in an ultrafast transmission electron microscope, Nature 521, 200 (2015).
- Dahan et al. [2021] R. Dahan, A. Gorlach, U. Haeusler, A. Karnieli, O. Eyal, P. Yousefi, M. Segev, A. Arie, G. Eisenstein, P. Hommelhoff, and I. Kaminer, Imprinting the quantum statistics of photons on free electrons, Science 373, eabj7128 (2021).
- Zeiger et al. [1992] H. J. Zeiger, J. Vidal, T. K. Cheng, E. P. Ippen, G. Dresselhaus, and M. S. Dresselhaus, Theory for displacive excitation of coherent phonons, Physical Review B 45, 768 (1992).
- Merlin [1997] R. Merlin, Generating coherent THz phonons with light pulses, Solid State Communications Highlights in Condensed Matter Physics and Materials Science, 102, 207 (1997).
- Zong et al. [2019b] A. Zong, P. E. Dolgirev, A. Kogar, E. Ergeçen, M. B. Yilmaz, Y.-Q. Bie, T. Rohwer, I.-C. Tung, J. Straquadine, X. Wang, Y. Yang, X. Shen, R. Li, J. Yang, S. Park, M. C. Hoffmann, B. K. Ofori-Okai, M. E. Kozina, H. Wen, X. Wang, I. R. Fisher, P. Jarillo-Herrero, and N. Gedik, Dynamical Slowing-Down in an Ultrafast Photoinduced Phase Transition, Physical Review Letters 123, 097601 (2019b).
- Dolgirev et al. [2020] P. E. Dolgirev, A. V. Rozhkov, A. Zong, A. Kogar, N. Gedik, and B. V. Fine, Amplitude dynamics of the charge density wave in LaTe3 : Theoretical description of pump-probe experiments, Physical Review B 101, 054203 (2020).
- Zhang et al. [2022b] K. Zhang, N. Zou, Y. Ren, J. Wu, C. Si, and W. Duan, Realization of Coexisting Charge Density Wave and Quantum Spin/Anomalous Hall State in Monolayer NbTe2, Advanced Functional Materials 32, 2111675 (2022b).
- Wei et al. [2017] L.-L. Wei, S.-S. Sun, K. Sun, Y. Liu, D.-F. Shao, W.-J. Lu, Y.-P. Sun, H.-F. Tian, and H.-X. Yang, Charge Density Wave States and Structural Transition in Layered Chalcogenide TaSe2-xTex, Chinese Physics Letters 34, 086101 (2017).
- Geim and Grigorieva [2013] A. K. Geim and I. V. Grigorieva, Van der Waals heterostructures, Nature 499, 419 (2013).
- Hoque et al. [2020] A. M. Hoque, D. Khokhriakov, B. Karpiak, and S. P. Dash, Charge-spin conversion in layered semimetal TaTe2 and spin injection in van der Waals heterostructures, Physical Review Research 2, 033204 (2020).
- Hahn et al. [2005] T. Hahn, U. Shmueli, and J. W. Arthur, International Tables for Crystallography, Volume A: Space-Group Symmetry, Vol. 1 (2005).
- Fujimoto [1959] F. Fujimoto, Dynamical Theory of Electron Diffraction in Laue-Case, I. General Theory, Journal of the Physical Society of Japan 14, 1558 (1959).
- Overhauser [1971] A. W. Overhauser, Observability of Charge-Density Waves by Neutron Diffraction, Physical Review B 3, 3173 (1971).
- Bach et al. [2019] N. Bach, T. Domröse, A. Feist, T. Rittmann, S. Strauch, C. Ropers, and S. Schäfer, Coulomb interactions in high-coherence femtosecond electron pulses from tip emitters, Structural Dynamics 6, 014301 (2019).