Noisy group testing via spatial coupling
Abstract.
We study the problem of identifying a small set , , of infected individuals within a large population of size by testing groups of individuals simultaneously. All tests are conducted concurrently. The goal is to minimise the total number of tests required. In this paper we make the (realistic) assumption that tests are noisy, i.e. that a group that contains an infected individual may return a negative test result or one that does not contain an infected individual may return a positive test results with a certain probability. The noise need not be symmetric. We develop an algorithm called SPARC that correctly identifies the set of infected individuals up to errors with high probability with the asymptotically minimum number of tests. Additionally, we develop an algorithm called SPEX that exactly identifies the set of infected individuals w.h.p. with a number of tests that matches the information-theoretic lower bound for the constant column design, a powerful and well-studied test design. MSc: 05C80, 62B10, 68P30, 68R05
1. Introduction
1.1. Background and motivation.
Few mathematical disciplines offer as abundant a supply of easy-to-state but hard-to-crack problems as combinatorics does. Group testing is a prime example. The problem goes back to the 1940s [15]. Within a population of size we are to identify a subset of infected individuals. To this end we test groups of individuals simultaneously. In an idealised scenario called ‘noiseless group testing’ each test returns a positive result if and only if at least one member of the group is infected. All tests are conducted in parallel. The problem is to devise a (possibly randomised) test design that minimises the total number of tests required.
Noiseless group testing has inspired a long line of research, which has led to optimal or near-optimal results for several parameter regimes [3, 10]. But the assumption of perfectly accurate tests is unrealistic. Real tests are noisy [26]. More precisely, in medical terms the sensitivity of a test is defined as the probability that a test detects an actual infection, viz. that a group that contains an infected individual displays a positive test result. Moreover, the specificity of a test refers to the probability that a healthy group returns a negative test result. If these accuracies are reasonable high (say 99%), one might be tempted to think that noiseless testing provides a good enough approximation. Yet remarkably we will discover that this is far from correct. Even a seemingly tiny amount of noise has an enormous impact not only on the number of tests required, but also on the choice of a good test design; we will revisit this point in Section 1.5. Hence, in group testing, like in several other inference problems, the presence of noise adds substantial mathematical depth. As a rough analogy think of error-correcting linear codes. In the absence of noise the decoding problem just boils down to solving linear equations. By contrast, the noisy version, the closest vector problem, is NP-hard [13].
In the present paper we consider a very general noise model that allows for arbitrary sensitivities and specificities. To be precise, we assume that if a test group contains an infected individual, then the test displays a positive result with probability and a negative result with probability . Similarly, if the group consists of healthy individuals only, then the test result will display a negative outcome with probability and positive result with probability . Every test is subjected to noise independently.
Under the common assumption that the number of infected individuals scales as a power of the population size with an exponent we contribute new approximate and exact recovery algorithms SPARC and SPEX. These new algorithms come with randomised test designs. We will identify a threshold such that SPARC correctly identifies the set of infected individuals up to errors with high probability over the choice of the test design, provided that at least tests are deployed. SPARC is efficient, i.e. has polynomial running time in terms of . By contrast, we will prove that with tests it is impossible to identify the set of infected individuals up to errors, regardless the choice of test design or the running time allotted. In other words, SPARC solves the approximate recovery problem optimally.
In addition, we develop a polynomial time algorithm SPEX that correctly identifies the status of all individuals w.h.p., provided that at least tests are available, for a certain . Exact recovery has been the focus of much of the previous literature on group testing [3]. In particular, for noisy group testing the best previous exact recovery algorithm is the DD algorithm from [16]. DD comes with a simple randomised test design called the constant column design. Complementing the positive result on SPEX, we show that on the constant column design exact recovery is information-theoretically impossible with tests. As a consequence, the number of tests required by SPEX is an asymptotic lower bound on the number of tests required by any algorithm on the constant column design, including DD. Indeed, as we will see in Section 1.5, for most choices of the specificity/sensitivity and of the infection density , SPEX outperforms DD dramatically.
Throughout the paper we write for the noisy channel to which the test results are subjected. We may assume without loss that
| (1.1) |
i.e. that a test is more likely to display a positive result if the test group actually contains an infected individual; for otherwise we could just invert the test results. A test design can be described succinctly by a (possibly random) bipartite graph , where is a set of individuals and is a set of tests. Write for the (unknown) vector of Hamming weight whose -entries mark the infected individuals. Further, let be the vector of actual test results, i.e. if and only if for at least one individual in test . Finally, let be the vector of displayed tests results, where noise has been applied to , i.e.,
| (1.2) |
The objective is to infer from given . As per common practice in the group testing literature, we assume throughout that and that and the channel are known to the algorithm [3].111These assumption could be relaxed at the expense of increasing the required number of tests (details omitted).
1.2. Approximate recovery
The first main result provides an algorithm that identifies the status of all but individuals correctly with the optimal number of tests. For a number let . Further, for let signify the Kullback-Leibler divergence. We use the convention that . Given the channel define
| (1.3) |
The value equals the capacity of the -channel [16, Lemma F.1]. Let
Theorem 1.1.
For any , and there exists such that for every there exist a randomised test design with tests and a deterministic polynomial time inference algorithm such that
| (1.4) |
In other words, once the number of tests exceeds , SPARC applied to the test design identifies the status of all but individuals correctly w.h.p. The test design employs an idea from coding theory called ‘spatial coupling’ [32, 34]. As we will elaborate in Section 2, spatial coupling blends a randomised and a topological construction. A closely related design has been used in noiseless group testing [10].
The following theorem shows that Theorem 1.1 is optimal in the strong sense that it is information-theoretically impossible to approximately recover the set of infected individuals with fewer than tests on any test design. In fact, approximate recovery w.h.p. is impossible even if we allow adaptive group testing where tests are conducted one-by-one and the choice of the next group to be tested may depend on all previous results.
Theorem 1.2.
For any , and there exist and such that for all , all adaptive test designs with tests in total and any function we have
| (1.5) |
1.3. Exact recovery
How many tests are required in order to infer the set of infected individuals precisely, not just up to mistakes? Intuitively, apart from an information-theoretic condition such as (1.3), exact recovery requires a kind of local stability condition. More precisely, imagine that we managed to correctly diagnose all individuals that share a test with individual . Then towards ascertaining the status of itself only those tests are relevant that contain but no other infected individual ; for the outcome of these tests hinges on the status of . Hence, to achieve exact recovery we need to make certain that it is possible to tell the status of itself from these tests w.h.p.
The required number of tests to guarantee local stability on the test design from Theorem 1.1 can be expressed in terms of a mildly involved optimisation problem. For and let
| (1.6) |
This set is a non-empty interval, because is convex and . Let
| (1.7) |
If let for all . Further, if then the function is strictly decreasing on ; therefore, for any and there exists a unique such that
| (1.8) |
In either case set
| (1.9) |
Finally, define
| (1.10) | ||||
| (1.11) | ||||
Theorem 1.3.
For any , and there exists such that for every there exist a randomised test design with tests and a deterministic polynomial time inference algorithm such that
| (1.12) |
Like SPARC from Theorem 1.1, SPEX uses the spatially coupled test design . Crucially, apart from the numbers and of individuals and tests, the value of at which the infimum (1.11) is attained also enters into the construction of that test design. Specifically, the average size of a test group equals . Remarkably, while the optimal value of for approximate recovery turns out to depend on the channel only, a different value of that also depends on may be the right choice to facilitate exact recovery. We will revisit this point in Section 1.5.
1.4. Lower bound on the constant column design
Unlike in the case of approximate recovery we do not have a proof that the positive result on exact recovery from Theorem 1.3 is optimal for any choice of test design. However, we can show that exact recovery with tests is impossible on the constant column design . Under each of the individuals independently joins an equal number of tests, drawn uniformly without replacement from the set of all available tests. Let signify the outcome. The following theorem shows that exact recovery on is information-theoretically impossible with fewer than tests.
Theorem 1.4.
For any , and there exists such that for every and all , and any we have
| (1.13) |
An immediate implication of Theorem 1.4 is that the positive result from Theorem 1.3 is at least as good as the best prior results on exact noisy recovery from [16], which are based on running a simple combinatorial algorithm called DD on . In fact, in Section 1.5 we will see that the new bound from Theorem 1.3 improves over the bounds from [16] rather significantly for most .
The proof of Theorem 1.4 confirms the combinatorial meaning of the threshold . Specifically, for from (1.10) a moment calculation reveals that w.h.p. contains ‘solutions’ of at least the same posterior likelihood as the true such that and differ significantly, i.e. . By contrast, the threshold marks the onset of local stability. This means that for there will be numerous close to but not identical to (i.e. ) of the at least same posterior likelihood. In either case any inference algorithm, efficient or not, is at a loss identifying the actual .
In recent independent work Chen and Scarlett [8] obtained Theorem 1.4 in the special case of symmetric noise (i.e. ). While syntactically their expression for the threshold differs from (1.6)–(1.11), it can be checked that both formulas yield identical results (see Appendix E). Apart from the information-theoretic lower bound (which is the part most relevant to the present work), Chen and Scarlett also proved that it is information-theoretically possible (by means of an exponential algorithm) to infer w.h.p. on the constant column design with tests if . Hence, the bound is tight in the case of symmetric noise.
1.5. Examples
We illustrate the improvements that Theorems 1.1 and 1.3 contribute by way of concrete examples of channels . Specifically, for the binary symmetric channel and the -channel it is possible to obtain partial analytic results on the optimisation behind from (1.11) (see Appendices C–D). As we will see, even a tiny amount of noise has a dramatic impact on both the number of tests required and the parameters that make a good test design.
1.5.1. The binary symmetric channel
Although symmetry is an unrealistic assumption from the viewpoint of applications [26], the expression (1.3) and the optimisations (1.9)–(1.11) get much simpler on the binary symmetric channel, i.e. in the case . For instance, the value of that minimises from (1.10) turns out to be . The parameter enters into the constructions of the randomised test designs and in a crucial role. Specifically, the average size of a test group equals . In effect, any test is actually negative with probability (see Proposition 2.3 and Lemma 5.1 below). Hence, if then w.h.p. about half the tests contain an infected individual. In effect, since , after the application of noise about half the tests display a positive result w.h.p.
In particular, in the noiseless case a bit of calculus reveals that the value also minimises the other parameter from (1.9) that enters into from (1.11). Therefore, in noiseless group testing unequivocally is the optimal choice, the optimisation on (1.11) effectively disappears and we obtain
| (1.14) |
thereby reproducing the optimal result on noiseless group testing from [10].
But remarkably, as we verify analytically in Appendix C at positive noise the value of that minimises does not generally equal . Hence, if we aim for exact recovery, then at positive noise it is no longer optimal for all to aim for about half the tests being positive/negative. The reason is the occurrence of a phase transition in terms of where the ‘local stability’ term takes over as the overall maximiser in (1.10). Consequently, the objective of minimising and the optimal choice for clash. In effect, the overall minimiser for depends on both and the infection density parameter in a non-trivial way. Thus, the presence and level of noise has a discernible impact on the choice of a good test design.222This observation confirms a hypothesis stated in [16, Appendix F]. As mentioned in Section 1.4, independent work of Chen and Scarlett [8] on the case of symmetric noise reaches the same conclusion.
and .
.
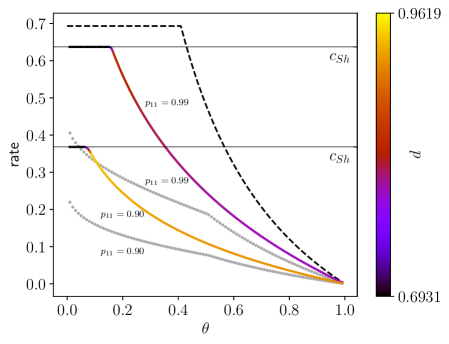
Figure 1 displays the performance of the algorithms and from Theorems 1.1 and 1.3 on the binary symmetric channel. For the purpose of graphical representation the figure does not display the values of , which diverge as , but the value . This value has a natural information-theoretic interpretation: it is the average amount of information that a test reveals about the set of infected individuals, measured in ‘nats’. In other words, the plots display the information rate of a single test (higher is better). The optimal values of are colour-coded into the curves. While in the noiseless case remains constant, in the noisy cases varies substantially with both and .
For comparison the figure also displays the rate in the noiseless case (dashed line on top) and the best previous rates realised by the DD algorithm on from [16] (dotted lines). As is evident from Figure 1, even noise as small as already reduces the rate markedly: the upper coloured curve remains significantly below the noiseless black line. That said, Figure 1 also illustrates how the rate achieved by SPEX improves over the best previous algorithm DD from [16]. Somewhat remarkably, the -line for intersects the -line for DD for an interval of . Hence, for these the algorithm from Theorem 1.3 at noise requires fewer tests than DD at .
Figure 1 also illustrates how approximate and exact recovery compare. Both coloured curves start out as black horizontal lines. These bits of the curves coincide with the rate of the SPARC algorithm from Theorem 1.1. The rate achieved by SPARC, which does not depend on , is therefore just the extension of this horizontal line to the entire interval at the height from (1.3). Hence, particularly for large approximate recover achieves much better rates than exact recovery.
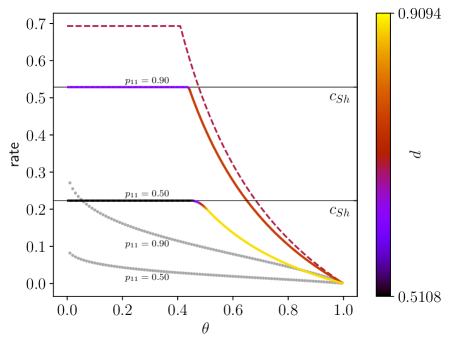
1.5.2. The -channel
In the case of perfect specificity, known as the -channel, it is possible to derive simple expressions for the optimisation problems (1.6)–(1.11) (see Appendix D):
| (1.15) | ||||
| (1.16) |
As in the symmetric case, there is a tension between the value of that minimises (1.15) and the objective of minimising (1.16). Recall that since the size of the test groups is proportional to , the optimiser has a direct impact on the construction of the test design.
Figure 1(b) displays the rates achieved by of SPEX (solid line) and, for comparison, the DD algorithm from [16] (dotted grey) on the -channel with sensitivities and . Additionally, the dashed red line indicates the noiseless rate. Once again the optimal value of is colour-coded into the solid SPEX line. Remarkably, the SPEX rate at (high noise) exceeds the DD rate at for a wide range of . As in the symmetric case the horizontal -lines indicate the performance of the SPARC approximate recovery algorithm.
1.5.3. General (asymmetric) noise
While in the symmetric case the term from (1.10) attains its minimum simply at , with from (1.3) the minimum for general is attained at
| (1.17) |
Once again the design of (as well as ) ensures that w.h.p. a -fraction of tests are actually negative w.h.p. The choice (1.17) ensures that under the -channel the mutual information between the channel input and the channel output is maximised [16, Lemma F.1]:
| (1.18) |
As can be checked numerically, the second contributor to may take its minimum at another . However, we are not aware of a simple explicit expressions for from (1.10) for general noise.
1.6. Related work
The monograph of Aldridge, Johnson and Scarlett [3] provides an excellent overview of the group testing literature. The group testing problem comes in various different flavours: non-adaptive (where all tests are conducted concurrently) or adaptive (where tests are conducted in subsequent stages such that the tests at later stages may depend on the outcomes of earlier stages), as well as noiseless or noisy. An important result of Aldridge shows that noiseless non-adaptive group testing does not perform better than plain individual testing if , i.e. if the number of infected individuals is linear in the size of the population [5]. Therefore, research on non-adaptive group testing focuses on the case with . For non-adaptive noiseless group testing with this scaling of two different test designs (Bernoulli and constant column) and various elementary algorithms have been proposed [7]. Among these elementary designs and algorithms the best performance to date is achieved by the DD greedy algorithm on the constant column design [21]. However, the DD algorithm does not match the information-theoretic bound on the constant column design for all [9].
Coja-Oghlan, Gebhard, Hahn-Klimroth and Loick proposed a more sophisticated test design for noiseless group testing based on spatial coupling [10], along with an efficient inference algorithm called SPIV. Additionally, they improved the information-theoretic lower bound for non-adaptive noiseless group testing. The number of tests required by the SPIV algorithm matches this new lower bound. In effect, the combination of SPIV with the spatially coupled test design solves the noiseless non-adaptive group testing problem optimally both for exact and approximate recovery.
The present article deals with the noisy non-adaptive variant of group testing. A noisy version of the efficient DD algorithm was previously studied on both the Bernoulli and the constant column design [16, 31]. The best previous exact recovery results for general noise were obtained by Johnson, Gebhard, Loick and Rolvien [16] by means of DD on the constant column design (see Theorem 2.1 below). Theorem 1.4 shows in combination with Theorem 1.3 that the new SPEX algorithm performs at least as well as any algorithm on the constant column design, including and particularly DD.
Apart from the articles [16, 31] that dealt with the same general noise model as we consider here, several contributions focused on special noise models, particularly symmetric noise (). In this scenario Chen and Scarlett [8] recently determined the information-theoretically optimal number of tests required for exact recovery on the Bernoulli and constant column designs. The constant column design outperforms the Bernoulli design. The information-theoretic threshold identified by Chen and Scarlett matches the threshold from (1.10) in the special case of symmetric noise (see Appendix E). However, Chen and Scarlett do not investigate the issue of efficient inference algorithms. Instead, they pose the existence of an efficient inference algorithm that matches the information-theoretic threshold as an open problem. Theorem 1.3 applied to symmetric noise answers their question in the affirmative.
A further contribution of Scarlett and Cevher [29] contains a result on approximate recovery under the assumption of symmetric noise. In this case Scarlett and Cevher obtain matching information-theoretic upper and lower bounds, albeit without addressing the question of efficient inference algorithms. Theorem 1.1 applied to the special case of symmetric noise provides a polynomial time inference algorithm that matches their lower bound.
From a practical viewpoint non-adaptive group testing (where all tests are conducted in parallel) is preferable because results are available more rapidly than in the adaptive setting, where several rounds of testing are required. That said, adaptive schemes may require a smaller total number of tests. The case of noiseless adaptive group testing has been studied since the seminal work of Dorfman [15] from the 1940s. For the case a technique known as generalized binary splitting gets by with the optimal number of tests [19, 6]. Aldridge [4] extended this approach to the case , obtaining near-optimal rates. Recently there has been significant progress on upper and lower bounds for noisy and adaptive group testing, although general optimal results remain elusive [30, 33].
Beyond group testing in recent years important progress has been made on several inference problems by means of a combination of spatial coupling and message passing ideas. Perhaps the most prominent case in point is the compressed sensing problem [14, 22]. Further applications include the pooled data problem [1, 2, 17] and CDMA [32], a signal processing problem. The basic idea of spatial coupling, which we are going to discuss in some detail in Section 2.3, goes back to work on capacity-achieving linear codes [23, 24, 25, 32, 34]. The SPIV algorithm from [10] combines a test design inspired by spatial coupling with a combinatorial inference algorithm. A novelty of the present work is that we replace this elementary algorithm by a novel variant of the Belief Propagation message passing algorithm [27, 28] that lends itself to a rigorous analysis.
1.7. Organisation
After introducing a bit of notation and recalling some background in Section 1.8 we given an outline of the proofs of the main results in Section 2. Subsequently Section 3 deals with the details of the proof of Theorem 1.1. Moreover, Section 4 deals with the proof of Theorem 1.3, while in Section 5 we prove Theorem 1.4. The proof of Theorem 1.2, which is quite short and uses arguments that are well established in the literature, follows in Appendix A. Appendix B contains the proof of a routine expansion property of the test design . Finally, in Appendices C and D we investigate the optimisation problems (1.9)–(1.11) on the binary symmetric channel and the -channel, and in Appendix E we compare our result to the recent result of Chen and Scarlett [8].
1.8. Preliminaries
As explained in Section 1.1, a test design is a bipartite graph whose vertex set consists of a set individuals and a set of tests. The ground truth, i.e. the set of infected individuals is encoded as a vector of Hamming weight . Since we will deal with randomised test designs, we may assume that is a uniformly random vector of Hamming weight (by shuffling the set of individuals). Also recall that for a test we let denote the actual result of test (equal to one if and only if contains an infected individual), while signifies the displayed test result obtained via (1.2). It is convenient to introduce the shorthands
for the set of infected/healthy individuals, the set of actually negative/positive tests, the set of negatively/positively displayed tests and the tests that are actually negative/positive and display a positive/negative result, respectively. For each node of we denote by the set of neighbours of . For an individual we also let be the set of positively/negatively displayed tests that contain .
We need Chernoff bounds for the binomial and the hypergeometric distribution. Recall that the hypergeometric distribution is defined by
| (1.19) |
(Out of a total of items of which are special we draw items without replacement and count the number of special items in the draw.) The mean of the hypergeometric distribution equals .
Lemma 1.5 ([20, Equation 2.4] ).
Let be a binomial random variable with parameters . Then
| (1.20) | ||||
| (1.21) |
Throughout we use asymptotic notation to refer to limit . It is understood that the constants hidden in, e.g., a -term may depend on or other parameters, and that a -term may have a positive or a negative sign. To avoid case distinctions we sometimes take the liberty of calculating with the values . The usual conventions and apply. Furthermore, we set . Also recall that . Additionally, and .
Finally, for two random variables defined on the same finite probability space we write
for the mutual information of . We recall that .
2. Overview
We proceed to survey the functioning of the algorithms SPARC and SPEX. To get started we briefly discuss the best previously known algorithm for noisy group testing, the DD algorithm from [16], which operates on the constant column design. We will discover that DD can be viewed as a truncated version of the Belief Propagation (BP) message passing algorithm. BP is a generic heuristic for inference problems backed by physics intuition [27, 35]. Yet unfortunately BP is notoriously difficult to analyse. Even worse, it seems unlikely that full Belief Propagation will significantly outperform DD on the constant column design; evidence of this was provided in [11] in the noiseless case. The basic issue is the lack of a good initialisation of the BP messages.
To remedy this issue we resort to the spatially coupled test design , which combines a randomised and a spatial construction. The basic idea resembles domino toppling. Starting from an easy-to-diagnose ‘seed’, the algorithm works its way forward in a well-defined direction until all individuals have been diagnosed. Spatial coupling has proved useful in related inference problems, including noiseless group testing [10]. Therefore, a natural stab at group testing would be to run BP on . Indeed, the BP intuition provides a key ingredient to the SPARC algorithm, namely the update equations (see (2.30) below), of which the correct choice of the weights (Eq. (2.29) below) is the most important ingredient. But in light of the difficulty of analysing textbook BP, SPARC relies on a modified version of BP that better lends itself to a rigorous analysis. Furthermore, the SPEX algorithm for exact recovery combines SPARC with a clean-up step.
SPARC and SPEX can be viewed as generalised versions of the noiseless group testing algorithm called SPIV from [10]. However, [10] did not exploit the connection with BP. Instead, in the noiseless case the correct weights were simply ‘guessed’ based on combinatorial intuition, an approach that it seems difficult to generalise. Hence, the present, systematic derivation of the weights (2.29) also casts new light on the noiseless case. In fact, we expect that the paradigm behind SPARC and SPEX, namely to use BP heuristically to find the correct parameters for a simplified message passing algorithm, potentially generalises to other inference problems as well.
2.1. The DD algorithm
The DD algorithm from [16] utilises the constant column design .333The article [16] also investigates the performance of DD on the Bernoulli design, which turns out to be inferior. Thus, each individual independently joins an equal number of random tests. Given the displayed test results, DD first declares certain individuals as uninfected by thresholding the number of negatively displayed tests. More precisely, DD declares as uninfected any individual that appears in at least negatively displayed tests, with a diligently chosen threshold. Having identified the respective individuals as uninfected, DD looks out for tests that display a positive result and that only contain a single individual that has not been identified as uninfected yet. Since such tests hint at being infected, in its second step DD declares as infected any individual that appears in at least positively displayed tests where all other individuals were declared uninfected by the first step. Once again is a carefully chosen threshold. Finally, DD declares as uninfected all remaining individuals.
The DD algorithm exactly recovers the infected set w.h.p. provided the total number of tests is sufficiently large such that the aforementioned thresholds exist. The required number of tests, which comes out in terms of a mildly delicate optimisation problem, was determined in [16]. Let
| (2.1) |
Theorem 2.1 ([16, Theorem 2.2]).
Let and with and let
If , then there exists and such that the DD algorithm outputs w.h.p.
The distinct feature of DD is its simplicity. However, the thresholding that DD applies does seem to leave something on the table. For a start, whether DD identifies a certain individual as infected depends only on the results of tests that have distance at most three from in the graph . Moreover, it seems wasteful that DD takes only those positively displayed tests into consideration where all but one individual were already identified as uninfected.
2.2. Belief Propagation
Belief Propagation is a message passing algorithm that is expected to overcome these deficiencies. In fact, heuristic arguments suggests that BP might be the ultimate recovery algorithm for a wide class of inference algorithms on random graphs [35]. That said, rigorous analyses of BP are few and far between.
Following the general framework from [27], in order to apply BP to a group testing design we equip each test with a weight function
| (2.2) |
Thus, takes as argument a -vector indexed by the individuals that take part in test . The weight equals the probability of observing the result that displays if the infection status were for every individual . In other words, encodes the posterior under the -channel. Given the weight functions give rise to the total weight of by letting
| (2.3) |
Thus, we just multiply up the contributions (2.2) of the various tests, and add in the prior assumption that precisely individuals are infected. The total weight (2.3) induces a probability distribution
| where | (2.4) |
A simple application of Bayes’ rule shows that matches the posterior of the ground truth given the test results.
Fact 2.2.
For any test design we have .
BP is a heuristic to calculate the marginals of or, in light of Fact 2.2, the posterior probabilities . To this end BP associates messages with the edges of . Specifically, for any adjacent individual/test pair there is a message from to , and another one in the reverse direction. The messages are updated in rounds and therefore come with a time parameter . Moreover, being probability distributions on , the messages always satisfy
| (2.5) |
The intended semantics is that estimates the probability that is infected given all known information except the result of test . Analogously, estimates the probability that is infected if we disregard all other tests .
This slightly convoluted interpretation of the messages facilitates simple heuristic formulas for computing the messages iteratively. To elaborate, in the absence of a better a priori estimate, at time we simply initialise in accordance with the prior, i.e.,
| (2.6) |
Subsequently we use the weight function (2.2) to update the messages: inductively for and let
| (2.7) | ||||
| (2.8) |
The -symbol hides the necessary normalisation to ensure that the messages satisfy (2.5). Furthermore, the and -prefactors in (2.8) encode the prior that precisely individuals are infected. The expressions (2.7)–(2.8) are motivated by the hunch that for most tests the values should be stochastically dependent primarily through their joint membership in test . An excellent exposition of BP can be found in [27].
How do we utilise the BP messages to infer the actual infection status of each individual? The idea is to perform the update (2.7)–(2.8) for a ‘sufficiently large’ number of rounds, say until an approximate fixed point is reached. The (heuristic) BP estimate of the posterior marginals after rounds then reads
| (2.9) |
Thus, by comparison to (2.8) we just take the incoming messages from all tests into account. In summary, we ‘hope’ that after sufficiently many updates we have . We could then, for instance, declare the individuals with the greatest infected, and everybody else uninfected.
For later reference we point out that the BP updates (2.7)–(2.8) and (2.9) can be simplified slightly by passing to log-likelihood ratios. Thus, define
| (2.10) |
with the initialisation from (2.6). Then (2.7)–(2.9) transform into
| (2.11) | ||||
| (2.12) |
In this formulation BP ultimately diagnoses the individuals with the largest as infected.
Under the assumptions of Theorem 2.1 the DD algorithm can be viewed as the special case of BP with applied to . Indeed, the analysis of DD evinces that on the largest BP estimates (2.9) with correctly identify the infected individuals w.h.p. 444In the noiseless case DD is actually a special case of a discrete message passing algorithm called Warning Propagation [27].
It is therefore an obvious question whether BP on the constant column fits the bill of Theorem 1.1. Clearly, BP remedies the obvious deficiencies of DD by taking into account information from a larger radius around an individual (if we iterate beyond ). Also in contrast to DD’s hard thresholding the update rules (2.7)–(2.8) take information into account in a more subtle, soft manner. Nonetheless, we do not expect that BP applied to the constant column design meets the information-theoretically optimal bound from Theorem 1.1. In fact, there is strong evidence that BP does not suffices to meet the information-threshold for all even in the noiseless case [11]. The fundamental obstacle appears to be the ‘cold’ initialisation (2.6), which (depending on the parameters) can cause the BP messages to approach a meaningless fixed point. Yet for symmetry reasons on the constant column design no better starting point than the prior (2.6) springs to mind; after all, is a nearly biregular random graph, and thus all individuals look alike. To overcome this issue we will employ a different type of test design that enables a warm start for BP. This technique goes by the name of spatial coupling.
2.3. Spatial coupling
The thrust of spatial coupling is to blend a randomised construction, in our case the constant column design, with a spatial arrangement so as to provide a propitious starting point for BP. Originally hailing from coding theory, spatial coupling has also been used in previous work on noiseless group testing [10]. In fact, the construction that we use is essentially identical to that from [10] (with suitably adapted parameters).
To set up the spatially coupled test design we divide the set of individuals into
| (2.13) |
pairwise disjoint compartments such that . We think of these compartments as being spatially arranged so that comes ‘to the right’ of for . More precisely, we arrange the compartments in a ring topology such that is followed again by . Hence, for notational convenience let and for . Additionally, we introduce compartments of tests arranged in the same way: think of as sitting ‘above’ . We assume that the total number of tests in is divisible by and satisfies . Hence, let each compartment contain precisely tests. As in the case of the individuals we let for . Additionally, let
| and | (2.14) |
be integers such that is divisible by . Construct by letting each join precisely tests from for . These tests are chosen uniformly without replacement and independently for different and . Additionally, contains a compartment of
| (2.15) |
tests. Every individual from the first compartments joins an equal number of tests from . These tests are drawn uniformly without replacement and independently. For future reference we let
| (2.16) |
the aforementioned assumptions on ensure that and the total number of tests of comes to
| (2.17) |
In summary, consists of equally sized compartments , of tests plus one extra serving of tests. Each individual joins random tests in the consecutive compartments with . Additionally, the individuals in the first compartments , which we refer to as the seed, also join the tests in .
We will discover momentarily how facilitates inference via BP. But first let us make a note of some basic properties of . Recall that , which encodes the true infection status of each individual, is chosen uniformly and independently of from all vectors of Hamming weight . Let , and let be the set of individuals with infection status in compartment . Furthermore, recall that denotes the actual result of test , and that signifies the displayed result of as per (1.2). For and let
Thus, the subscript indicates the actual test result, while the superscript indicates the displayed result. In Section 3.1 we will prove the following.
Proposition 2.3.
The test design enjoys the following properties with probability .
- G1:
-
The number of infected individuals in the various compartments satisfy
(2.18) - G2:
-
For all the numbers of tests that are actually/displayed positive/negative satisfy
(2.19) (2.20) (2.21) (2.22)
2.4. Approximate recovery
We are going to exploit the spatial structure of in a manner reminiscent of domino toppling. To get started we will run DD on the seed and the tests only; this is our first domino. The choice (2.15) of ensures that DD diagnoses all individuals in correctly w.h.p. The seed could then be used as an informed starting point from which we could iterate BP to infer the status of the individuals in . However, this algorithm appears to be difficult to analyse. Instead we will show under that the assumptions of Theorem 1.1 a modified, ‘paced’ version of BP that diagnoses one compartment (or ‘domino’) at a time and then re-initialises the messages ultimately classifies all but individuals correctly. Let us flesh this strategy out in detail.
2.4.1. The seed
Recall that each individual independently joins random tests from . In its the initial step runs DD on the test design comprising and the tests only. Throughout maintains a vector that represents the algorithm’s current estimate of the ground truth , with indicating ‘undetermined as yet’.
Since Proposition 2.3 shows that the seed contains infected individuals w.h.p., the choice (2.15) of and Theorem 2.1 imply that DD will succeed to diagnose the seed correctly for a suitable .
Proposition 2.4 ([16, Theorem 2.2]).
There exist such that the output of DD satisfies for all w.h.p.
2.4.2. A combinatorial condition
To simplify the analysis of the message passing step in Section 2.4.3 we observe that certain individuals can be identified as likely uninfected purely on combinatorial grounds. More precisely, consider for . If is infected, then any test is actually positive. Hence, we expect that appears in about tests that display a positive result. In fact, the choice (2.14) of ensures that w.h.p. even within each separate compartment , the individual appears in about positively displayed tests. Thus, let
| (2.23) |
The following proposition confirms that all but infected individuals belong to . Additionally, the proposition determines the approximate size of . For notational convenience we define
Recall from (2.1). The proof of the following proposition can be found in Section 3.2.
Proposition 2.5.
W.h.p. we have
| and | (2.24) | ||||
| (2.25) |
2.4.3. Belief Propagation redux
The main phase of the SPARC algorithm employs a simplified version of the BP update rules (2.7)–(2.8) to diagnose one compartment , , after the other. The textbook way to employ BP would be to diagnose the seed, initialise the BP messages emanating from the seed accordingly and then run BP updates until the messages converge. However, towards the proof of Theorem 1.1 this way of applying BP seems too complicated both to run and to analyse. Instead, SPARC relies on a ‘paced’ version of BP. Rather than updating the messages to convergence from the seed, we perform one round of message updates, then diagnose the next compartment, re-initialise the messages to coincide with the newly diagnosed compartment and proceed to the next undiagnosed compartment.
We work with the log-likelihood versions of the BP messages from (2.10)–(2.12). Suppose we aim to process compartment , , having completed already. Then for a test , , and a adjacent variable we initialise
| (2.26) |
The third case above occurs if and only if ; that is, if belongs to an as yet undiagnosed compartment. For the compartments that have been diagnosed already we set to , depending on whether has been classified as infected or uninfected.
Let us now investigate the ensuing messages for and tests . A glimpse at (2.11) reveals that for any test that contains an individual with we have . This is because (2.26) ensures that and . Hence, the test contains no further information as to the status of . Therefore, we call a test informative towards if for all .
Let be the set of all informative . Then any receives from all individuals that have been diagnosed already, i.e. all with . Another glance at the update rule shows that the corresponding terms simply disappear from the product on the r.h.s. of (2.11), because . Consequently, only the factors corresponding to undiagnosed individuals remain. Hence, with the update rule (2.11) simplifies to
| (2.27) |
The only random element in the expression (2.27) is the number of members of test from compartments . But by the construction of this number has a binomial distribution with mean
Since the fluctuations of are of smaller order than the mean, we conclude that w.h.p. (2.27) can be well approximated by a deterministic quantity:
| (2.28) | ||||||
| (2.29) | ||||||
Note that in the case , the negative test weight evaluates to , indicating that individual contained in negative test definitely are uninfected. Finally, the messages (2.28) lead to the BP estimate of the posterior marginal of via (2.12), i.e. by summing on all informative tests . To be precise, letting
be the positively/negatively displayed informative tests adjacent to and setting
| (2.30) |
we obtain
| (2.31) |
One issue with the formula (2.28) is the analysis of the ‘lower order fluctuations’, which come from the random variables . Of course, one could try to analyses theses deviations caefully by resorting to some kind of a normal approximation. But for our purposes this is unnecessary. It turns out that we may simply use the sum on the r.h.s. of (2.31) to identify which individuals are infected. Specifically, instead of computing the actual BP approximation after one round of updating, we just compare and with the values that we would expect these random variables to take if were infected. These conditional expectations work out to be
| (2.32) |
Thus, SPARC will diagnose by comparing with . Additionally, SPARC takes into account that infected individuals likely belong to , as we learned from Proposition 2.5.
Let
| (2.33) |
be a term that tends to zero slowly enough to absorb error terms. The following proposition, which we prove in Section 3.3, summarises the analysis of phase 3. Recall from (2.16) that .
Proposition 2.6.
Assume that for a fixed we have
| (2.34) |
Then w.h.p. the output of SPARC satisfies
The proof of Proposition 2.6, which can be found in Section 3.3, is the centerpiece of the analysis of SPARC. The proof is based on a large deviations analysis that bounds the number of individuals whose corresponding sums deviate form their conditional expectations given . We have all the pieces in place to complete the proof of the first theorem.
2.5. Exact recovery
As we saw in Section 1.3 the threshold encodes a local stability condition. This condition is intended to ensure that w.h.p. no other ‘solution’ with of a similarly large posterior likelihood exists. In fact, because enjoys fairly good expansion properties the test results provide sufficient clues for us to home in on once we get close, provided the number of tests is as large as prescribed by Theorem 1.3. Thus, the idea behind exact recovery is to run SPARC first and then apply local corrections to fully recover ; a similar strategy was employed in the noiseless case in [10].
Though this may sound easy and a simple greedy strategy does indeed do the trick the noiseless case [10], in the presence of noise it takes a good bit of care to get the local search step right. Hence, as per (1.11) suppose that from (2.16) satisfy . Also suppose that we already ran SPARC to obtain with (as provided by Proposition 2.6). How can we set about learning the status of an individual with perfect confidence?
Assume for the sake of argument that for all that share a test with . If contains another infected individual , then unfortunately nothing can be learned from about the status of . In this case we call the test tainted. By contrast, if for all , i.e. if is untainted, then the displayed result hinges on the infection status of itself. Hence, the larger the number of untainted positively displayed , the likelier is infected. Consequently, to accomplish exact recovery we are going to threshold the number of untainted positively displayed . But crucially, to obtain an optimal algorithm we cannot just use a scalar, one-size-fits-all threshold. Instead, we need to carefully choose a threshold function that takes into account the total number of untainted tests .
To elaborate, let
| (2.35) |
be the total number of untainted tests ; to avoid case distinctions we omit seed tests . Routine calculations reveal that is well approximated by a binomial variable with mean . Therefore, the fluctuations of can be estimated via the Chernoff bound. Specifically, the numbers of infected/uninfected individuals with can be approximated as
| (2.36) | ||||
| (2.37) |
Consequently, since ‘atypical’ values of occur more frequently on healthy than on infected individuals. In fact, recalling (1.6), we learn from a brief calculation that for not a single with exists w.h.p. Hence, if we deduce that is uninfected.
For such that more care is required. In this case we need to compare the number
| (2.38) |
of positively displayed untainted tests to the total number of untainted tests. Since the test results are put through the -channel independently, is a binomial variable given . The conditional mean of equals if is infected, and otherwise. Therefore, the Chernoff bound shows that
| (2.39) |
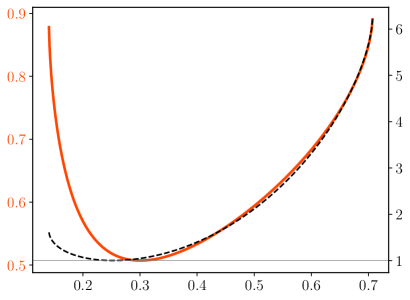
In light of (2.39) we set up the definition (1.9) of so that can be used as a threshold function to tell infected from uninfected individuals. Indeed, given we should declare uninfected if either or , and infected otherwise; then the choice of and would ensure that all individuals get diagnosed correctly w.h.p. Figure 2 displays a characteristic specimen of the function and the corresponding rate function from (1.9).
Yet trying to distil an algorithm from these considerations, we run into two obvious obstacles. First, the threshold may be hard to compute precisely. Similarly, the limits of the interval may be irrational (or worse). The following proposition, which we prove in Section 4.1, remedies these issues.
Proposition 2.7.
Let and assume that . Then there exist and an open interval with endpoints such that for any there exist and a step function such that the following conditions are satisfied.
- Z1:
-
for all .
- Z2:
-
for all .
- Z3:
-
for all .
- Z4:
-
If satisfy , then .
The second obstacle is that in the above discussion we assumed that for all . But all that the analysis of SPARC provides is that w.h.p. for at most individuals . To cope with this issue we resort to the expansion properties of . Roughly speaking, we show that w.h.p. for any small set of individuals (such as ) the set of individuals that occur in ‘many’ tests that also contain a second individual from is significantly smaller than . As a consequence, as we apply the thresholding procedure repeatedly the number of misclassified individuals decays geometrically. We thus arrive at the following algorithm.
Proposition 2.8.
Suppose that for a fixed . There exists , a rational interval and a rational step function such that w.h.p. for all we have
Proof of Theorem 1.3.
Remark 2.9.
In the noiseless case Theorem 1.3 reproduces the analysis of the SPIV algorithm from [10]. One key difference between SPARC and SPEX on the one hand and SPIV on the other is that the former are based on Belief Propagation, while the latter relies on combinatorial intuition. More precisely, the SPIV algorithm infers from positive tests by means of a weighted sum identical to from (2.30) with the special values and . In the noiseless case the weights were ‘guessed’ based on combinatorial intuition. Furthermore, in noiseless case we can be certain that any individual contained in a negative test is healthy, and therefore the SPIV algorithm only takes negative tests into account in this simple, deterministic manner. By contrast, in the noisy case the negative tests give rise to a second weighted sum . An important novelty is that rather than ‘guessing’ the weights , here we discovered how they can be derived systematically from the BP formalism. Apart from shedding new light on the noiseless case as well, we expect that this type of approach can be generalised to quite a few other inference problems as well. A second novelty in the design of SPEX is the use of the threshold function that depends on the number untainted tests. The need for such a threshold function is encoded in the optimisation problem (1.9) that gives rise to a non-trivial choice of the coefficient that governs the size of the tests. This type of optimisation is unnecessary in the noiseless case, where simply is the optimal choice for all .
2.6. The constant-column lower bound
Having completed the discussion of the algorithms SPARC and SPEX for Theorems 1.1 and 1.3, we turn to the proof of Theorem 1.4 on the information-theoretic lower bound for the constant column design. The goal is to show that for no algorithm, efficient or otherwise, can exactly recover on .
To this end we are going to estimate the probability of the actual ground truth under the posterior given the test results. We recall from Fact 2.2 that the posterior coincides with the Boltzmann distribution from (2.4). The following proposition, whose proof can be found in Section 5.1, estimates the Boltzmann weight of the ground truth. Recall from (2.16) that . Also recall the weight function from (2.3).
Proposition 2.10.
w.h.p. the weight of satisfies
| (2.40) |
We are now going to argue that for the partition function dwarfs the Boltzmann weight (2.40) w.h.p. The definition (1.11) of suggests that there are two possible ways how this may come about. The first occurs when is smaller than the local stability bound from (1.9). In this case we will essentially put the analysis of SPEX into reverse gear. That is, we will show that there are plenty of individuals whose status could be flipped from infected to healthy or vice versa without reducing the posterior likelihood. In effect, the partition function will be far greater than the Boltzmann weight of .
Proposition 2.11.
Assume that there exists such that there exists such that
| and | (2.41) | ||||
| (2.42) | |||||
Then w.h.p. there exist pairs such that for the configuration obtained from by inverting the -entries we have
| (2.43) |
The second case is that is smaller than the entropy bound from (1.10). In this case we will show by way of a moment computation that exceeds the Boltzmann weight of w.h.p. More precisely, in Section 5.3 we prove the following.
Proposition 2.12.
Let . If , then
3. Analysis of the approximate recovery algorithm
In this section we carry out the proofs of the various proposition leading up to the proof of Theorem 1.1 (Propositions 2.3, 2.5 and 2.6). Throughout we work with the spatially coupled test design from Section 2.3. Hence, we keep the notation and assumptions from (2.13)–(2.17). We also make a note of the fact that for any and any , ,
| (3.1) |
this is because the construction of ensures that joins random tests in each of , drawn uniformly without replacement.
3.1. Proof of Proposition 2.3
Property G1 is a routine consequence of the Chernoff bound and was previously established as part of [10, Proposition 4.1]. With respect to G2 we may condition on the event that the bound (2.18) from G1 is satisfied. Consider a test . Recall that comprises individuals from the compartments . Since the probability that a specific individual joins a specific test is given by (3.1) and since individuals choose the tests that they join independently, on for each we have
| (3.2) |
Combining (2.16) and (3.2), we obtain
| (3.3) |
Further, combining (3.2) and (3.3), we get
Multiplying these probabilities up on , we arrive at the estimate
Hence,
| (3.4) |
To establish concentration, observe that the set of tests that a specific infected individual joins can change by at the most. Moreover, changing the neighbourhood of a healthy individual cannot change the actual test results at all. Therefore, by Azuma–Hoeffding,
| (3.5) |
Thus, (3.4), (3.5) and G1 show that with probability for all we have
| and thus | (3.6) |
Since the actual test results are subjected to the -channel independently to obtain the displayed test results, the distributions of given read
| (3.7) | |||||
| (3.8) |
Thus, G2 follows from (3.6), (3.7) and Lemma 1.5 (the Chernoff bound).
3.2. Proof of Proposition 2.5
Any has a total of neighbours in each of . Moreover, all tests are actually positive. Since the displayed result is obtained via the -channel independently for every , the number of displayed positive neighbours is a binomial variable with distribution . Since and , the first assertion (2.24) is immediate from Lemma 1.5.
Moving on to the second assertion, we condition on the event that the bounds (2.19)–(2.22) hold for all . Then Proposition 2.3 shows that . Given we know that
| (3.9) |
Now consider an individual . Also consider any test for . Then the actual result of is independent of the event , because is uninfected. Since the displayed result depends solely on , we conclude that is independent of as well. Therefore, (3.9) shows that on the event the number of displayed positive tests that is a member of has conditional distribution
| (3.10) |
Since the random variables are mutually independent, (2.25) follows from Lemma 1.6.
3.3. Proof of Proposition 2.6
We reduce the proof of Proposition 2.6 to three lemmas. The first two estimate the sums from (2.30) when evaluated at the actual ground truth .
Lemma 3.1.
Assume that (2.34) is satisfied. w.h.p. we have
| (3.11) |
Lemma 3.2.
Assume that (2.34) is satisfied. w.h.p. we have
| (3.12) |
We defer the proofs of Lemmas 3.1 and 3.2 to Sections 3.4 and 3.5. While the proof of Lemma 3.1 is fairly routine, the proof of Lemma 3.2 is the linchpin of the entire analysis of SPARC, as it effectively vindicates the BP heuristics that we have been invoking so liberally in designing the algorithm.
Additionally, to compare with the algorithm’s estimate we resort to the following expansion property of .
Lemma 3.3.
Let be such that . Then w.h.p. for any of size ,
In a nutshell, Lemma 3.3 posits that for any ‘small’ set of individuals there are even fewer individuals that share many tests with individuals from . Lemma 3.3 is an generalisation of [10, Lemma 4.16]. The proof, based on a routine union bound argument, is included in Appendix B for completeness.
Proof of Proposition 2.6.
Proposition 2.4 shows that for all individuals in the seed we have w.h.p. Let be the set of misclassified individuals in . We are going to show that w.h.p. for all and for large enough ,
| (3.13) |
We proceed by induction on . As mentioned above, Proposition 2.4 ensures that w.h.p. Now assume that (3.13) is correct for all ; we are going to show that (3.13) holds for as well. To this end, recalling from (2.33) and from (2.32), we define for
and further for
We claim that . To see this, assume that . Then for SPARC to misclassify , it must be the case that
and thus .
3.4. Proof of Lemma 3.1
The thrust of Lemma 3.1 is to verify that the definition (2.23) of the set faithfully reflects the typical statistics of positively/negatively displayed tests in the neighbourhood of an infected individual with . Recall from the definition of that such an individual joins tests in for . Moreover, apart from itself a test recruits from . In particular, recruits participants from the compartments preceding . Let
| (3.15) |
be the set of tests in that do not contain an infected individual from .
Claim 3.4.
With probability for all , we have
Proof.
We condition on the event that G1 from Proposition 2.3 holds. Then for any and any the number of infected individuals in from is a binomial variable as in (3.2). Since the random variables are mutually independent, we therefore obtain
| (3.16) |
Hence,
| (3.17) |
Further, changing the set of tests that a single joins can alter by at the most, while changing the set of neighbours of any does not change at all. Therefore, Azuma–Hoeffding shows that
| (3.18) |
Let
| (3.19) |
Claim 3.5.
For all , and we have
3.5. Proof of Lemma 3.2
To prove Lemma 3.2 we need to estimate the probability that an uninfected individual , , ‘disguises’ itself to look like an infected individual. In addition to the sets from (3.15), towards the proof of Lemma 3.2 we also need to consider the sets
In words, and are the sets of actually positive/negative tests in , i.e. actually positive/negative tests that do not contain an infected individual from . Additionally, discriminate based on the displayed tests results. We begin by estimating the likely sizes of these sets.
Claim 3.6.
Let and . Then with probability we have
| (3.22) | ||||||
| (3.23) | ||||||
| (3.24) |
Proof.
Let be the event that G1–G2 from Proposition 2.3 hold and that the estimates (3.22)–(3.24) hold. Then by Proposition 2.3 and Claim 3.6 we have
| (3.25) |
To facilitate the following computations we let
| (3.26) |
Additionally, we introduce the shorthand for the error term from the definition (2.23) of . Our next step is to determine the distribution of the random variables that contribute to from (2.30).
Claim 3.7.
Let and . Given for every we have
| (3.27) | |||
| (3.28) |
Proof.
We are now ready to derive an exact expression for the probability that for the value gets (almost) as large as the value that we would expected to see for an infected individual. Recall the values from (3.19).
Claim 3.8.
Let
| (3.29) |
Then for all and all we have
Proof.
Since and by (2.14) we can write
| (3.30) |
Further, given and the random variables are mutually independent because joins tests in the compartments , , independently. Hence, Claim 3.7 shows that for any ,
| (3.31) |
Thus, consider the optimisation problem
| (3.32) |
Then combining (3.30) and (3.31) with Claim 3.7 and Lemma 1.6 and using the substitution , we obtain
| (3.33) |
We claim that (3.33) can be sharpened to
| (3.34) |
Indeed, consider any feasible solution to such that . Obtain by increasing some of the values such that . Then because the functions with are equicontinuous on the compact interval , we see that
Finally, we notice that the condition in (3.32) is superfluous. Indeed, since there is nothing to be gained from choosing . Furthermore, since the Kullback-Leibler divergence is strictly convex and (1.1) ensures that for all , the optimisation problem attains a unique minimum, which is not situated at the boundary of the intervals . That said, the unique minimiser satisfies the weight constraint with equality; for otherwise we could reduce some , thereby decreasing the objective function value. In summary, we conclude that . Thus, the assertion follows from (3.34). ∎
Claim 3.9.
Let
| (3.35) |
Then for all and all we have
Recall that by convention . Thus for the condition of (3.35) boils down to and the optimisation becomes trivial.
Proof.
Analogous to the proof of Claim 3.8. ∎
Clearly, as a next step we need to solve the optimisation problems (3.29) and (3.35). We defer this task to Section 3.6, where we prove the following.
Lemma 3.10.
Let have distribution and let be the (random) channel output given input . Then
Proof of Lemma 3.2.
In light of Claims 3.8 and 3.9 and Lemma 3.10 to work out that all but positive individuals are identified correctly, using Markov’s inequality we need to verify that
| (3.36) |
Taking the logarithm of (3.36) and simplifying, we arrive at
| (3.37) |
Thus we need to show that
| (3.38) |
This boils down to , which in turn is identical to (2.34). ∎
3.6. Proof of Lemma 3.10
We tackle the optimisation problems via the method of Lagrange multipliers. Since the objective functions are strictly convex, these optimisation problems possess unique stationary points. As the parameters from (3.19) satisfy , the optimisation problem (3.29) gives rise to the following Lagrangian.
Claim 3.11.
The Lagrangian
has the unique stationary point , .
Proof.
Since the objective function is strictly convex, we just need to verify that and is a stationary point. To this end we calculate
| (3.39) |
Substituting in the definition (2.29) of the weights and the definitions (3.19) of and simplifying, we obtain
Finally, (3.39) shows that setting ensures that as well. ∎
Analogous steps prove the corresponding statement for .
Claim 3.12.
Assume . The Lagrangian
has the unique stationary point , .
Having identified the minimisers of , we proceed to calculate the optimal objective function values. Note that for the minimisers for the cases and coincide.
Claim 3.13.
Let
Then
Proof.
We perform the calculation for in detail. Syntactically identical steps yield the expression for , the only required change being the obvious modification of the indices of the channel probabilities. Substituting the optimal solution and the definitions (3.19) and (2.1), (3.19) and (3.26) of into (3.29), we obtain
| (3.40) | ||||
the -bound in (3.40) holds because the derivative of the integrand is bounded on . Replacing the Kullback-Leibler divergence by its definition, we obtain , where
Splitting the logarithm in the first integrand, we further obtain , where
Setting and introducing , we calculate
| (3.41) |
Concerning , we once again substitute to obtain
| (3.42) |
Proceeding to , we obtain
| (3.43) |
Finally, recalling that and combining (3.40)–(3.43) and simplifying, we arrive at the desired expression for . ∎
4. Analysis of the exact recovery algorithm
In this section we establish Propositions 2.7 and 2.8, which are the building blocks of the proof of Theorem 1.3. We continue to work with the spatially coupled design from Section 2.3 and keep the notation and assumptions from (2.13)–(2.17).
4.1. Proof of Proposition 2.7
Assume that and let . Since the definitions (1.11) of and (1.6) of ensure that for small enough we can find an open interval with rational boundary points such that Z1 is satisfied.
Let be the closure of . Then by the definition of there exists a function such that for all we have
| (4.1) |
In fact, because the Kullback-Leibler divergence is strictly convex the equation (4.1) defines uniquely. The inverse function theorem implies that the function is continuous and therefore uniformly continuous on . Additionally, once again because the Kullback-Leibler divergence is convex and , for all we have
Therefore, there exists such that for all we have
| (4.2) |
Combining (4.1) and (4.2), we find a continuous such that for small enough for all we have
| (4.3) | ||||
| (4.4) |
Additionally, by uniform continuity for any given (that may depend arbitrarily on and ) we can choose small enough so that
| (4.5) |
4.2. Proof of Proposition 2.8
As in the proof of Proposition 2.6 in Section 3.3 we will first investigate an idealised scenario where we assume that the ground truth is known. Then we will use the expansion property provided by Lemma 3.3 to connect this idealised scenario with the actual steps of the algorithm.
In order to study the idealised scenario, for and we introduce
Thus, is the number of untainted tests in compartment that contain , i.e. test that do not contain another infected individual. Moreover, is the number of positively displayed untainted tests. Finally, are the sums of these quantities on . The following lemma provides an estimate of the number of individuals with a certain value of .
Lemma 4.1.
w.h.p. for all and all we have
| (4.6) | |||
| (4.7) |
Proof.
Let and consider any . Further, obtain from by deleting individual (and, of course, removing from all tests). Additionally, obtain from by re-inserting and assigning to random tests in the compartments for as per the construction of the spatially coupled test design. Then the random test designs and are identically distributed.
Let be the event that enjoys properties G1 and G2 from Proposition 2.3. Then Proposition 2.3 shows that
| (4.8) |
Moreover, given for every the number of tests in that contain no infected individual aside from satisfies
| (4.9) |
this follows from the bounds on provided by G2 and the fact that discarding can change the numbers of actually positive/negative tests by no more than .
Now consider the process of re-inserting to obtain . Then (4.9) shows that given we have
These hypergeometric variables are mutually independent given . Therefore, Lemma 1.6 implies that on ,
| (4.10) |
This estimate holds independently of the infection status . Thus, the assertion follows from (4.8), (4.10) and Markov’s inequality. ∎
As a next step we argue that for beyond the threshold the function from Proposition 2.7 separates the infected from the uninfected individuals w.h.p.
Lemma 4.2.
Assume that . Let be the interval and the number from Proposition 2.7, choose sufficiently small and let be such that Z1–Z4 are satisfied. Then w.h.p. the following statements are satisfied.
-
(i)
For all we have and .
-
(ii)
For all with we have .
Proof.
Let be the event that the bounds (4.6)–(4.7) hold for all . Then (4.7) and Proposition 2.7, Z1 show that w.h.p. for all , provided is small enough. Moreover, for a fixed such that and let be the number of variables such that and . Since itself is infected, all tests are actually positive. Therefore, is displayed positively with probability . As a consequence, Lemma 1.5 shows that
| (4.11) |
Combining (4.7) and (4.11), recalling that and choosing sufficiently small, we obtain
| (4.12) | ||||
| (4.13) |
Taking a union bound on the possible combinations , we see that (i) follows from (4.13). A similar argument based on Proposition 2.7, Z3 yields (ii). ∎
Proof of Proposition 2.8.
For consider the set of misclassified individuals after iterations:
Propositions 2.5 and 2.6 show that w.h.p. the size of the initial set satisfies
| (4.14) |
We are going to argue by induction that decays geometrically. Apart from the bound (4.14), this argument depends on only two conditions. First, that the random graph indeed enjoys the expansion property from Lemma 3.3. Second, that (i)–(ii) from Lemma 4.2 hold. Let be the event that these two conditions are satisfied, and that (4.14) holds. Propositions 2.5 and 2.6 and Lemmas 3.3 and 4.2 show that .
To complete the proof we are going to show by induction on that on ,
| (4.15) |
Indeed, consider the set
Since by (4.14) and induction we know that , the expansion property from Lemma 3.3 implies that . Therefore, to complete the proof of (4.15) it suffices to show that .
To see this, suppose that .
- Case 1: but :
-
Lemma 4.2 (i) ensures that . Therefore, the case can occur only if at least tests contain a misclassified individual . Hence, .
- Case 2: and but :
-
by Lemma 4.2 (i) we have . Thus, if , then by the continuity property Z4 we have . Consequently, as in Case 1 we have .
- Case 3: :
-
as in the previous cases, due to Z4 and Lemma 4.2 (ii) the event can occur only if . Thus, .
Hence, , which completes the proof. ∎
5. Lower bound on the constant-column design
5.1. Proof of Proposition 2.10
The following lemma is an adaptation of Proposition 2.3 (G2) to .
Lemma 5.1.
The random graph enjoys the following properties with probability :
| (5.1) | ||||
| (5.2) | ||||
| (5.3) | ||||
| (5.4) |
5.2. Proof of Proposition 2.11
Let be the set of individuals such that
Hence, participates in precisely tests that do not contain another infected individual.
Lemma 5.2.
Let be such that is an integer. Then w.h.p. we have
| (5.5) | ||||
| (5.6) |
Proof.
Let and let be the event that the bounds (5.1)–(5.4) hold. We begin by computing . By exchangeability we may condition on the event , i.e. precisely the first individuals are infected. Hence, by the linearity of expectation it suffices to prove that
| (5.7) |
Let be the random design without and let be the set of actually negative tests of . Given the number of tests such that has distribution , because joins precisely tests independently of all other individuals. Hence, (1.19) yields
| (5.8) |
Expanding (5.8) via Stirling’s formula and using the bounds (5.1)–(5.2), we obtain (5.7), which implies that
| (5.9) |
Since the above argument does not depend on the infection status of , analogously we obtain
| (5.10) |
To turn (5.9)–(5.10) into “with high probability”-bounds we resort to the second moment method. Specifically, we are going to show that
| (5.11) | ||||
| (5.12) |
Then the assertion is an immediate consequence of (5.9)–(5.12) and Lemma 5.1.
For similar reasons as above it suffices to prove (5.11). More precisely, we merely need to show that
| (5.13) |
To compute the probability on the l.h.s. obtain by removing . Let be the number of actually negative tests of . We claim that on ,
| (5.14) |
Indeed, we first choose tests that are actually negative in that both will join. Observe that these tests do not satisfy . Then we choose distinct actually negative tests for and to join. Finally, we choose the remaining tests for among the actually positive tests of .
Since on the total number is much bigger than , it is easily verified that the sum (5.14) is dominated by the term ; thus, on we have
| (5.15) |
Furthermore, a careful expansion of the binomial coefficients from (5.15) shows that uniformly for all we have
whence we obtain (5.13). A similar argument applies to . ∎
As a next step consider the set of all such that
Corollary 5.3.
Proof.
Let and . We deal with and by two related but slightly different arguments. The computation of is pretty straightforward. Indeed, Lemma 5.2 shows that w.h.p. the set has the size displayed in (5.6). Furthermore, since (1.2) provides that tests are subjected to noise independently, Lemma 1.5 shows that
| (5.18) |
Moreover, we saw in the proof of Lemma 5.2, any have disjoint sets of untainted tests. Hence, in perfect analogy to (5.18) we obtain
| (5.19) |
Thus, (5.17) follows from (5.18)–(5.19) and Chebyshev’s inequality.
Let us proceed to prove (5.16). As in the case of we obtain
| (5.20) |
Hence, as in (5.10) from the proof of Lemma 5.10,
| (5.21) |
With respect to the second moment calculation, it is not necessarily true that with have disjoint sets of untainted tests. Thus, as in the expression (5.14) let be the number of actually negative tests of and introduce to count the untainted tests that have in common. Additionally, write for the number of common untainted tests that display a negative result. Then
| (5.22) |
As in the proof of Lemma 5.2 it is easily checked that the summand dominates (5.22), and that therefore
| (5.23) |
Thus, (5.16) follows from (5.21), (5.23) and Chebyshev’s inequality. ∎
Proof of Proposition 2.11.
5.3. Proof of Proposition 2.12
We are going to lower bound the partition function by way of a moment computation. To this end we are going to couple the constant column design with the displayed test results with another random pair where the test results indicated by the vector are purely random, i.e. do not derive from an actual vector of infected individuals. One can think of as a ‘null model’. Conversely, in the language of random constraint satisfaction problems [12], ultimately will turn out to be the ‘planted model’ associated with .
Hence, let be the number of positively displayed tests of . Moreover, for a given integer let be a uniformly random vector of Hamming weight , drawn independently of . In other words, in the null model we simply choose a set of uniformly random tests to display positively.
Let and . Moreover, just as in (2.2) define weight functions
| (5.24) |
In addition, exactly as in (2.3)–(2.4) let
| (5.25) |
We begin by computing the mean of the partition function (aka. the ‘annealed average’).
Lemma 5.4.
For any we have
As a next step we sort out the relationship of the null model and of the ‘real’ group testing instance.
Lemma 5.5.
Let be an integer. Then for any and any with we have
| (5.26) |
Corollary 5.6.
Let be an integer. For any we have
References
- [1] A. Alaoui, A. Ramdas, F. Krzakala, L. Zdeborová, M. Jordan: Decoding from pooled data: phase transitions of message passing. IEEE Transactions on Information Theory 65 (2019) 572–585.
- [2] A. Alaoui, A. Ramdas, F. Krzakala, L. Zdeborová, M. Jordan: Decoding from pooled data: Sharp information-theoretic bounds. SIAM Journal on Mathematics of Data Science 1 (2019) 161–188.
- [3] M. Aldridge, O. Johnson, J. Scarlett: Group testing: an information theory perspective. Foundations and Trends in Communications and Information Theory (2019).
- [4] M. Aldridge: Rates of adaptive group testing in the linear regime. IEEE International Symposium on Information Theory (2019) 236–240.
- [5] M. Aldridge: Individual Testing Is Optimal for Nonadaptive Group Testing in the Linear Regime. IEEE Transactions on Information Theory 65 (2019) 2058–2061.
- [6] L. Baldassini, O. Johnson, M. Aldridge: The capacity of adaptive group testing. Proc. ISIT (2013) 2676–2680
- [7] C. Chan, P. Che, S. Jaggi, V. Saligrama: Non-adaptive probabilistic group testing with noisy measurements: near-optimal bounds with efficient algorithms. Proc. 49th Allerton (2011) 1832–1839.
- [8] J. Chen, J. Scarlett: Exact Thresholds for Noisy Non-Adaptive Group Testing. arXiv: 2401.04884. (2024)
- [9] A. Coja-Oghlan, O. Gebhard, M. Hahn-Klimroth, P. Loick: Information-theoretic and algorithmic thresholds for group testing. IEEE Transactions on Information Theory 66 (2020) 7911–7928.
- [10] A. Coja-Oghlan, O. Gebhard, M. Hahn-Klimroth, P. Loick: Optimal group testing. Combinatorics, Probability and Computing 30 (2021) 811–848.
- [11] A. Coja-Oghlan, O. Gebhard, M. Hahn-Klimroth, A. Wein, I. Zadik: Statistical and computational phase transitions in group testing. Proc. 35th COLT (2022) 4764–4781.
- [12] A. Coja-Oghlan, F. Krzakala, W. Perkins, L. Zdeborová: Information-theoretic thresholds from the cavity method. Advances in Mathematics 333 (2018) 694–795.
- [13] I. Dinur: Approximating CVP to within almost-polynomial factors is NP-hard.Combinatorica 23 (2003) 205–243.
- [14] D. Donoho, A. Javanmard , A. Montanari: Information-theoretically optimal compressed sensing via spatial coupling and approximate message passing. IEEE Transactions on Information Theory 59 (2013) 7434–7464.
- [15] R. Dorfman: The detection of defective members of large populations. Annals of Mathematical Statistics 14 (1943) 436–440.
- [16] Oliver Gebhard, Oliver Johnson, Philipp Loick, Maurice Rolvien: Improved bounds for noisy group testing with constant tests per item. IEEE Trans. Inf. Theory 68 (2022) 2604–2621.
- [17] M. Hahn-Klimroth, N. Müller: Near optimal efficient decoding from pooled data. Proc. 35th COLT (2022) 3395–3409.
- [18] W. Hoeffding: Probability inequalities for sums of bounded random variables. In N. Fisher, P. Sen (eds.): The collected works of Wassily Hoeffding. Springer Series in Statistics (Perspectives in Statistics). Springer, New York, NY (1994) 409–426.
- [19] F. Hwang: A method for detecting all defective members in a population by group testing. Journal of the American Statistical Association 67 (1972) 605–608.
- [20] S. Janson, T. Luczak, A. Rucinski: Random Graphs. John Wiley & Sons (2011).
- [21] O. Johnson, M. Aldridge, J. Scarlett: Performance of group testing algorithms with near-constant tests per item. IEEE Transactions on Information Theory 65 (2018) 707–723.
- [22] F. Krzakala, M. Mézard, F. Sausset, Y. Sun, L. Zdeborová: Statistical-physics-based reconstruction in compressed sensing. Physical Review X 2 (2012) 021005.
- [23] S. Kumar, A. Young, N. Macris, H. Pfister: Threshold saturation for spatially coupled LDPC and LDGM codes on BMS channels. IEEE Transactions on Information Theory 60 (2014) 7389–7415.
- [24] S. Kudekar, H. Pfister: The effect of spatial coupling on compressive sensing. Proc. 48th Allerton (2010) 347–353.
- [25] S. Kudekar, T. Richardson, R. Urbanke: Spatially coupled ensembles universally achieve capacity under belief propagation. IEEE Transaction on Information Theory 59 (2013) 7761–7813.
- [26] S. Long, C. Prober, M. Fischer: Principles and practice of pediatric infectious diseases. Elsevier (2018).
- [27] M. Mézard, A. Montanari: Information, physics and computation. Oxford University Press 2009.
- [28] J. Pearl: Probabilistic reasoning in intelligent systems: networks of plausible inference. Morgan Kaufmann (1988).
- [29] J. Scarlett, V. Cevher: Phase transitions in group testing. Proc. 27th SODA (2016) 40–53.
- [30] J. Scarlett: Noisy adaptive group testing: Bounds and algorithms. IEEE Transactions on Information Theory 65 (2018) 3646–3661.
- [31] J. Scarlett, O. Johnson: Noisy non-adaptive group testing: A (near-) definite defectives approach. IEEE Transactions on Information Theory 66 (2020) 3775–3797.
- [32] K. Takeuchi, T. Tanaka, T. Kawabata: Improvement of BP-based CDMA multiuser detection by spatial coupling. Proc. IEEE International Symposium on Information Theory Proceedings (2011) 1489–1493.
- [33] B. Teo, J. Scarlett: Noisy adaptive group testing via noisy binary search: IEEE Transactions in Information Theory, 68 (2022) 3340–3353.
- [34] L. Wang, X. Li, Y. Zhang, K. Zhang: Evolution of scaling emergence in large-scale spatial epidemic spreading. PLoS ONE 6 (2011).
- [35] L. Zdeborová, F. Krzakala: Statistical physics of inference: thresholds and algorithms. Advances in Physics 65 (2016) 453–552.
Appendix A Proof of Theorem 1.2
The basic idea is to compute the mutual information of and . What makes matters tricky is that we are dealing with the adaptive scenario where tests may be conducted one by one. To deal with this issue we closely follow the arguments from [16, 3]. Furthermore, the displayed test results are obtained by putting the actual test results through the noisy channel.
As a first step we bound the mutual information between and from above under the assumption that the statistician applies a adaptive scheme where the next test to be conducted depends deterministically on the previously displayed test results. Let be the total number of tests that are conducted.
Lemma A.1.
For a deterministic adaptive algorithm we have .
Proof.
Let be the vector of actual test results. Then
Furthermore,
Since the tests are conducted adaptively, we obtain
Hence,
In the last term is a Bernoulli random variable (whose distribution is determined by for ), and is the output of that variable upon transmission through our channel. Furthermore, the expression in the second line above is the mutual information of these quantities. Hence, the definition of the channel capacity implies that . ∎
Proof of Theorem 1.2.
As a first step we argue that it suffices to investigate deterministic adaptive group testing algorithms (under the assumption that the ground truth is random). Indeed, a randomised adaptive algorithm can be modeled as having access to a (single) sample from a random source that is independent of . Now, if we assume that for an arbitrarily small we have
where the expectation is on both and , then there exists some outcome such that
where the expectation is on only.
Thus, assume that is deterministic. We have . Furthermore, . Hence, Lemma A.1 yields
which implies the assertion. ∎
Appendix B Proof of Lemma 3.3
This proof is a straightforward adaption of [10, proof of Lemma 4.16]. Fix of size as well as a set of size with . Let . Further, let be a set of size . Additionally, let be the event that every test contains two individuals from . Then
| (B.1) |
Hence, it suffices to bound .
For a test there are no more than ways to choose distinct individuals . Moreover, (3.1) shows that the probability of the event is bounded by ; in fact, this probability might be zero if we choose an individual that cannot join due to the spatially coupled construction of . Hence, due to negative correlation
Consequently, by the union bound the event that there exist sets of sizes such that occurs has probability
Hence, the bounds yield
Further, since and while and , we obtain
Thus, summing on , and recalling , we obtain
| (B.2) |
Appendix C Parameter optimisation for the binary symmetric channel
Let be the set of those where the minimum in the optimisation problem (1.10) is attained. The goal in this section is to show that for the binary symmetric channel this minimum is not always attained at the information-theoretic value that minimises the term from (1.10).
Proposition C.1.
For any binary symmetric channel given by there is such that for all we have .
In order to show that is suboptimal, we will use the following analytic bound on for binary symmetric channels.
Lemma C.2.
For a binary symmetric channel given by we have
| (C.1) | ||||
| (C.2) |
The proof of Lemma C.2 uses the following fact, which can be verified by elementary calculus.
Fact C.3.
For all , and we have
Proof of Lemma C.2.
Let us first prove the upper bound. Choose such that
we need to show that . By the channel symmetry and because , we have
Therefore, the definition of ensures that for all we have
and thus . Once again by channel symmetry and the definitions of and (see (1.8)), we see that and hence for all . Consequently, the definition of ensures we see that for all ,
Hence, , which is the right inequality in (C.3).
To complete the proof of Proposition C.1 we need a second elementary fact.
Fact C.4.
The function is concave in its first argument for , and for any given , any maximizing is strictly less than .
Appendix D Parameter optimisation for the -channel
Much as in Appendix C the goal here is to show that also for the -channel the value from (1.17) at which from (1.10) attains its minimum is not generally the optimal choice to minimise and thus obtain the optimal bound . To this end we derive the explicit formula (1.15) for ; the derivation of the second formula (1.16) is elementary.
Proposition D.1.
For a -channel given by and we have .
Proof.
We observe that for a -channel we have . Indeed, fix any . Then by the definitions (1.7) of and of we have . Since the -channel satisfies , the value diverges for all , rendering the condition in the definition of void for all . Moreover, since , we also have , and thus . Since by definition, this implies that on the -channel.
Hence, it remains to verify that has the claimed value. This is a direct consequence of Fact C.3 (with and ) in combination with the fact that and thus . ∎
The following proposition shows that indeed is not generally the optimal choice. Recall that is the set of where the minimum in the optimisation problem defining is attained for a given channel .
Proposition D.2.
For a -channel given by and any there is a such that for all we have .
Towards the proof of Proposition D.2 we state the following fact whose proof comes down to basic calculus.
Fact D.3.
For a -channel where and , we have .
Proof of Proposition D.2.
First we show that does not minimize for all . We reparameterise the expression for from Proposition D.1 in terms of , obtaining
Hence, for any given the value of is minimized when is minimized. Using elementary calculus we check that is concave in its first argument on the interval , and that for all the value of maximizing is strictly smaller than (see Fact C.4). Now for any -channel with we have (using Fact D.3). Hence, for the -channel, does not minimize .
Now let be a minimizing ; in particular, . Since is increasing in and unbounded as , the same holds for and . Hence, we may consider
check that it is strictly less than , and that by definition of , it holds for all that
Consequently, . ∎
Appendix E Comparison with the results of Chen and Scarlett on the symmetric channel
Chen and Scarlett [8] recently derive the precise information-theoretic threshold of the constant column design for the symmetric channel (i.e. ). The aim of this section is to verify that their threshold coincides with , with from (1.11) on the symmetric channel. The threshold quoted in [8, Theorems 3 and 4] reads , where is the solution to the following optimisation problem:
| (E.1) | ||||
| (E.2) | ||||
Lemma E.1.
For symmetric noise () and any we have .
Proof.
The definition (E.2) of can be equivalently rephrased as follows:
Consequently, iff
Recall that iff
Since we conclude that if , then . Hence, .
To prove the converse inequality, we are going to show that any also satisfies . Hence, assume for contradiction that and . Then the following four inequalities hold:
| (E.3) | ||||||
| (E.4) |
The two inequalities on the left are a direct consequence of . Note that if one of the right two inequalities is violated then . Combining the inequalities of (E.3) leads us to
| (E.5) |
The remaining inequalities given by (E.4) imply
which contradicts (E.5). ∎