On the development of an application for the compilation of global sea level changes
Abstract
There is a lot of data about mean sea level variation from studies conducted around the globe. This data is dispersed, lacks organization along with standardization, and in most cases, it is not available online. In some instances, when it is available, it is often in unpractical ways and different formats. Analyzing it would be inefficient and very time-consuming. In addition to all of that, to successfully process spatial-temporal data, the user has to be equipped with particular skills and tools used for geographic data like PostGIS, PostgreSQL and GeoAlchemy. The presented solution is to develop a web application that solves some of the issues faced by researchers. The web application allows the user to add data, be it through forms in a browser or automated with the help of an API. The application also assists with data querying, processing and visualization by making tables, showing maps and drawing graphs. Comparing data points from different areas and publications is also made possible. The implemented web application permits the query and storage of spatial-temporal data about mean sea level variation in a simplified, easily accessible and user-friendly manner. It will also allow the realization of more global studies.
Index Terms:
Mean Sea Level Variation, Web Application, Geographical Database, PythonI introduction
Climate change, which can be defined as a modification of climate patterns, has caused worldwide effects owing to changes in weather and climate ex- tremes, a rise in global surface temperature, glacier melting and shrinking along with worldwide mean sea level increase[1]. On the social sphere, these changes are a contributing factor to worsening inequality, economic losses due to a higher number of natural disasters, crop death and failure related to drought or out of season rains, which in turn inflate the food prices[2]. A rise in sea level is especially impacting due to its effects on coastal zones, where big and important cities are mostly located[3]. Nonetheless, sea level integrates the effects of diverse complex geological and climatologi- cal phenomena[4]. As an example, locally obtained sea level changes measurements can result from vertical land motion owning to either glacial isostatic adjustments or tectonics (for example, local glacier retreat generates a decreased ice burden - or weight - over landmasses, which in turn generates land uplift), which do not indicate an increase in absolute mean sea level[5]. Understanding the climate response at global, regional and local scales from various lines of evidence is crucial to estimate climate related risks and adaptation[1]. Even though sea level change represents one of the longest records using human instruments, going back 300 years in Europe, these are not enough to describe the non anthropogenic related sea level increase of approx- imately 120m, which has occurred since the last glacial maximum (1̃9 000 years)[6, 5]. Therefore, the study of sea level changes is based on geological proxies that show a past position of sea level. Sea-level index indicators include instrumental evidence (for example from tidal gauges), ancient shorelines (such as raised beaches), biological indicators (such as bivalve shells), intertidal deposits (such as coastal marshes), and archaeological evidence (for example the position of ancient harbor and port facilities)[7].
With an increasing number of studies conducted and articles published, the amount of data available about sea level variation is also growing. However, data was saved on physical paper, which is easily corruptible, difficult and slow to share at a global level, can amount to huge stacks very quickly leading places to run out of space. Nonetheless, with computers becoming more mainstream, some of the problems were solved with excel sheets. However, excel comes with its problems like not being able to create maps and difficulty with collaboration. Every time someone wants to participate, a link has to be shared and they have to be added to the excel sheet and that is not scalable. The file could also be made public to solve the scalability issues, but that is not secure enough. Another argument against excel is the fact that it is not a relational database. If everything is on the same sheet, it can become messy very quickly, if the data is in different sheets then, firstly it can be easy to lose track of the parameters, secondly, it can not have relations between tables, and thirdly queries cannot be made. A further problem is the fact that even assuming such a database exists, it is not online. By having it public the database can increase in size in a manner that a private one could never. Also, more people visualizing the Database means more people looking for errors and easily correcting them if needed. The problem is that there isn’t a single database that combines all the data from all the studies conducted.
The objective is to develop a web tool that aggregates the maximum number of data points taken from local researchers about the variation of the average sea levels and helps the study of changes in mean sea level by using data from the holes dug. A tool that lets researchers collaborate without creating unnecessary friction (such as sharing links and files). An instrument that shows and creates dynamic maps and graphs, allows for some data query and exploration along with letting users compare the variation of the average sea level from different parts of the world. The tool should also facilitate the data entries made by the researchers, help them collaborate more smoothly and do some of the data standardization required for a better comprehension of the data available.
The expected results from this thesis are the creation of a web application that uses a relational database, a georeferenced database and allows for the creation of dynamic maps and graphs. The relational database saves observations that are represented by their geographic coordinates in a georeferenced database, the age, the area, the title of the paper on which they were published and the sea level. Using these data points, the application creates maps and graphs where it is possible to compare different places for the variation of the mean sea level.
II Background
II-A Building and Interpreting Sea levelCurves
Sea level index points represent the position of past sea levels and mainly comprise biological, sedimentological, morphological, or archaeological evidence of past sea levels. Each type of sea level indicator is associated with a precision (assumed as an error interval) in its relationship with the mean sea level. For example, specific foraminiferal assemblages (foraminifera are single cell organisms with particular external shells) are nowadays found in high marsh environments, living only between the highest astronomical tide and the mean high water-level [8]. So, to a great degree, by finding these shells at lower depths when studying sediment cores, researchers find evidence of shallow water conditions, within a specific height range relative to the existing mean sea level. The next step is to estimate the age of the sediment and/or shells with the appropriate age estimation methods, such as radiocarbon dating, and a local sea level index point can be established.
Several ages estimation methods are often used in the establishment of sea level index points, largely depending on the indicator and time frame under analysis. Each method has its precision, mainly related to the statistical uncertainty obtained from the physical or chemical analysis used in the age determination [9, 10]. Due to this reason, age estimation of either sediment, biological, or rock samples, is always accompanied by an error.
Sea level curves are normally represented by scatter plots showing the relative sea level plotted against age, also named sea level index points, at a local scale. The consideration of precision/errors associated with the selected sea level indicator, and region (due to different tidal ranges, for example), combined with age estimation uncertainties, which depend on the technique used, are extremely important when comparing sea level index points from different locations or ages, and are commonly represented by either polygons or error bars [9, 11].
Sea level curves can differ considerably in different locations, as they represent the local relative sea level (height of the sea surface relative to the earth surface), mostly due to also local vertical land movement ]citep10 This land movement is related to several regional processes, including present and past changes and land ice mass, with major contributions from surface loading response to past glacial-isostatic adjustments, plate tectonics, as well as local processes, such as sediment compaction and past tidal range changes [8]. In fact, Holocene sea level databases are frequently used to constrain parameters in Glacial isostatic adjustment models, with important applications in the current understanding of sea level rise and its geographical variability [8, 5]. Quantification of relative and absolute sea level changes, the latter also named global mean sea level rise, is in continuous development due to the increasing amount of sea level data, and vertical land movements measured using geophysics and geodesy equipment [12]. Taking all these complex inter-related processes, the development of standardized Holocene sea level and vertical land-movement databases is pivotal to establish the global mean sea level rise and to have a better understanding of its changes and relationship with anthropogenic forcing.
II-B Data Representation Libraries
The web application that is being planned to be developed has a server side and a client side. For the client side, HTML[13] is being considered, as it is easy to understand, it has a lot of documentation, forums and tutorials online, it can be embedded with other languages such as JavaScript[14] and with some basic knowledge, is fairly easy to create forms and tables for data collection and display. Other than forms and tables, the application should show personalized maps and plot graphs. However is not possible with HTML and JavaScript alone to show personalized maps and plot graphs, so alternatives were contemplated.

(a)
(b)
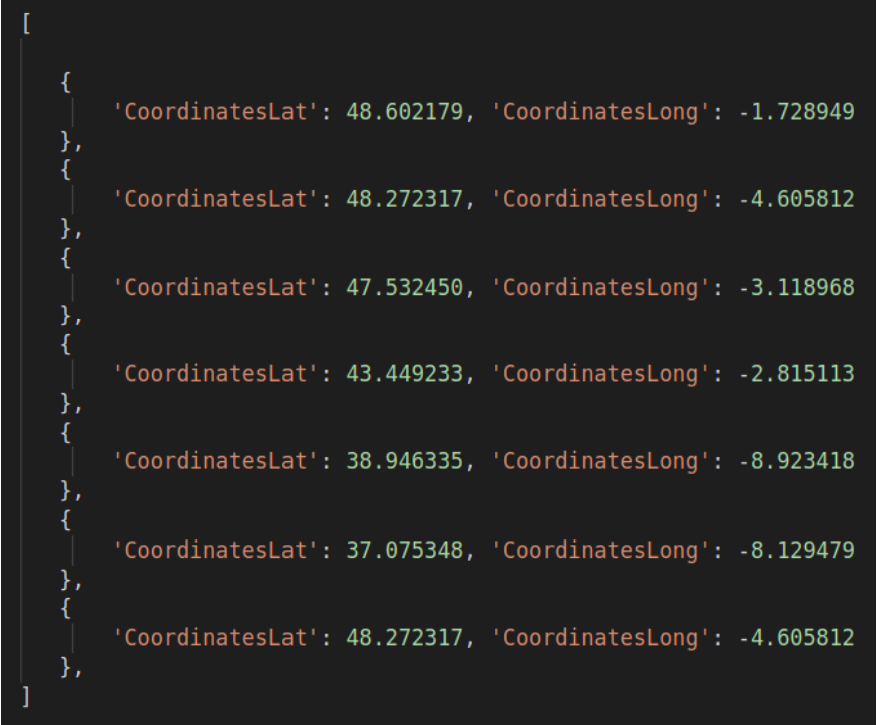
One of the requirements for the application is to show maps from a specific area or publication. These maps shown should have a pin for each of the observations on that specific area or publication. The coordinates of every observation are sent to the browser via a REST/AJAX[15, 16] request.Considering all the prerequisites, two alternatives were shortlisted: Google Maps[17] and Leaflet[18]. In figure1, an example of a map shown to the user is provided, along with the JSON[19] received by the browser. The library, in this case, should use the data obtained to pin the points on the map.
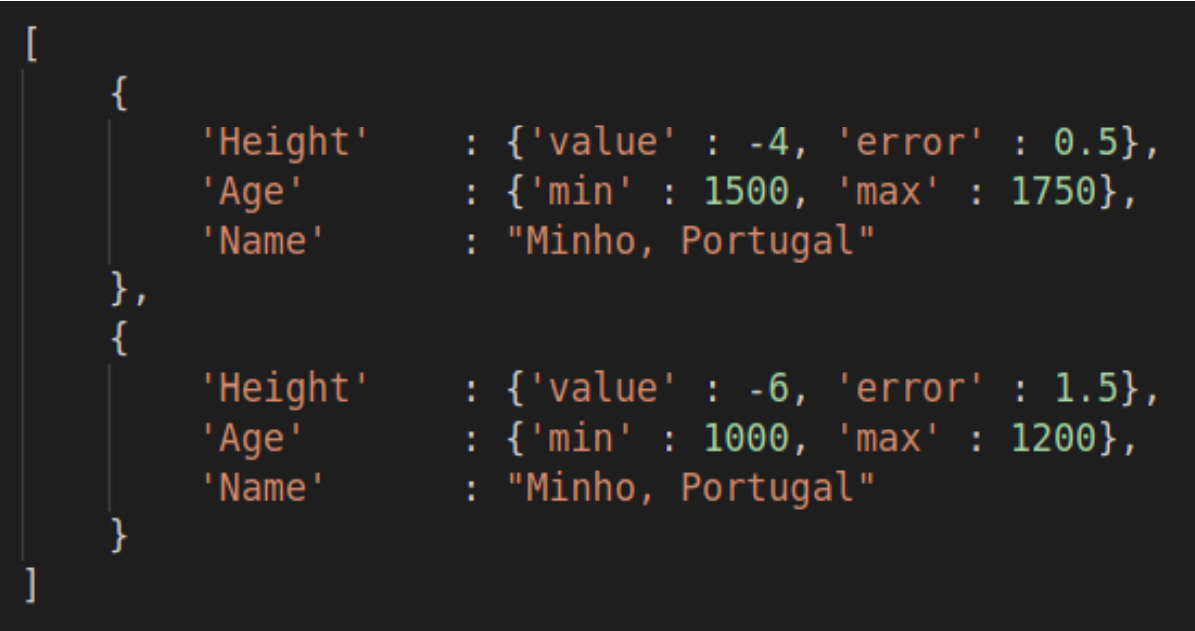
Another requirement for the application was to plot graphs for the sea level variation for a specific area and have the option to compare two or more areas. With these conditions in mind, two alternatives were finalized: Chart.js[20] and Plotly[21]. In figure2, an example of a graph shown to the user is provided, along with the JSON[19] received by the browser. The library, in this case, utilizes the data received to draw the graphs and the respective vertical and horizontal error bars.

(a)
(b)
II-C Geographical Databases
Being a project closely related to geology and geography, it was decided to look for tools that combine these fields with servers and Databases. ArcGIS[22], GeoServer[23] MySQL[24] and PostgreSQL[25] were found. ArcGIS is a platform to generate, organize, distribute and inspect spatial data. It can be run locally or on cloud services. GeoServer is a combination of a Web server with a Web Gis software and a database. It is open-source and allows users to share, manage and organize geospatial data. MySQL is a relational database management system. MySQL spatial extensions permit the users with the creation, storage and inquiry of spatial data through spatial data types and functions[26]. PostgreSQL is an open source object–relational database system that is more closely related to SQL, however, to use geographical libraries an extension named PostGIS[27] has to be added to the database. A further advantage of PostGIS is its capacity for doing spatial queries. Using PostGIS you can create a variety of geographical data types like Points, Line, Circles, Polygons, etc.[28]. These data types can interact with each other to make queries such as the meeting point of two lines or the intersection of a line with a shape[29]. This functionality is not only limited to geometry entities, it can be done with geographical bodies as well, namely lakes, rivers mountains, etc.
II-D ORM
The browser can create queries for a database that is connected to the server. A system is essential to translate the server’s request to the database. That is where ORM enters. Object-relational mapping (ORM)[30] is a technology that lets the user add, query, change and delete data from a database employing an object-oriented paradigm. The ORM library is an entirely normal library written in the same language as the rest of the code. The big advantage of using ORM is that it encapsulates the code required to manipulate the data, so SQL is not used. Direct interaction is done with the objects that use the same language as you. SQLAlchemy allows the use of various database management systems with just a configuration change. For the server, Python is used. Having that in mind, options for ORM were searched, and two of them were shortlisted: SQLAlchemy[31] and Django[32]. The main difference between using SQL and SQLAlchemy is that, while using the former generic table rows are received, but using SQLAlchemy a list with objects is returned, which can be immediately used for further development.
III Implementation
III-A Requirements
Before starting the implementation, it is important to outline the requirements of the program that will be developed :
-
•
The application should be remotely accessible.
-
•
The application should store the data generated by the researcher about proxies for the variation of sea levels (proxy data).
-
•
The proxy data about sea level variation should be organized in areas.
-
•
The application should store the publications where the data was published.
-
•
The application should store information about the indicator used to estimate the age of the sample.
-
•
Each data point should include the following information: coordinates, estimated age and height.
-
•
The application should present the data in maps (global with all the data and particular to a publication).
-
•
The application should create plots with the representation of the data for a specific area.
-
•
The plots should contain error bars for the age and height estimations.
-
•
The user should be allowed to compare different areas in the same plot.
-
•
The user should be able to download the data in tabular format.
-
•
The application should contain local information about the vertical land movement.
-
•
The application should provide forms for the introduction of data to the database.
III-B Data Model
In order to solve the problems explained, it was decided to build a relational database. The final result is illustrated in figure 3.
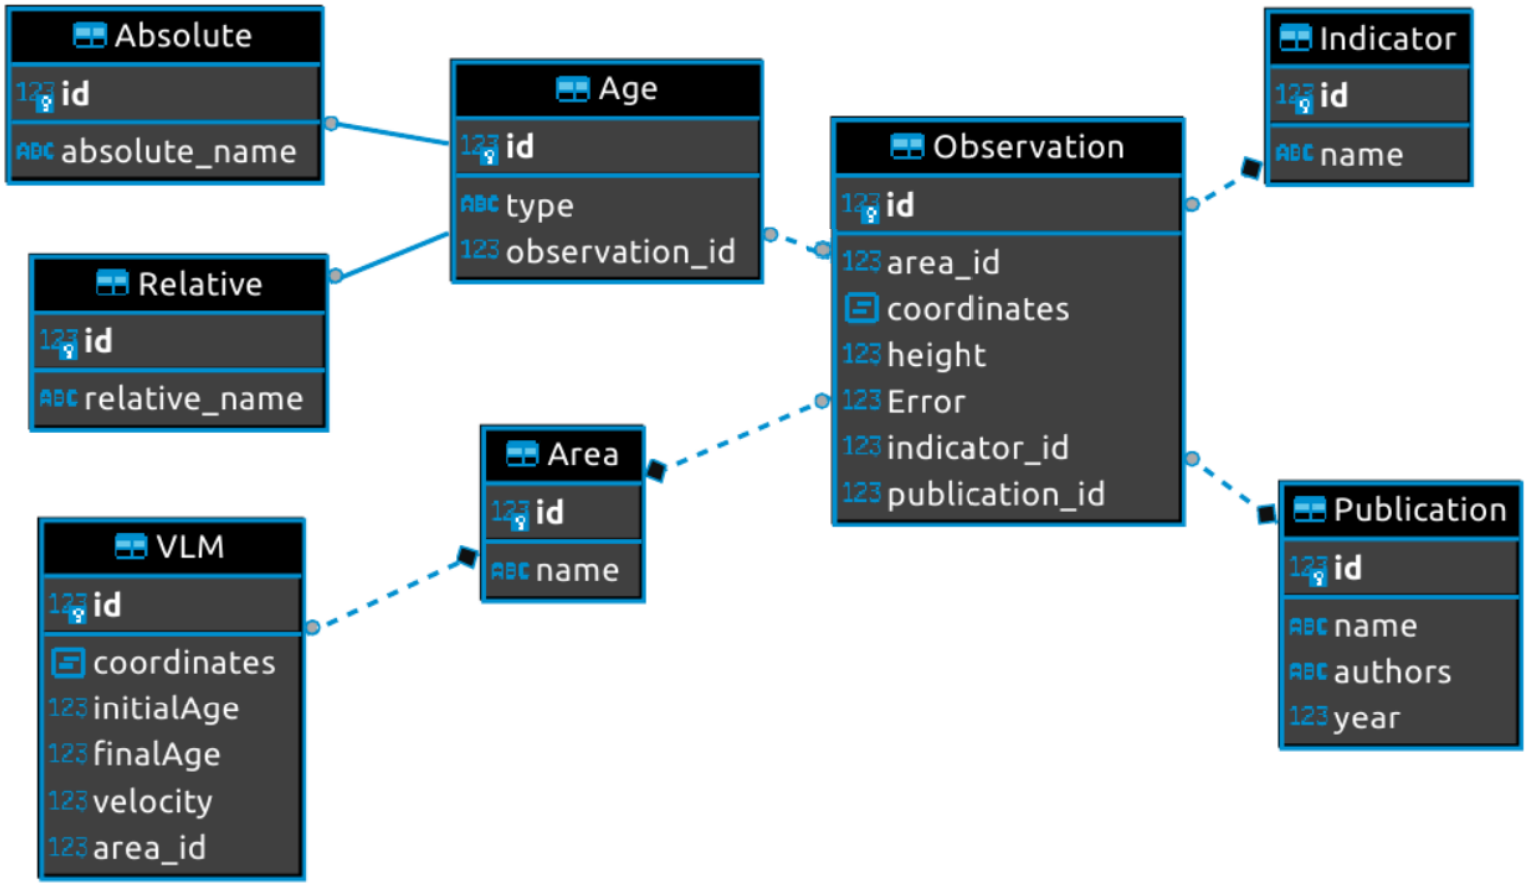
As seen in figure 3, there are many tables that save different data proxies. Every table has a primary key and its own ID. The tables are:
-
•
Area - a table that saves the area name and an ID number that is unique to each area.
-
•
Indicator - a table that saves the indicator name and an ID number that is unique to each Indicator.
-
•
Publication - a table that saves the publication name, its authors and the year on which it was published. It also has a unique ID number for each row.
-
•
Vertical Land Movement or VLM - a table that saves the coordinates of the point, the initial and final ages, the velocity in mm/yr, the ID of the area that is related to and a unique ID for each of its own entries.
-
•
Observation - a table that saves the coordinates and height of the sample, the error (in meters) associated with the Indicator, the ID of the area and publication and a unique ID for each observation.
-
•
Age - a table that saves the ID of the observation that it is related to, the type of age (Absolute or Relative) and a unique ID for each age. The Absolute and Relative ages table inherit the ID from its parent table age[33].
III-C Architecture
The three main components of the program devel- oped are the browser, the server and the database.
The browser is used as the client of the server. It is where the HTML[13] presents forms to in- troduce data along with showing tables, graphs and maps. The browser has the succeeding modules:
-
•
Add Data - A module for adding data to the database.
-
•
View Map - A module for viewing maps with the coordinates sent by the server.
-
•
Plot Graph - A module for plotting graphs with the information received from the server.
-
•
Download CSV - It is a module that transforms data listed on the web page to a CSV type file[34]
The server receives requests sent by the client(browser) and responds to them. To successfully respond to them, it needs to convert the requests to queries for the database. To do that translation, it uses ORM[30]. After receiving the result from the database, it sends the output to the browser to show it to the user. The server is comprised of the following modules :
-
•
Add Data - A module for adding data to the database.
-
•
List Data - A module to list data from the database
-
•
Vertical Land Movement - A module that stores the data related to vertical land movement.
-
•
View Map - A module that plots the observations’ coordinates on a flat 2D map.
-
•
Plot Graph - A module that draws the graphs for sea level variation throughout the ages.
The database receives queries from the server and it responds to them. It has to correctly save geographical data such as the point coordinates.
III-D Support System
To successfully implement this web application, it was important to plan in which language to code the three main modules of the program. The browser is mainly coded in HTML and JavaScript[14], the server in Python[35], using the Flask framework[36], and the Database in PostgreSQL[25].
Starting from the browser, HTML is used to create the web pages, to receive input from the users and to show them the output. JavaScript is utilized to create requests that are sent to the Flask server. The requests are read by the HTML from the user, built by JavaScript and sent to the server with help of REST and AJAX[15, 16] Afterward, the JavaScript receives the response and displays it using to the user using HTML. To produce the maps, JavaScript’s Leaflet[18] library is used. Leaflet is used because of how coding friendly and well documented it is. For plotting the graphs it is used the Plotly[21] library. Plotly’s easiness and lack of friction in processes such as adding data to the plot was the key factor, so it was decided to go ahead with Plotly. Additional advantages of using Plotly are the fact that the user can personalize the zoom settings as well as download the graph plotted to the computer directly, without having to take screenshots.
Relative to the server, it was coded in python using the Flask framework, mainly due to its simplicity and velocity. The server has the responsibility to receive requests sent by the browser and give them to the ORM with to query the database. After trying Django[32] and SQLAlchemy[31], SQLAlchemy was elected to be the bridge between server and database because the author of this thesis has some experience with it from a previous project. As the database has geographical elements, the GEOAlchemy[37] library is used to add support for spatial data types. Using SQLAlchemy and GeoAlchemy libraries, the first is used to translate the queries received by the server to SQL[38] and the latter to assist the first regarding spatial queries. With GeoAlchemy it is also possible to add certain geographical data types such as ’POINT’ to represent the latitude and longitude of an observation.
At last, the Database selected is PostgreSQL. It is an advanced form of SQL that allows the use of the normal SQL functions like query, primary keys, triggers, etc plus the use of Geospatial tools like GeoAlchemy and its Geometry library to enable the creation of POINT data type. PostGIS is also installed as an extender for PostgreSQL. Other options like MySQL[24] were rejected because GeoAlchemy only supports PostGIS, while GeoServer[23] and ArcGIS[22] were very complex to start programming.
III-E REST End Points
For a secure and trustworthy connection between browser and server, it was decided to implement it using REST endpoints. The REST Endpoints Implemented are the fol- lowing :
-
1.
”/API/Area/”, ’GET’ - Used to get the list of all areas.
-
2.
”/API/Pub/”, ’GET’ - Utilized to get the list of all publications.
-
3.
”/API/Obs/”, ’GET’ - It has the objective to get the list of all observations.
-
4.
”/API/Indicator/”, ’GET’ - Implemented to get the list of all indicators.
-
5.
”/API/VLM/”, ’GET’ - Exercised to get the list of all vertical land movements.
-
6.
”/API/GetName/’, ’POST’ - It has the goal to get a name of area or publication.
-
7.
”/API/GetObservations/”, ’POST’ - Employed to get a list of observations based on ID.
-
8.
”/API/AddArea/”, ’POST’ - Request used to create a new area.
-
9.
”/API/AddPub/”, ’POST’ - Request utilized to create a new publication.
-
10.
”/API/AddObs/”, ’POST’ - Request sent to create a new observation.
-
11.
”/API/AddInd/”, ’POST’ - Request used to create a new indicator.
-
12.
”/API/AddVLM/”, ’POST’ - Request used to create a new vertical land movement.
-
13.
”/API/GetChart/”, ’POST’ - created to plot a graph.
The returned values are then utilized to create the output shown to the user on the browser such as tables, maps and Graphs.
III-F Software Organization
With the browser and database already discussed, the focus of this section is on the server. The server is made of smaller modules. These modules are Add Data, List Data, View Map, Plot Graph and Vertical Land Movement.
Add Data is a module that adds data to the database. It can be an area, publication, ob servation, indicator or vertical land movement. To help with the standardization while adding data, an algorithm was implemented that converts ages from the Before Present Scale to the AD/BC scale. It does so by taking 1950 and subtracting the age introduced in the Before Present Scale. It utilizes the following REST endpoints already described in section 3.5:
-
•
”/API/AddArea/”, ’POST’
-
•
”/API/AddPub/”, ’POST’
-
•
”/API/AddObs/”, ’POST’
-
•
”/API/AddInd/”, ’POST’
-
•
”/API/AddVLM/”, ’POST’
List Data is a module used to list data from the database. It can be an area, publication, observation, indicator or vertical land movement. There is also the possibility to list observations for a particular area or publication. The module makes use of the upcoming REST endpoints already explained in section 3.5:
-
•
”/API/Area/”, ’GET’
-
•
”/API/Pub/”, ’GET’
-
•
”/API/Obs/”, ’GET’
-
•
”/API/Indicator/”, ’GET’
-
•
”/API/VLM/”, ’GET’
-
•
”/API/GetName/’, ’POST’
-
•
”/API/GetObservations/”, ’POST’
View Map is the module that plots the observations’ coordinates on a flat 2D map. Users can see all the points on the Database or filter for a particular area or publication. It uses the ensuing REST endpoints described in section 3.5:
-
•
”/API/Obs/”, ’GET’
-
•
”/API/GetObservations/”, ’POST’
Plot Graph is a module that draws the graphs for sea level variation throughout the ages. You can see it for each area individually, see the graphs for all the areas simultaneously and able or disable certain areas. The module also draws the horizontal and vertical error bars for the graphs. It makes use of the follow- ing REST endpoint described in section 3.5:
-
•
”/API/GetChart/”, ’POST’
Vertical Land Movement is the module that stores data related to the vertical land movement and later can be used for rectifying the data introduced on the database by applying a correcting factor related to tectonic movement and geographic location. It does not use any of the REST endpoints explained in section 3.5.
IV Results
This section presents how the requirements were fulfilled in the project.
IV-A The application should be remotely accessible
The creation of a web application satisfies this requirement. The historical sea level application runs on a browser, it is connected to a server that communicates to a database using an ORM. An API is also provided to send requests to the server and received information. It is also possible to develop other web applications that connect to the server and show data differently.
IV-B The application should store the data generated by the researcher about proxies for the variation of sea levels (proxy data)
The creation of a database with the model given in figure 3, utilized to store the different data types re- lated to an observation meets this requirement. The data is not only stored on a georeferenced database but there is also the possibility of doing spatial queries. This can be a foundation, where future works could be built.
IV-C The proxy data about sea level variation should be organized in areas
According to the UML provided in figure 3, a table with the name Area is created, that saves the name of the area and a unique ID to identify it. This table is related to the Observation table as well as the Vertical Land Movement table. Therefore, the proxy data is organized in areas. The papers, from where the data points are taken, organize them in areas as well. Those areas are the ones that later are plotted in the graphs.
IV-D The application should store the publications where the data was published
As stated by the UML given in figure 3, a table with the name Publication is created, that saves the name of the publication, the name of its’ authors, the year it was published and possesses a unique ID to identify it.
IV-E The application should store information about the indicator used to estimate the age of the sample
According to the UML given in figure 3, a table with the name Indicator is created, that saves the name of the indicator along with a unique ID to identify it. This table is related to the Observation table as well.
IV-F Each data point should include the following information: coordinates, estimated age and height
As stated by the UML provided in figure 3, a table with the name Observation is created, that saves the coordinates and the height they were found. It is related to the Age table, which saves the Age type(Absolute or Relative) as well as the value.
IV-G The application should present the datain maps (global with all the data and particular to a publication)
The application can show a list of all the publications in the database. By selecting one, it is possible to see a map with the coordinates points of observations taken from that publication. The application also has a tab called Map to see the location of all observations on the database.
IV-H The application should create plots with the representation of the data for a specific area
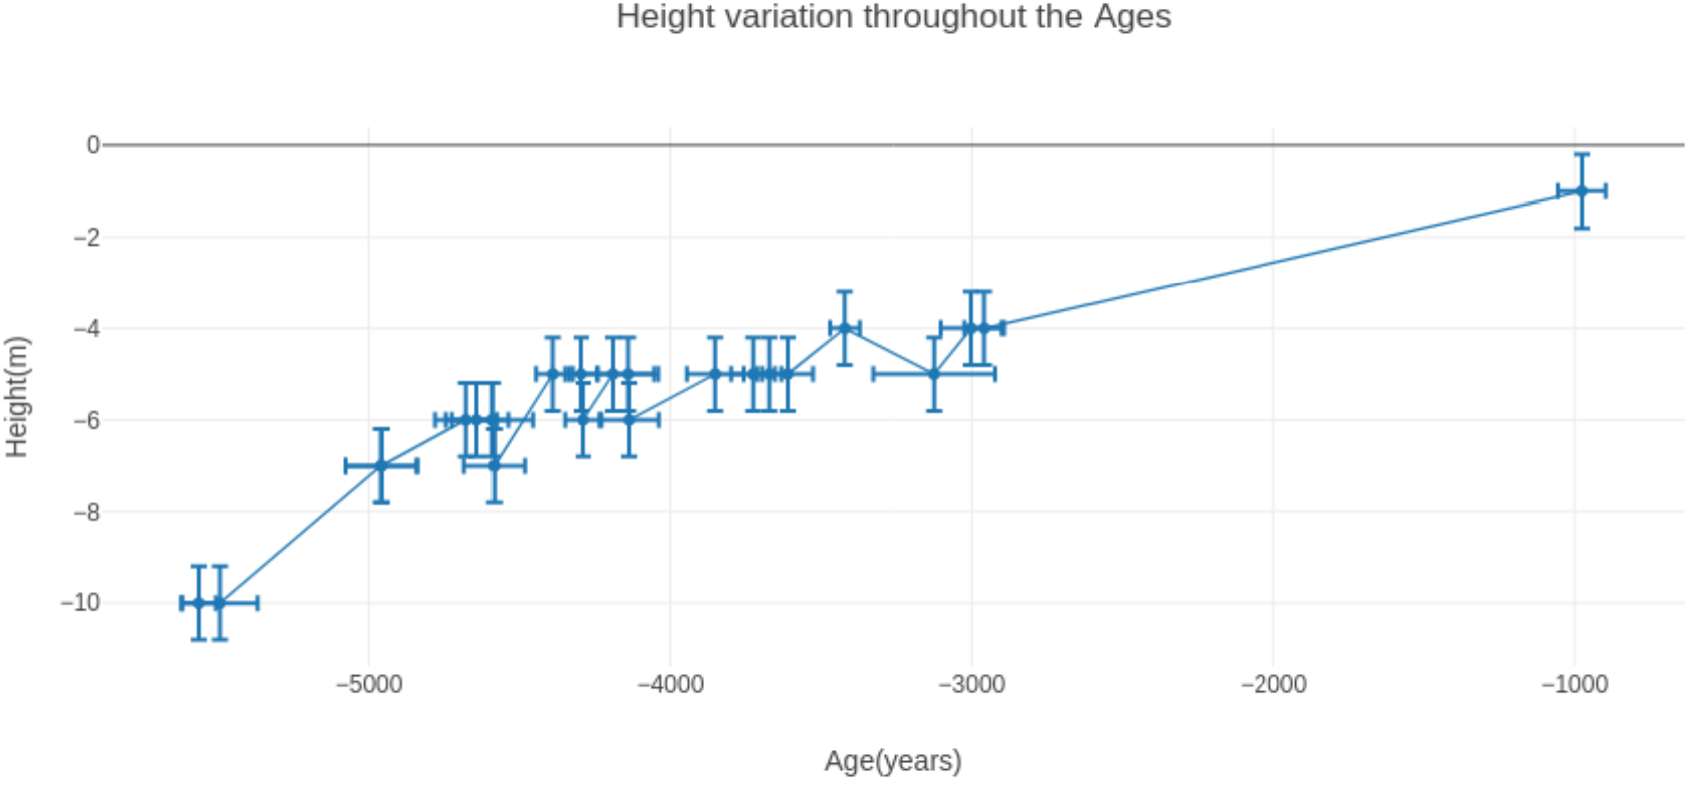
The application gives the possibility to see a list ofall areas in the database. By selecting one, it isfeasible to spot a graph with the data point aboutthat area. An example is given in figure 4.
IV-I The plots should contain error bars for the age and height estimations
As seen in figure 4, the plots have error bars. The vertical error bars are related to the height estimations, while the horizontal bars are related to the age estimation. Compared with the graph from citep19, it can be concluded that the graphs plotted by the application are similar to the graphs drawn on the research papers.
IV-J The user should be allowed to compare different areas in the same plot
The application has the option to see the graphs of all areas in the same plot. On that plot, there is a choice to hide and unhide certain areas.
IV-K The user should be able to download the data in tabular format
To download the data from the database to your device, at the end of every list on the web application a download button is placed. By clicking on it, the data from the table that the user is consulting gets written to a CSV file[3] and downloaded. As an example, if the table with the list of observations for a particular area was to be transformed and downloaded, the resulting CSV file would have the following columns : ID, Coordinates, Height, Age, Indicator and Error. The data in the down- loaded CSV file can be processed and used with other tools or applications.
IV-L The application should contain local information about the vertical land movement
As claimed by the UML provided in figure 3, a table with the name Vertical Land Movement is created, that saves the coordinates of the point, the initial and final Ages, the velocity and has a unique ID to identify it. This table is related to the area ta- ble as well. Thus, the application contains local information about vertical land movement. Besides the fact that data about vertical land movement is only stored and not processed, its’ existence in the database allows for the further development and implementation of a simpler model. This tool will be useful for future work about the relation between vertical land movement and mean sea level variation because it is possible to realize studies at a small and local scale along with at a larger and global scale.
IV-M The application should provide forms for the introduction of data to the database
The application provides forms for the user to in- troduce data into the database. The form seen in figure 5 is for adding observation to the database. Similar forms are available to introduce the differ- ent data types: Area, Publication, Indicator and Vertical Land Movement.
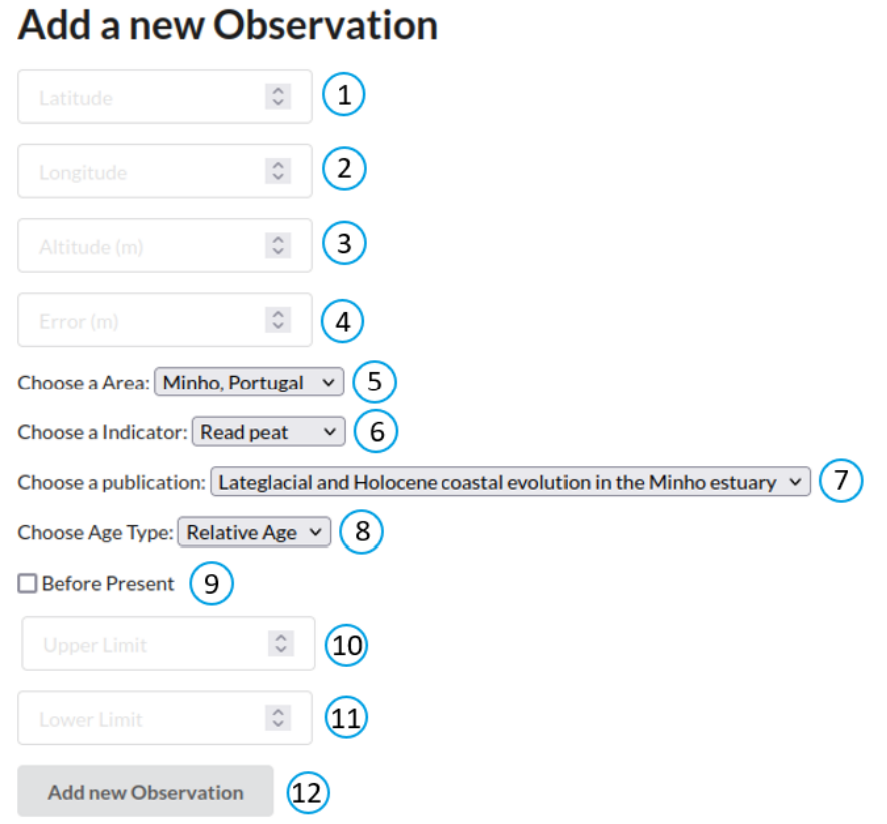
The input numbers in the figure 5 are:
-
1.
To add the Latitude coordinate. It has to be between -90 and 90 degrees.
-
2.
To put the Longitude coordinate. It has to be between -180 and 180 degrees.
-
3.
To introduce the altitude value.
-
4.
To write the error value(in meters).
-
5.
To choose the area related to the observation.
-
6.
To select the indicator used to estimate the observation’s age.
-
7.
To pick the publication on which the observation was published.
-
8.
For choosing the age type - absolute or relative. If absolute is selected, the text box on number eleven is hidden, and only the text box on number ten is used to input the age value.
-
9.
If the Before Present option is selected, it automatically converts the Age values to theAD/BC scale.
-
10.
To input the Upper Limit in case the Agetype is relative, in case the age type is absolute,this is the only text box used to input the value.
-
11.
To input the Lower Limit in case the Agetype is relative, if it is absolute, then this textbox is hidden.
-
12.
Button used to submit data into the database.
To ease the navigation between pages of the web application, a menu was created that is visible on all the pages. The menu has seven options :
-
•
Home - Brings the user back to the homepage.
-
•
Area - To add or list all areas.
-
•
Publication - To add or list all publications.
-
•
Observation - To add or list all observations. Indicator - To add or list all indicators.
-
•
Map - To see a map with all the different coordinates of the observations stored in the database.
-
•
Graphs - To see a graph with the mean sea level variation of all the areas stored in the database.
While hovering above some of the options, a drop down menu appears with two options: add or list all.
Conclusions Until now, there was not a platform that aggregated spatial information and allowed at a global scale the processing of data related to mean sea level variation and vertical land movement. With this thesis, a web application was created that aggregates data from numerous publications and makes them available in an organized and researcher friendly manner. The application can be accessed by anyone from a browser. A REST API was also developed, so requests can also be automated. The user can also add data to the database in a very simple and frictionless way. The data added is standard- ized, especially the age value can be converted from Before Present to the AD/BC scale. Data about the vertical land movement is also stored on the database and can be used for further work. The developed application lists the data in a clean and organized manner. That data can be viewed online or downloaded to a CSV file for other works. The developed application also has the possibility of viewing maps and plotting graphs. Additionally, there is the possibility of data comparison. The plots about the sea level variation throughout the ges can have graphs from more than one area enabling, this way, the comparison between two or more areas. This project, for the first time, allows the creation of interactive graphs (with features like zoom in/out and selecting which areas to hide or show) about the mean sea level variation. This new way of data presentation not only permits, easy comparison between distinct areas but also for the availability of this content on the web, to in crease the visibility of such problems. The graphs plotted are a tool used by specialists, who try to understand what kind of events occurred in those areas. However, these types of graphs help identify the time intervals on which the events might have happened. The current version only stores the values related to the vertical land movement. It is also the first time, that it was possible to aggregate on one platform these types of data at a global evel. This will allow scientists and data modellers, the development of new theories and/or models to explain the differences between the various areas. Using the spatial queries abilities of PostGIS, combined with the data available on the database about the vertical land movement, mainly the geographic coordinates, a model can be developed that automatically suggests corrections based on the location of the observations.
References
- [1] V. Masson-Delmotte, P. Zhai, A. Pirani, S. L. Connors, C. Péan, S. Berger, N. Caud, Y. Chen, L. Goldfarb, M. Gomis et al., “Climate change 2021: the physical science basis,” Contribution of working group I to the sixth assessment report of the intergovernmental panel on climate change, vol. 2, 2021.
- [2] S. Hallegatte, Shock waves: managing the impacts of climate change on poverty. World Bank Publications, 2016.
- [3] C. Small and R. J. Nicholls, “A global analysis of human settlement in coastal zones,” Journal of coastal research, pp. 584–599, 2003.
- [4] V. Gornitz, “Sea level change, post-glacial,” Encyclopedia of paleoclimatology and ancient environments, pp. 887–893, 2009.
- [5] N. S. Khan, B. P. Horton, S. Engelhart, A. Rovere, M. Vacchi, E. L. Ashe, T. E. Törnqvist, A. Dutton, M. P. Hijma, and I. Shennan, “Inception of a global atlas of sea levels since the last glacial maximum,” Quaternary Science Reviews, vol. 220, pp. 359–371, 2019. [Online]. Available: https://www.sciencedirect.com/science/article/pii/S0277379119306468
- [6] M. Siddall, E. J. Rohling, A. Almogi-Labin, C. Hemleben, D. Meischner, I. Schmelzer, and D. Smeed, “Sea-level fluctuations during the last glacial cycle,” Nature, vol. 423, no. 6942, pp. 853–858, 2003.
- [7] M. S. Kearney, Sea Level Indicators. Dordrecht: Springer Netherlands, 2009, pp. 899–902. [Online]. Available: https://doi.org/10.1007/978-1-4020-4411-3_209
- [8] A. García-Artola, P. Stéphan, A. Cearreta, R. E. Kopp, N. S. Khan, and B. P. Horton, “Holocene sea-level database from the atlantic coast of europe,” Quaternary Science Reviews, vol. 196, pp. 177–192, 2018.
- [9] M. Walker, Quaternary dating methods. John Wiley and Sons, 2005.
- [10] W. Li, X. Li, X. Mei, F. Zhang, J. Xu, C. Liu, C. Wei, and Q. Liu, “A review of current and emerging approaches for quaternary marine sediment dating,” Science of The Total Environment, vol. 780, p. 146522, 2021. [Online]. Available: https://www.sciencedirect.com/science/article/pii/S0048969721015904
- [11] K. Lambeck, C. D. Woodroffe, F. Antonioli, M. Anzidei, W. R. Gehrels, J. Laborel, and A. J. Wright, Paleoenvironmental Records, Geophysical Modeling, and Reconstruction of Sea-Level Trends and Variability on Centennial and Longer Timescales. John Wiley and Sons, Ltd, 2010, ch. 4, pp. 61–121. [Online]. Available: https://onlinelibrary.wiley.com/doi/abs/10.1002/9781444323276.ch4
- [12] G. Spada, “Glacial isostatic adjustment and contemporary sea level rise: An overview,” Integrative Study of the Mean Sea Level and Its Components, pp. 155–187, 2017.
- [13] M. M. WHATWG (Apple, Google, “Html standard,” 2021, (Accessed 30.10.2021). [Online]. Available: https://html.spec.whatwg.org/
- [14] E. International, “Javascript,” 2021, (Accessed 30.10.2021). [Online]. Available: https://www.ecma-international.org/publications-and-standards/standards/ecma-262/
- [15] R. T. Fielding, Architectural styles and the design of network-based software architectures. University of California, Irvine, 2000.
- [16] O. Foundation and jQuery contributors, “Ajax,” 2021, (Accessed 30.10.2021). [Online]. Available: https://api.jquery.com/
- [17] Google, “Google maps,” 2021, (Accessed 30.10.2021). [Online]. Available: https://developers.google.com/maps
- [18] V. Agafonkin, “Leaflet,” 2021, (Accessed 30.10.2021). [Online]. Available: https://leafletjs.com/
- [19] JSON.org, “Json,” 2002, (Accessed 30.10.2021). [Online]. Available: https:///www.json.org
- [20] Chart.js contributors, “Chart.js,” 2021, (Accessed 30.10.2021). [Online]. Available: https://www.chartjs.org/
- [21] Plotly, “Plotly.js,” 2021, (Accessed 30.10.2021). [Online]. Available: https://plotly.com/
- [22] ESRI., “Arcgis,” 2021, (Accessed 30.10.2021). [Online]. Available: https://www.esri.com/en-us/arcgis/products/arcgis-desktop/resources
- [23] O. S. G. Foundation., “Geoserver.” 2021, (Accessed 30.10.2021). [Online]. Available: http://geoserver.org/
- [24] O. C. and/or its affiliates, “Mysql,” 2021, (Accessed 30.10.2021). [Online]. Available: https://www.mysql.com/
- [25] T. P. G. D. Group, “Postgresql.” 2021, (Accessed 30.10.2021). [Online]. Available: https://www.postgresql.org
- [26] O. C. and/or its affiliates, “Mysql spatial data types,” 2021, (Accessed 30.10.2021). [Online]. Available: https://dev.mysql.com/doc/refman/8.0/en/spatial-types.html
- [27] P. P. S. Committee, “Postgis,” 2021, (Accessed 30.10.2021). [Online]. Available: https://postgis.net/
- [28] XXXXXXXXXXXXXX, “Postgis: Data management and queries,” (Accessed 30.10.2021). [Online]. Available: https://postgis.net/docs/manual-1.4/ch04.html
- [29] P. P. S. Committee, “Postgis: Building applications,” 2021, (Accessed 30.10.2021). [Online]. Available: https://postgis.net/docs/manual-1.4/ch05.html
- [30] XXXXXXXXXXXXXX, “Object–relational mapping(orm),” (Accessed 30.10.2021). [Online]. Available: https://en.wikipedia.org/wiki/Object%E2%80%93relational_mapping
- [31] S. authors and contributors, “Sqlalchemy.” 2021, (Accessed 30.10.2021). [Online]. Available: https://www.sqlalchemy.org
- [32] D. S. Foundation, “Django.” 2021, (Accessed 30.10.2021). [Online]. Available: https://www.djangoproject.com/
- [33] S. authors and contributors, “Sql inheritance hierarchies,” 2021, (Accessed 30.10.2021). [Online]. Available: https://docs.sqlalchemy.org/en/14/orm/inheritance.html
- [34] Y. Shafranovich, “Comma-separated values,” 2005, (Accessed 30.10.2021). [Online]. Available: https://datatracker.ietf.org/doc/html/rfc4180
- [35] P. S. Foundation, “Python,” 2021, (Accessed 30.10.2021). [Online]. Available: https://www.python.org/
- [36] Pallets, “Flask,” 2010, (Accessed 30.10.2021). [Online]. Available: https://flask.palletsprojects.com/en/2.0.x/
- [37] E. Lemoine, “Geoalchemy,” 2012, (Accessed 30.10.2021). [Online]. Available: https://www.geoalchemy-2.readthedocs.io/
- [38] ISO/IEC, “Sql.” 2016, (Accessed 30.10.2021). [Online]. Available: https://www.iso.org/standard/63555.html/