Invisible Finger: Practical Electromagnetic Interference Attack on Touchscreen-based Electronic Devices
Abstract
Touchscreen-based electronic devices such as smart phones and smart tablets are widely used in our daily life. While the security of electronic devices have been heavily investigated recently, the resilience of touchscreens against various attacks has yet to be thoroughly investigated. In this paper, for the first time, we show that touchscreen-based electronic devices are vulnerable to intentional electromagnetic interference (IEMI) attacks in a systematic way and how to conduct this attack in a practical way. Our contribution lies in not just demonstrating the attack, but also analyzing and quantifying the underlying mechanism allowing the novel IEMI attack on touchscreens in detail. We show how to calculate both the minimum amount of electric field and signal frequency required to induce touchscreen ghost touches. We further analyze our IEMI attack on real touchscreens with different magnitudes, frequencies, duration, and multitouch patterns. The mechanism of controlling the touchscreen-enabled electronic devices with IEMI signals is also elaborated. We design and evaluate an out-of-sight touchscreen locator and touch injection feedback mechanism to assist a practical IEMI attack. Our attack works directly on the touchscreen circuit regardless of the touchscreen scanning mechanism or operating system. Our attack can inject short-tap, long-press, and omni-directional gestures on touchscreens from a distance larger than the average thickness of common tabletops. Compared with the state-of-the-art touchscreen attack, ours can accurately inject different types of touch events without the need for sensing signal synchronization, which makes our attack more robust and practical. In addition, rather than showing a simple proof-of-concept attack, we present and demonstrate the first ready-to-use IEMI based touchscreen attack vector with end-to-end attack scenarios.
I Introduction
Consumer electronic devices with touchscreens, such as smartphones, tablets, and laptops, have become integral parts of our daily lives because touchscreen technology is both convenient and intuitive to use. In practice, touchscreens recognize a touch event by sensing the electric field of the electrodes under the screen, thereby allowing people to give commands by performing touch, swipe, and other gestures. The commands are then converted to electric signals and help control the systems/apps in the target device. For vehicles or medical devices incorporating touchscreens, their correct functionality is tied to user safety.
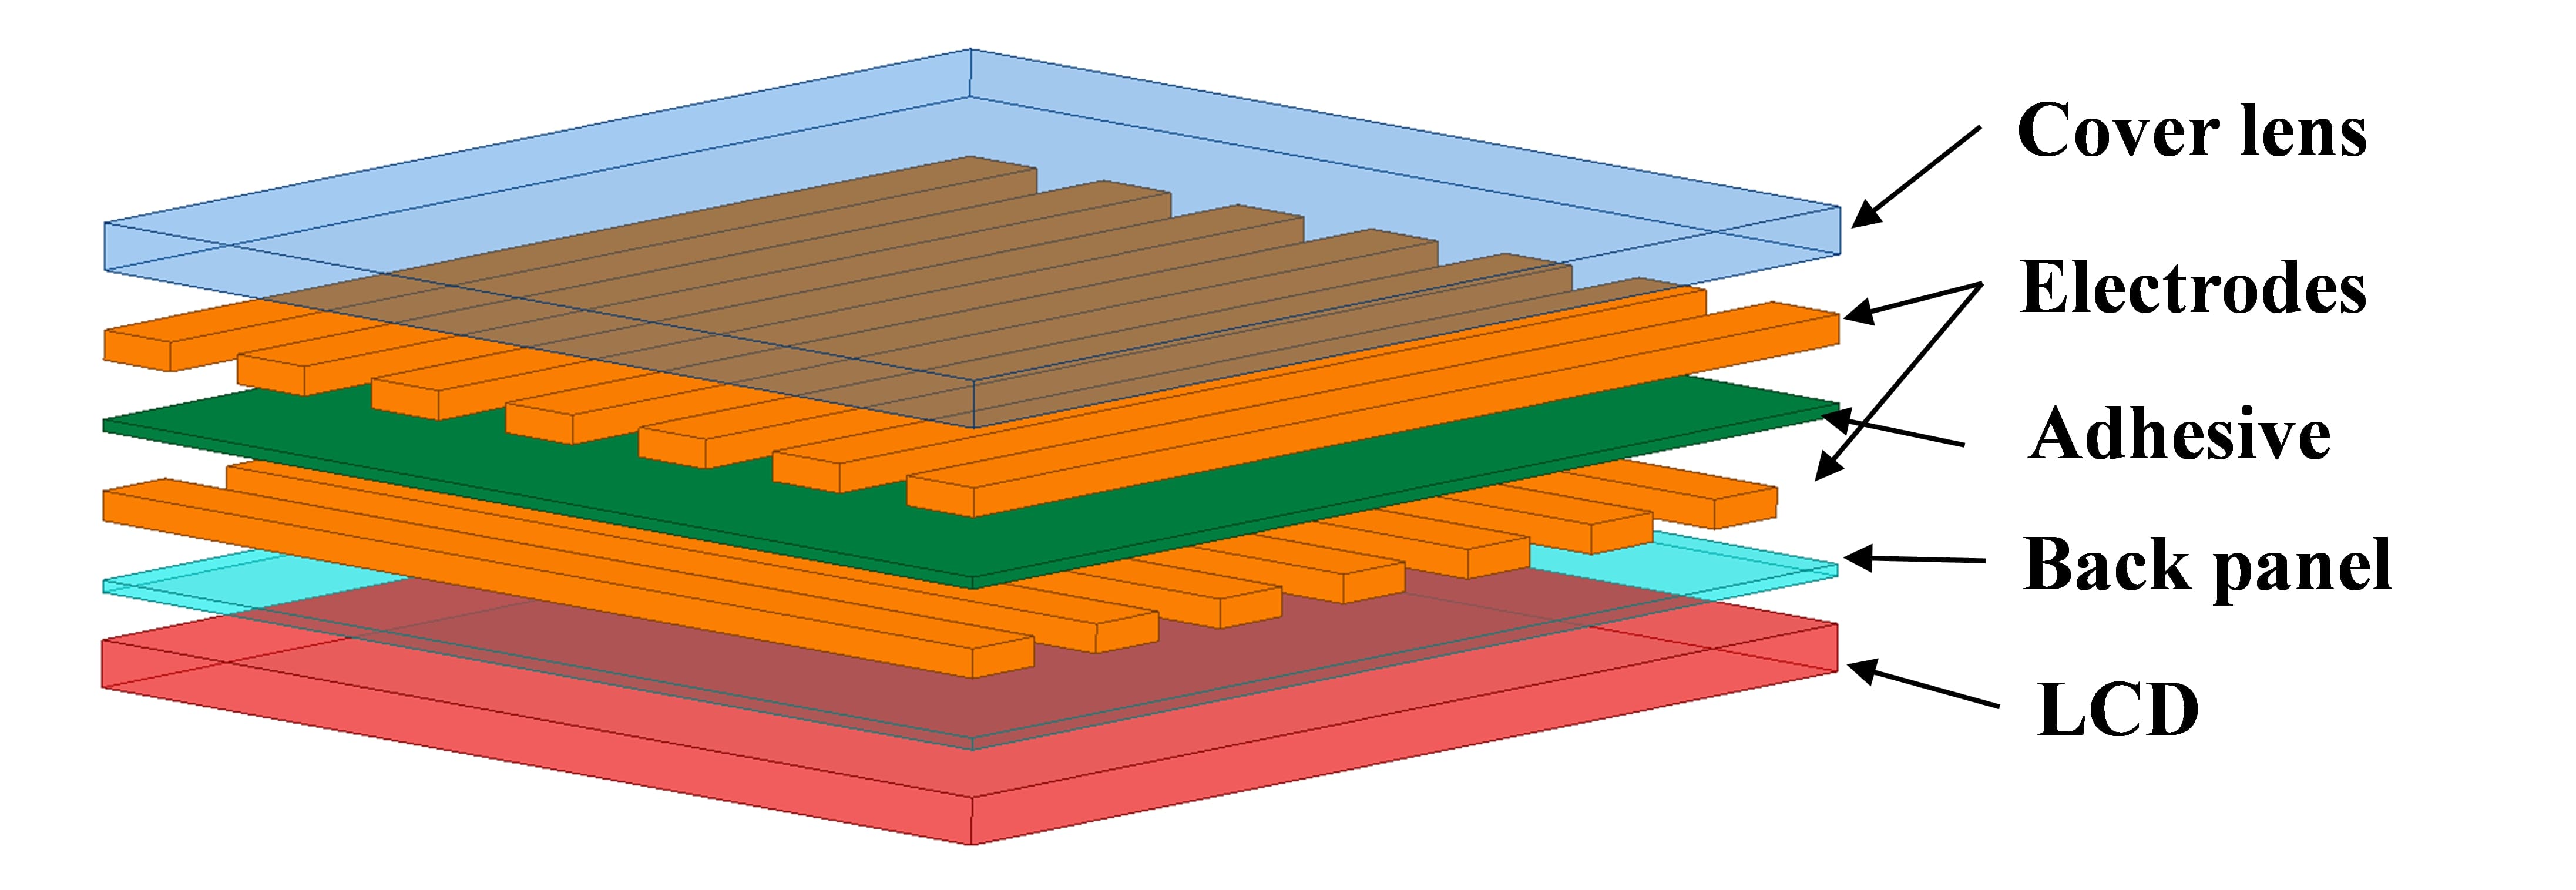
Among all touchscreen sensing technologies, the capacitive touchscreen is the most popular because it provides a more pleasant user experience and is cost effective. A typical capacitive sensing touchscreen is shown in Fig. 1. There is an array of electrodes under the cover lens of the touchscreen with an adhesive layer between the electrodes that provides mechanical support as well as insulation. The back panel provides insulation between the electrodes and the liquid crystal display (LCD) screen. The electrodes, adhesive, and back panel are made with optically transparent material. The cover lens is usually made of glass and protects the electrode and the circuit [1]. When the touchscreen is on, a driver circuit delivers a voltage between the two layers of electrodes. The electric field between the two layers of electrodes is constantly sensed. When a person makes contact with the touchscreen, the electric field between the electrode layers are disturbed by their impedance. Touch events are recognized by sensing this disturbance in the electric field.
Capacitive sensing touchscreens have already been targeted by several attacks, however, the majority of touchscreen attacks are passive attacks, e.g., inferring keystrokes [2, 3, 4, 5, 6], revealing the content on the touchscreen [7, 8, 9], etc. Compared to passive touchscreen attacks, active attacks [10, 11] that manipulate the touchscreen content and/or events are rare, uncontrolled, and typically require the support of a human touch.
In this paper, we present an active touchscreen attack requiring no physical contact using radiated intentional electromagnetic interference (IEMI). It is the first radiated IEMI touchscreen attack capable of stably recreating complex multi-touch and omni-directonal swipe gestures. Recent work [12] presents a synchronization-based IEMI touchscreen injection attack and demonstrates several practical attack scenarios. However, because of their reliance on synchronization their range of injected touch events is significantly limited. We also find, see Section VIII-B and Appendix A, that both the implementation of synchronization and scanning vary by device making the attack difficult to generalize. On the other hand, our attack does not rely on synchronization or the implementation details of scanning to inject stable short-tap, long-press, and omni-directional swipe touch events. This is due in part because we specifically tie the working theory of capacitive touchscreen technology to radiated IEMI electric field strength and signal frequency to precisely and reliably control injected touch events. This in depth analysis allows fully understanding the characteristics of the IEMI disturbance interpreted by the touchscreen as a human touch.
The main contributions of the paper are listed as follows.
-
•
We present the underlying mechanism of IEMI based attacks on modern capacitive touchscreens.
-
•
The principle of IEMI touchscreen attacks is disclosed both theoretically and empirically. Crucial factors that influence the effectiveness, including the magnitude, frequency, phase, and duration are elaborated.
-
•
We present an IEMI touchscreen attack capable of injecting both accurate and complex touch events and gestures such as short-tap, long-press, and omni-directional swipes mimicking a human touch. 111Readers can find recorded attack videos by visiting https://invisiblefinger.click/..
-
•
We demonstrate practical IEMI touchscreen attacks by designing and implementing an antenna array, screen locator, and injection detector to bridge the gap between simple touch event generation and real-world IEMI attack scenarios. We show and evaluate several practical attacks using multiple commercial devices under different attack scenarios.
II Background
In this section, we review background knowledge on the sensing strategy of capacitive touchscreens with a simplified touchscreen model.
II-A Capacitive Touchscreens
There are two types of capacitive touchscreens which are widely used [13], self-capacitance touchscreens and mutual capacitance touchscreens, shown in Fig. LABEL:fig:electrode_sensors_a and Fig. LABEL:fig:electrode_sensors_b respectively. The represents the capacitance change in the presence of a human finger. When is sensed, a touch event is recognized [14].
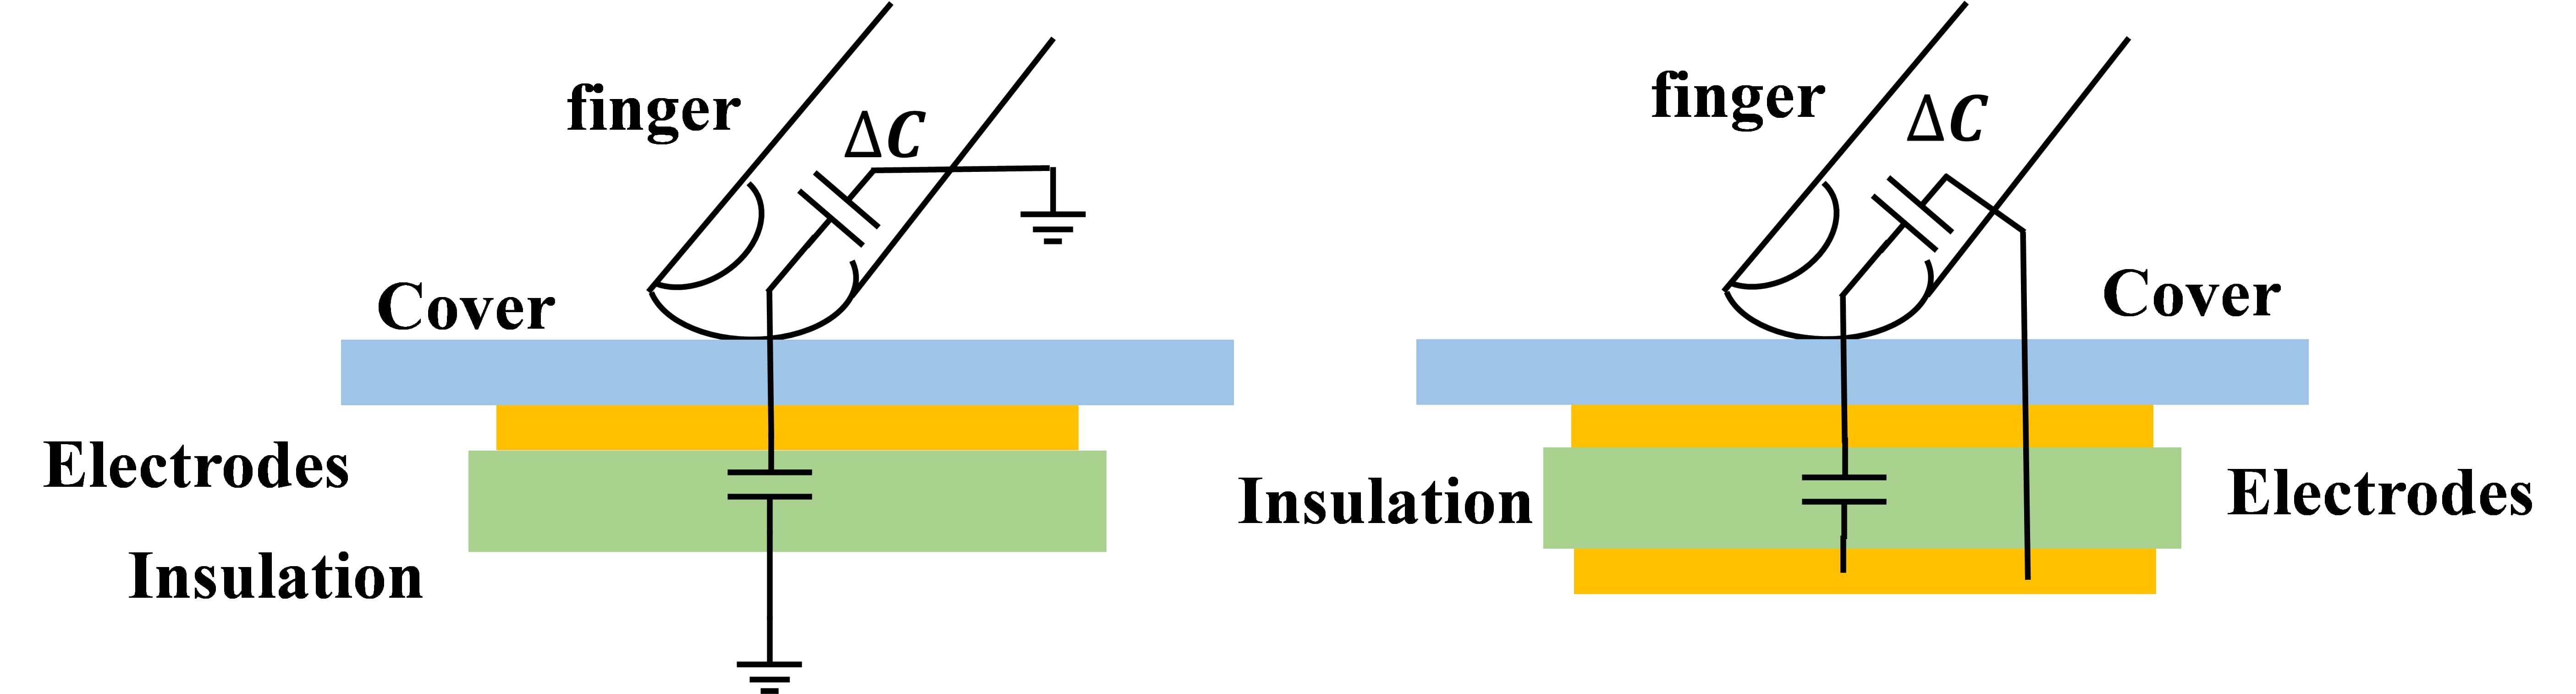
The self-capacitance touchscreen has a disadvantage because it cannot recognize diagonal touches. In consumer electronics, the ability to sense multi-touch events is beneficial. In contrast, the mutual capacitance touchscreen can sense several simultaneous touches [13]. Therefore, the mutual capacitance touchscreen is more popular in consumer electronics [15]. In this paper, we mainly discuss the mutual capacitance touchscreen although our attack method can also be applied to the self-capacitance touchscreen without loss of generality.
II-B Mutual Capacitance Touchscreen
A typical structure of a mutual capacitance touch screen system is shown in Fig. 3. The system consists of transmitter (Tx) and receiver (Rx) electrodes as well as a capacitance to digital converter (CDC) chip. In the CDC chip, the capacitance between the electrodes is measured with a charge transfer (QT) sensor. The circuit topology of a QT sensor with an integrator is shown in Fig. 4. The QT sensor converts the measured capacitance to an analog voltage signal that is then converted to a digital signal by an analog to digital converter (ADC). A microprocessor will read in and process the converted digital signal.
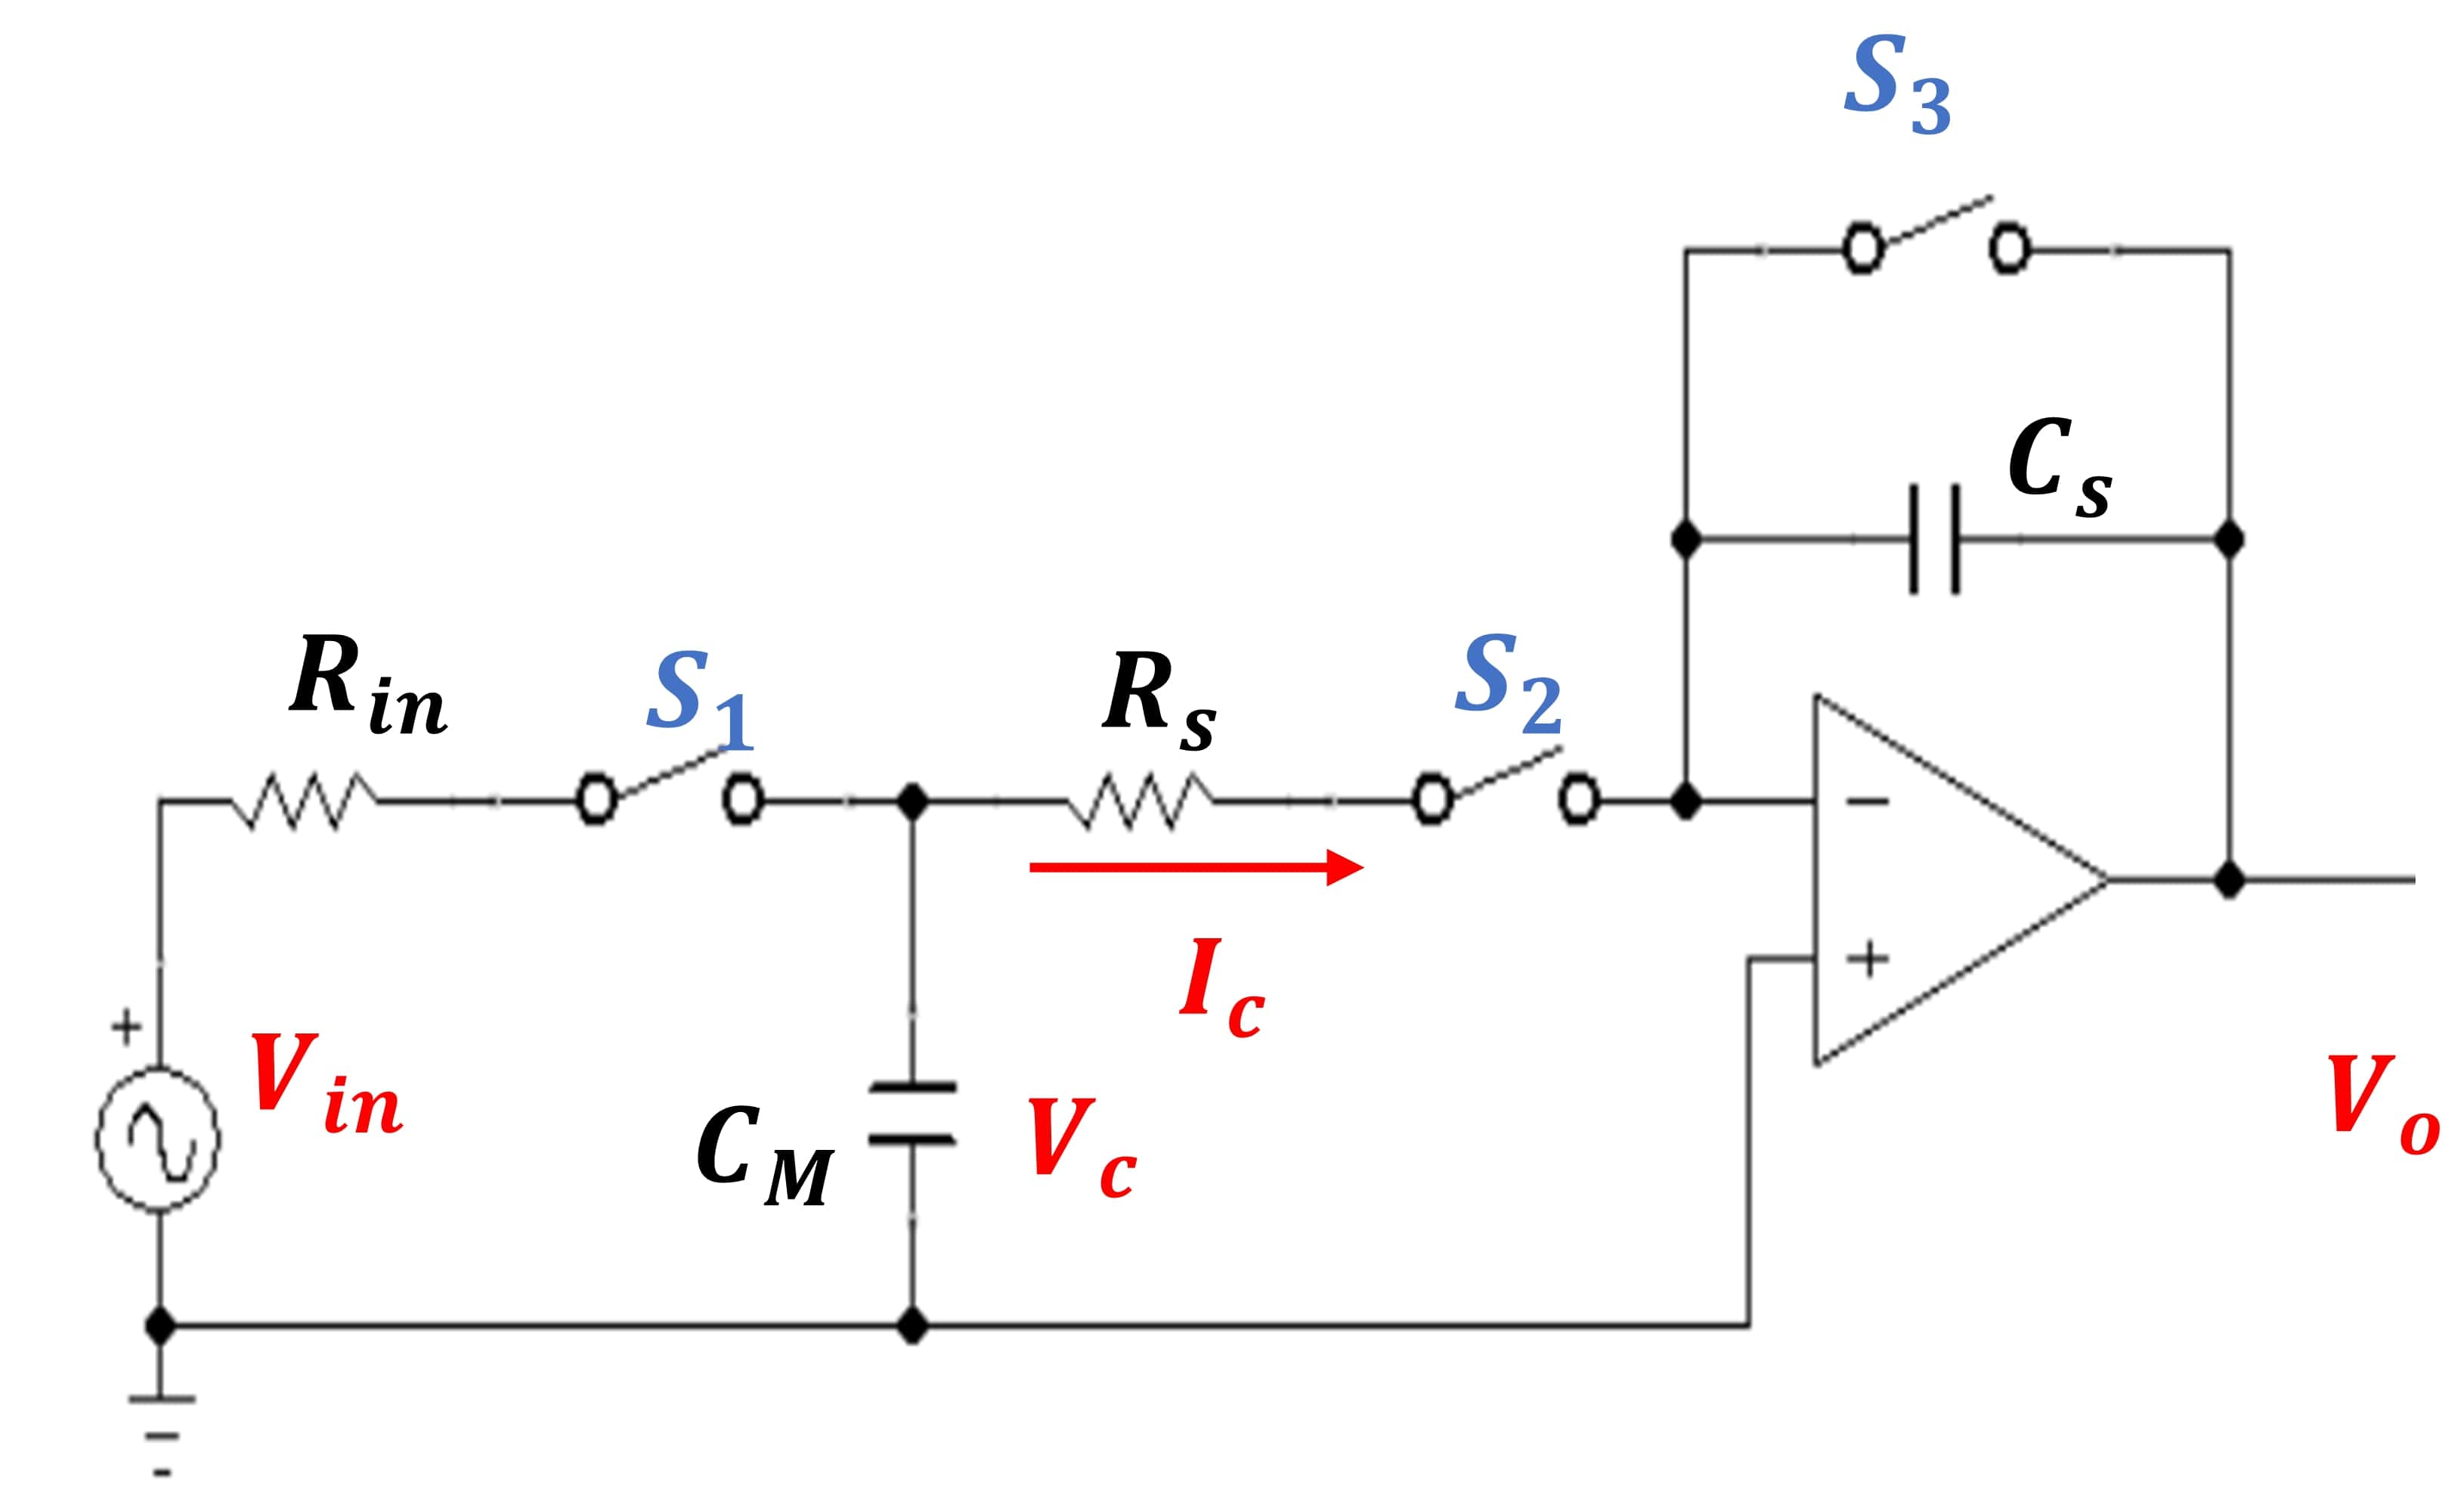
During normal operation, the microprocessor controls three switches, , , and (see Fig. 4). Fig. 5 gives an example of how the control signals are switched periodically. When the switch is closed, resets and the excitation signal charges the mutual capacitance . During this charging period, the switches and are open and the voltage across is calculated as follows.
| (1) |
After is charged, is opened and is closed. The charge stored in will be transferred to . Assuming an ideal op-amp, the current flow through and are equal. The current can be calculated in (2) or (3).
| (2) |
| (3) |
By solving and integrating (2) and (3) simultaneously over the time with initial conditions, the output voltage is derived in (4).
| (4) |
Based on (4), the mutual capacitance can be calculated from . When the sensing period is completed, at the beginning of the next period, is discharged by closing .
When a touch event occurs, is changed by due to the presence of a human finger. This change can be either positive or negative [16] depending on human impedance variations [17]. The output voltage can be calculated as follows when the touch event occurs.
| (5) |
where is the output voltage variation and is calculated as follows.
| (6) |
A touch event is recognized if the following criterion is met.
| (7) |
where is the threshold voltage.
The sensing strategy in Fig. 5 senses and compares the output voltage to every cycle’s threshold voltage. In many applications, a multi-cycle sensing strategy is usually used to get a more accurate result for each touch event by measuring and multiple times. In a multi-cycle sensing strategy, is reset every cycles. In this way, and are the sum of the voltages in cycles. The touch recognition criterion in (7) in this case is as follows.
| (8) |
where is the threshold voltage defined for the cycle sensing strategy. If the voltage variations in these cycles are the same, then we have .
Based on (1) - (8), the between every pair of electrodes can be measured by QT sensors. The locations of the electrodes represent the touchable locations on the touchscreen.
III Threat Model
In this paper, we assume that the attacker is equipped with tools that can generate IEMI signals including electrode plates, a signal generator and an RF power amplifier. The electrode plates are used to radiate IEMI signals and can be hidden under a table or desk (check our experimental setup in Section IX for more details). We further assume that the victim’s device is equipped with a capacitive touchscreen. We do not require the victim to have a certain brand of touchscreen device, nor do we have any limitations on the operating system. We aim to mimic a real world setting in which a victim puts their smart device on the table under which the electrode plates are attached. We assume the victim puts the smart device face down on the table, a typical way to prevent screen eavesdropping. The attack does not need to have prior knowledge of the phone location or orientation. The attacker can use the electrode plates to generate a precise touch event on the screen and further manipulate the victim device to perform security oriented attacks, such as connecting to Apple headphones to remotely control the victim device, or installing malicious applications.
IV IEMI Attack Preliminaries
In this section, we will present the fundamental electromagnetic concepts and derive the corresponding circuit model of the touchscreen under the IEMI attack. The concept and the model here pave the way to systematically analyze the behavior of a touchscreen under IEMI attacks.
IV-A IEMI Attack Intuition
From Section II, we learned that a touch event is sensed if the output voltage variation, , is larger than the threshold voltage, . Therefore, a ghost touch event can be induced when a radiated IEMI signal causes to exceed the threshold voltage, which allows attackers to control the device without physically touching the screen.
IV-B Generating a Targeted Radiated IEMI Signal
There are multiple ways to generate the radiated IEMI signal. A simple and straightforward method is to generate an electric field using two electrode plates that are facing each other. It is also possible to generate the electric field with phased antenna arrays where the direction of the IEMI is controlled by the array factor. The third method is to leverage directional antennas, such as Log-periodic antennas or Yagi-Uda [18] antennas.
Based on our attacking principle analysis later in this paper, electrodes (near-field antenna) are more suitable for existing smart touchscreen enabled electronic devices, therefore, our work focuses on an electrode-based IEMI attack and we will show that only one electrode is enough to perform an attack. For convenience, we simply call an electrode (a near-field antenna) as an antenna in later analysis.
IV-C Effect of Radiated IEMI on a Touchscreen
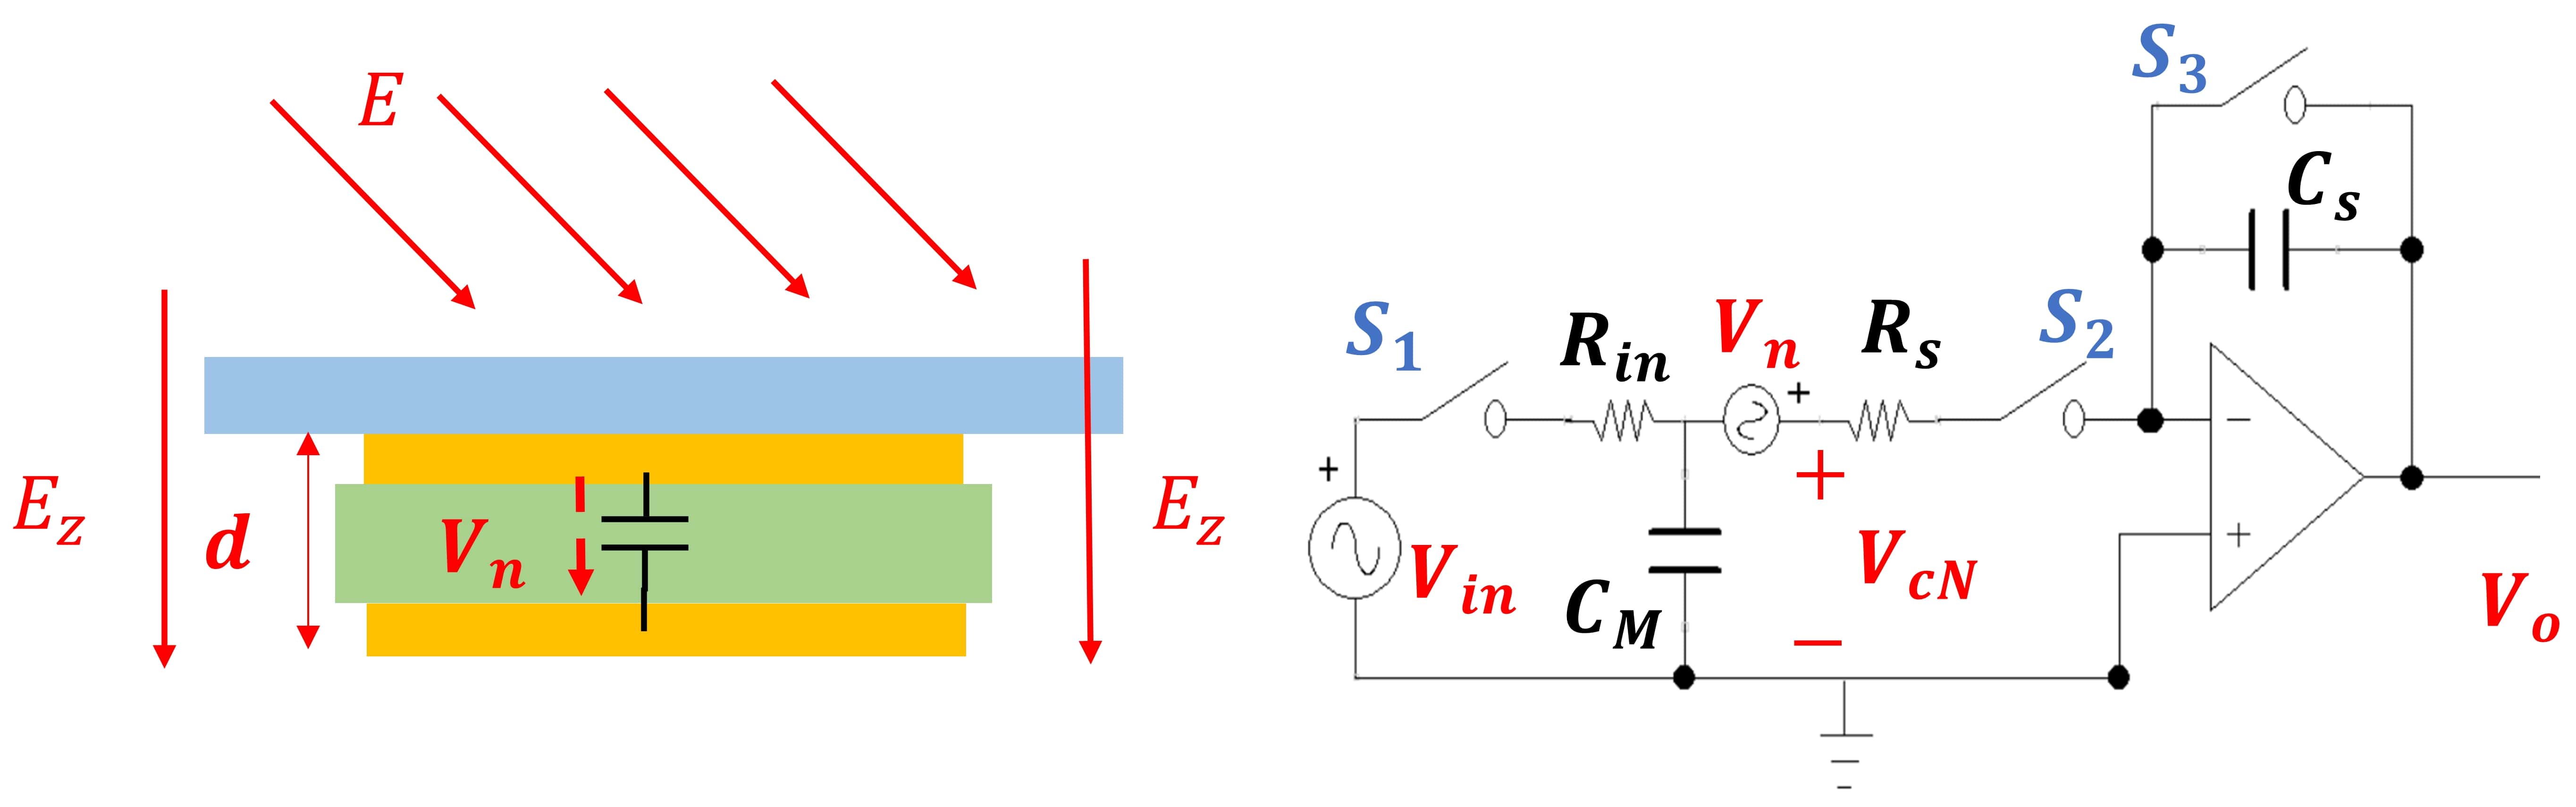
Fig. 6 depicts the electric field (referred to as E field hereafter) interference due to an external E field on a touchscreen, and its effect on the equivalent QT sensor circuit. The presence of an external E field induces a displacement current that flows through and adds or removes charge from the mutual capacitance touchscreen electrodes. Note that of the QT sensor depends on the total charge stored in the mutual capacitance . Thus, the measured output voltage variation is controlled by the targeted E field and can induce ghost touches.
IV-D Relationship of IEMI E Field Strength and Touchscreen Attack
To introduce a touch event with an IEMI attack, the E field strength needs to meet certain requirements. The E field interference on a touchscreen is shown in Fig. LABEL:figs:E_field_interference_a. The critical E field that is required to cause a ghost touch is defined as and can be calculated as follows. The detailed derivation process can be found in Appendix C.
We assume is the output voltage variation caused by the IEMI noise. To generate the ghost touch, we need to fulfill the following requirement, i.e.,
| (9) |
where , representing the charge change caused by the real touch. Solving (C-13), (C-15) and (9) simultaneously,
| (10) |
Based on (10), if is larger than , a ghost touch is successfully generated.
Simulation Validation of Touchscreen Response to Radiated IEMI: Fig. LABEL:figs:simulated_output_voltage_a and LABEL:figs:simulated_output_voltage_b show the simulated of a single QT sensor under a finger touch and IEMI attack based on the developed model, respectively. For this simulation, switches - are controlled with 100kHz signals as shown in Fig. 5. All simulation parameters are listed in Table I. The touch event is simulated using a positive 0.5 pF capacitance change. The IEMI signal is simulated using a noise voltage source at the input of the QT sensor. is set to 2.75 V. To cause a ghost touch, should meet the requirement in 11.
| (11) |
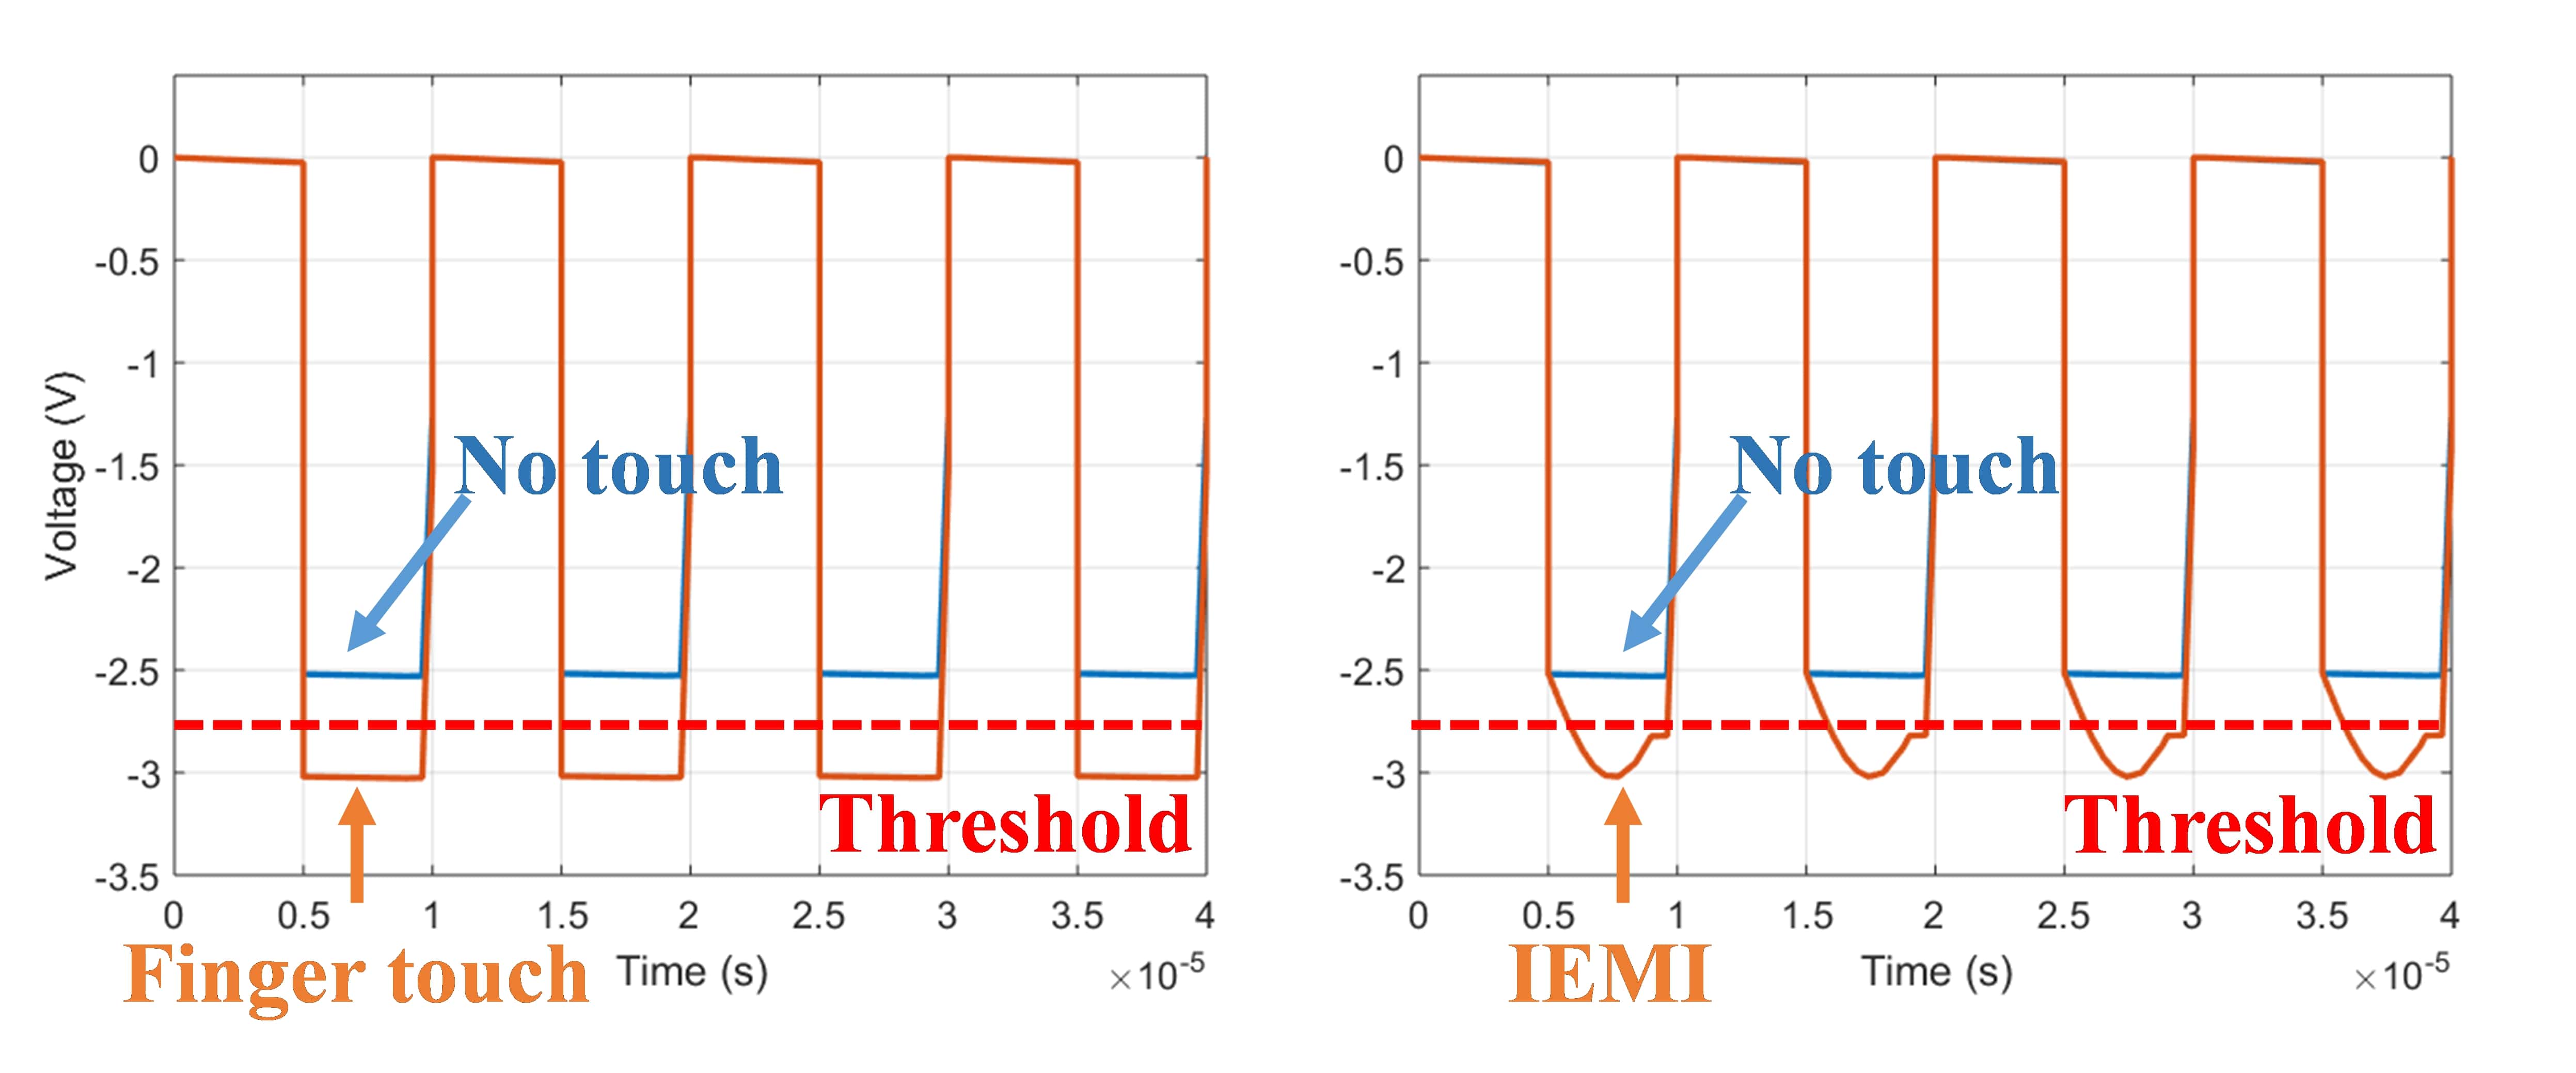
As shown in Fig. LABEL:figs:simulated_output_voltage_a, changes when there is a finger touch due to the change in capacitance. Once exceeds , a touch event is recognized. Under the simulated IEMI attack (shown in Fig. LABEL:figs:simulated_output_voltage_b), exceeds even when there is no touch. This validates our QT sensor model analysis, and motivates our subsequent experiments for generating ghost touch events in real scenarios.
| Parameter | Value | Parameter | Value |
|---|---|---|---|
| 5 V | 3 pF | ||
| 1 | 10 pF | ||
| 1 | 0.5 pF | ||
| 2.75 V | 0.8V/100kHz |
IV-E Relationship of IEMI Frequencies and a Successful Attack
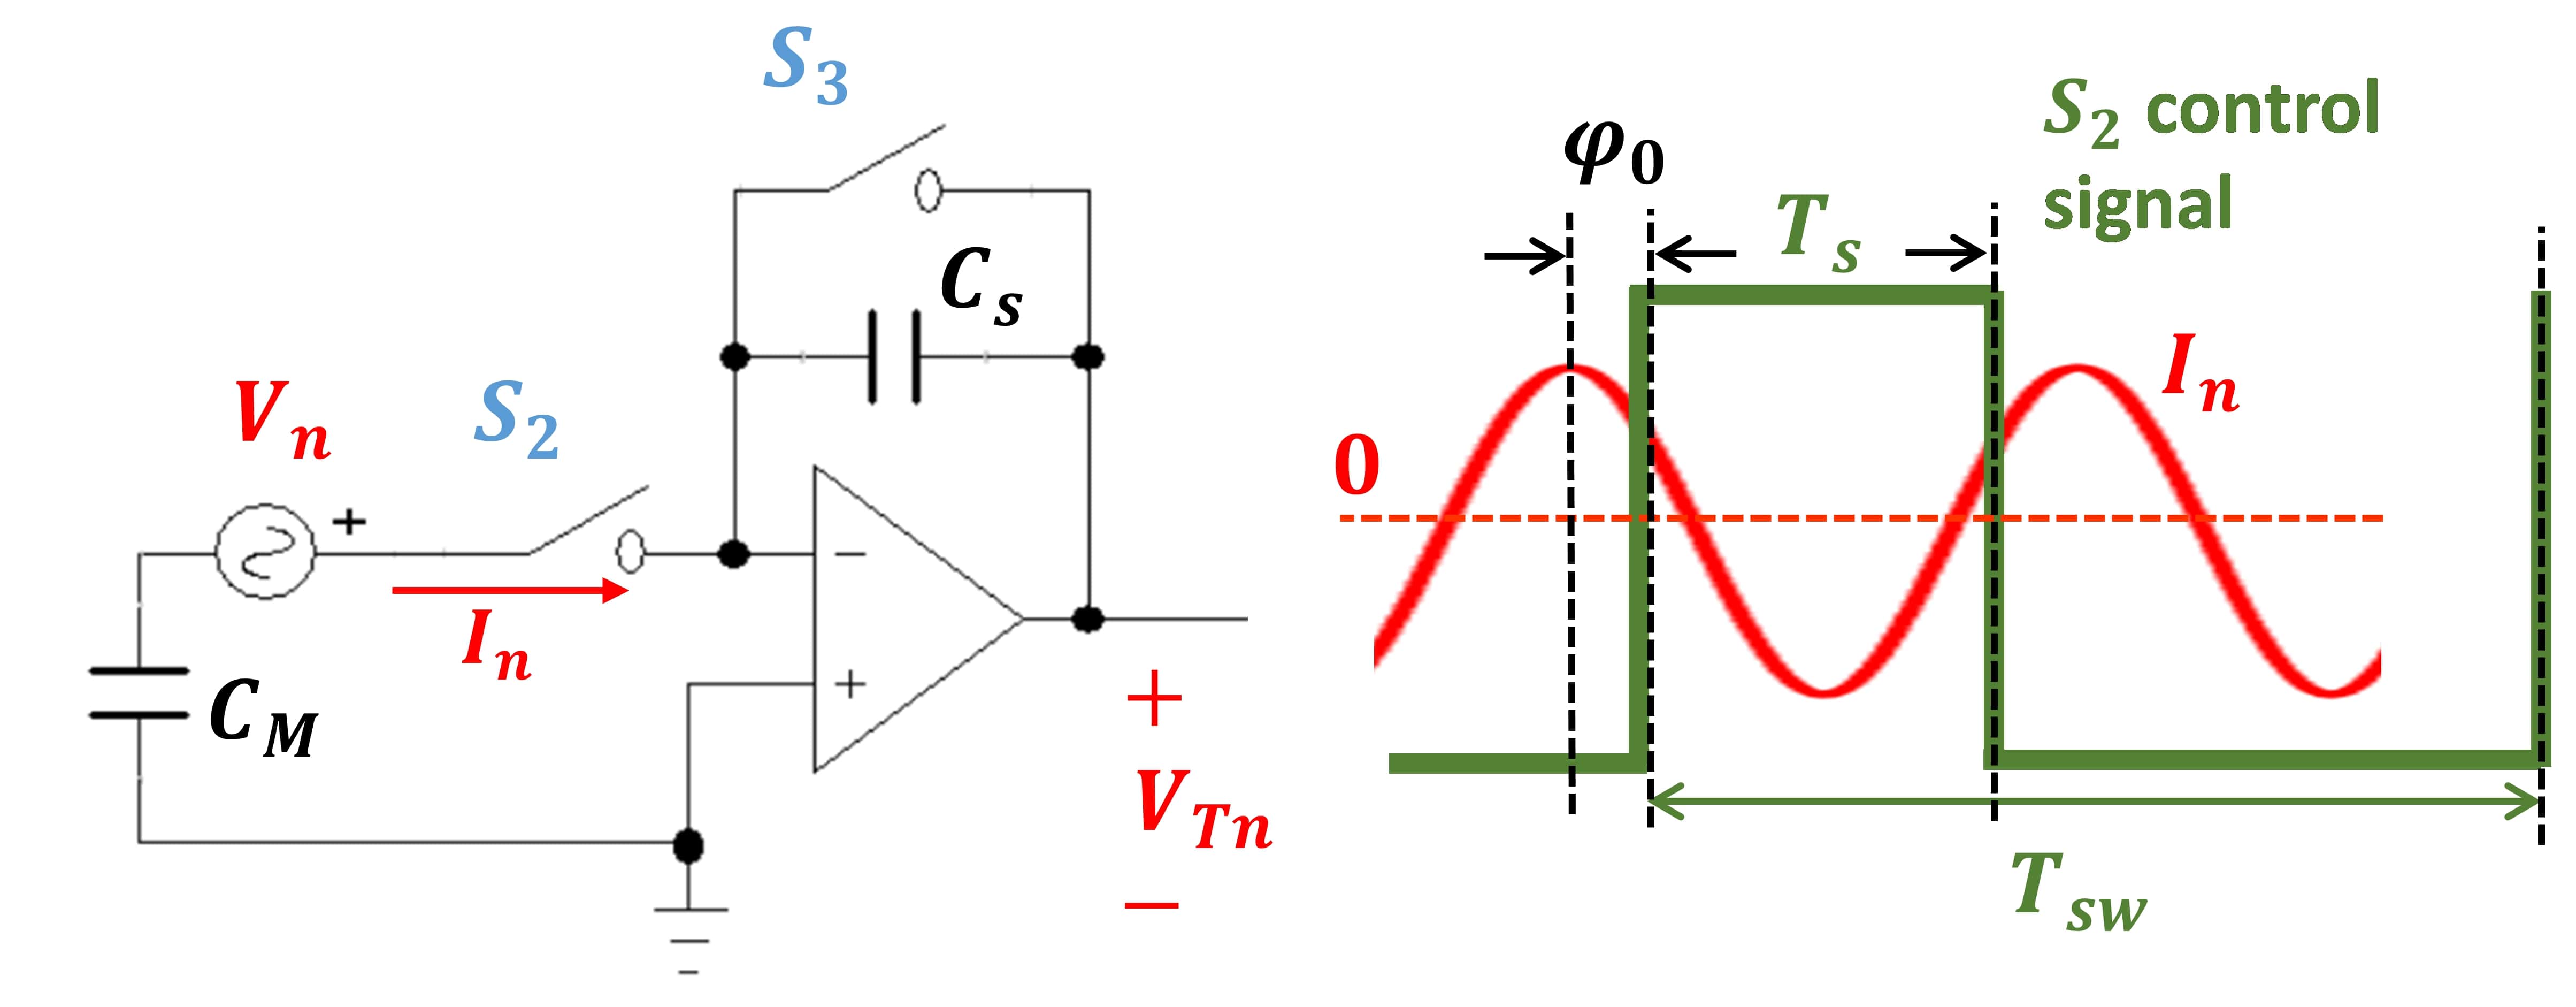
From Section IV-D, we know that the E field strength will, in part, decide the IEMI attack effectiveness. Nevertheless, as shown in previous work [19], the frequency of the interfering signal also plays a critical role. Therefore, we conduct the following analysis to first reveal the relationship of IEMI frequencies and a successful IEMI attack. Fig. LABEL:figs:E_field_interference_b shows the voltage source which is the input voltage of the QT sensor due to the IEMI attack. Based on the superposition theory, we can derive the equivalent circuit of a QT sensor under an IEMI attack where only the noise source is considered (see Fig. LABEL:figs:equivalent_circuit_a). is ignored since it is much smaller than the impedance of .
The mathematical calculation of the minimum IEMI interference that can cause a ghost touch event is thoroughly explained in Appendix B. The calculation gives us the lower boundary of IEMI attacks. In real attacks, we would like to maximize the IEMI interference. A similar calculation process also applies. The maximum interference can be achieved if one of the following two conditions is met.
| (13) |
As we will show in Section V-D, by conducting several experiments with a Chromebook equipped with a touchscreen diagnostic data collection program, we confirm our developed theory by identifying various frequencies at which ghost touches are caused at the required minimum E field. The impact of is minimized by finding the worst case in multiple measurements at each frequency.
V Proof-of-Concept Evaluation
In Section IV, we developed a theory for IEMI ghost touch attacks and validated it using simulations. In this section, we will demonstrate the IEMI attack using a relatively ideal experiment setup by targeting a laptop with electrode plates placed directly on both sides of the laptop touchscreen. With this setup, we generate real experimental results to validate our previous analysis, e.g., the required E field and needed frequencies for effective IEMI attack signals.
V-A Experimental Setup
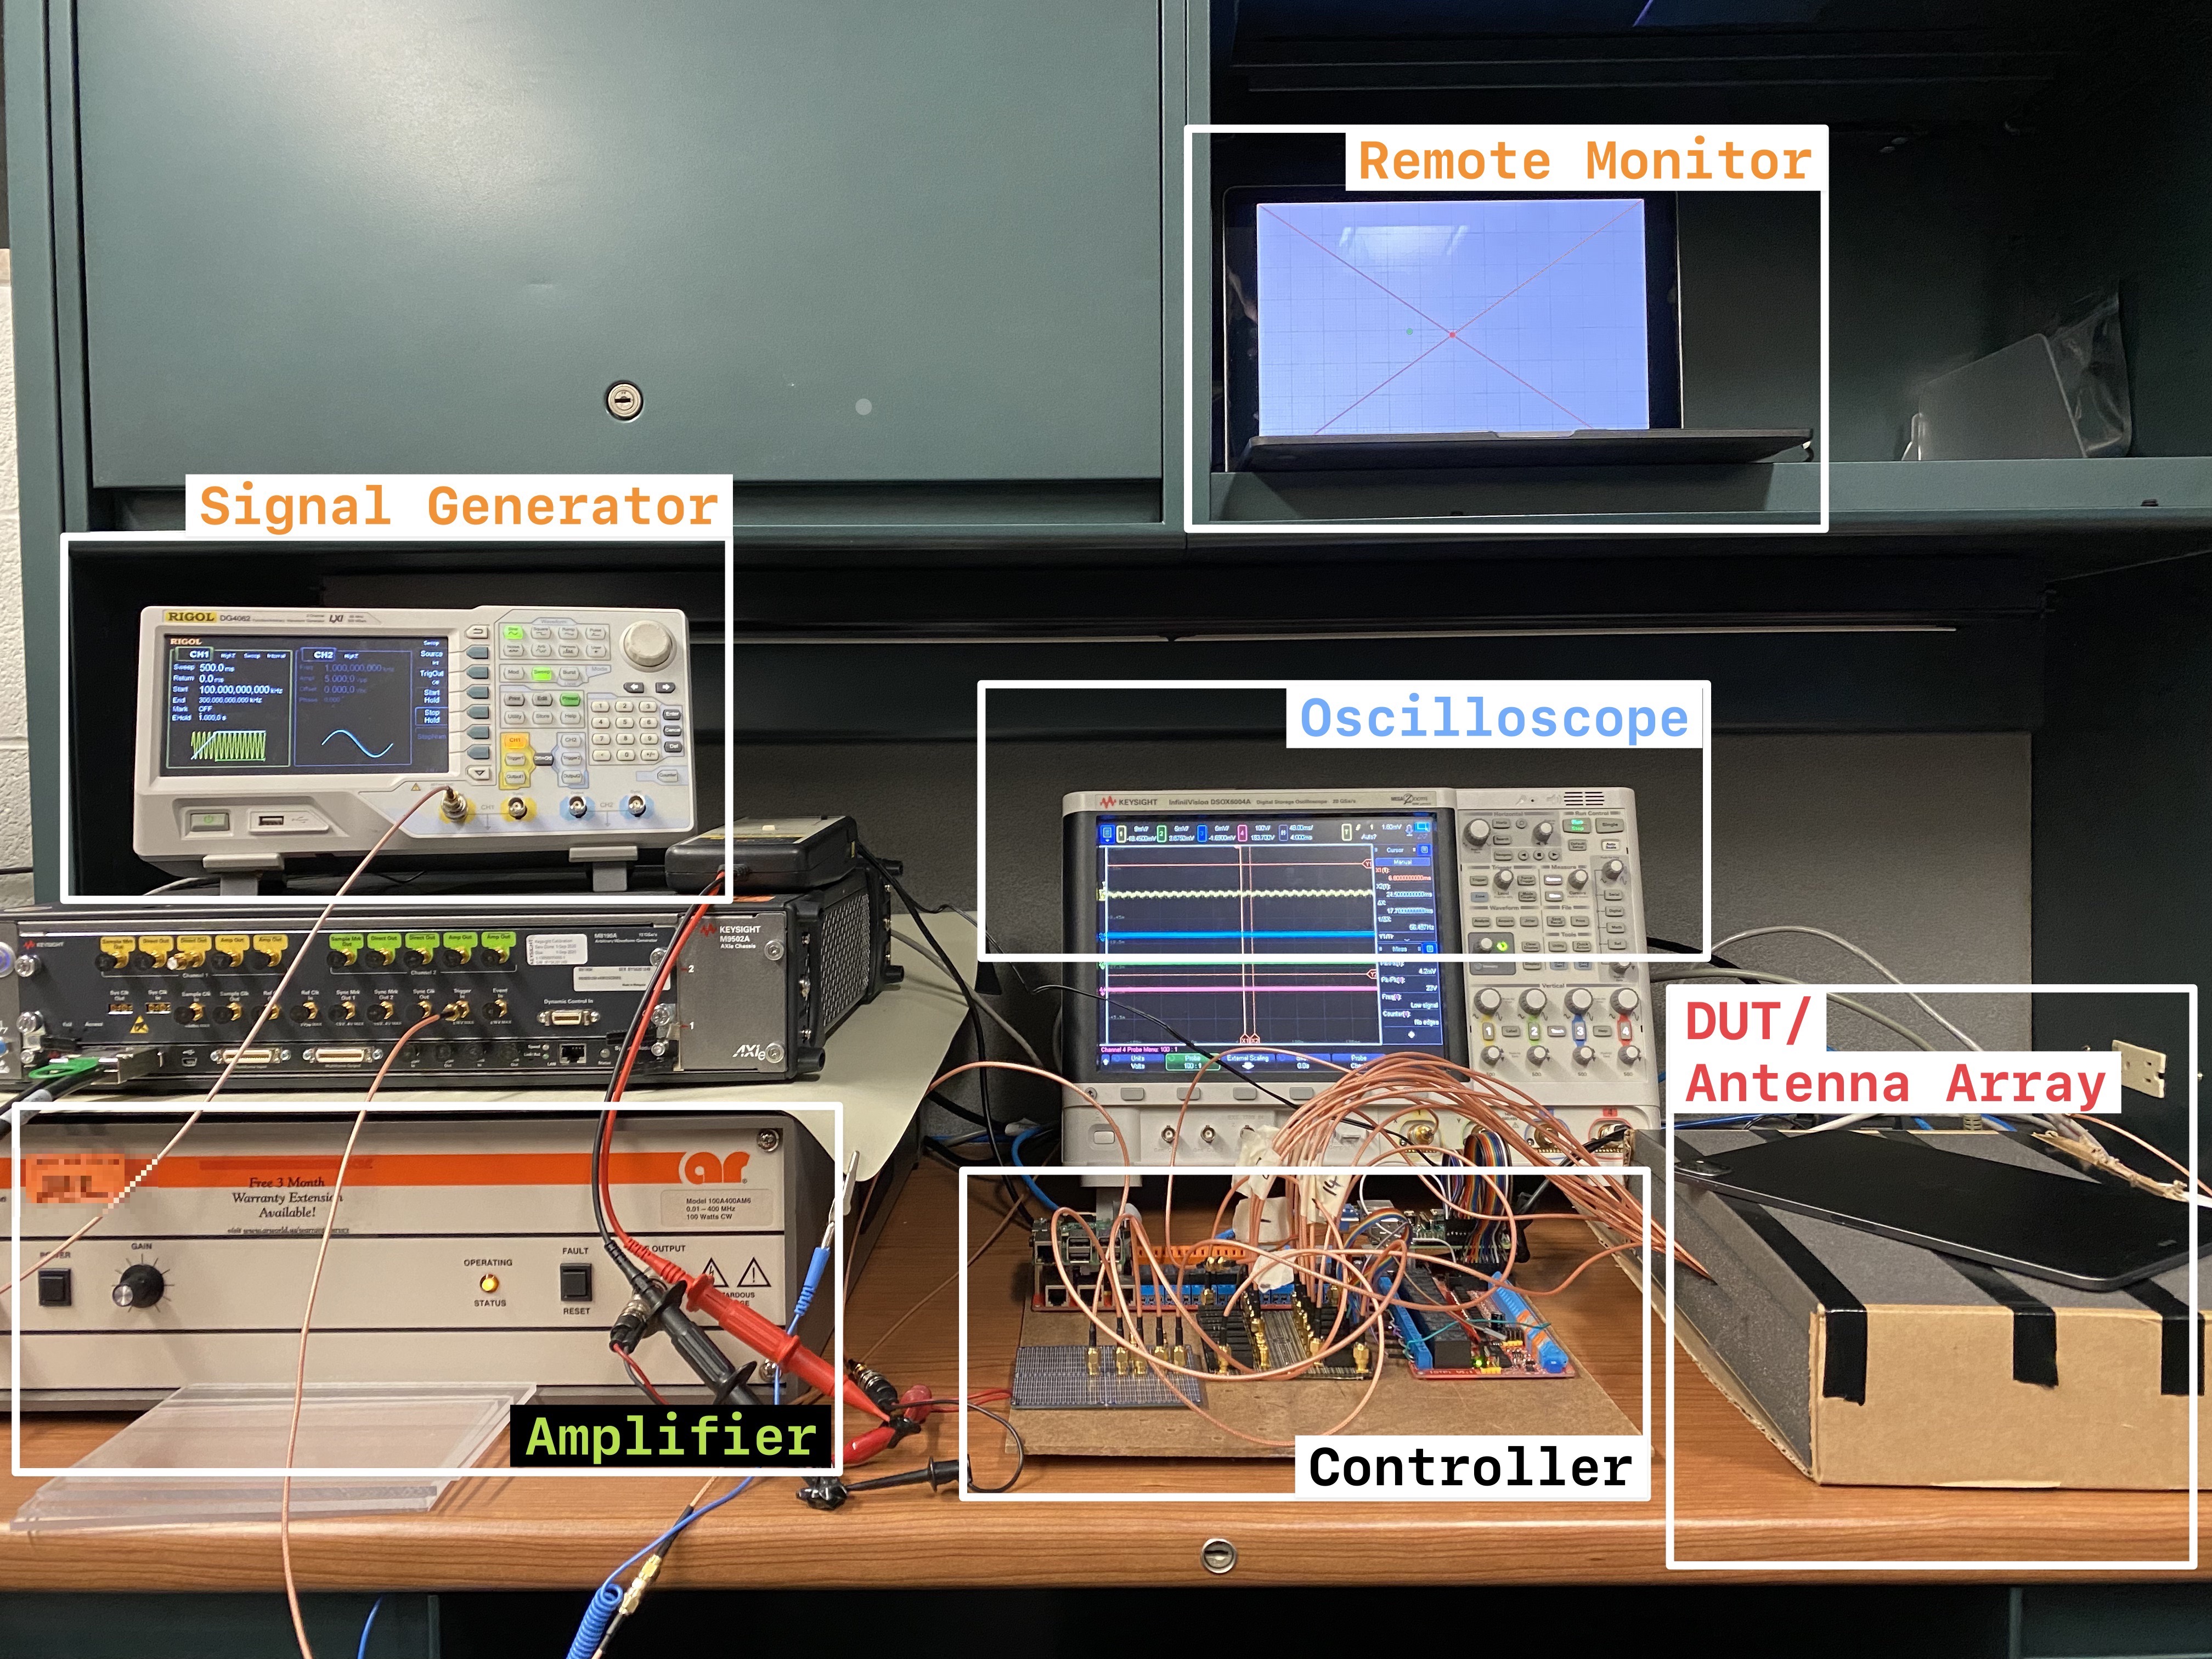
As a proof-of-concept, we generate radiated IEMI using electrode plates placed on opposite sides of our target device. A signal generator (RIGOL DS 1052E) and an RF power amplifier (Amplifier Research 25A250A) are used to generate the desired voltage. The output of the RF amplifier is monitored by an oscilloscope (RIGOL MSO4054). The touchscreen of a Chromebook laptop is used as the target. This laptop is installed with Touch Firmware Tests [20] developed by the Chromium Project. This program records all of the touched positions recognized by the touchscreen controller during the test. The recorded data is collected by an external device over Wi-Fi. A test report is also generated that lists all touched locations during the testing period. During the test, the Chromebook is disconnected from the adapter and placed on a non-conductive surface 70 cm above the ground to avoid undesired EMI noise.
V-B IEMI Generation
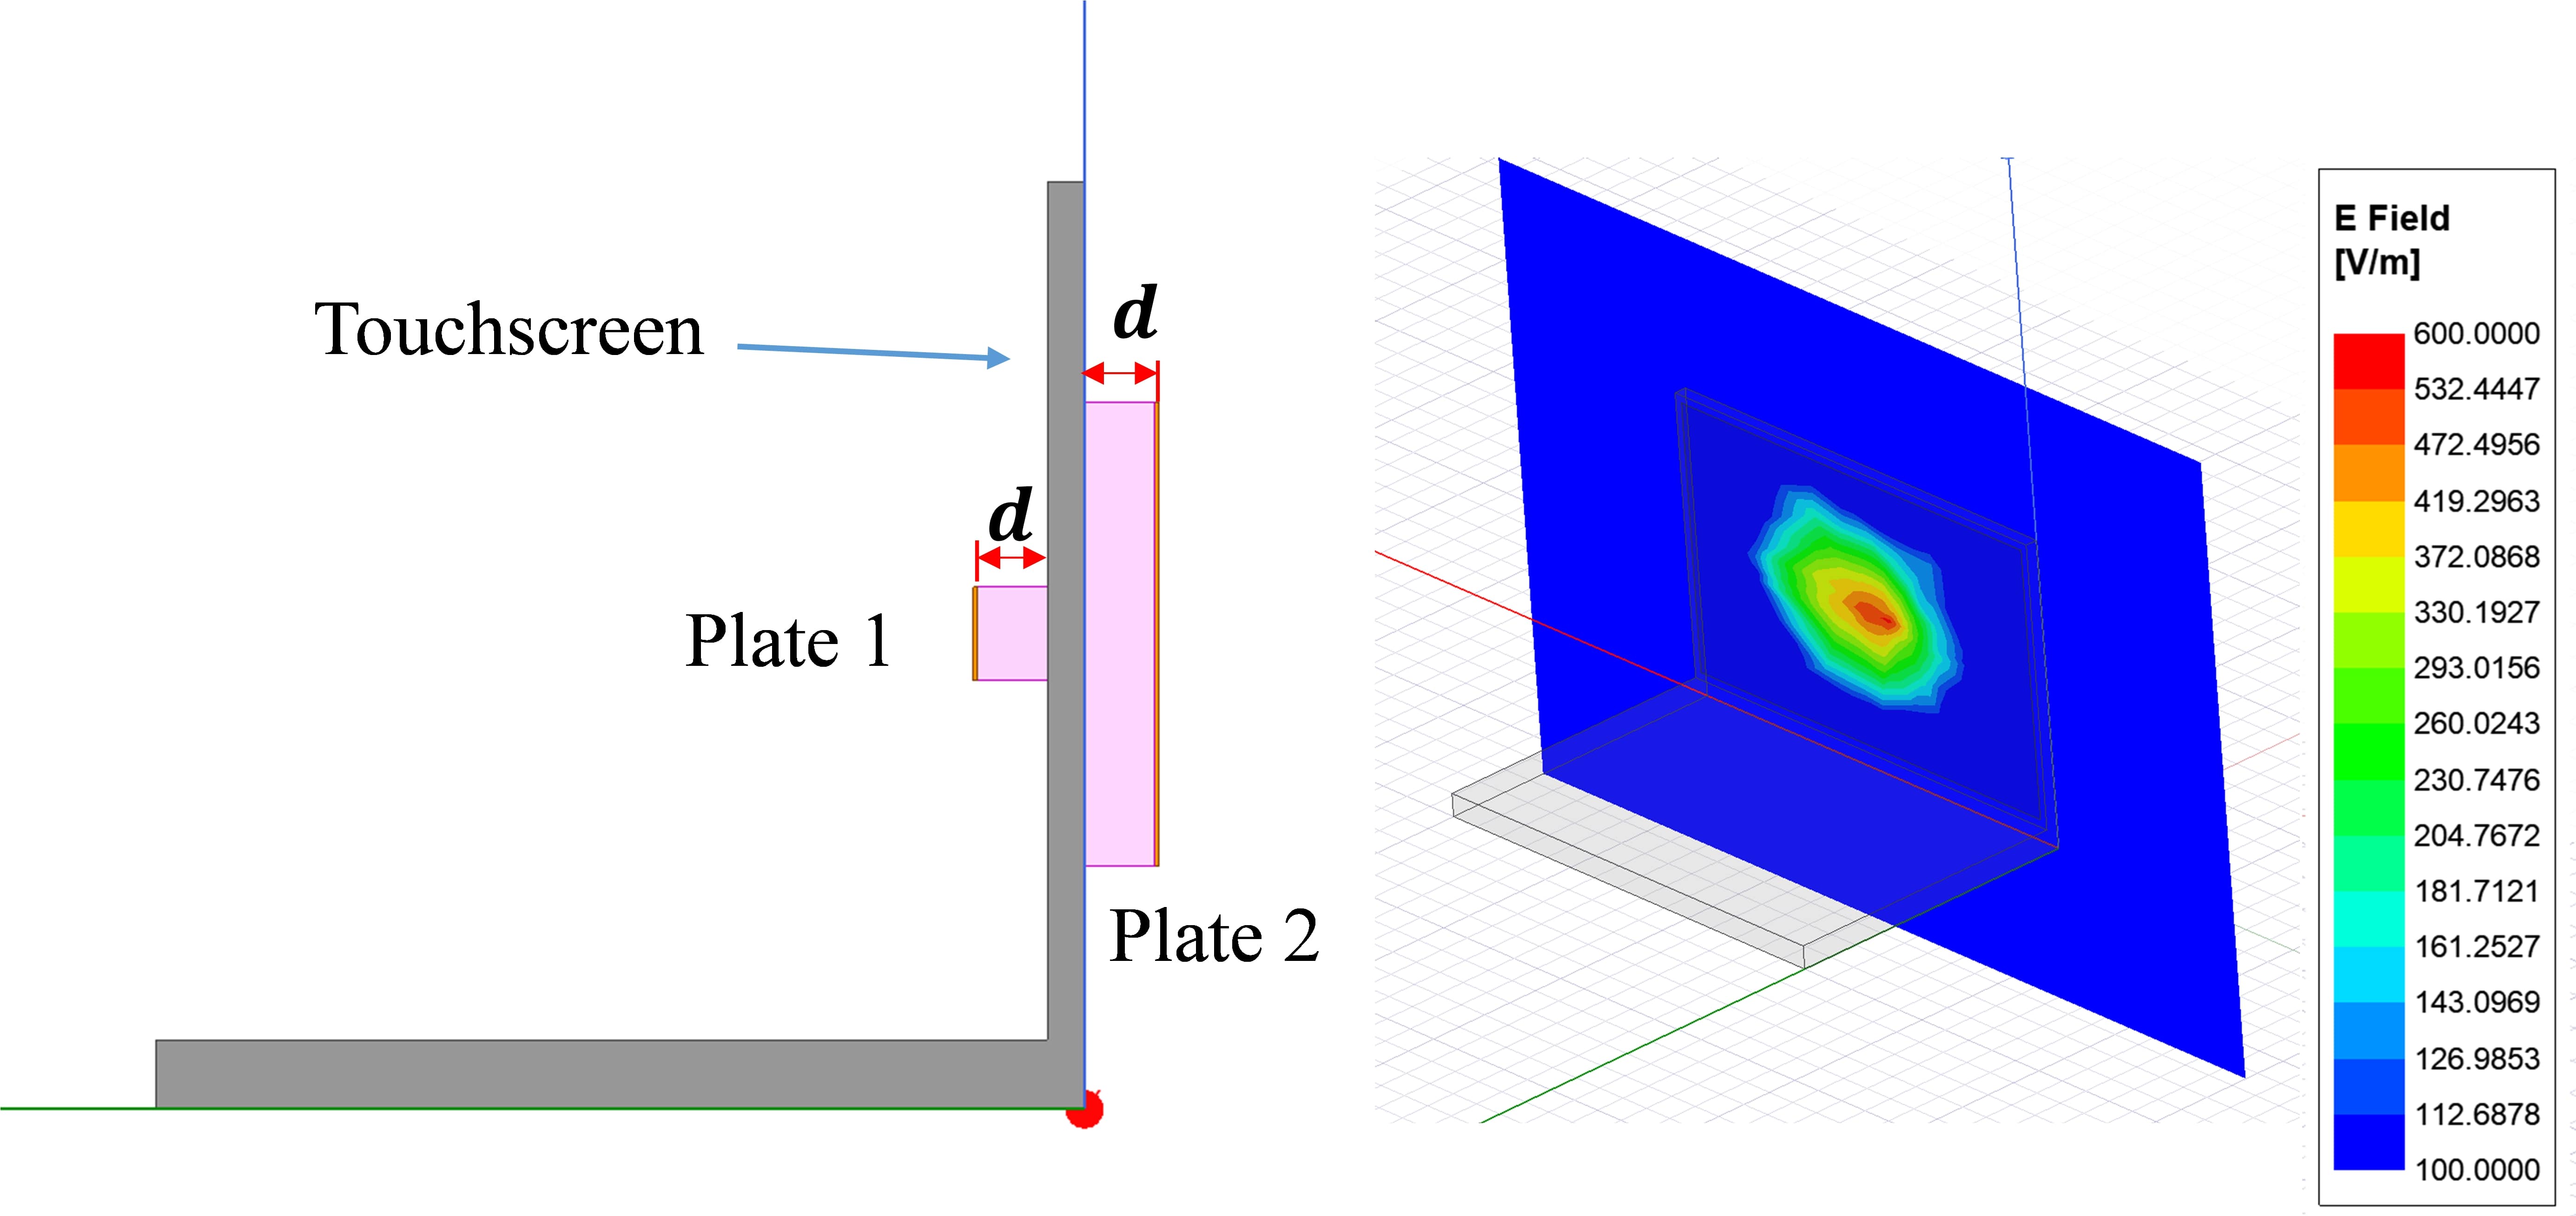
The E field parameters are selected based on our calculations in Section IV-E. Fig. 9 shows the placement of the two electrode plates. Plate 1 is an 8 mm x 8 mm copper plate taped on the front of the touchscreen. Plate 2 is a 150 mm x 150 mm copper plate taped on the back of the touchscreen. The distances between each plate and the touchscreen are both 10 mm (see Fig. LABEL:figs:electric_field_simulation_a). A non-conductive foam sheet is inserted between the plates and the touchscreen for mechanical support. The thickness of the touchscreen itself is 5 mm. The dielectric constant of the foam sheet is in the range of 1.8 - 3 [21]. To simplify the calculation of E field strength, , we use the following equation based on , the voltage across the plates.
| (14) |
Further, to validate the accuracy of (14), we compare our calculated results with simulation results using Ansys HFSS [22]. Note that the simulation reflects the real configuration by considering the foam sheet and the plate sizes. The HFSS uses finite element analysis to solve Maxwell’s equation, thereby providing accurate calculation results.
Fig. LABEL:figs:electric_field_simulation_b shows the simulated E field on the touchscreen caused by the two plates when . We found that the magnitude of the simulated E field is approximately equal to the calculated results using (14), which indicates that the simplified (14) is a good estimate for the generated E field strength. Hereafter, we will rely on (14) to derive the based on the required .
V-C Evaluation of E Field Strength IEMI on Touchscreen Behavior to Validate Our Theory
To exclude possible interference from the electrode plates affecting the touchscreen functionality, we first do not apply voltage to the electrode plates and collect touchscreen diagnostic data by drawing a random pattern on the touchscreen with a finger. This confirms that the touchscreen functions normally.
Stationary IEMI attack: Once we confirm the electrodes themselves have no impact on the touchscreen, we calculate the required for an IEMI attack. We collect parameters for a typical touchscreen from [13]. The minimum detectable capacitance change is 0.1 pF and the touchscreen controller excitation signal is 5 V. We also incorporate the overlap area due to the electrode. From (10), we have . Following (14), the corresponding is calculated as 22 V.
We then set on the signal generator to be a sinusoidal voltage source with a frequency of 140kHz. Instead of applying 22 V directly, the amplitude of is gradually increased until a ghost touch is observed. The process is repeated three times to find the minimum voltage that causes the ghost touch. In our experiment, we do not detect ghost touches when is lower than 20 V. When the voltage is higher than 20 V, however, ghost touches start to appear. As shown in Fig. 10(a), a ghost touch is successfully generated at the center of plate 1 when is 20 V. Note that the required minimum for ghost touches is close to our theoretical calculation (i.e., 22 V), showing that our analysis is accurate. When we increase above 20 V, multiple ghost touches are observed. This is because when the voltage is high compared to the minimum , several locations under plate 1 (as opposed to just one) have sufficiently high E field strengths to induce ghost touches. Fig. 10(b) shows that two ghost touches are generated when is 25 V.
Moving IEMI attack: We have demonstrated that the touchscreen is vulnerable to stationary IEMI sources. We further expand our experiment by moving our electrode plates around to verify if only certain locations on the touchscreen are vulnerable. To account for jitter caused by moving the electrode plates, we increase the applied to 30V / 140kHz (E field strength of ) to ensure the E field is always higher than . As shown in Fig. 11(a), many ghost touch points are evident when plate 1 moves from left to right. Fig. 11(b) shows the ghost touch points when plate 1 moves from top to bottom. The results show that all physical locations of the touchscreen are equally vulnerable to an IEMI attack.
V-D Evaluation of IEMI Frequencies on Touchscreen Behavior to Validate Our Theory
As we mentioned in Section IV-E, the E field frequency also impacts the IEMI attack in addition to its strength. We therefore conduct several experiments to validate our analysis on calculating the required signal frequencies for a successful IEMI attack.
Sweeping IEMI Attack Frequencies to Validate Our Theory: From [17, 23], we know that the touchscreen system is sensitive to noise in the range of to due to integrated low pass filters in the touch sensing circuit. We sweep the frequency from to to cover the sensitive frequency range using steps of . With each chosen frequency, we tune the voltage applied on the two electrode plates until ghost touches are detected. If the generated E field exceeds and there is still no ghost touches detected, then we claim that the selected E field frequency cannot generate a ghost touch. We run each test for 5 seconds and after each measurement reboot the Chromebook to reset the touchscreen. The procedure is repeated three times for each frequency. All collected results are plotted in Fig. 12 which shows a complete view of the frequency dependency for successful IEMI attacks. As we can see in this figure, certain excitation frequencies out-perform other frequencies (requires smaller E field strength to trigger ghost touch), which validated our previous theory of IEMI frequencies, see equation (12) and (13).
Targeted IEMI Attack Frequencies to Validate Our Theory: In Section IV-E, we show that and determine the minimum/maximum IEMI interference using an E field with frequency . These parameters can be calculated from two adjacent frequencies with the maximum interference (local lowest ). Using the results presented in Fig. 12, we select two adjacent frequency points and derive and . Based on these calculations, we can then derive all E field frequencies that can cause minimum IEMI interference (denoted as ) or maximum IEMI interference (denoted as ) using (B-6), (12) and (13). In the frequency range of to , and are listed as follows.
Note that these calculated frequencies match the experimental results shown in Fig. 12. For frequencies other than and , we can still obverse ghost touches with larger than minimum E field strengths. It is worth noting that the IEMI signal cannot cause any interference at . This is likely caused by internal filters that are in place to avoid undesired interference from internal electronics components at those frequencies. For frequencies higher than 1 MHz, the impact of the sensor circuit’s internal low pass filter and parasitic parameters become more significant [23]. Since this is often proprietary information of touchscreen manufacturers, the experimental results become less consistent with our calculations. When we set the frequency larger than 3.4 MHz, no ghost touches are detected.
VI Precise Screen Control using IEMI Attack
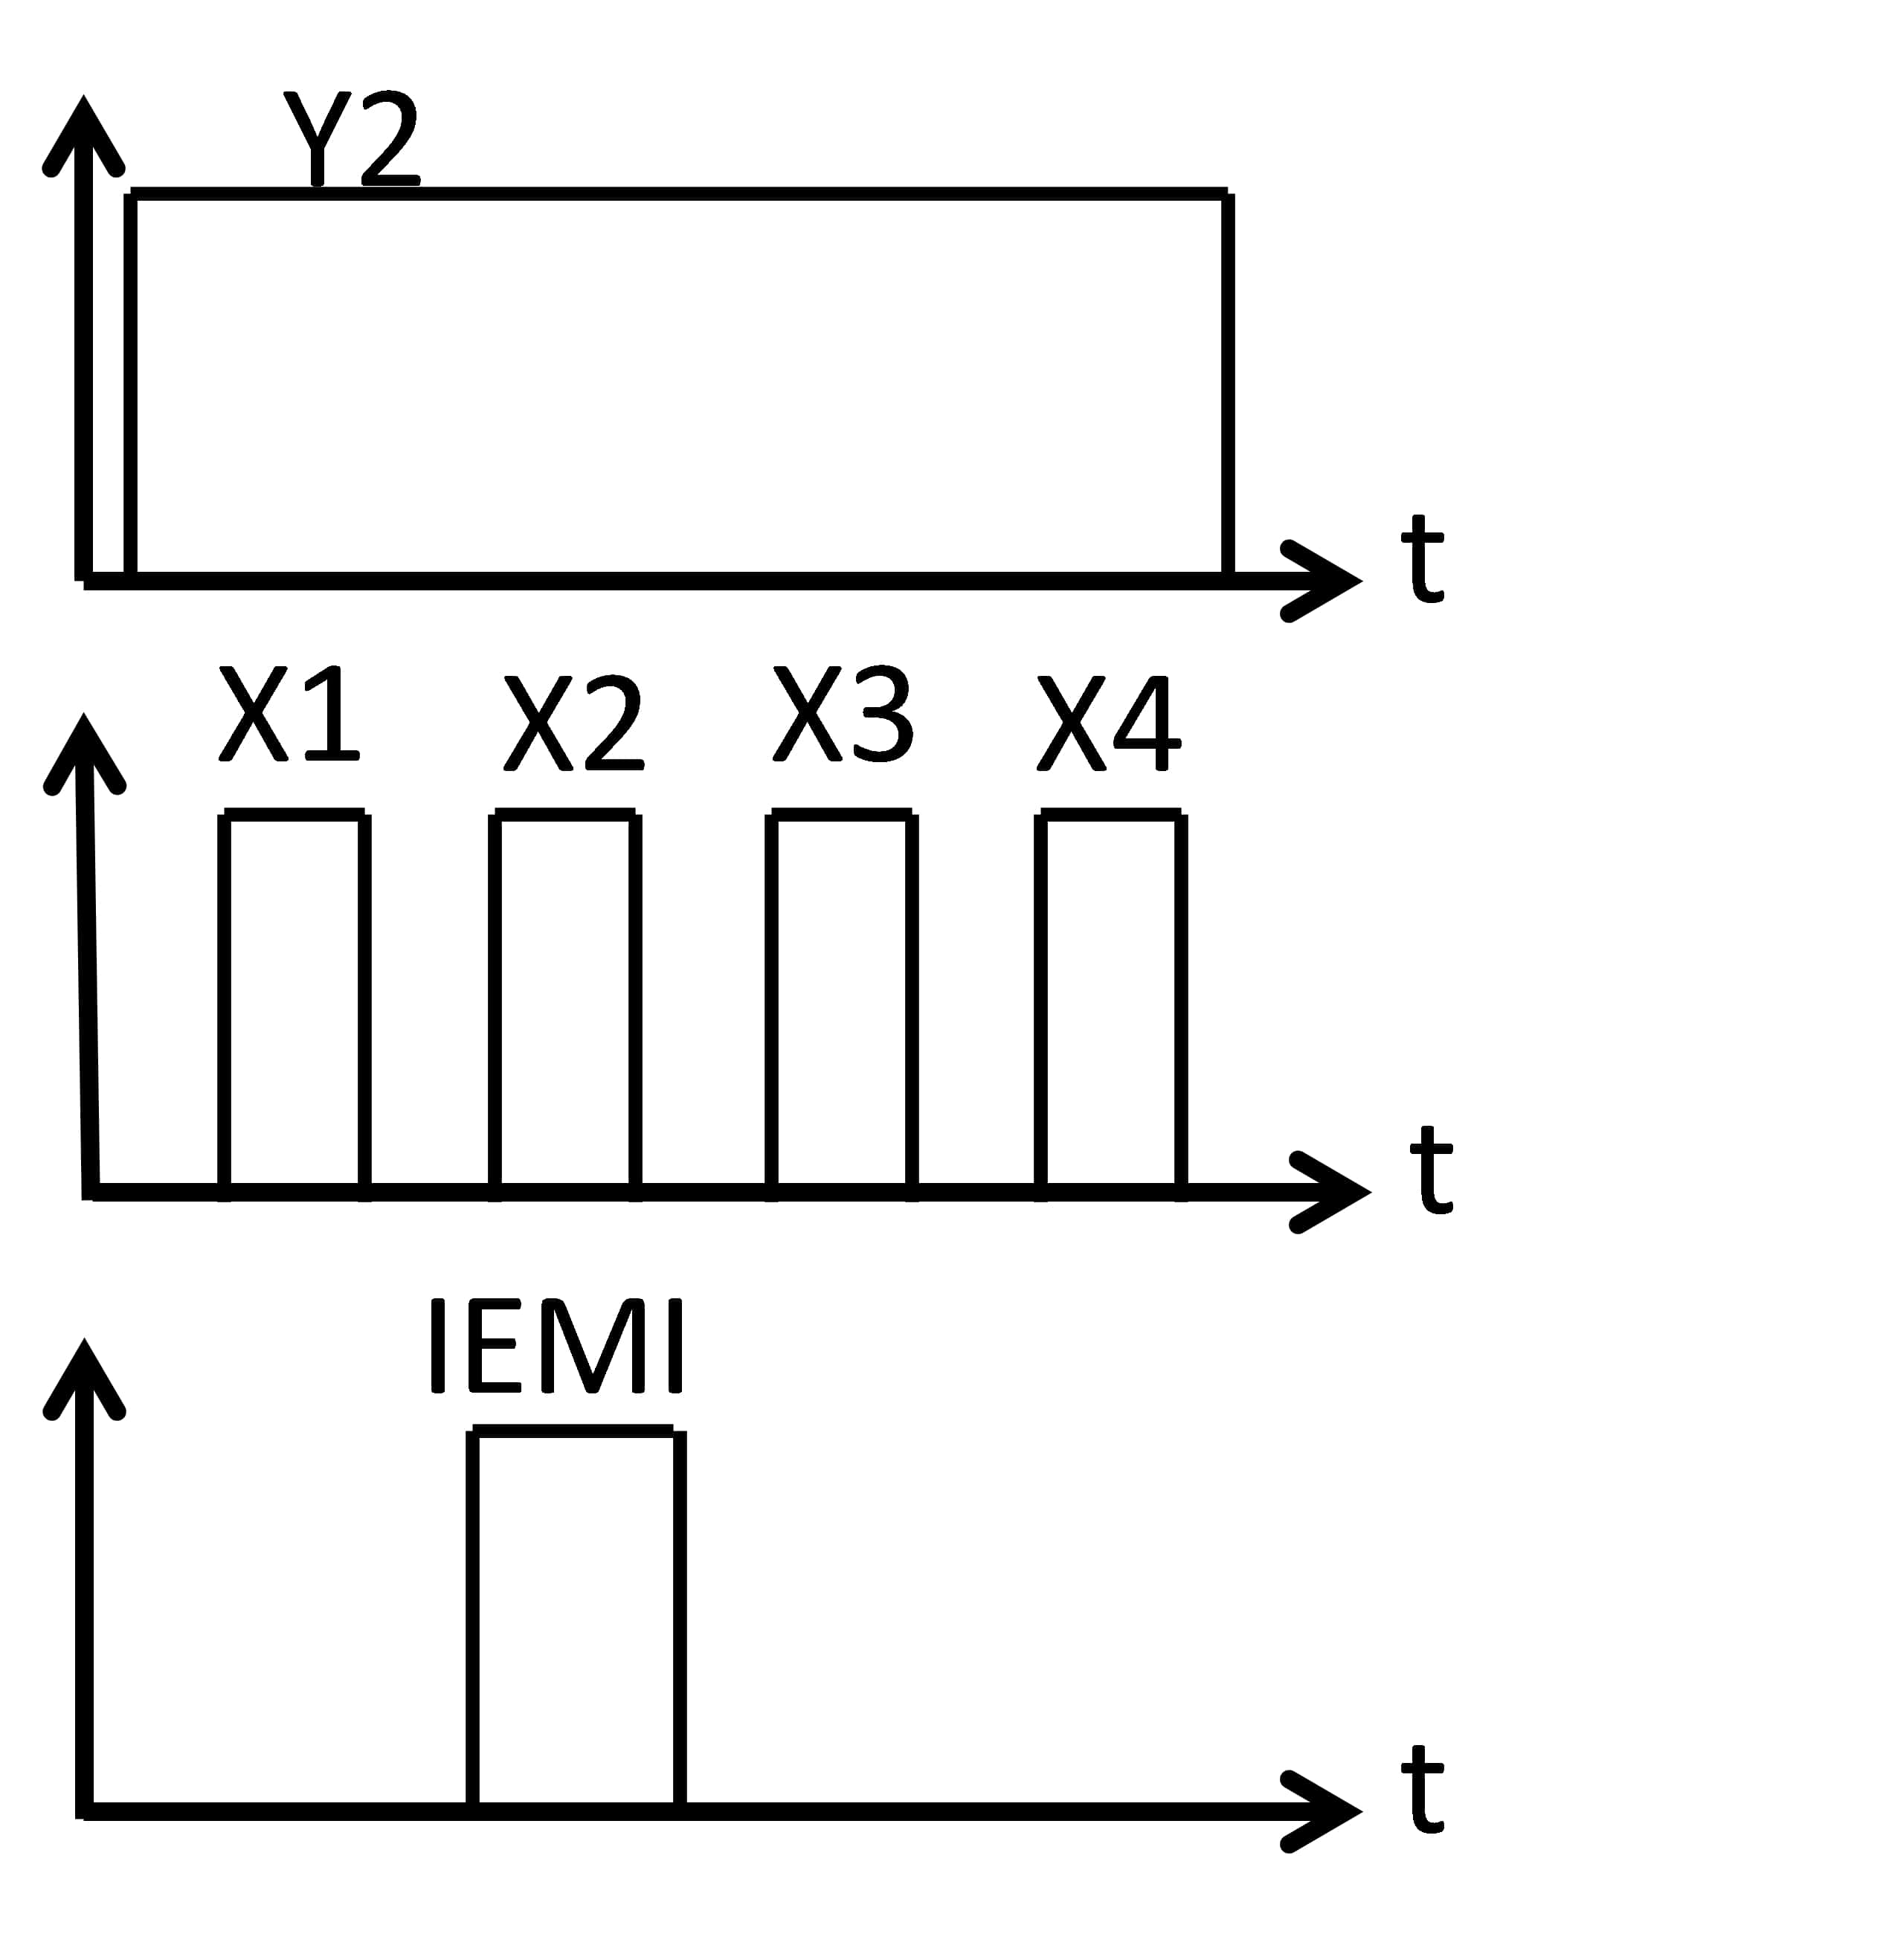
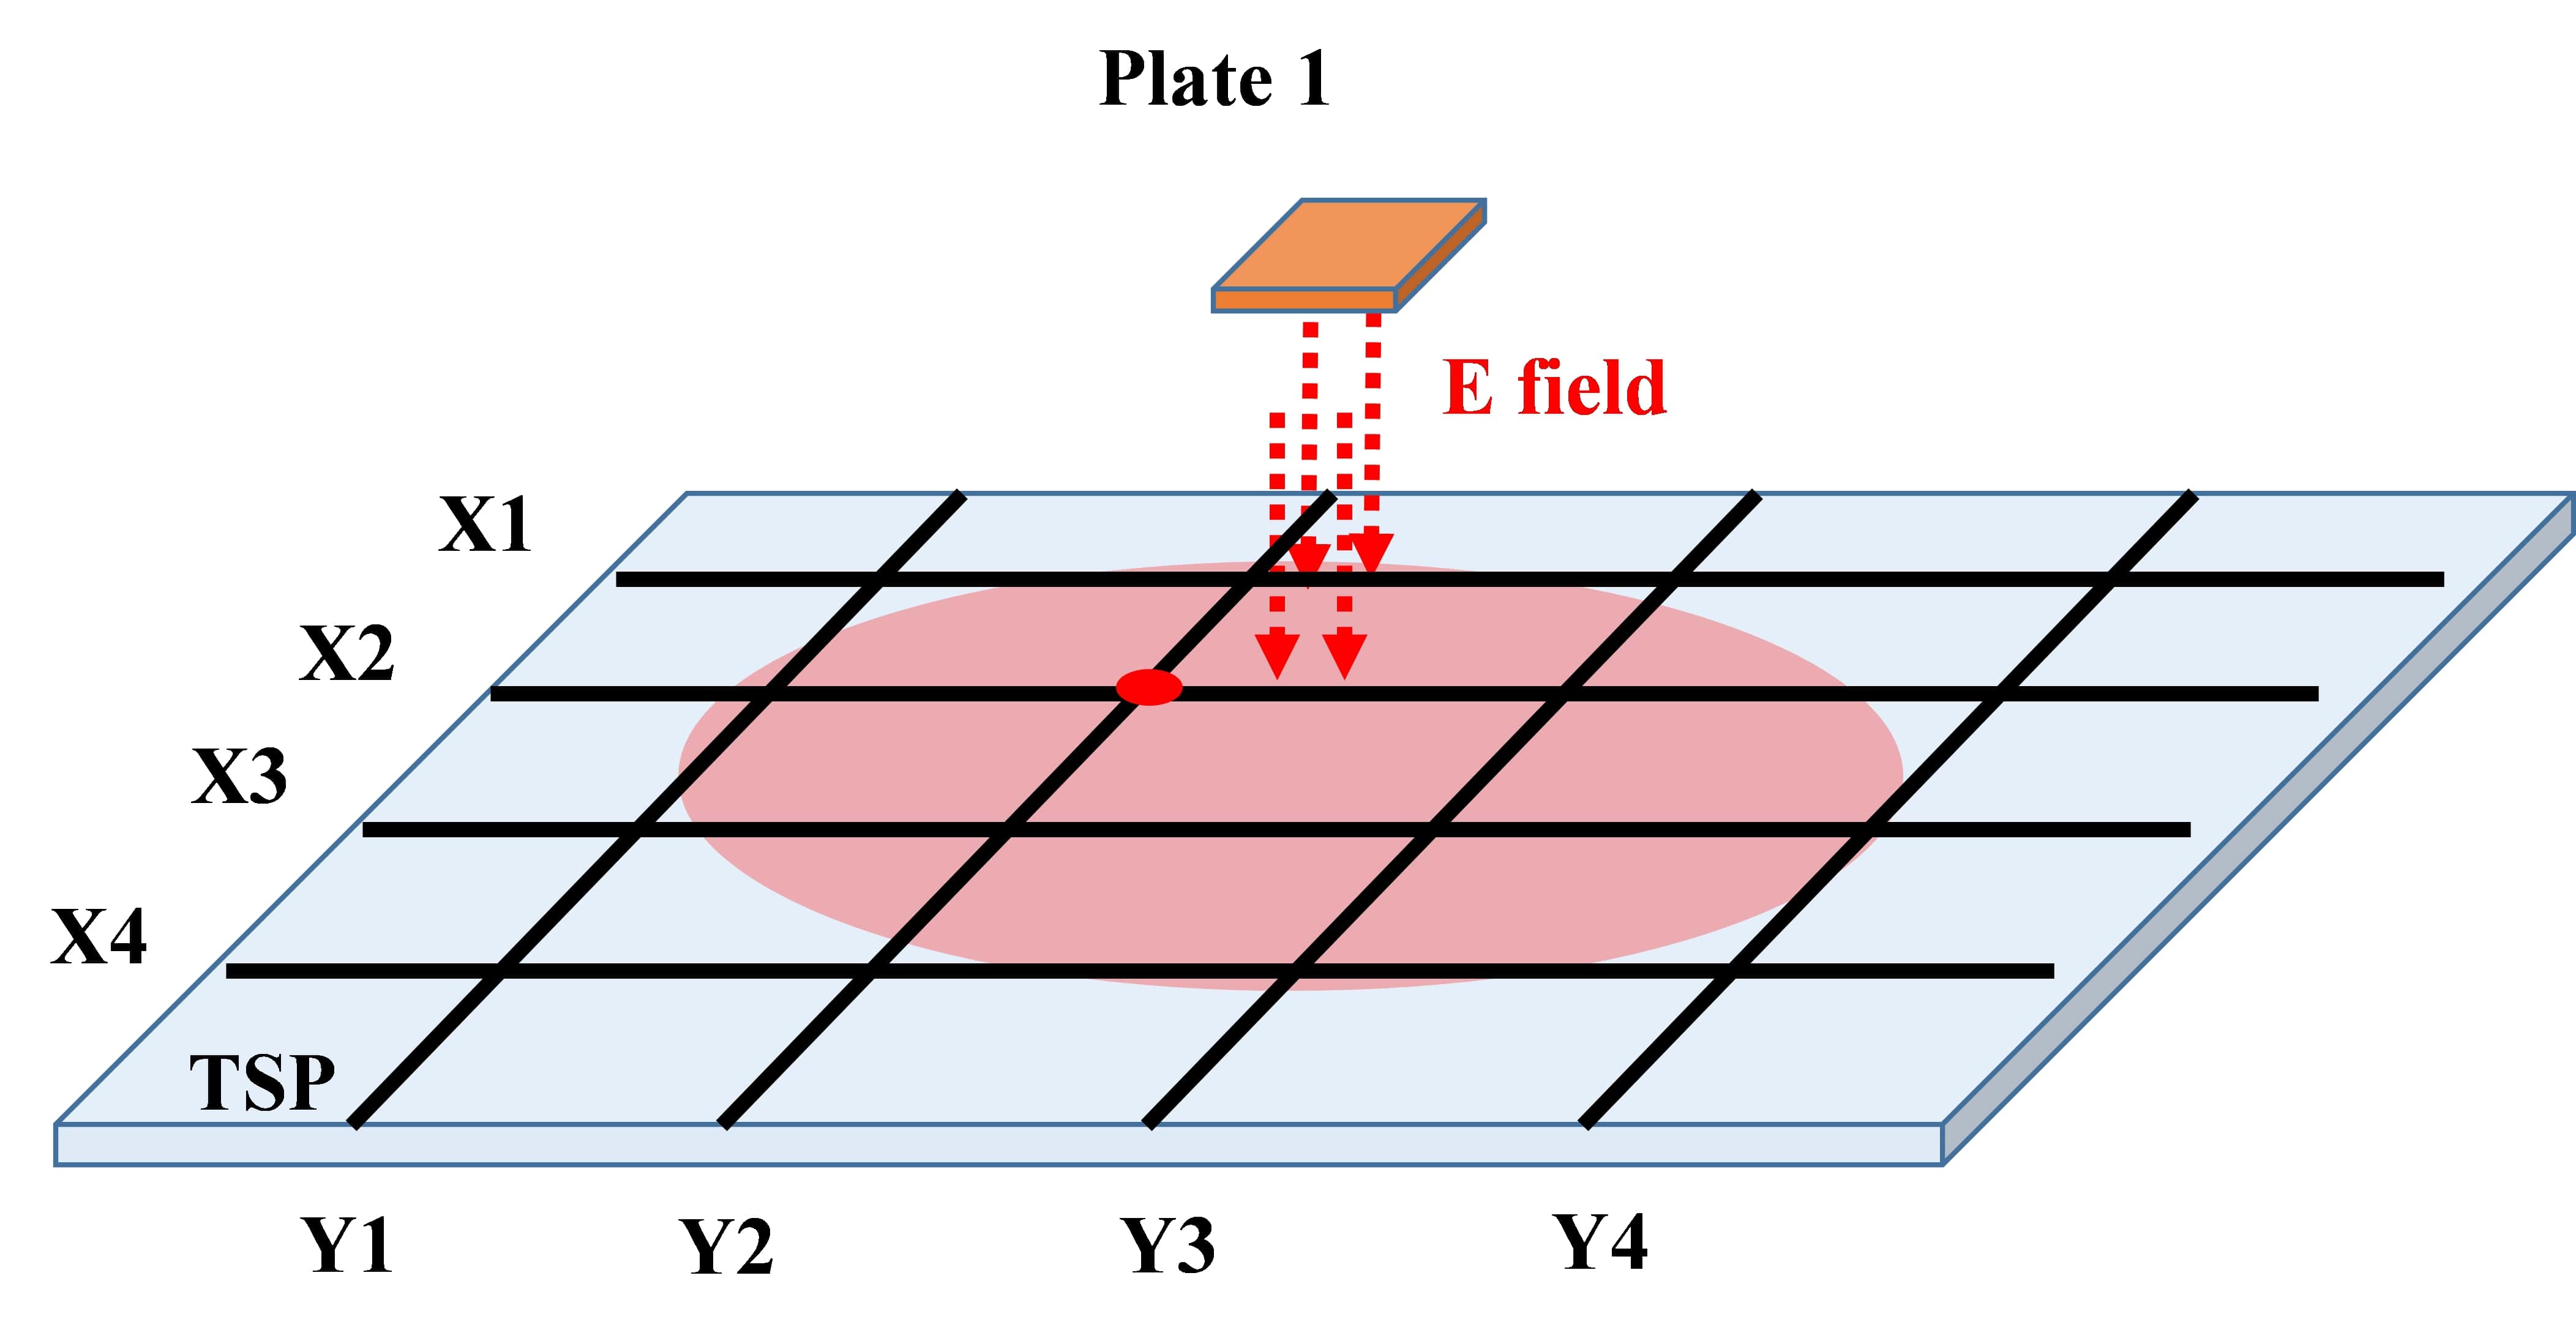
In modern touchscreen systems, the electrodes at the touch sensor grid are scanned by the controller [13]. The controller drives a single column (TX electrode) and scans every row (RX electrode) as shown in Fig. 13(a). The process is repeated for every column so that the capacitance of all the electrodes can be measured. For example, in Fig. 13(a), column Y2 is being driven and rows X1 to X4 are being sensed in sequence. When the IEMI attack on the screen occurs at the moment when a single pair of electrodes is being scanned (see Fig. 13(b)), it is possible to generate a ghost touch at that specific location. A ghost touch will be recognized at (X2, Y2) when IEMI occurs while those electrodes are being sensed.
Generating an E field with a small focusing area is challenging. However, it is possible to generate a ghost touch at a specific location on the screen without synchronizing with the sense lines if the IEMI signal is generated with an appropriate antenna using a short pulse. This essentially mimics a finger touch event. In Section V, we use two copper plates which are attached to the front and back of the victim device to generate a focused small E field. Although such a setup is impractical in real attack scenarios, we can use the same methodology to design a new antenna, e.g., using two copper plates right next to each other. In this design, one copper plate is connected with an excitation signal and the other is connected to ground. With this configuration, the generated E field is drawn into the grounded copper plate rather than distributed on the surface of victim device. In our later experiment section, we show that our antenna design can be made as small as 4mm x 4mm which provides both accuracy and high resolution. In section VII-A, we show how a copper needle antenna can be used on a large touchscreen device to generate highly accurate ghost touches without the involvement of ground due to the internally large metal of the device.
VII Features Affecting IEMI Attack Performance
In this section, we evaluate the accuracy and effectiveness of our touchscreen attack with different touchscreen devices across different manufacturer, size, operating system, and model. We explore the features affecting IEMI attack peformance and practicality. In particular, we highlight the success rate and accuracy of the IEMI attack using different materials and at different distances. We also demonstrate how to locate the position of the phone and manage interference between antennas.
VII-A Experimental Setup
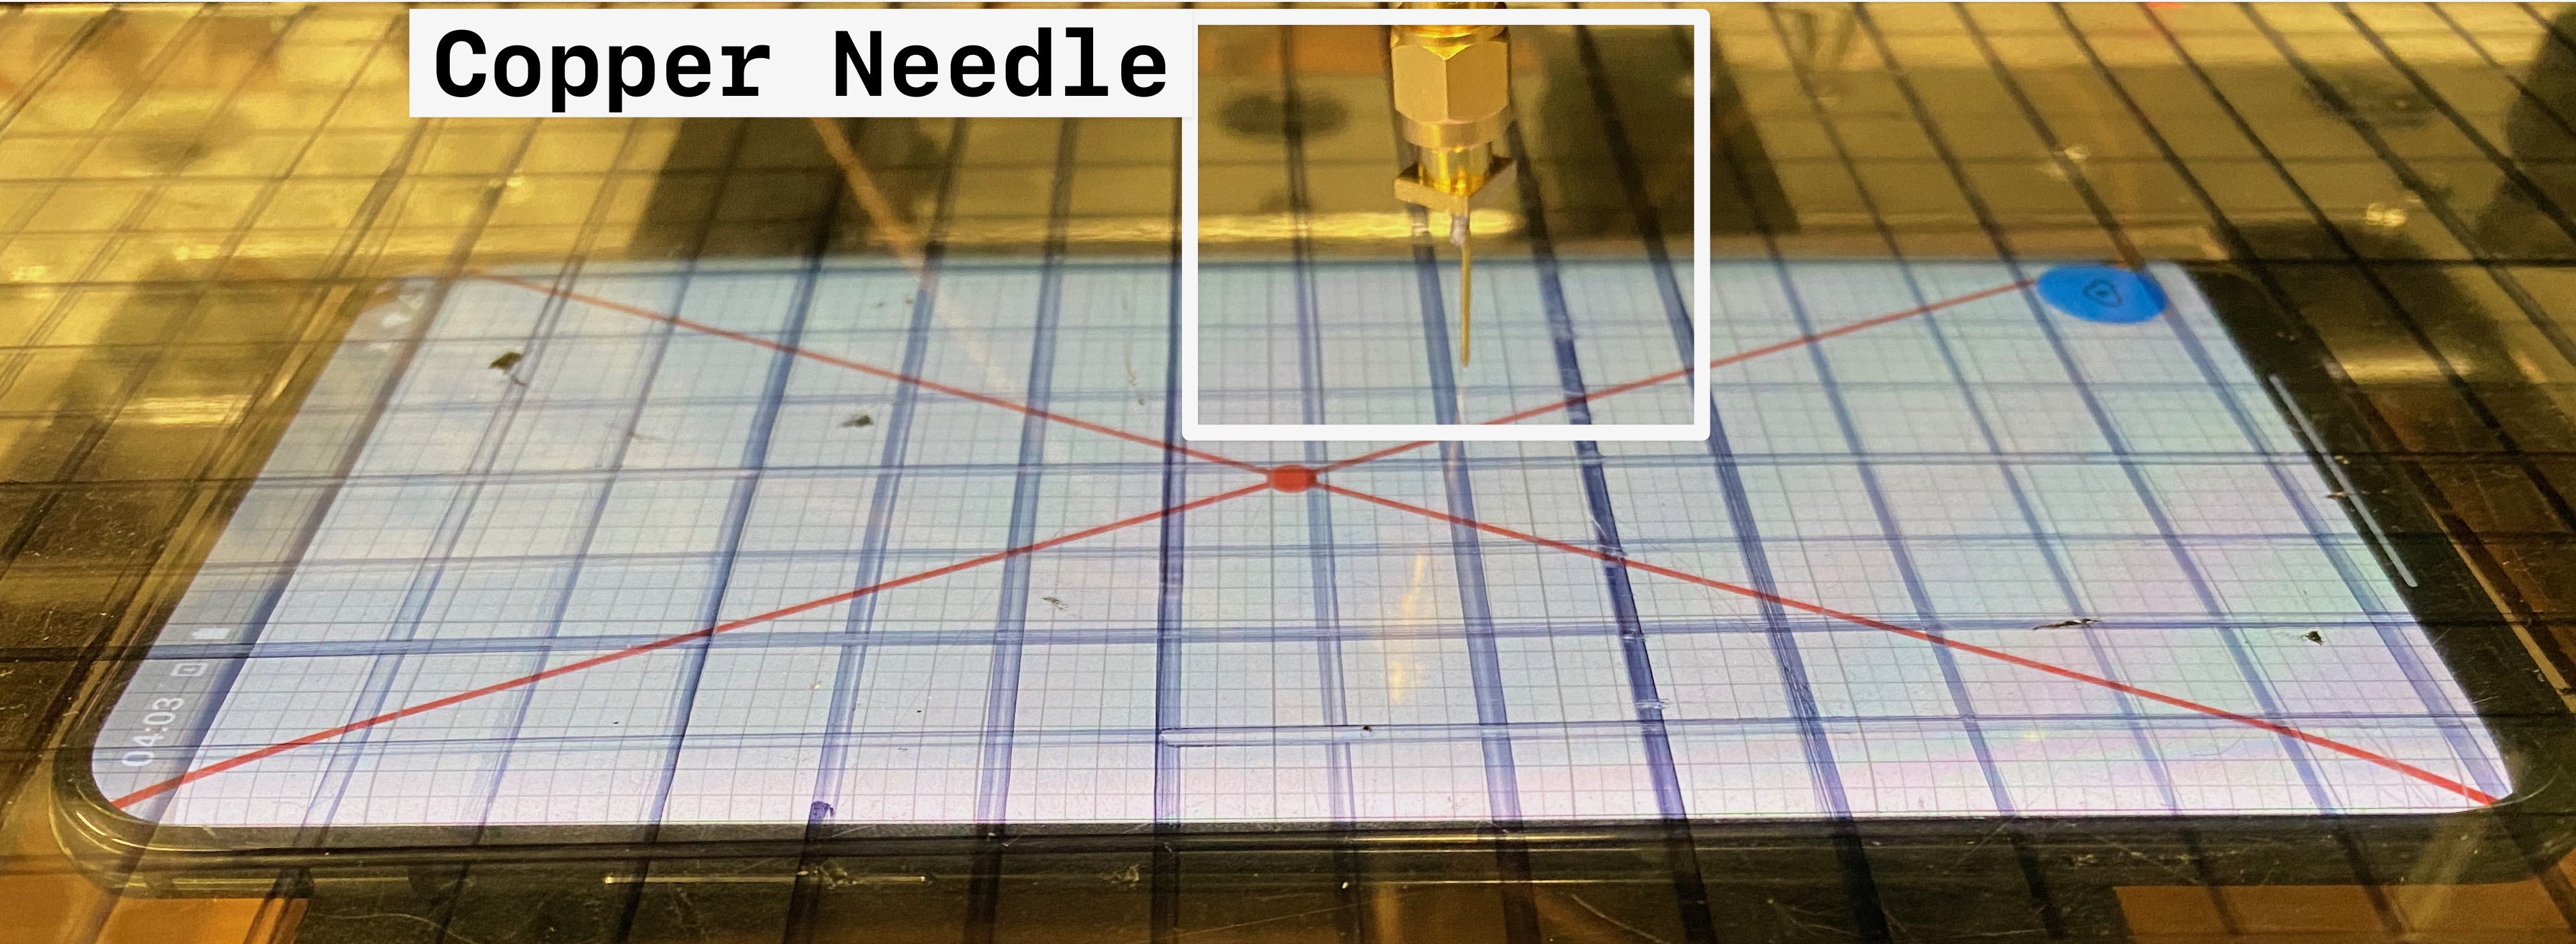
To evaluate how different factors can influence the generation of a ghost touch, we conduct experiments using a similar setup as presented in Section V, except we add a probe positioning system and single-end antenna, as shown in Fig. 14. We use standard SMA-to-SMA coaxial cables which are equipped with a shielding layer to connect the antenna to the RF amplifier to avoid undesired EM signal emission. It is worth mentioning that we use copper needles as antennas for our experiments on the iPad Pro and Surface Pro devices because they provide better resolution due to the more focused E field at the needle tip. As for the smaller devices tested, such as iPhone and Android smart phones, we still use the standard copper plates (4mm x 4mm) antenna setup because it provides a more controllable and small E field due to the presented ground terminal. We attach the copper plate/copper needle to standard SMA connectors as the antenna. A separate copper plate is also used to measure the touchscreen sampling signal for the phone detector which we will elaborate in Section VIII-B.
VII-B Experiment Design
To evaluate the precision and success rate of our touchscreen attack across different victim devices (Android, iOS, Windows), we designed our own cross-platform touchscreen gesture collection application with flutter. The application collects tap, double tap, long press, and swiping gestures on the touchscreen. It then reports all detected gestures and their associated time and location to a remote server for subsequent analysis. The application draws a red dot at the center of the test device for target visualization purposes. The application also visualizes the detected gestures on the screen along with coordinates information.
VII-C Success Rate and Accuracy
With the reported touch event location and timing, we can perform evaluation against the collected data to show both the success rate and accuracy of our attack. During the experiment, we notice that our attack occasionally creates rare random touch events at distant positions due to the non-ideal E field spread and interference from nearby equipment. This is shown in Table III under the QD (X) and QD (Y) columns, where we choose Quartile Deviation (QD) to better evaluate how the generated touch events are focused in a small region. The QD (X) and QD (Y) columns represent how large the generated touch events are distributed along the X axis and Y axis of a test device with respect to pixels. Another benefit of using Quartile Deviation instead of Standard Deviation is that we find if the generated touch event is far away from its intended target, then it will not interfere with the attack chain by, for example, pressing an incorrect button that is adjacent to the correct button. As the result, we believe QD is an appropriate metric to quantify the “actual attack” accuracy. From Table III, we can tell that our attack performs accurately on the iOS device, especially on large touchscreen devices. However, we also noticed that our attack often creates scattered touch events vertically or horizontally. After further investigation, we believe that although our antenna and signal cable is specifically chosen to generate a small, focused interference signal, there are still undesired IEMI signals leaked and the Android test devices are sensitive enough to recognize them as touch events. Note that the ghost touch occurs every time we apply IEMI signal on these Android devices so the ghost touch success rate is 100% but the accuracy is lower than iOS devices.
| Device | Operating System | Success | Freqeuncy (kHz) | Electric Field Strength (V/m) | Success Rate (s) | QD (X) (s) | QD (Y) (s) |
|---|---|---|---|---|---|---|---|
| Nexus 5X | Android 8.1.0 | 270 | 1000 | 100 | 3.5 | 182.5 | |
| Google Pixel 2 | Android 10 | 230 | 1000 | 100 | 10.0 | 149.5 | |
| OnePlus 7 Pro | Android 11 | 295 | 800 | 100 | 196.5 | 3.0 | |
| iPhone SE | iOS 12.0 | ✓ | 95 | 1500 | 57 | 10.5 | 6.0 |
| iPhone 6 | iOS 12.2 | ✓ | 98 | 1500 | 86 | 14.0 | 10.0 |
| iPhone 11 Pro | iOS 14.7.1 | ✓ | 120 | 1500 | 77 | 4.5 | 8.5 |
| Surface Pro 7 | Windows 10 Pro 2004 | ✓ | 220 | 1200 | 88.3 | 12.5 | 7.5 |
| iPad Pro | iPadOS 14.7.1 | ✓ | 270 | 1500 | 100 | 1.0 | 0.5 |
VII-D Table Material
As we aforementioned in Section V, the dielectric constant of the table material impacts our attack. To evaluate the performance of our attack using different common table materials, we choose five typical table top samples (solid wood, acrylic, marble, medium density fiberboard/MDF, copper) as the insulation material between antenna and victim device and repeat our experiment. We conduct the experiment with acrylic sheet and our probe positioning system first and then swap the table top sample so that we can still calculate the statistical dispersion for non-transparent table material. The thickness of these table material samples are all 10mm. Table III shows that when non-metal table materials are used, our attack can achieve similar performance with respect to success rate and dispersion. However, the metal table material does not allow us to perform a valid attack due to its high conductivity.
| Material | Dielectric Constant | Success Rate | QD (X) | QD (Y) |
|---|---|---|---|---|
| acrylic | 2.7 - 4.0 | 100% | 1.0 | 0.5 |
| marble | 3.5 - 5.6 | 76% | 2.6 | 1.0 |
| solidwood | 1.2 - 5 | 90% | 1.6 | 1.4 |
| MDF | 3.5 - 4 | 100% | 1.0 | 1.0 |
| copper | ✗ | ✗ | ✗ | ✗ |
VII-E Table Thickness
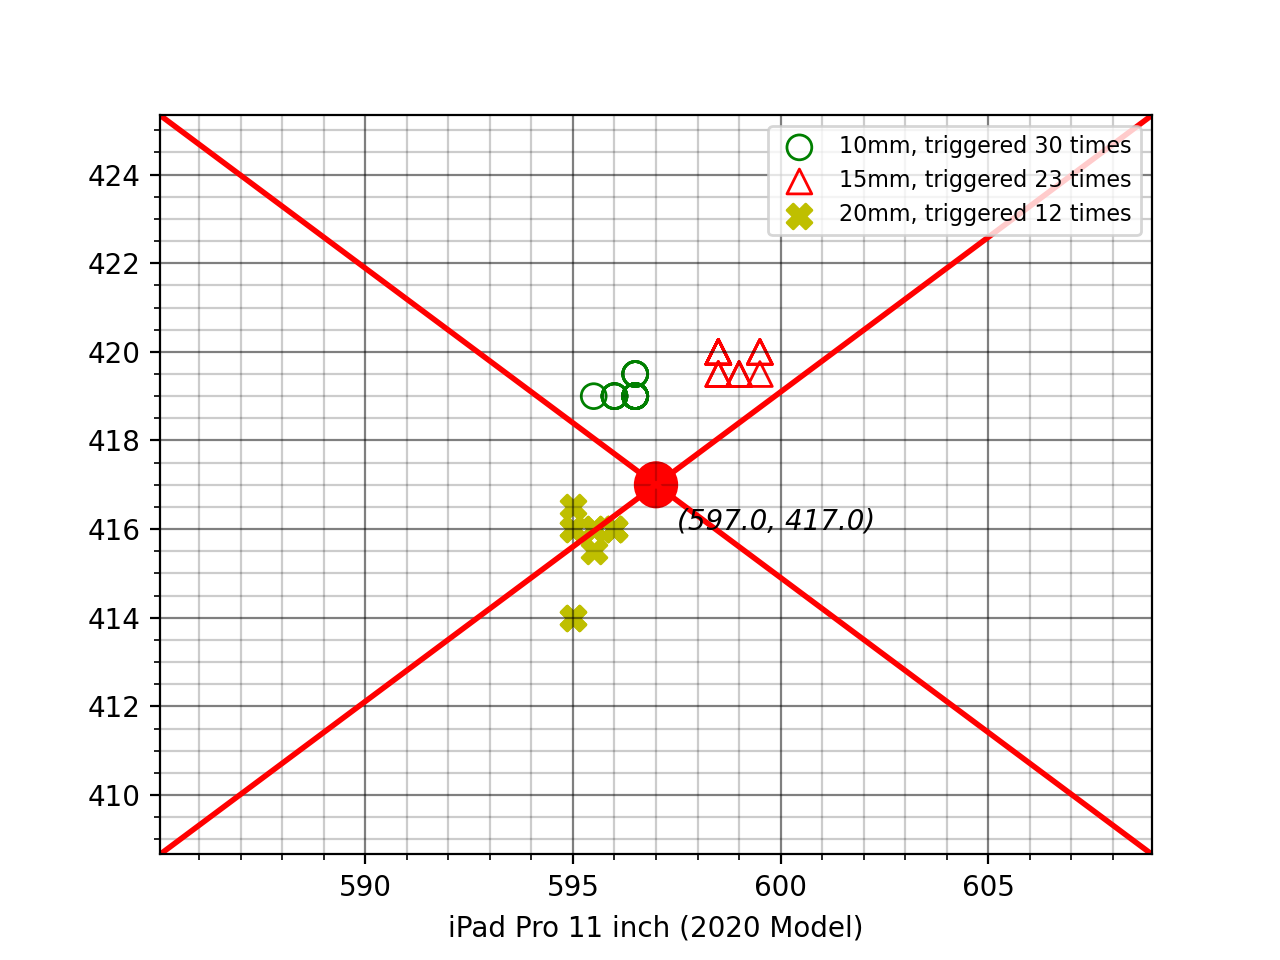
To understand the practicality of our attack, we also evaluate it with respect to success rate and accuracy using different thicknesses of table material. We set the signal generator to sweep mode and each sweep period is set to 1 second, such that the correct interference frequency will be generated every second. The total time of signal generator output lasts 30 seconds. We use our own application to record how many touch events are generated during the test period and where/when they are generated. Using an iPad Pro and acrylic sheets, we conduct the experiments when the thickness of the acrylic sheets is 10mm, 15mm, 20mm. As we can see in Fig. 15, the success rate of our attack is up to 100% when the table thickness is 10mm. The success rate decreases to 76% when the table thickness is 15mm. The success rate eventually drops to 40% when the table thickness is 20mm. In real life, the common table thickness is only 1/2 inch or 5/8 inch based on IKEA [24], Office Depot [25] and Wayfair [26]. Our effective attack distance, 20mm, is larger than the common tabletop thickness.
VII-F Interference Between Antennas
In our experiments, we design and use an antenna array to generate multiple touch events at different locations. However, if we need sequential touch events, only one antenna will be applied with an excitation signal at a certain time and other antennas should be kept as either grounded or floated. However, two antennas that are physically close with each other can easily couple with each other and create undesired touch events at random locations and times. To overcome this issue, we employed isolated and shielded signal cables and antennas. All the signal cables that are used to drive the antenna array are standard SMA-to-SMA shielded cables in order to avoid coupling between each other. Furthermore, copper tape is used to cover the antennas to insulate the generated EM field into a small region as shown in Figure 14.
VIII Practicalities of Touchscreen attack
In this section, we discuss how to utilize the proposed IEMI attack in real attack scenarios. To perform a practical attack, the attacker has three major obstacles to overcome, the design of an IEMI antenna, knowledge of the victim device’s location, and knowledge of a successfully injected touch event. We address all three obstacles by building an antenna array, phone locator, and touch event detector respectively.
VIII-A Design of an IEMI Antenna
In previous sections, we show how to inject simple tap, long hold, and any direction sweep gestures on touchscreens with a single needle IEMI antenna. The injected touch gestures are located directly in the path of the IEMI antenna. Under a practical scenario, however, the touchscreen device can be randomly placed on the tabletop. A single needle IEMI antenna is therefore insufficient to inject a touch event if not placed directly in its path. We consider two solutions to address this issue. First, the attacker can implement a mechanical system to maneuver the single needle IEMI antenna into the desired location of the victim touchscreen device, then perform an IEMI attack. The attacker can then operate the IEMI antenna to perform complicated drawing gestures by continuously generating the interference signal to meet the attack requirement. While possible, we consider this a less-than-ideal solution due to both the size and noise of the mechanical infrastructure required to freely move a single needle IEMI antenna under a tabletop without being detected. This option would therefore require significant effort and cost to ensure a stealthy design. We therefore opt for implementing a static antenna array to reduce the associated engineering and practical issues mentioned above. A modular antenna array allows us to configure the way it is attached, so that we can increase the density of IEMI antennas for a smaller target device without changing the hardware design. In addition to the antenna array, we implement an IEMI channel controller that can independently control up to 64 IEMI antennas using programmable reed relays. The size of the designed IEMI channel controller and antenna array are smaller enough to squeeze into a shoe box. The needles of the antenna array are inserted into foam to support and protect the fragile hardware. The size of the array is 24cm x 17cm, and the distances between the antennas vary between 2cm and 7mm to meet the density requirements for different sizes of target touchscreen devices.
VIII-B The Screen Locators
As we have mentioned in Section II-A, a touchscreen sensing system consists of a grid of TX and RX electrodes. The TX electrodes generate varied excitation signals on different lines while the intersecting RX electrodes sense the physical variations to determine the touch points. Our experiments found that antennas placed near the screen can easily pick up these TX signals. Such signals contain patterns that can tell us at which TX lines the antennas are pointing. Besides, when an antenna is placed perpendicular to the screen, only the pointed TX electrode produces the strongest signals, while nearby electrodes have little impact on the received signals. Hence, the signal received by an antenna can be used to identify the pointed-at location with high spatial resolution. For example, a significant signal strength degradation can be observed when two antennas are placed on both sides of a screen boundary. This feature allows us to accurately detect the screen boundary location with an error of less than 1 cm.
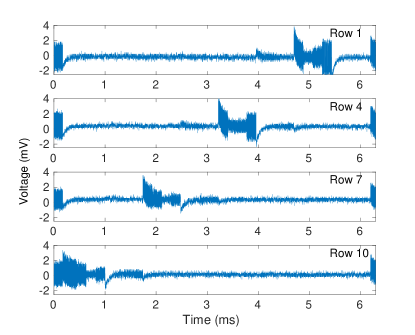
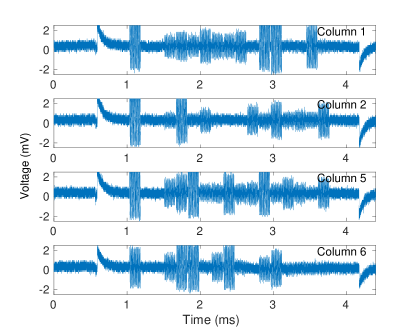
Various driving methods can be used to generate the TX signals. Among all examined devices, we observed two methods being used. The sequential driving method (SDM) is usually implemented to excite the electrodes in turn. As a result, the electrode location can be identified by checking when a TX signal appears. Fig. LABEL:fig:drivingMethod_a shows EM traces collected on four different rows of a Google Pixel 2. We can observe the linear relationship between the rows and the appearing time of TX signals. The orientation and location for this kind of screen can be quickly recovered using a simple linear function. Besides the sequential driving method, we found the parallel driving method (PDM) to be a more frequently implemented technique on most of the latest devices, which uses orthogonal codes to drive all TX signals concurrently. Fig. LABEL:fig:drivingMethod_b shows EM traces collected on four different columns of an iPhone 11 Pro. As we can see, instead of generating signals with the same patterns sequentially, different electrodes produce signals with varied patterns simultaneously. In this case, recovering the location information is more challenging because of the less straightforward correlations between signals and screen locations. However, we can still successfully recover the screen location information using these TX signals with the technique described below.
Our technique consists of three steps: feature extraction, classifier training, and location prediction. As shown in Fig. LABEL:fig:drivingMethod_b, the boundaries between two code bits can be identified, which allows us to segment the signals corresponding to each code bit. For each segment, we can compute descriptive features for a code bit, which can be the phase, the magnitude, or the frequency, depending on the specific encoding schemes used by the screen. Then, we can derive a feature vector for each TX signal by concatenating these features. Afterward, we can train a classifier with enough feature vector and location pairs. This classifier can identify the screen location using the signal collected at an unknown location.
We can identify different TX electrodes in different lines using this technique, but we can not distinguish different locations on the same TX electrode. Expressed differently, for any antenna with a known antenna coordinate , we can obtain a single dimension screen coordinate, which may be or . To determine the other dimension, we also need to know at least one antenna coordinate mapped to the screen boundary to tell us the unknown dimension. As mentioned above, the screen boundary can be accurately located by looking for significant signal strength degradation between two adjacent antennas. With enough antenna coordinate and screen coordinate pairs, we can derive the mapping between them. The mapping between and can be seen as a rotation followed by a translation as described in Equation 15, where represents the rotation while and represent the translation. After solving this equation, we can use this transformation matrix to select the closest antenna to inject the error for any target screen location.
| (15) |
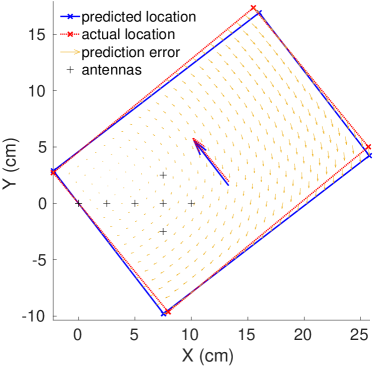
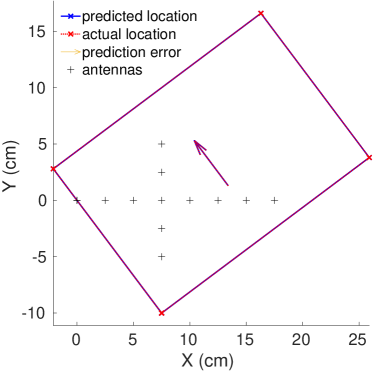
To better demonstrate how the screen locator works, we use an iPad Pro as an example. From a TX signal on the iPad Pro, we can obtain a feature vector with 48 feature values using the magnitude of sinusoidal signals in each segment, which is correlated to the row number on screen. Signals are collected from the bottom row to the top row with a step of 1cm. On each row, signals are collected at 12 different columns. These signals are used to train a k-nearest neighbors (KNN) classifier. In the evaluations, we first use signals collected from 7 antennas in a small area to detect the location and orientation of the tested iPad Pro. Fig. LABEL:fig:iPadLocDetect_a shows the detection results. The predicted location is pretty close to the actual location, with maximum prediction error being 0.8cm. Furthermore, if we use 5 more antennas to collect signals in a larger area, the prediction result matches perfectly with the actual location.
We tested our screen locator on 5 devices listed in Table IV. We list the driving methods used by these devices, the sample rate we use to collect the data, the average prediction error, and the average computation time. Note that for screens using SDM, the location is computed using the time stamp read from an oscilloscope.
| Device | Driving Method | Sample Rate | Error | Time |
|---|---|---|---|---|
| Nexus 5X | SDM | 50MSa/s | 0.42 cm | N/A |
| Google Pixel 2 | SDM | 50MSa/s | 0.51 cm | N/A |
| iPhone 11 Pro | PDM | 1MSa/s | 0.3 cm | 0.08s |
| OnePlus 7 Pro | PDM | 2MSa/s | 0.06 cm | 0.14s |
| iPad Pro | PDM | 1MSa/s | 0.18 cm | 0.17s |
VIII-C The Touch Event Detectors
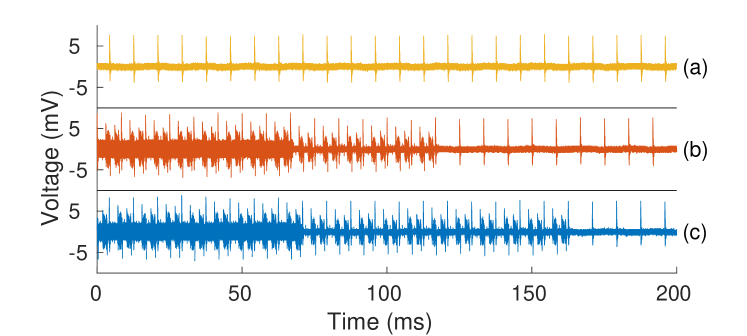
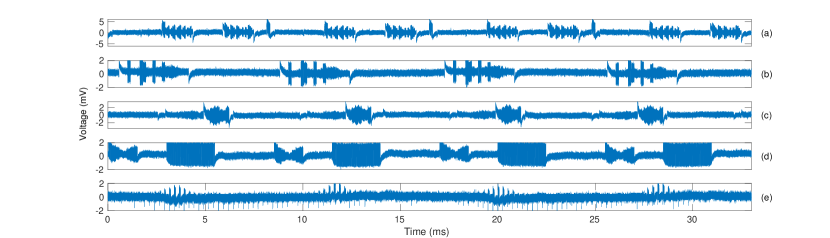
To perform an attack which requires several touch events to complete, it is important to know whether the current touch event injection is successful before proceeding to inject the next touch event at a different location. In certain cases injection of a successful touch event may take more time than expected. As introduced in Section XI, there are multiple techniques to detect the current screen content out of sight. However, these techniques can be difficult to use without significant effort. In our work, instead of detecting if we have altered the screen content as desired, we detect if our last touch event injection was successfully applied on the screen. The key behind such detection is the active scanning mechanism used by modern touchscreen controllers [27]. To achieve balance between the power efficiency and scanning accuracy, touchscreen controllers perform reduced scanning to preserve the power. Once a touch event is detected on the touchscreen, the controller changes the scanning mode from reduced scan to full scan to measure the touched location more accurately. If there are no more touch events detected, the controller switches back to reduced scan mode automatically. Although we do not have a datasheet for a commercial touchscreen controller, using our IEMI antenna we observed similar behavior on all tested touchscreen devices. More importantly, if the touch event is successfully injected on a target device and recognized by the operating system, the touchscreen controller takes a longer time to switch back to reduced scan mode. As shown in Figure 18a, the iPad Pro emits a sparse scanning signal with 120Hz frequency when no finger or IEMI signal is present. Figure 18b shows how the touchscreen switches from full scan mode back to reduced scan mode after we turn off our IEMI signal. We can also see the touchscreen recognizes our IEMI signal as a touch event but eliminates it due to the wrong interference frequency. In Figure 18c, we apply a correct IEMI signal and successfully trigger a touch event on screen. The time that the controller takes to switch back to reduced scan mode is discernibly longer compared to the previous experiment. Such phenomena is stable and is exhibited on all our tested devices. Using this technique, we examine the collected touchscreen emission signal right before we turn off the IEMI attack and detect if any touch event was injected in the previous attempt. Our experimental results show that this approach works every time on our three main test devices (iPad Pro, iPhone 11 Pro and Oneplus 7 Pro). The touch event detector is implemented as a dedicated IEMI antenna which connects to an oscilloscope.
IX Evaluation of Practical Attacks
IX-A The Attack Setup
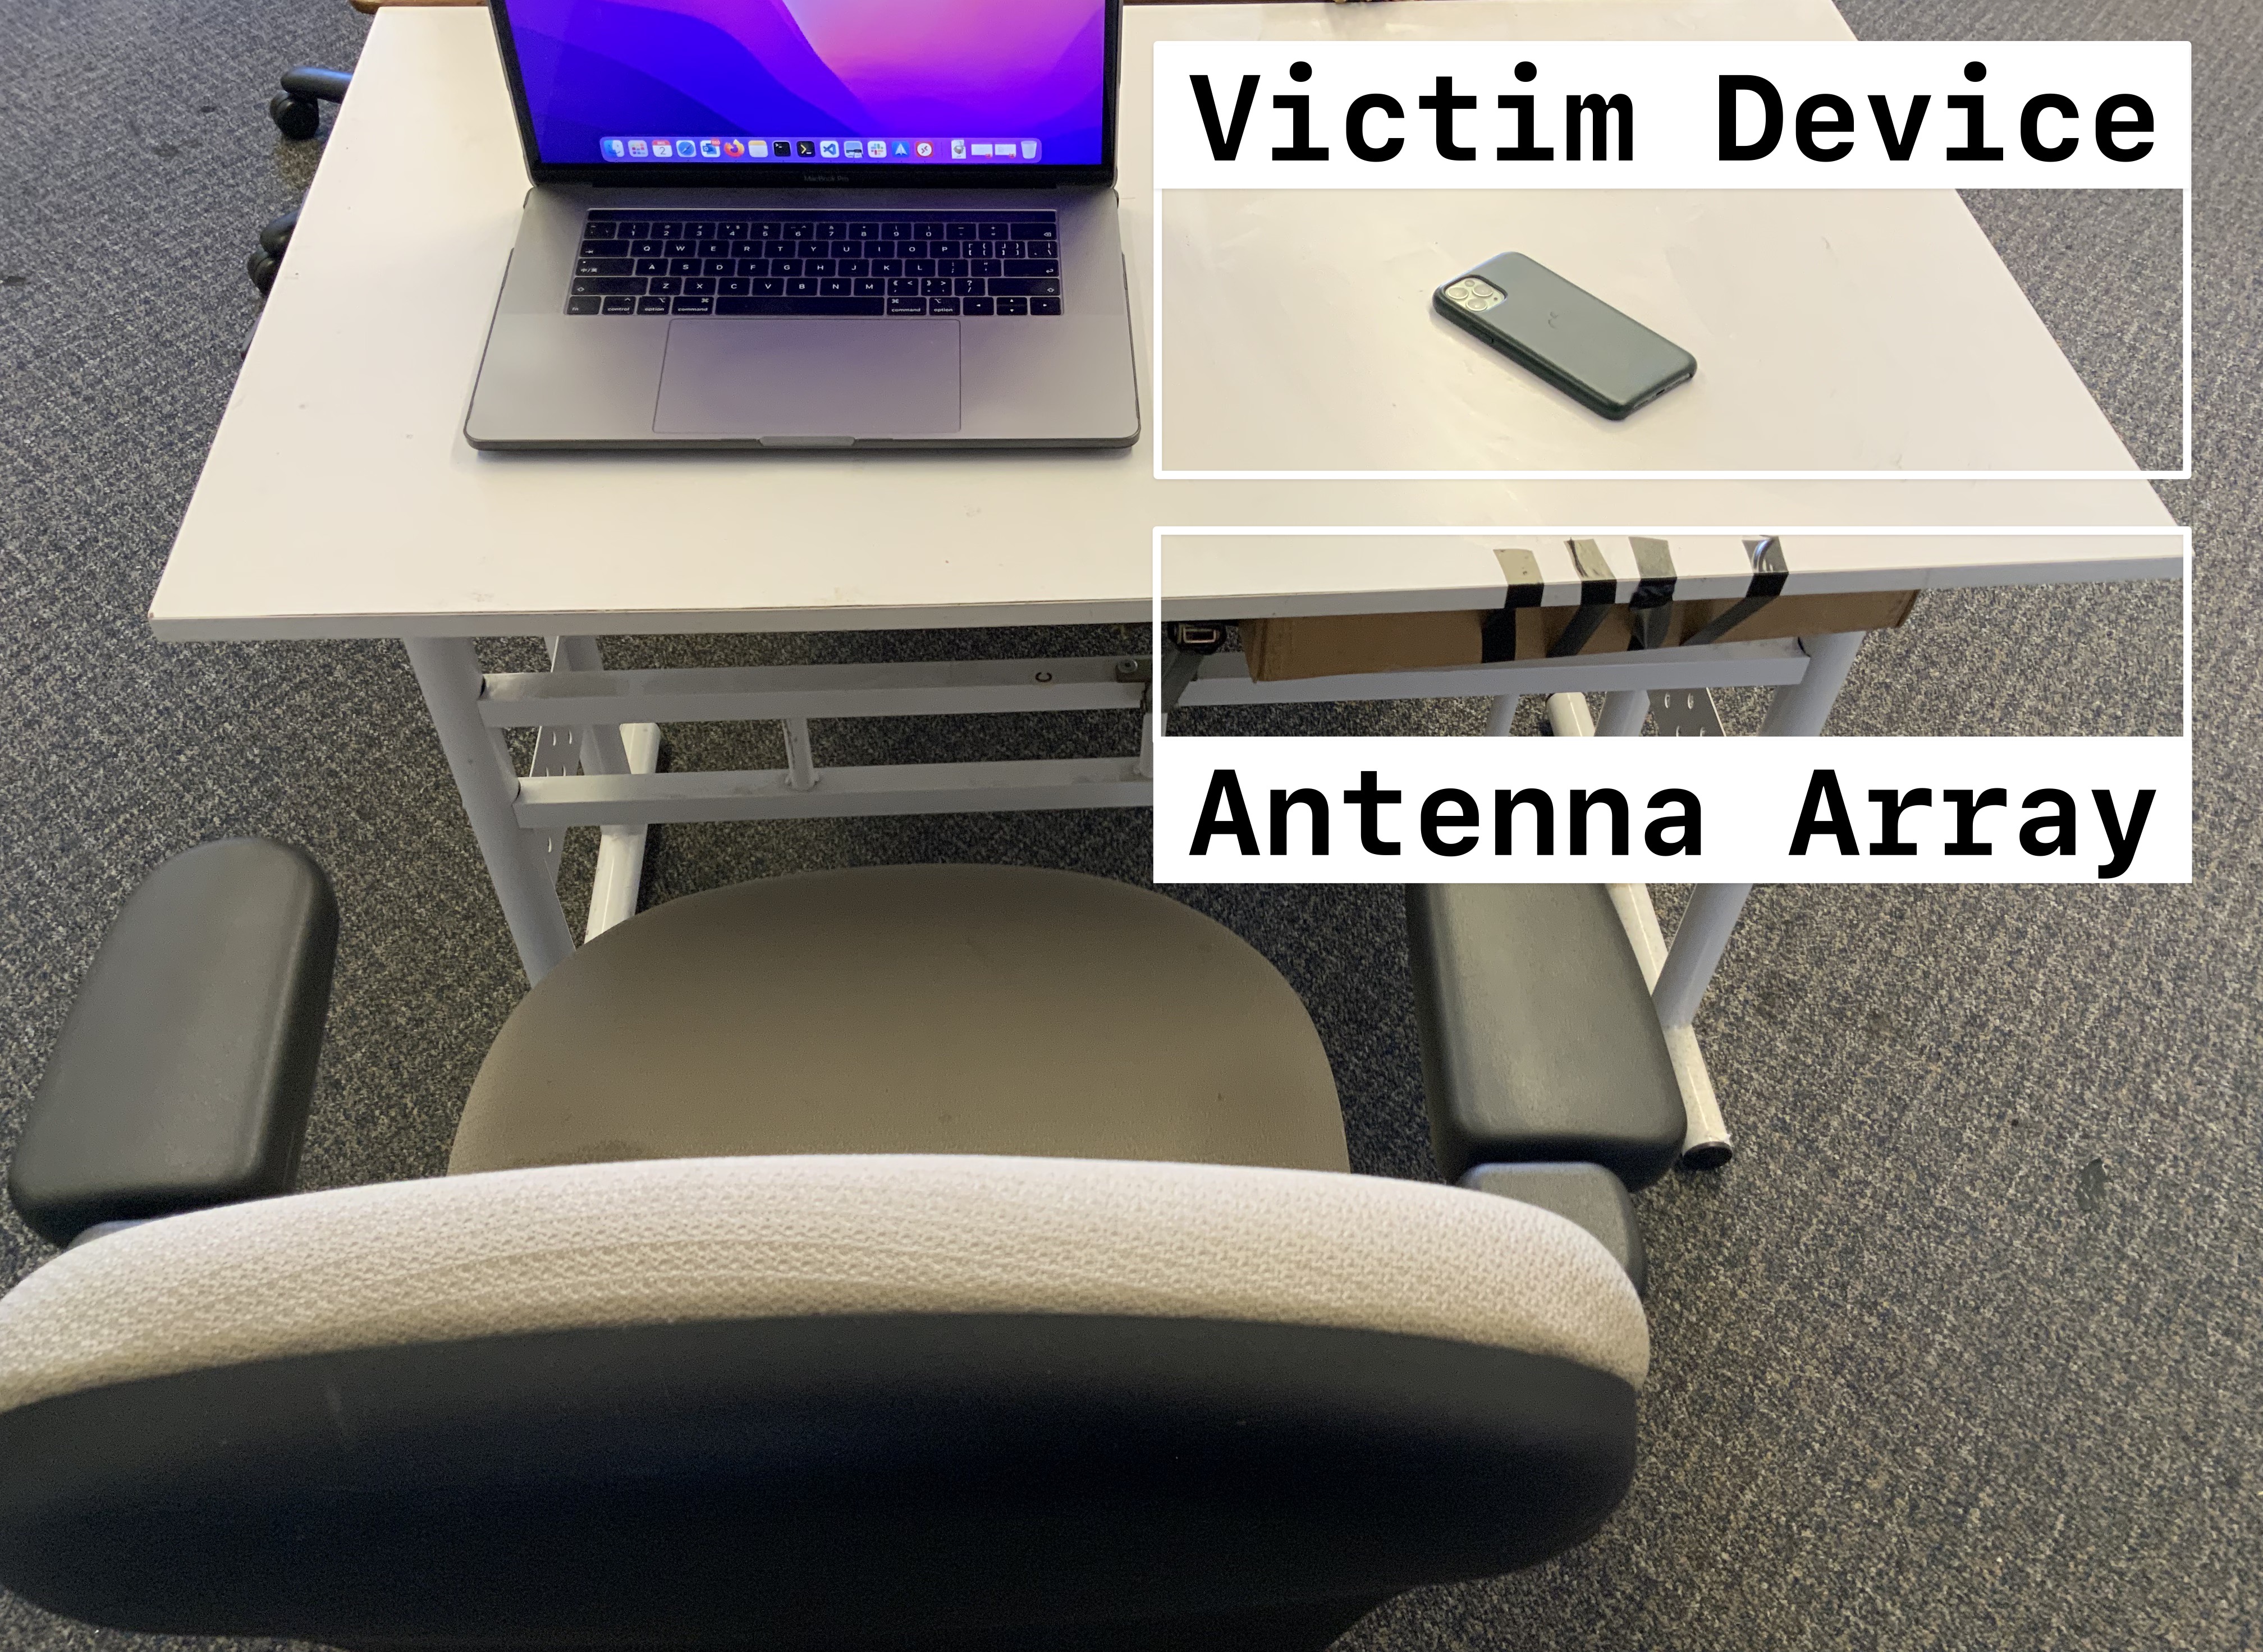
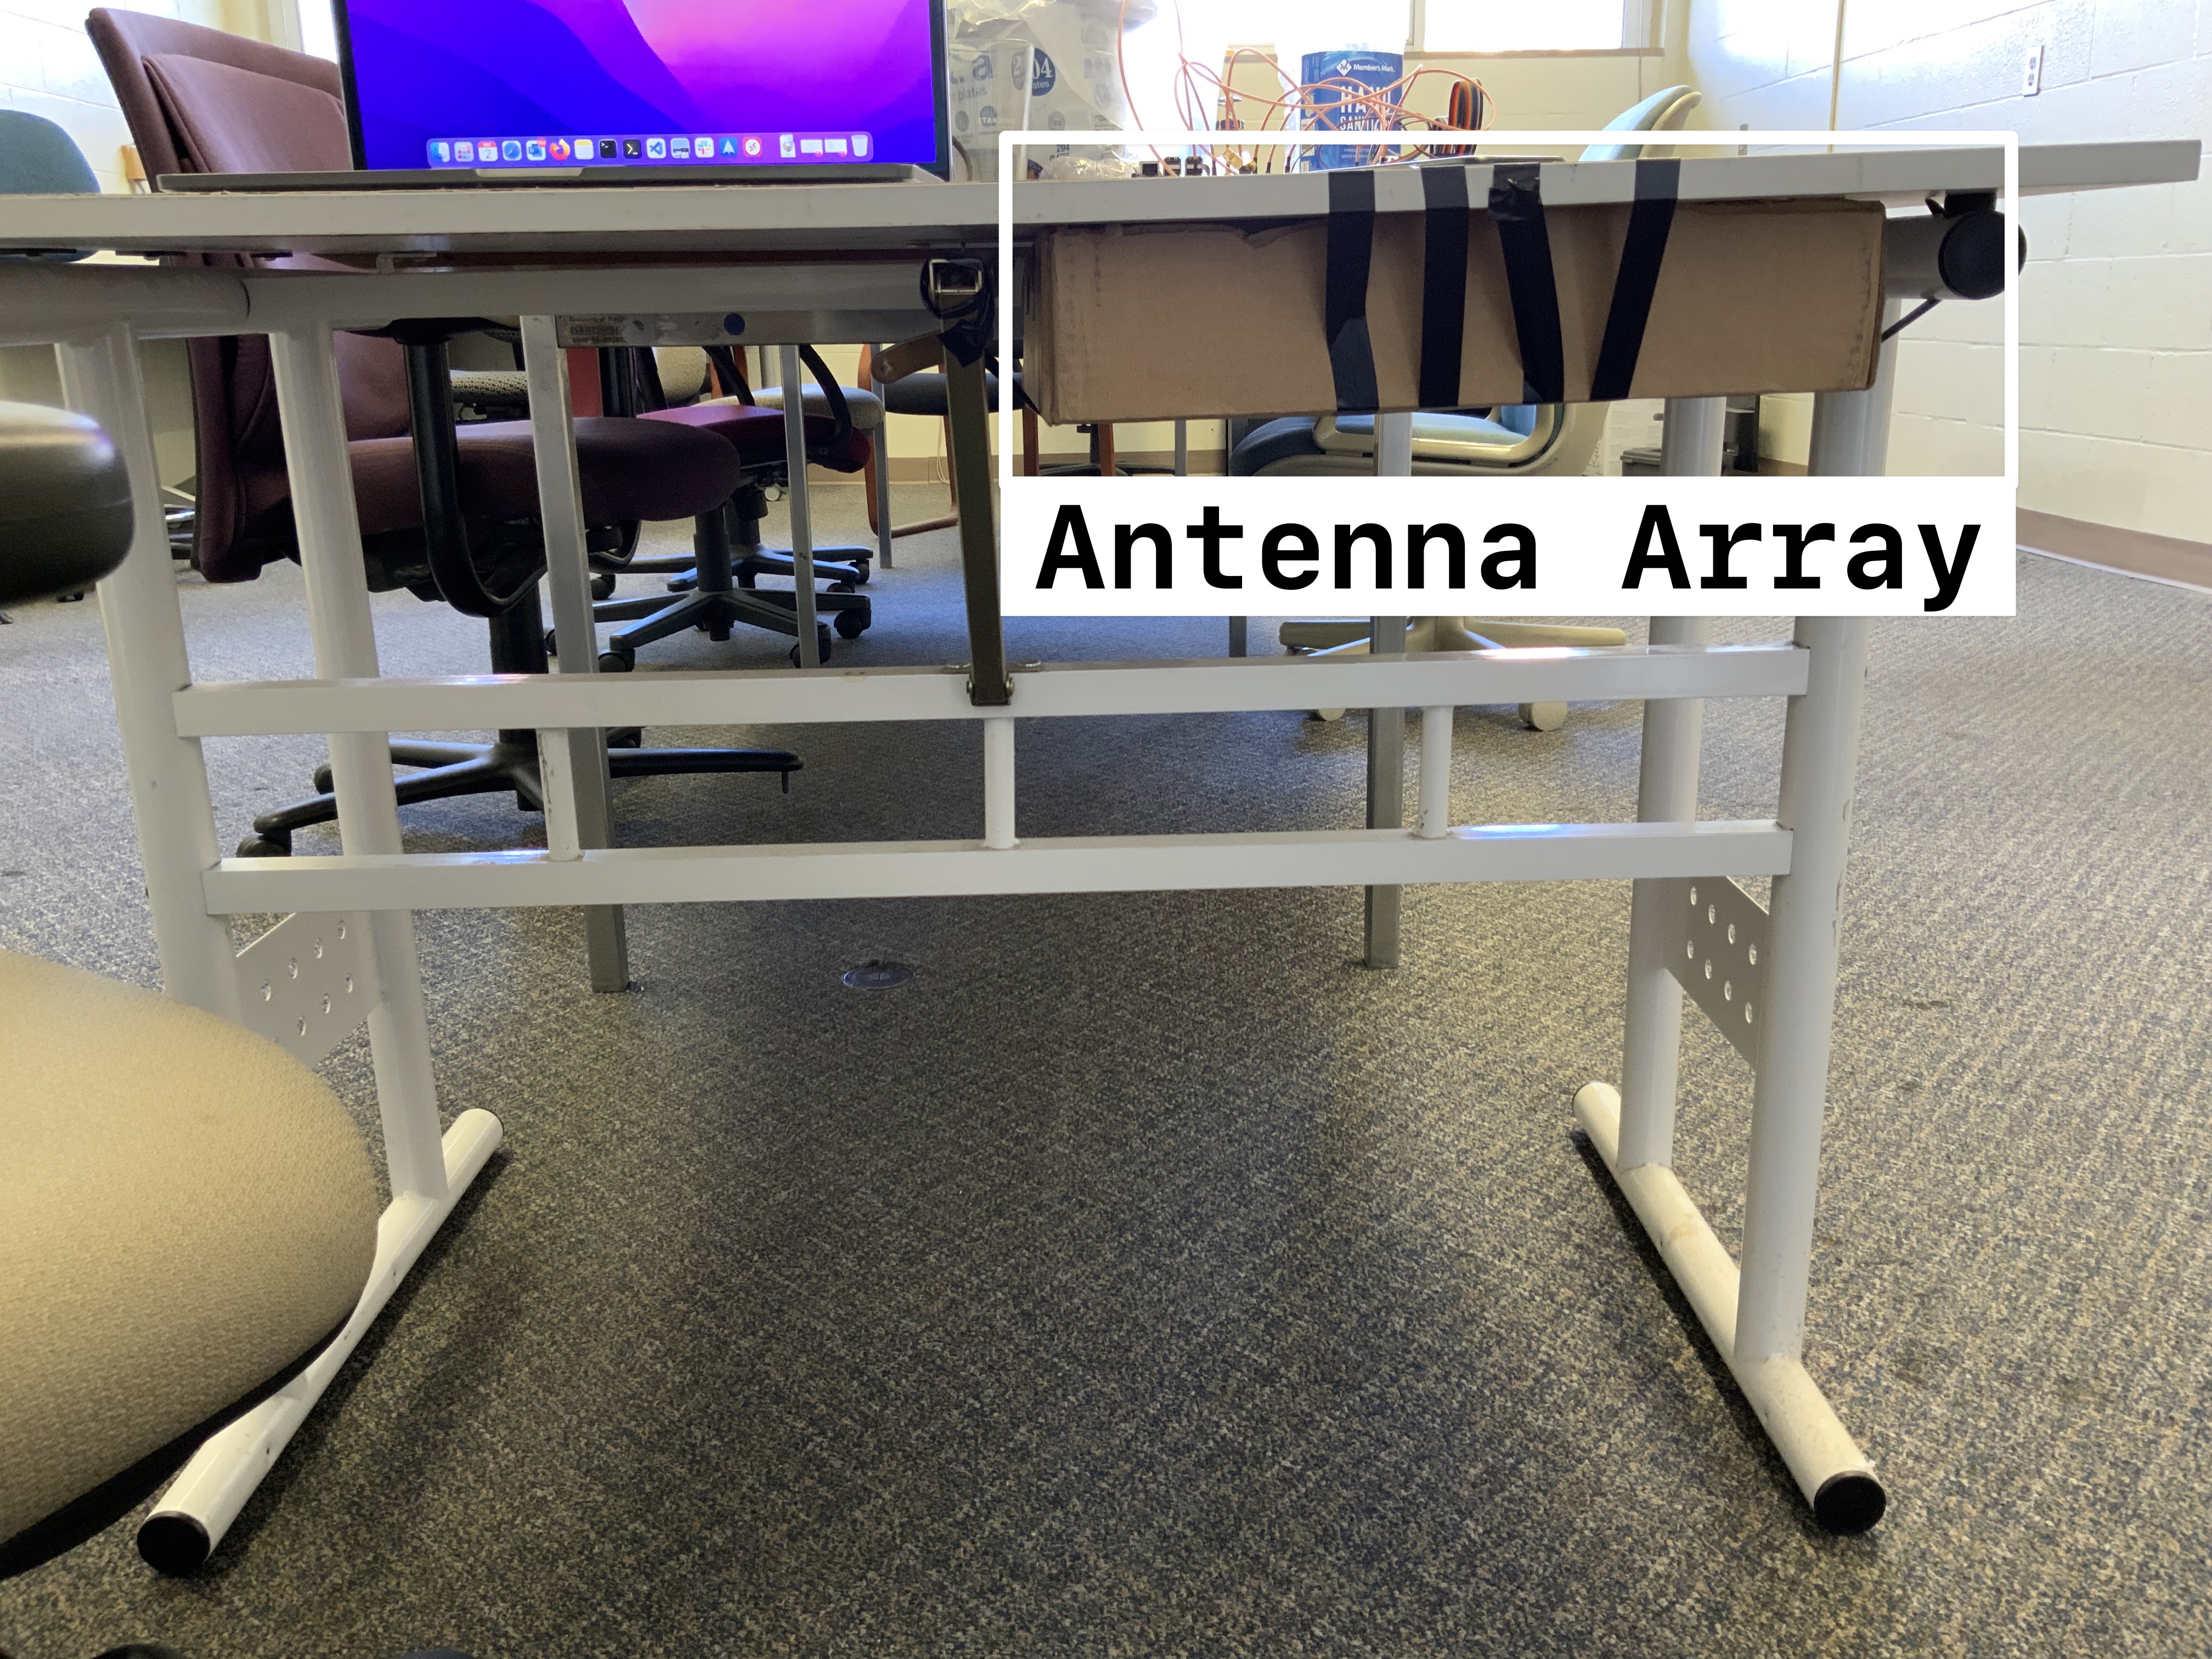
With our antenna array, phone locator and touch event detector in place as shown in Figure 19, we are ready to conduct an actual attack that mimics practical scenarios. We tape our antenna array under the left-bottom corner of an experimental bench made of MDF with a table thickness of 15mm. A laptop is placed at the left side of the table outside of the detect/attack range of our antenna array. During the experiment, we ask “the victim”, who has no prior knowledge of the exact location of our antenna array, to sit in front of our experimental bench and put our unlocked test target device facing down. We then use our phone locator to infer the current position and orientation of our target device, perform the attack vectors and monitor the injected touch events. Note that we do not ask “the victim” to use their own devices as we may alter or leak private content of the target device during the experiments.
IX-B Attack Evaluation
To evaluate the setup in a practical scenario, we choose three different touchscreen devices as our target devices: 1) an iPad Pro 2020; 2) an iPhone 11 Pro; and 3) a Oneplus 7 Pro. These three devices are pre-installed with our touch event detection application and remotely mirror their current display onto another monitor. Note that this application is only installed to better illustrate the injected touch events during the experiment. Attackers can perform a similar attack without installing the application ahead-of-time. The test device is unlocked and randomly placed on our antenna array with different angles and orientations as described above. We first use the antenna array to capture and analyze the emitted signal from the target device to predict its current position and orientation. We have found in our experiments that our phone locator program typically needs 4 antennas at different locations to infer the phone location within 3 seconds with a sampling rate of 1M/s. Once we have the precise location of the target device, we switch the antenna array from monitor mode to attack mode by switching the corresponding relays. We choose the appropriate interference frequency and amplitudes based on the target phone model. We then use our attack setup to launch two different type of attacks against the touchscreen devices under test using either a precise touch event injection or sequence of touch events at different locations as needed.
Leveraging Siri on iOS devices Installing unauthorized applications on an iOS device can be difficult due to strict iOS application distribution. Instead, we leverage our touch event injection attack to abuse Apple’s accessory discovery mechanism to perform data exfiltration. An iOS device automatically finds nearby unpaired Apple accessories, such as Airpods headphones. Once these devices are found, a notification pops up and asks the user if the device should pair and connect. The notification issues a Connect request that prompts the user to grant access. To connect with the device the user only needs to tap the Connect button without further action. Once connected, the user can directly uses the Airpods to wake up and interact with Siri, the voice assistance on Apple devices. The Connect request notification is always displayed at a fixed location. In our experiments, we find the size of the Connect button is approximately 5.5 cm by 1 cm. The confirmation button occupies roughly 2/3 of the screen width on an iPhone Pro 11 which makes it easier to attack. On the contrary, the size of this button on an iPad Pro is much smaller compared to the size of the screen. However, our attack is still feasible on the iPad Pro due to its accuracy (see Section VII and Table II). We first conduct an experiment to validate the possibility of such an attack on a randomly placed iPhone 11 Pro and iPad Pro 2020 using unpaired Airpods. After successfully pairing with the Airpods we wake up Siri to read out the new messages of the victim devices. To further evaluate the success rate of our attack on iOS devices, we use our touch event application to draw a square space of the same size as the confirmation button. We randomly place the victim device on our antenna array and repeat the process of sensing/attack/detection and then evaluate if the injected touch events falls into the intended region. Our attack works 6 out of 10 times on iPad Pro with an no more than 12 seconds of attack time and works 9 out of 10 times on an iPhone 11 Pro with no more than 9 seconds of attack time. The random placement of test devices outside the range of our antenna array are not included in the metric calculation. During the experimentation, we find that the main point of failure for an attack on an iPad Pro is that the distance between our IEMI antennas is too large to have at least one IEMI antenna placed on top of the confirmation button. The current configuration of number of IEMI antennas and the distance between IEMI antennas is a tradeoff between antenna array coverage and antenna density that should be selected based on the target device screen size.
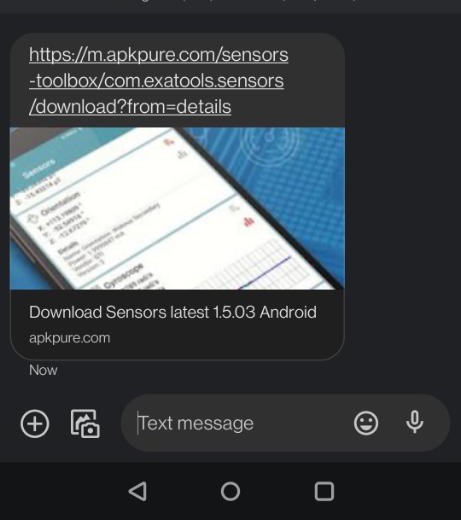
Installing malicious applications on Android devices To attack Android based touchscreen devices, we use our IEMI to inject multiple touch events at different screen locations. More specifically, we assume the attacker knows the phone number of the victim device and sends it a message which contains the link of a malicious application. To install the malicious application, we need to generate 5 distinct touch events in sequence at different locations, including a tap on the notification of new message (1 large clickable area), choose action for link (2 buttons in a row, open link/copy text), allow saving the APK file (2 adjacent buttons), install the APK file after downloading (1 button), and finally open the APK after installation (2 adjacent buttons). We use a Oneplus 7 Pro to evaluate this attack. We first measure the location and orientation of the victim device. We then initiate the attack by sending a message containing the download link of designated application. Once the message is sent, we use one IEMI antenna that points to the middle of the screen and two IEMI antennas at the bottom part of the screen to inject the five touch events in sequence. Each individual touch event is evaluated with our touch event detector before moving on to the next touch event. We conducted 10 experiments with different cellphone locations. We achieved three successful attacks with our setup. Using the mirrored display, we find that most of the failed attempts were due to incorrectly inducing a touch event on adjacent buttons. For example, the injected touch event incorrectly presses the CANCEL button and causes the entire attack to immediately fail. We believe a better designed IEMI antenna would allow us to focus the generated E field on a smaller attack area, thereby making our attack more robust.

IX-C Attack Vectors with Human Operation
In the previous section, we presented the design of a static antenna array and how it can be use to perform security oriented attacks on multiple devices in several real scenarios. Although the antenna array is easy to build and use, more powerful attacks can be carried out if the attacker has both access and the ability to use a programmable mechanical system with our touch event injection techniques, such as a miniature 3D printer [28] or robotic arm[29] commonly used in side channel analysis research. In this case, our IEMI antenna more closely mimics the presence of a human finger and the mechanical system mimics a human arm. To illustrate the capabilities of our attack in this setting, we opt to manually maneuver our IEMI antennas to simulate the attack with the mechanical system. With the short-tap, press-and-hold and continuous omni-directional-swipe we achieve the following security oriented attack outcomes. We believe these attacks are feasible and practical to implement for a motivated attacker.
Send Message (Short-Tap) With the short tap, we can send a specific message to a recipient. In practice, such capabilities can be abused to reply with confirmation messages when banks request text verification for suspicious credit card transactions. In our experiment, we move our IEMI antenna to generate short-tap touch events on top of the letters “Y, E, S” and the enter position to send a confirmation message. The experiment is conducted on an iPhone 11 Pro and a successful operation takes less than 10 seconds.
Send Money (Press-and-Hold) A typical use case of press-and-hold on iOS is providing shortcuts for certain functionalities with minimum user interaction. For instance, Paypal allows iOS users to hold-and-press the application icon to activate and send money by showing the QR code without actually launching the application. We continuously apply our interference signal on an iPad pro and point the IEMI antenna toward the Paypal application to trigger this feature and evaluate the feasibility of such an attack. We then move the antenna down to press on the ”Send Money” option and then turn off the interference signal to show the send money QR code. We successfully launched this attack 7 out of 10 times at an attack distance of 10mm. The completion time for every iteration of the attack was within 5 seconds. We found that human error, accidentally increasing the attack distance while holding the antenna, was the reason for failed attack attempts.
Unlock Gesture Lock Screen (Omni-Directional-Swipe) A significant achievement of our work compared to previous approaches is that we can inject omni-directional-swipes with a controllable duration. As we show in our video demonstration where we draw a figure with our IEMI antenna, if the attacker can control the location of the IEMI antenna a gesture lock screen unlock attack can be performed. We evaluate the feasibility by trying to unlock a gesture lock protected application on an iPad Pro. The gesture lock we setup has the shape of “Z” which includes 7 points at three different rows and columns. This attack was successful 3 out of 5 times at an attack distance of 10mm. The completion time for every iteration of the attack was similarly within 5 seconds. The total travel distance of the IEMI antenna was 14 cm.
X Countermeasures
Force Detection: Force and pressure add a new dimension on top of existing touchscreen techniques. High end touchscreen controllers [30] can detect the force applied on the touchscreen with a scale from 1 to 10. The force sensors used in the touchscreen can detect subtle differences in the amount of pressure of each touch. Since the introduced ghost touches may not cause any pressure on the touchscreen, the underlying system can check both force sensors and touchscreen controllers to filter out the ghost touches. The test devices that we have do not have such features, so we use a barometer as a substitute for detecting the pressure on the touchscreen for those devices equipped with one. In our touch gesture detection application, we read the barometer value whenever a touch event occurs. For example, the barometer value on the Pixel 2 changes 0.3 hPa when the screen is pressed with a finger for more than 1 second. We successfully detect injected long press and swipes on a Pixel 2 using the barometer. However, this method is limited to Android devices with water resistance, otherwise the barometer value does not change even with a human finger pressing on the touchscreen.
Low-Cost Accessory: Apart from manufacture level countermeasures, end users may use smartphone or tablet cases with metal front covers to block all EM interference including the IEMI attacks. In fact, such products are already available in the market [31] and originally designed to prevent the NFC card skimming attack [32]. To evaluate this countermeasure, we use a regular phone case with front cover and tap the inner layer with Faraday Fabric. We keep the phone awake while using the phone with our customized phone case. Even though the thickness of the Faraday Fabric is only 0.28mm, it still defends our attack considerably well. We were no longer able to inject the touch events onto any test devices except for rare ghost touches at the edge of the touchscreen where the Faraday Fabric is not covered well. This countermeasure does not require any specific hardware or software to be present on the touchscreen device and can be implemented with minimum effort.
XI Related Work
XI-A IEMI Attacks
IEMI attacks have been applied to different devices and systems, including medical devices [33], smart phones [34, 35], embedded systems [36, 37, 38], autonomous vehicles[39, 40], etc.
Among these attacks, Delsing et al. [38] examined the effects of an IEMI attack on sensor networks and revealed the susceptibility of sensor networks to high frequency (in GHz range) IEMI. Selvaraj et al. [36] further expanded this attack and demonstrated that small circuits (i.e., embedded systems) are vulnerable to low frequency IEMI with proper coupling. Kennedy et al. also studied how IEMI can be used to create interference on the analog voltage input port of an Analog to Digital Converter [37].
Kune et al. conducted comprehensive analysis of IEMI attacks against analog sensors and demonstrated IEMI attacks on cardiac medical devices by remotely injecting forged signals [33] that cause pacing inhibition and defibrillation. In this paper, the authors also demonstrated how to inject audio signals on microphones remotely and proposed digital mitigations to verify and clean the input signal. Kasmi and Esteves [34, 35] exploited the voice assistant on smart phones to perform remote inaudible command injection attacks against smartphone headphone cables using fine tuned EM signals.
XI-B Touchscreen Attacks
Various attacks targeting touchscreens have been presented in the past. These attacks are primarily focused on passive information exfiltration, e.g., displayed content, via different carriers including microphone [8], EM [7] or mmWave signal [9]. In addition, only two papers [11, 12] are published to perform active touchscreen attack using IEMI. Maruyama et al. [11] presented Tap’n Ghost, a new class of active attack against capacitive touchscreens, which leverages an injected noise signal and programmed NFC tag to force a victim mobile device to perform unintended operations. However, this attack can only be conducted along with user touches due to the skewed spatial distribution. On the contrary, our touchscreen IEMI attack can cause intentional ghost touches on a capacitive touchscreen without any user interaction. A recent touchscreen attack, Ghosttouch [12], similarly used EMFI to inject taps and row/column based swipe gestures. Although the attack is more advanced than Tap’n Ghost, it relies on detecting the correct driving signal from the touchscreen and synchronizing it with IEMI signal to induce accurate touch events. However, we find that the driving mechanism is significantly different on different smartphones, which makes the attack less feasible in a real attack scenario. As shown in Appendix Figure A-1, the measured driving signal from five different touchscreen devices are entirely different. The Nexus 5X smartphone used in Ghosttouch shows a clear synchronization pattern. On the other hand, other smartphones use a parallel driving mechanism which is difficult to synchronize with. Ghosttouch works well on sequential driving based touchscreens. Unfortunately this is no longer a popular option for the most recently released touchscreens. Furthermore, Ghosttouch is limited to either column or row based swipe gestures due to the synchronization. Our attack does not need to perform synchronization, nor rely on a specific type of driving mechanism to inject stable short-tap, long-press, and omni-directional-swipe touch events to realize practical attacks.
XII Conclusions and Future Work
In this paper, we first developed theory for a novel IEMI attack on modern capacitive touchscreens to generate ghost touches. The theory was then validated in both simulations and experimental demonstrations. We identify that such a vulnerability exists in almost all capacitive touchscreen-based devices under radiated IEMI attacks. The mechanism of the induced ghost touches cause is analyzed based on the operating principle of touch sensing. The critical field strength that can generate ghost touches is calculated, along with the critical frequencies at which the touchscreens are more vulnerable to IEMI attacks. The IEMI attack is successfully demonstrated on a series of commercial touchscreens of laptop, smartphone, and tablets under various attack scenarios. We elaborate on the features affecting our IEMI attack, including table material, table thickness, phone locations, and antenna interference. Using our antenna array, screen locator, and touch event detector, we design and evaluate the first end-to-end touchscreen attack in real scenarios. We address several limitations presented in previous touchscreen attacks. We further evaluate the proposed countermeasures against our attack.
In the future, we plan to increase our attack distance and attack accuracy by using different antenna designs, i.e., longer waveguide (copper needle), far-field phased array antenna, and Yagi-Uda (directional) antenna. We plan to evaluate phased array antenna and Yagi-Uda antenna to programmatically generate the focused E field from far so that we can address the current table thickness limitation. On the other side, phased array antenna and Yagi-Uda antenna can carry significant implementation challenges compared to a copper needle antenna.
XIII Acknowledgment
We genuinely appreciate the reviewers for all their constructive suggestions. This work is supported by National Institute of Standards and Technology, Intel and National Science Foundation under award number 1818500.
References
- [1] T. Wang and T. Blankenship, “Projected-capacitive touch systems from the controller point of view,” Information Display, vol. 27, no. 3, pp. 8–11, 2011.
- [2] L. Cai and H. Chen, “Touchlogger: Inferring keystrokes on touch screen from smartphone motion.” HotSec, vol. 11, no. 2011, p. 9, 2011.
- [3] A. J. Aviv, B. Sapp, M. Blaze, and J. M. Smith, “Practicality of accelerometer side channels on smartphones,” in Proceedings of the 28th annual computer security applications conference. New York, NY, USA: Association for Computing Machinery, 2012, pp. 41–50. [Online]. Available: https://doi.org/10.1145/2420950.2420957
- [4] E. Owusu, J. Han, S. Das, A. Perrig, and J. Zhang, “Accessory: password inference using accelerometers on smartphones,” in proceedings of the twelfth workshop on mobile computing systems & applications. San Diego, California, USA: Association for Computing Machinery, 2012, pp. 1–6.
- [5] Z. Xu, K. Bai, and S. Zhu, “Taplogger: Inferring user inputs on smartphone touchscreens using on-board motion sensors,” in Proceedings of the fifth ACM conference on Security and Privacy in Wireless and Mobile Networks. New York, NY, USA: Association for Computing Machinery, 2012, pp. 113–124. [Online]. Available: https://doi.org/10.1145/2185448.2185465
- [6] E. Miluzzo, A. Varshavsky, S. Balakrishnan, and R. R. Choudhury, “Tapprints: your finger taps have fingerprints,” in Proceedings of the 10th international conference on Mobile systems, applications, and services. New York, NY, USA: Association for Computing Machinery, 2012, pp. 323–336. [Online]. Available: https://doi.org/10.1145/2307636.2307666
- [7] Y. Hayashi, N. Homma, M. Miura, T. Aoki, and H. Sone, “A threat for tablet pcs in public space: Remote visualization of screen images using em emanation,” in Proceedings of the 2014 ACM SIGSAC Conference on Computer and Communications Security. New York, NY, USA: Association for Computing Machinery, 2014. [Online]. Available: https://doi.org/10.1145/2660267.2660292
- [8] D. Genkin, M. Pattani, R. Schuster, and E. Tromer, “Synesthesia: Detecting screen content via remote acoustic side channels,” in 2019 IEEE Symposium on Security and Privacy (SP). San Francisco, CA, USA: IEEE, 2019, pp. 853–869.
- [9] Z. Li, F. Ma, A. S. Rathore, Z. Yang, B. Chen, L. Su, and W. Xu, “Wavespy: Remote and through-wall screen attack via mmwave sensing,” in 2020 IEEE Symposium on Security and Privacy (SP). San Francisco, CA, USA: IEEE, 2020, pp. 217–232.
- [10] S. Maruyama, S. Wakabayashi, and T. Mori, “Poster: Touchflood: A novel class of attacks against capacitive touchscreens,” in Proceedings of the 2017 ACM SIGSAC Conference on Computer and Communications Security. New York, NY, USA: Association for Computing Machinery, 2017, pp. 2551–2553. [Online]. Available: https://doi.org/10.1145/3133956.3138829
- [11] ——, “Tap’n ghost: A compilation of novel attack techniques against smartphone touchscreens,” in 2019 IEEE Symposium on Security and Privacy (SP), IEEE. San Francisco, CA, USA: IEEE, 2019, pp. 620–637.
- [12] K. Wang, R. Mitev, C. Yan, X. Ji, A.-R. Sadeghi, and W. Xu, “GhostTouch: Targeted attacks on touchscreens without physical touch,” in 31st USENIX Security Symposium (USENIX Security 22). Boston, MA: USENIX Association, Aug. 2022. [Online]. Available: https://www.usenix.org/conference/usenixsecurity22/presentation/wang-kai
- [13] G. Barrett and R. Omote, “Projected-capacitive touch technology,” Information Display, vol. 26, no. 3, pp. 16–21, March 2010.
- [14] C. Luo, M. A. Borkar, A. J. Redfern, and J. H. McClellan, “Compressive sensing for sparse touch detection on capacitive touch screens,” IEEE Journal on Emerging and Selected Topics in Circuits and Systems, vol. 2, no. 3, pp. 639–648, 2012.
- [15] L. Du, “An overview of mobile capacitive touch technologies trends,” arXiv preprint arXiv:1612.08227, 2016.
- [16] T. Hwang, W. Cui, I. Yang, and O. Kwon, “A highly area-efficient controller for capacitive touch screen panel systems,” IEEE Transactions on Consumer Electronics, vol. 56, no. 2, pp. 1115–1122, 2010.
- [17] Y. ichi Hayashi, N. Homma, T. Mizuki, H. Shimada, T. Aoki, H. Sone, L. Sauvage, and J.-L. Danger, “Efficient evaluation of em radiation associated with information leakage from cryptographic devices,” IEEE Transactions on Electromagnetic Compatibility, vol. 55, no. 3, pp. 555–563, 2013.
- [18] B. Oldenburg, “The yagi-uda antenna: An illustrated primer,” Aug 2019. [Online]. Available: https://www.citationmachine.net/apa/cite-a-website/new
- [19] E. Savage and W. Radasky, “Overview of the threat of iemi (intentional electromagnetic interference),” in 2012 IEEE International Symposium on Electromagnetic Compatibility. Pittsburgh, PA, USA: IEEE, 2012, pp. 317–322.
- [20] The Chromium Projects, “Touch Firmware Tests,” https://www.chromium.org/for-testers/touch-firmware-tests, Apirl 2015, online; accessed 29 April 2021.
- [21] M. G. A. Mohamed, K. Cho, and H. Kim, “Frequency selection concurrent sensing technique for high-performance touch screens,” Journal of Display Technology, vol. 12, no. 11, pp. 1433–1443, Nov 2016.
- [22] I. ANSYS, “Ansys hfss — 3d high frequency simulation software,” Aug 2021. [Online]. Available: https://www.ansys.com/products/electronics/ansys-hfss
- [23] Y. Zhang, S. Wang, and Y. Chu, “Investigation of radiated electromagnetic interference for an isolated high-frequency dc–dc power converter with power cables,” IEEE Transactions on Power Electronics, vol. 34, no. 10, pp. 9632–9643, 2019.
- [24] IKEA, “Table desk systems for home office workspace.” [Online]. Available: https://www.ikea.com/us/en/cat/table-desk-systems-47423/
- [25] O. Depot, “Conference tables — office depot officemax.” [Online]. Available: https://www.officedepot.com/a/browse/conference-tables/N=5+501913/
- [26] Wayfair, “Conference tables.” [Online]. Available: https://www.wayfair.com/meeting-collaborative-spaces/sb0/conference-tables-c251667.html
- [27] Microchip, MTCH6303 Projected Capacitive Touch Controller Data Sheet, Mar 2005. [Online]. Available: https://ww1.microchip.com/downloads/en/DeviceDoc/40001803A.pdf
- [28] riscure, “Xyz stage (for em probe, em-fi or compact laser) — riscure.com.” [Online]. Available: https://getquote.riscure.com/en/quote/2101124/xyz-stage-for-em-probe-em-fi-or-compact-laser.htm
- [29] Keysight, “Articulated robotic near-field electromagnetic scanning system.” [Online]. Available: https://www.keysight.com/zz/en/lib/resources/solution-briefs/articulated-robotic-nearfield-electromagnetic-scanning-system-2429894.html
- [30] Samsung, “TOUCH CONTROLLER A552,” https://www.samsung.com/semiconductor/display-ic/touch-controller/A552/, Apirl 2021, online; accessed 04 May 2021.
- [31] Daniel T. DeBaun, “Smartphone privacy: How to keep your information safe,” https://www.defendershield.com/smartphone-privacy-how-keep-your-information-safe, Apirl 2021, online; accessed 04 May 2021.
- [32] L. Francis, G. Hancke, K. Mayes, and K. Markantonakis, “Potential misuse of nfc enabled mobile phones with embedded security elements as contactless attack platforms,” in 2009 International Conference for Internet Technology and Secured Transactions, (ICITST). Pittsburgh, PA, USA: IEEE, 2009, pp. 1–8.
- [33] D. F. Kune, J. Backes, S. S. Clark, D. Kramer, M. Reynolds, K. Fu, Y. Kim, and W. Xu, “Ghost talk: Mitigating emi signal injection attacks against analog sensors,” in 2013 IEEE Symposium on Security and Privacy, IEEE. Berkeley, CA, USA: IEEE, 2013, pp. 145–159.
- [34] C. Kasmi and J. Lopes Esteves, “Iemi threats for information security: Remote command injection on modern smartphones,” IEEE Transactions on Electromagnetic Compatibility, vol. 57, no. 6, pp. 1752–1755, 2015.
- [35] J. L. Esteves and C. Kasmi, “Remote and silent voice command injection on a smartphone through conducted iemi: Threats of smart iemi for information security,” Wireless Security Lab, French Network and Information Security Agency (ANSSI), Tech. Rep, 2018.
- [36] J. Selvaraj, G. Y. Dayanıklı, N. P. Gaunkar, D. Ware, R. M. Gerdes, and M. Mina, “Electromagnetic induction attacks against embedded systems,” in Proceedings of the 2018 on Asia Conference on Computer and Communications Security, ser. ASIACCS ’18. New York, NY, USA: Association for Computing Machinery, 2018, p. 499–510. [Online]. Available: https://doi.org/10.1145/3196494.3196556
- [37] S. Kennedy, M. R. Yuce, and J.-M. Redoute, “Susceptibility of flash adcs to electromagnetic interference,” Microelectronics Reliability, vol. 81, pp. 218–225, 2018.
- [38] J. Delsing, J. Ekman, J. Johansson, S. Sundberg, M. Backstrom, and T. Nilsson, “Susceptibility of sensor networks to intentional electromagnetic interference,” in 2006 17th International Zurich Symposium on Electromagnetic Compatibility. Singapore: IEEE, 2006, pp. 172–175.
- [39] A. Richelli, L. Colalongo, and Z. M. Kovács-Vajna, “Analog ics for automotive under emi attack,” in 2019 AEIT International Annual Conference (AEIT), IEEE. Florence, Italy: IEEE, 2019, pp. 1–6.
- [40] G. Y. Dayanikli, R. R. Hatch, R. M. Gerdes, H. Wang, and R. Zane, “Electromagnetic sensor and actuator attacks on power converters for electric vehicles,” in 2020 IEEE Security and Privacy Workshops (SPW), IEEE. San Francisco, CA, USA: IEEE, 2020, pp. 98–103.
A The scanning mechanism of touchscreens
As we explained in Section VIII-B, there are two type of scanning mechanism mainly used by modern touchscreen, sequential driving method and parallel driving method. As shown in Ghosttouch [12], this most recent touchscreen attack relies on the synchronization of sequential driving signal to precisely inject touch events. However, such approach limits the attack to sequential scanning type touchscreen. As illustrated in Figure A-1, the scanning signal from the test devices we own are significantly different. We further find that latest touchscreen devices commonly use parallel driving method instead, which makes the synchronization based attack no longer feasible. Even with the sequential driving method, different type of touchscreen can show significantly different pattern. On the contrary, our attack does not reply on any particular scanning method of touchscreen to work.
B Derivation of Equations of IEMI frequency
We assume that the electric field generated by the radiated IEMI is sinusoidal. The noise current, in Fig. LABEL:figs:equivalent_circuit_a, is given as follows.
| (B-1) |
where is the E field frequency and is the phase between and control signal in Fig. LABEL:figs:equivalent_circuit_b. The waveforms show the control signal of and the noise current caused by IEMI in one period. The output voltage variation caused by the IEMI can then be calculated as follows.
| (B-2) |
where is the sensing time. Following (B-2), the at the end of the sensing period can be calculated as follows.
| (B-3) |
During the IEMI injection period, is compared to the threshold . The control signal of the QT sensor is a periodical signal whose frequency depends on the system clock frequency. More specifically, the sensing time depends on the QT sensor switching frequency and the duty cycle .
| (B-4) |
| (B-5) |
From (B-5), it is clear that depends on the ratio of the IEMI signal frequency over the QT sensor operating frequency. The higher is, the more significant the IEMI impact. Based on this observation, we can conclude that the minimum interference occurs at , which can be calculated as follows.
| (B-6) |
where is an integer. When , in (B-5) is always zero, which indicates that there is no interference. The maximum interference, on the other hand, depends on the frequency of the IEMI signal as well as the phase shift .
With the analysis in Section IV-D, we know that the output voltage of QT sensor is usually compared with the threshold voltage every few clock cycles. So combining (8) and (B-5), the sum of output voltage variation of cycles, , is given as follows.
| (B-7) |
where can be calculated in (B-8).
| (B-8) |
Based on (B-7) and (B-8), we can calculate so that the initial phase shift between and control signal remains constant in each sensing duty cycle (see Fig. 8 (b)). The calculation of is shown below.
| (B-9) |
C Derivation of Equations of IEMI Field Strength
A more detailed characterization of the E field interference is presented as follows. In Fig. LABEL:figs:E_field_interference_a, is the z component of the external E field, which generates voltage across the touch screen electrodes. can be calculated in (C-10).
| (C-10) |
where is the distance between the electrodes. The charges () caused by the external E field can be derived as follows.
| (C-11) |
where represents the mutual capacitance between the electrodes. It can be computed in (C-12).
| (C-12) |
where is the permittivity of the free space and is the relative permittivity of the adhesive layer. is the overlap area of the electrodes. From (C-10) – (C-12), we can derive , the z component of the external E field.
| (C-13) |
Based on superposition theory, the voltage which is added to the input of the integrator in Fig. LABEL:figs:E_field_interference_b can be computed as follows.
| (C-14) |
where is the voltage of due to . The output voltage, , under the external E field’s interference is, therefore, as follows.
| (C-15) |