Subsurface Thermophysical Properties of Europa’s Leading and Trailing Hemispheres as Revealed by ALMA
Abstract
We present best-fit values of porosity – and the corresponding effective thermal inertiae – determined from three different depths in Europa’s near-subsurface ( cm). The porosity of the upper cm of Europa’s subsurface varies between 75–50 ( J m-2 K-1 s-1/2) on the leading hemisphere and 50–40 ( J m-2 K-1 s-1/2) on the trailing hemisphere. Residual maps produced by comparison with these models reveal thermally anomalous features that cannot be reproduced by globally homogeneous porosity models. These regions are compared to Europa’s surface terrain and known compositional variations. We find that some instances of warm thermal anomalies are co-located with known geographical or compositional features on both the leading and trailing hemisphere; cool temperature anomalies are well correlated with surfaces previously observed to contain pure, crystalline water ice and the expansive rays of Pwyll crater. Anomalous regions correspond to locations with subsurface properties different from those of our best-fit models, such as potentially elevated thermal inertia, decreased emissivity, or more porous regolith. We also find that ALMA observations at mm sound below the thermal skin depth of Europa ( cm) for a range of porosity values, and thus do not exhibit features indicative of diurnal variability or residuals similar to other frequency bands. Future observations of Europa at higher angular resolution may reveal additional locations of variable subsurface thermophysical properties, while those at other wavelengths will inform our understanding of the regolith compaction length and the effects of external processes on the shallow subsurface.
1 Introduction
The surface of Europa, the smallest of the Galilean Satellites, is notable for its varied terrain units and hemispheric asymmetries – particularly when compared to its sister moons that are resurfaced by active volcanoes (Io), heavily cratered and relatively dark (Callisto), or somewhat intermediary (Ganymede) (see the reviews in McEwen et al. 2004, Greeley et al. 2004, Moore et al. 2004, Pappalardo et al. 2004, de Pater et al. 2021b and references therein). The presence of ridged plains, chaotic terrain (comprised of small, incoherent ice latticework), hydrated salts and sulfuric compounds across Europa’s icy surface indicates the crust above its subsurface ocean may be relatively young and tectonically active, while also being exogenically weathered (Smith et al., 1979; McCord et al., 1998; Zahnle et al., 1998; Cooper et al., 2001; Paranicas et al., 2001; Zahnle et al., 2003; Schenk & Pappalardo, 2004; Bierhaus et al., 2009; Doggett et al., 2009; Carlson et al., 2009). Tidally locked and orbiting slower than Jupiter’s magnetic field, which is tied to the planet’s rapid rotation ( hr), the trailing hemisphere (centered at 270∘ W) is constantly bombarded by charged particles and heavy ions (e.g. S+, O+) sourced from Io’s plasma torus that are entrained in Jupiter’s magnetic field (Paranicas et al., 2009). The leading hemisphere (centered at 90∘ W) is exposed to the highest energy particles from the Jovian magnetosphere (Nordheim et al., 2022) and micrometeorite gardening (Zahnle et al., 1998), and presents a brighter, less altered surface. However, the influence of exogenic erosion of the upper layers of Europa’s regolith and the slow resurfacing from beneath are not easily related to latitude or longitude, resulting in a complex surface whose composition and structure are influenced from both the subsurface ocean and exogenic environment (Anderson et al., 1998; Carr et al., 1998; Pappalardo et al., 1999; Kivelson et al., 2000). Hydrated minerals and salts have been detected across the varied surface terrain, possibly originating in the subsurface while radiolysis provides the formation of sulfur-bearing species, hydrogen peroxide, carbon dioxide, among others (McCord et al., 1998; Carlson et al., 2005, 2009; Brown & Hand, 2013; Trumbo et al., 2019a, b, 2022; Trumbo & Brown, 2023; Villanueva et al., 2023).
As far back as the early 20th century questions regarding the hemispheric dichotomy of Europa’s surface brightness and properties began to arise, initially from ground-based observations (Stebbins, 1927; Stebbins & Jacobsen, 1928). These questions persisted into the 1970’s based on further ground-based observations and data from the Pioneer flybys of Jupiter (Fimmel et al., 1974). Subsequently, the coloration, non-icy material composition, mixtures of amorphous or crystalline ice, and weathering by Jovian magnetospheric ions have been investigated in-depth using near-infrared through ultraviolet wavelength instruments onboard the spacecraft venturing near and into the Jovian system. Initial observations from the Voyager spacecraft determined differences in color, albedo, and water ice distributions between the leading and trailing hemispheres (Pilcher et al., 1972; Lucchitta & Soderblom, 1982; McEwen, 1986; Spencer, 1987), while subsequent Galileo measurements revealed compositional and thermal variations using the Ultraviolet Spectrometer (UVS; Hendrix et al., 1998), Near Infrared Mass Spectrometer (NIMS; Carlson et al., 1996; McCord et al., 1998; Hansen & McCord, 2004), Photopolarimeter-radiometer (PPR; Spencer et al., 1999; Rathbun et al., 2010; Rathbun & Spencer, 2020), and Solid-state Imaging (SSI; Fanale et al., 2000; Leonard et al., 2018) instruments. Flybys with the Cassini and New Horizons spacecraft allowed for further study of the water and hydrated mineral composition of the surface ice via the Visual and Infrared Mapping Spectrometer (VIMS), Linear Etalon Imaging Spectral Array (LEISA), and LOng-Range Reconnaissance Imager (LORRI) instruments (Brown et al., 2003; McCord et al., 2004; Grundy et al., 2007). Recently, high spatial resolution observations of the surface with the Jovian InfraRed Auroral Mapper (JIRAM) onboard the Juno spacecraft allowed for constraints on the ice grain size, while in situ magnetometer measurements helped to better characterize the charged particle environment at Europa (Filacchione et al., 2019; Mishra et al., 2021; Addison et al., 2023).
Observations of the Galilean Satellites in support of these missions (and in-between) have been conducted with ground- and space-based assets, improving our understanding of the distinct coloration, albedo differences, and hydrate absorption features across the surface. These include compositional and thermal studies utilizing the International Ultraviolet Explorer (IUE; Lane et al. 1981; Domingue & Lane 1998), Hubble Space Telescope (HST; Noll et al. 1995; Brown & Hand 2013; Trumbo et al. 2020, 2022), the airborne SOFIA observatory (de Pater et al., 2021a), and various ground-based facilities such as the Very Large Telescope (VLT), Infrared Telescope Facility (IRTF), and Keck (Hansen, 1973; de Pater et al., 1989; Spencer & Calvin, 2002; Spencer et al., 2006; Fischer et al., 2015; Ligier et al., 2016; Fischer et al., 2017; Trumbo et al., 2017b; King et al., 2022). Recent results from the James Webb Space Telescope (JWST) also show evidence for the endogenous origin of previously detected surface CO2, potentially sourced from the subsurface ocean (Trumbo & Brown, 2023; Villanueva et al., 2023). Though the variability in surface terrain and reddened trailing hemisphere have now been well characterized, the endo- and exogenic processes that have influenced Europa’s surface composition and evolution are currently poorly understood, and will likely remain so until the arrival of the JUpier ICy moons Explorer (JUICE) and Europa Clipper spacecraft in the future (which will undoubtedly provide many additional questions of their own).
Complementary to the aforementioned observations at shorter wavelengths are those in the radio and (sub)millimeter regime, which probe the near-surface crust down to s of cm to m depths; beyond, the deeper layers of the crust may be probed by microwave and radar observations down to km (Ostro, 1982; Ostro et al., 1992; Chyba et al., 1998; Bruzzone et al., 2013), including recent in situ remote sensing with the Juno MicroWave Radiometer (MWR; Janssen et al., 2017; Zhang et al., 2023), and future thermal imaging, submillimeter, and radar observations from the Europa Clipper and JUICE spacecraft (Hartogh et al., 2013; Phillips & Pappalardo, 2014; Pappalardo et al., 2017). Millimeter wave observations at different wavelengths permit the measurement of thermal radiation as a function of subsurface depth, the modification of which is governed by the thermophysical properties of the surface. These include the millimeter emissivity, subsurface thermal inertia, porosity, dust fraction, and grain size, all of which inform our understanding of how the various endo- and exogenic processes have altered the surface, and to what extent they change the subsurface structure and composition. Initial characterization of the subsurface properties and thermal emission of the Galilean Satellites were made with a number of long-wavelength facilities throughout the last half-century, including single dish facilities such as the 2.24-m telescope on Maunakea, the 12-m dish at Kitt Peak, the Effelsberg 100-m telescope, and the Institut de Radioastronomie Millimétrique (IRAM) 30-m telescope (Morrison et al., 1972; Morrison & Cruikshank, 1973; Ulich & Conklin, 1976; Pauliny-Toth et al., 1977; Ulich et al., 1984; Altenhoff et al., 1988); the Owens Valley Radio Observatory (OVRO) 3-element array (Berge & Muhleman, 1975; Muhleman & Berge, 1991); the the SubMillimeter Array (SMA) and Very Large Array (VLA) interferometers (de Pater et al., 1982, 1984; Muhleman et al., 1986); and the Photodetector Array Camera and Spectrometer (PACS) onboard the Herschel space-based telescope (Müller et al., 2016). Often, the Galilean Satellites were also used for flux calibration observations for (sub)millimeter facilities, along with Saturn’s largest moon, Titan (Ulich, 1981; Moreno, 2007; Butler, 2012).
Radio and (sub)millimeter interferometric observations from modern telescopes can spatially resolve small Solar System bodies, such as Europa, and thus enable the measurement of thermophysical properties as a function of location on the body, by modeling the thermal radiation from the subsurface (cm-m depths). Utilizing the Atacama Large Millimeter/submillimeter Array (ALMA), Trumbo et al. (2018) mapped the thermal inertia of Europa’s surface using 1.3 mm (233 GHz) observations; they also investigated the correlation of thermal anomalies observed with ALMA with potential plume locations (Trumbo et al., 2017a). These studies revealed that a global thermal inertia of 95 J m-2 K-1 s-1/2 and emissivity of 0.75 provided good fits to the ALMA observations. They found that anomalously cold locations in the ALMA observations, such as around Pwyll crater (W, S) and a region on the leading hemisphere (W, 23∘N), were indicative of localized, high thermal inertia regions or low emissivity; thermal inertia values ranging from 40–300 J m-2 K-1 s-1/2 or emissivities from 0.67–0.84 were found to characterize outlying regions in the residual maps, though thermal anomalies were not correlated with geological or morphological features (excepting Pwyll). The retrieved thermal inertias are comparable to those derived for the surface from Galileo/PPR observations, which provided constraints on Europa’s thermal inertia from 40–150 J m-2 K-1 s-1/2, with elevated measurements in similarly anomalous regions such as near Pwyll (Spencer et al., 1999; Rathbun et al., 2010; Rathbun & Spencer, 2020). Recent analyses have also been carried out for Ganymede (de Kleer et al., 2021a) and Callisto (Camarca et al., 2023) using ALMA to investigate the change in porosity or thermal inertia as a function of depth and correlate brightness temperatures to geographically distinct surface regions. On Ganymede, de Kleer et al. (2021a) found that a porosity gradient between 10–40 provided good fits to ALMA observations sounding the upper 0.5 m of the subsurface. From ALMA Band 7 data, Camarca et al. (2023) derived a mixture of high (1200–2000 J m-2 K-1 s-1/2) and low (15–50 J m-2 K-1 s-1/2) thermal inertia components to correctly model the thermal emission from Callisto’s leading hemisphere. Both studies found cold thermal anomalies co-located with the locations of crater basins or complexes. Generally, these studies revealed higher thermal inertias on the near subsurface of Ganymede and Callisto than Europa.
Here, we present the analysis of ALMA observations of Europa at three wavelengths (0.88, 1.25, and 3.05 mm) that probe distinct depths in Europa’s subsurface, which allows us to investigate the change in thermophysical properties with depth and latitude, and ascertain their potential link to exogenic sources and the evolution of Europa’s ice shell. These observations complement the recent studies of Ganymede and Callisto with ALMA, and provide context for Juno observations of Europa with infrared and microwave instruments. In Section 2, we detail the ALMA observations, reduction and imaging procedures, followed by the radiative transfer modeling in Section 3. A discussion of the modeling results is presented in Sections 4, followed by our conclusions in Section 5.
2 Observations
The ALMA Main Array is an interferometer consisting of up to 50 12-m antennas located in the Atacama Desert, Chile. Every pair of antennas acts as a two-element interferometer, measuring a single complex component (often called a “visibility”) of the Fourier transform of the sky brightness. Together, the collection of visibilities allows for the reconstruction of the full sky brightness in both dimensions via image deconvolution techniques (see Thompson et al., 2001, and references therein). As part of ALMA Project Code 2016.1.00691.S, the leading and trailing hemispheres of each of the Galilean Satellites were observed in three distinct frequency bands that probe different subsurface depths: ALMA Band 3 (97.5 GHz; 3.05 mm), Band 6 (233 GHz; 1.25 mm), and Band 7 (343.5 GHz, 0.88 mm). Europa was observed 8 times between 2016 and 2017. As the angular resolution of interferometric observations depends on the distances between antennas in the array, these observations were executed using different antenna configurations so as to obtain relatively consistent resolution across all three frequency bands. A configuration with maximum antenna separation of 6.4 km was used for Band 3 observations to achieve comparable resolution to data from higher frequency bands, while a configuration with a shorter maximum antenna separation of 1.3 km was used for Bands 6 and 7. Separate observations in each frequency band were executed to target both the leading and trailing hemispheres of Europa, with typical integration times of s; as such, longitudinal smearing over this time period was well below the size of a resolution element. All observations were carried out using between 40 and 45 antennas. In some cases, multiple executions (i.e. observing integrations) were acquired for each hemisphere in a single band, allowing for additional longitude coverage and higher constraints on thermophysical properties. An additional execution in ALMA Band 7 was performed, but was set to incorrect sky coordinates, and as such was not analyzed here. The observation parameters for each integration are detailed in Table 2.
| Obs. Date | Freq.a | Tag | Ang. Diam. | Spatial Res. | Pos. Ang.c | Lat. | W Lon. | Corr.d | |
|---|---|---|---|---|---|---|---|---|---|
| (UTC) | (GHz) | (mm) | (arcsec) | (arcsec) | (∘) | (∘N) | (∘W) | Factor | |
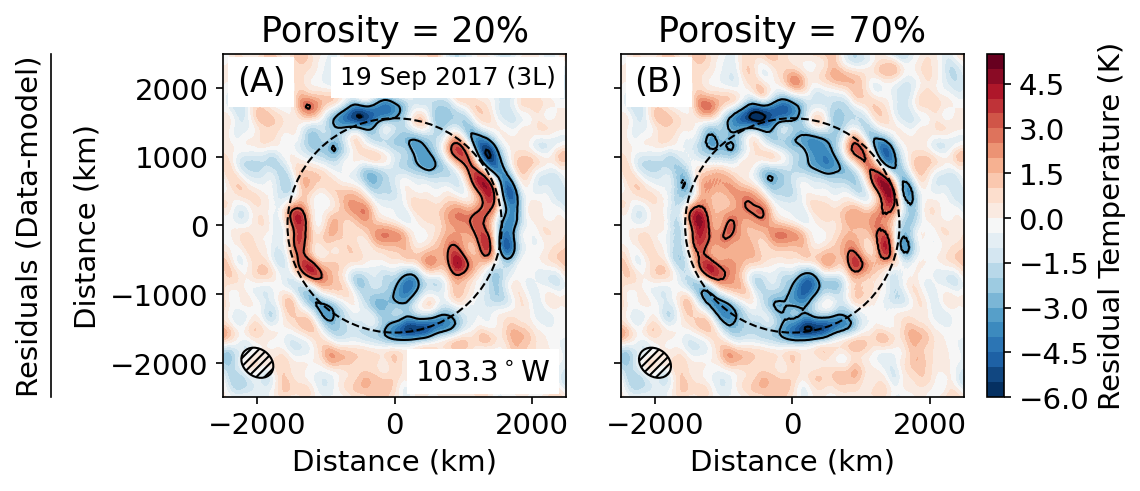
| 2017 Sep 19 17:15 | 97.5 | 3.05 | 3L | 0.684 | 52.23 | -3.08 | 103.3 | 1.0 | |
| 2017 Sep 28 14:43† | 3T | 0.677 | 54.87 | -3.12 | 283.2 | 1.0 | |||
| 2017 Aug 07 19:15 | 233 | 1.25 | 6L | 0.737 | 87.24 | -2.92 | 80.63 | 0.985 | |
| 2017 Jul 09 01:03 | 6T0e | 0.797 | -73.13 | -2.89 | 307.7 | 1.068 | |||
| 2017 Jul 30 00:05 | 6T1 | 0.754 | -70.25 | -2.91 | 270.1 | 1.028 | |||
| 2017 Aug 16 22:55 | 6T2 | 0.722 | -70.64 | -2.95 | 287.0 | 0.937 | |||
| 2017 Jul 06 23:56† | 343.5 | 0.88 | 7L | 0.803 | -68.88 | -2.90 | 100.3 | 0.956 | |
| 2016 Oct 25 12:28 | 7Te | 0.678 | 66.85 | -2.50 | 226.7 | 0.938 |
Note. — aAveraged frequency of all continuum windows. Frequencies correspond to ALMA Band 3 (97.5 GHz), Band 6 (233 GHz), and Band 7 (343.5 GHz). bTag denoting the ALMA frequency band, targeted hemisphere (L = leading, T = trailing), and observation number; exact longitudes vary slightly for each execution. Hemispheres with multiple integrations are denoted with separate labels for each individual execution. cThe position angle of the synthesized ALMA beam, denoted in degrees counter-clockwise from the positive vertical. dCorrection factor derived from variability of quasars used for flux density calibrations. e6T0: Though data from this execution were reduced and modeled, the beam dimensions prevents the data from yielding meaningful longitudinal information regarding Europa’s surface properties. 7T: A second execution for the trailing hemisphere in Band 7 was not used. †Denotes observations where interloping satellites were present in the ALMA field - see Appendix A.
Data from each integration were reduced using the Common Astronomy Software Applications (CASA) package ver. 4.7 (Jaeger, 2008) and the provided ALMA pipeline scripts. Continuum images were produced by flagging channels with telluric contamination and then averaging to channel bins of 125 or 256 MHz to reduce data volume. The resulting data were then combined using multi-frequency synthesis imaging methods to produce a single, high signal-to-noise ratio (SNR) broadband image of the thermal continuum emission. Phase self-calibration was performed on each observation to compensate for tropospheric phase fluctuations, which improves image coherence and SNR for each observation (see the discussion in Cornwell & Fomalont, 1999; Butler & Bastian, 1999; Brogan et al., 2018, and ALMA Memo 620111https://library.nrao.edu/public/memos/alma/main/memo620.pdf by Richards et al.). Similar procedures were applied to the accompanying observations of Ganymede and Callisto (de Kleer et al., 2021a; Camarca et al., 2023).
Final image deconvolution, which removed interferometric artifacts induced by the lack of complete antenna coverage on the sky, was performed using the CASA tclean task with image sizes of pixels of size (note that this is not the effective resolution, which is shown in Table 2, but simply the pixel size). Briggs weighting was applied with a “robust” factor of 0, which slightly increases the weight of data from larger antenna separations (Briggs, 1995). The removal of interferometric artifacts – and thus the improvement of the final image quality – for two of the ALMA observations was facilitated by accounting for the emission from nearby Galilean Satellites (Ganymede, Callisto) that intervened on the relatively large ALMA Field-of-View (FOV), introducing additional signal in the sidelobes. These procedures and the improvements in the images are detailed in Appendix A.
For each ALMA integration, the disk-averaged flux density of Europa was determined by fitting a disk model to the calibrated visibility data, often excluding data from larger antenna spacings (e.g. >100–200 m), which are sensitive to smaller scale thermal structure (such as surface variations) and not the total flux density. A correction to this value was made based on the variability of measured quasar brightnesses for each quasar used for each ALMA observation222ALMA Flux Calibrator Catalogue: https://almascience.eso.org/alma-data/calibrator-catalogue, as was done for previous ALMA observations (Trumbo et al., 2018; de Kleer et al., 2021a). The flux density for each quasar was interpolated based on the measurements from the nearest dates in the cases of Band 3 and 7 observations, where quasars were commonly monitored. For Band 6 observations, quasar flux density curves were derived based on the functional form detailed in Ennis et al. (1982), using contemporaneous quasar observations in both Bands 3 and 7 to determine the variability of flux density with frequency. No corrections were needed for Band 3 data because the quasar flux densities were determined on the same date as the observations. For Bands 6 and 7, we found correction factors from were needed (Table 2). As found previously, the dependence of ALMA on quasar observations can result in higher flux density scale calibration uncertainties (Francis et al., 2020); as a result, our quoted uncertainties on the disk-averaged flux densities, temperatures, and emissivities are no less than , which are often larger than the statistical uncertainties derived from the model fit for the flux density.
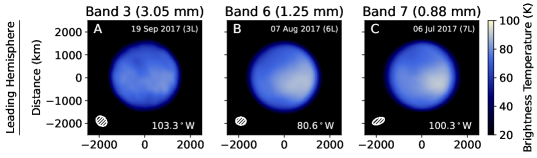
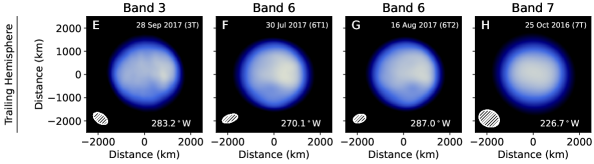
After converting from flux density units (Jy) to brightness temperature (K, the expected thermal temperature the surface would emit if it was solely parameterized by the Planck function; see also de Kleer et al. 2021a and Camarca et al. 2023), the final emission maps were compared to radiative transfer models generated using a variety of thermophysical properties and global porosity or thermal inertia conditions. The Europa continuum image maps are shown in Figure 1. The measured flux densities and brightness temperatures are listed in Table 2.
Note. — aFlux densities and brightness temperatures listed here are derived as hemispheric averages. ∗Porosity and effective thermal inertia values derived for ALMA Band 3 observations were inferred through bounds as discussed in Appendix B.
3 Thermophysical Modeling
The radiative transfer modeling for thermal emission of Europa follows the procedures detailed in de Kleer et al. (2021a), which have been used for Ganymede, Callisto (Camarca et al., 2023), and (16) Psyche (de Kleer et al., 2021b). The model solves for thermal transport throughout the shallow subsurface through the inclusion of thermal conduction and radiation, solving the 1D diffusion equation with time and depth for temperature profiles at discrete latitude and longitudes across the observed surface. We parameterized the model for Europa using similar fixed parameters to those for Ganymede and Callisto, where appropriate (e.g. snow and ice densities, specific heat values). A nominal dust-to-ice fraction = 0.3 was used (similar to what was used for Ganymede by de Kleer et al., 2021a), though dust fraction values between 0.1–0.5 were tested, with fairly minimal effects on the best-fit porosity model residuals; however, a dust fraction change does alter the depths at which our data are sensitive to the subsurface thermal emission. Similarly, models were set with an intermediate surface grain size of 100 m, and we tested models using grain sizes of 50m–1 mm as relevant for Europa’s leading and trailing hemispheres (Hansen & McCord, 2004; Dalton et al., 2012; Cassidy et al., 2013; Ligier et al., 2016; Filacchione et al., 2019; Mishra et al., 2021). While the dispersion of small (<200m) and large (>500 m) grains across Europa likely varies with hemisphere and surface composition in a complex way, we find that similar porosity models (within the range of errors) provided sufficient fits to the data across the range of grain sizes. The discussion of the impact of grain size and other fixed parameters on the thermal conductivity are discussed in detail in de Kleer et al. (2021a).
The initial bolometric albedo map was generated by Trumbo et al. (2017a) from the USGS Europa map333USGS controlled photomosaic map of Europa, 2002, available at:https://pubs.usgs.gov/imap/i2757/ from Voyager and Galileo images, with Galileo albedo values where available (McEwen, 1986) and the phase integral of 1.01 from New Horizons observations (Grundy et al., 2007); further details are provided in previous ALMA studies (Trumbo et al., 2017a, 2018; de Kleer et al., 2021a; Camarca et al., 2023). Models were integrated over variable times steps (on order 1/500 Europa days) per Europa period (3.55 Earth days), including periods where Europa was in eclipse behind Jupiter, for up to 15 Europa days until temperature profiles converged to within 0.1 K. Longitude ranges where Europa was in eclipse for each observation were retrieved from the JPL Horizons ephemerides data444https://ssd.jpl.nasa.gov/horizons/app.html/. We modeled thermal emission from Europa’s subsurface over a range of 10 thermal skin depths (0.5–0.75 m for relevant temperature and porosity ranges). Vertical temperature profiles and emission angles were generated independently over Europa’s surface in a grid of latitude and longitude bins; as discussed in de Kleer et al. (2021a), the incorporation of Fresnel or Hapke refraction does not sufficiently match the limb emission due to surface roughness or volume scattering, and thus is not employed here. Our methodology differs from the techniques employed by Trumbo et al. (2017a) and Trumbo et al. (2018) in that thermal emission was integrated over depth, where as the aforementioned studies treated thermal emission as originating only from the surface (and were thus comparable to models used to interpret data from Galileo/PPR). These properties are calculated in the model of de Kleer et al. (2021a), and allow us to generate models including subsurface emission for a range of porosity values. Finally, an additional scale factor on order 10 was multiplied to the imaginary part of the index of refraction – derived from the complex dielectric constant using a mixture of snow, dust, and ice properties – such that emission from Europa’s subsurface was properly modeled with depth and porosity. This factor was derived empirically through comparisons of the values over our porosity grid range and a range of scale factors from 1–30, and the corresponding increase in the imaginary portion of the index of refraction brought our model values to between , in agreement with the range of values measured for cold (<200 K) water ice at millimeter wavelengths (see Warren, 1984, Matzler & Wegmuller, 1987, Mätzler, 1998, and references therein). The multiplicative scale factor decreases the electrical skin depth, thus increasing the absorption of millimeter-wave emission at the appropriate (centimeter) depths in the model. The increased imaginary index could be attributed to minor amounts of saline ice at depth, the effects of which are not well characterized at millimeter wavelengths through laboratory studies (Mätzler, 1998), but would change the effective thermal conductivity and electrical skin depth in addition to that of pure water ice, dust, and snow, as are currently parameterized in the thermal model. Without this factor, the thermal models did not provide good fits to the data, and the retrieved best-fit porosity values were low (e.g. 10–20), corresponding to thermal inertia values approaching that of solid ice.
The thermophysical model of de Kleer et al. (2021a) can be run in two modes: in the “thermal inertia” mode, the thermal inertia and electrical properties of the material are fixed, such that the thermal properties do not change with depth, time, or temperature. In this mode, the model is similar to thermophysical models typically used to interpret IR data, except that emission is integrated through the subsurface as is necessary for interpreting radio and millimeter-wave data. In the second, “porosity” mode, the subsurface porosity is the primary free parameter and controls both the thermal and electrical properties in a self-consistent way. All material properties (and thus thermal inertia) vary with temperature and density, and hence with depth and time, such that we can only report an “effective thermal inertia” () for these models. We ran models over a grid of porosity values from 10–90, as well as single thermal inertia models ranging from 20–1000 J m-2 K-1 s-1/2, covering values that have been observed throughout the Solar System icy bodies (Ferrari, 2018). The resulting porosity or thermal inertia models were then subtracted from the data, and comparative values determined for the residual fits resulting in the best-fit hemispheric thermophysical properties. We found that thermal inertia models were able to produce adequate fits in addition to those using porosity, and compared well to the derived effective thermal inertia, defined as:
| (1) |
Here, is the effective thermal conductivity of the ice as a function of porosity (), grain size (), and effective temperature (); see Section 3.3 of de Kleer et al. (2021a) for the derivation of . , the effective density, is a function of the surface density () and porosity: . Finally, is the effective heat capacity. However, the porosity models incorporate the change in thermal emission as a function of depth throughout the subsurface, and are thus more physically realistic; further, we tested porosity for each ALMA frequency band and hemisphere independently to determine if a compaction length could be readily derived from the resulting porosity values. This is discussed further in Section 4
4 Results Discussion
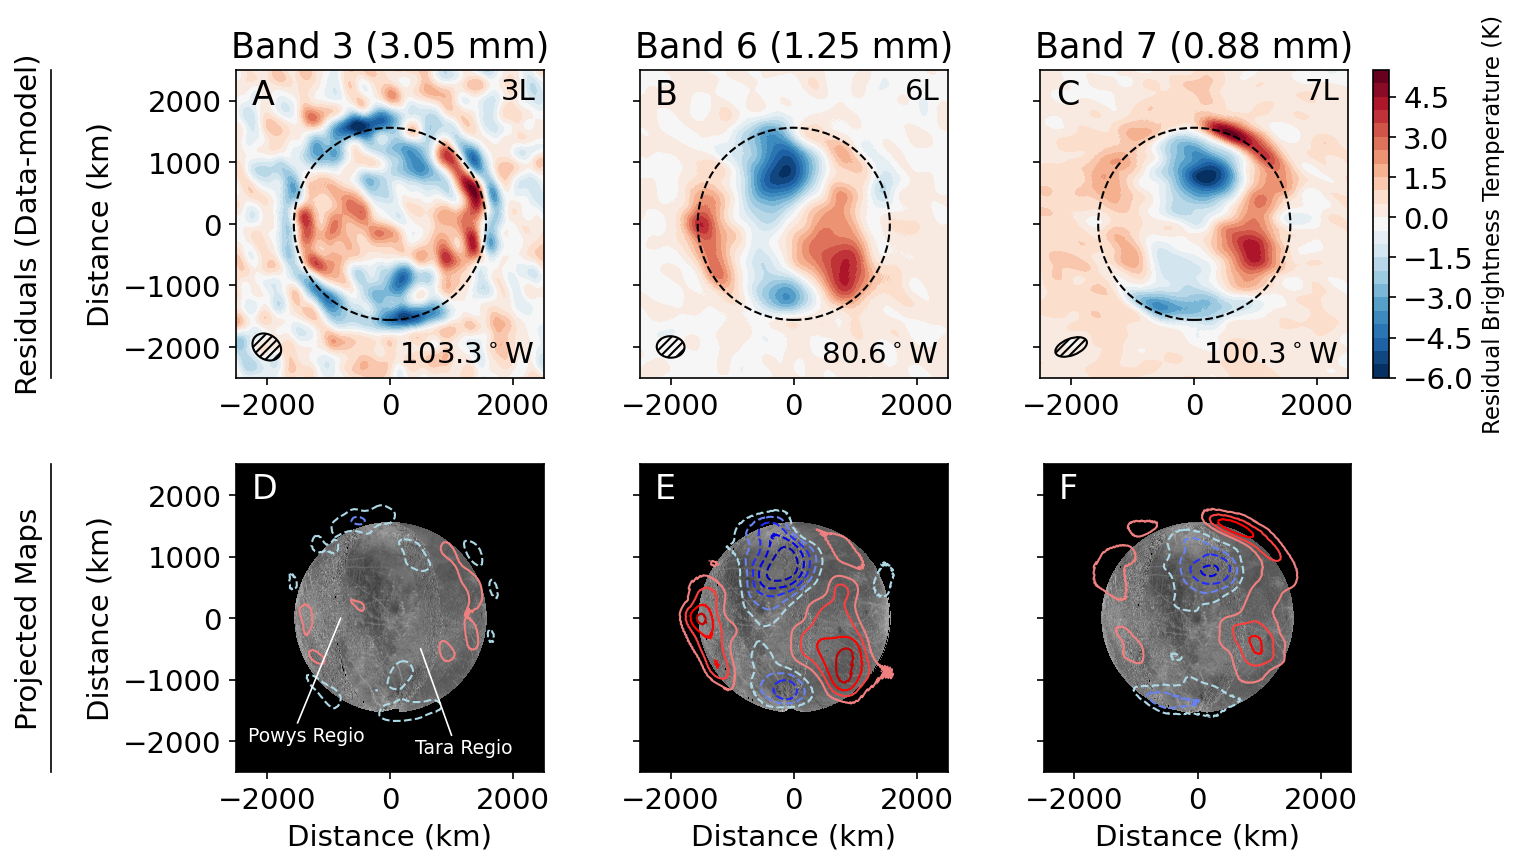
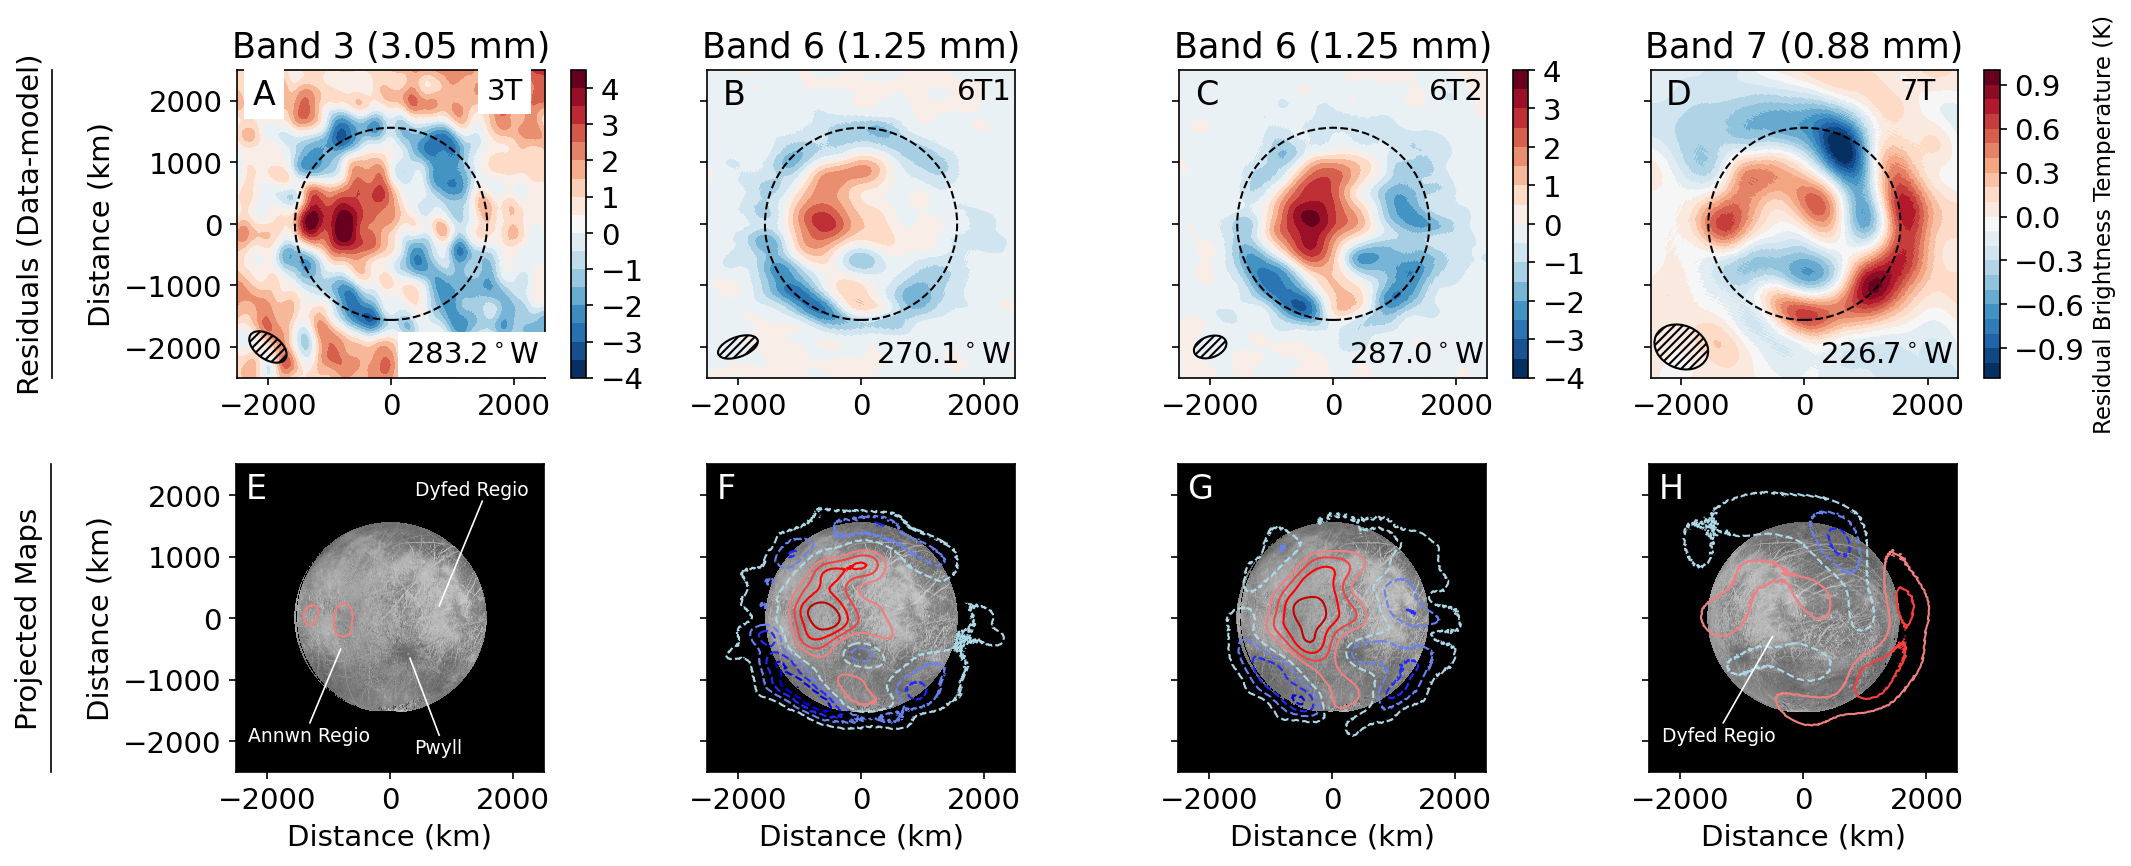
The residuals from the best-fit models are shown in Figure 2 and 3 for the leading and trailing hemispheres, respectively, with projections of Europa’s surface terrain for reference555Projection maps of Europa are able to be generated here:https://astrocloud.wr.usgs.gov/index.php. The best-fit values for porosity models and their corresponding emissivity values, as well as the converted for each porosity, are given in Table 2.
Unlike in the work of Camarca et al. (2023) regarding Callisto, we were able to achieve a good fit to the data (i.e. a single parameter set produced a global minimum and significantly smaller residuals than other models) using only a single porosity or thermal inertia value for each ALMA image. The temperature residuals from the best-fit model were on the order of, or slightly lower than, those found by Trumbo et al. (2018) for Europa in ALMA Band 6 (1.25 mm). Though de Kleer et al. (2021a) tested a simultaneous fit to all Ganymede longitudes to retrieve porosity values, we attempted to fit individual images to investigate potential differences between the leading and trailing hemispheres. We report a distinct difference between the best-fit properties for each imaged hemisphere. The images targeting the leading hemisphere yield porosities that decrease from to 50 from observations at and 1.25 mm to mm, while on the trailing hemisphere, slightly lower porosity values of 40–50 were retrieved. Using Equation 1, the above porosities represent a range of effective thermal inertiae from 56–184 J m-2 K-1 s-1/2. The upper and lower bounds on porosity – and as a result, the retrieved effective thermal inertia and emissivity ranges – were determined through statistics as in other works (Hanuš et al., 2015; de Kleer et al., 2021b; Cambioni et al., 2022), defining the representative range in which similar models provide sufficient solutions to the data with reference to the minimum model. These final results are summarized in Table 2. The emissivity values reported here are those of the material integrated over the viewing pathlength, as opposed to from the surface emission as determined through IR observations.
We note that porosity and thermal inertia fits for data from ALMA Band 3 ( mm), in both hemispheres, showed very similar residual patterns; determining the best-fit parameters from -minimization alone was not sufficient (i.e. there was not a clear, global minimum) due to the similar residual patterns and relatively low SNR. As a result, the porosity values for observations at mm are inferred through upper and lower bounds determined by the best-fit porosities from the and 1.25 mm data (under the assumption that porosity does not increase with depth), and the depth at which the electrical and thermal skin depths are equal, respectively. The latter bound is set due to the lack of significant thermal anomaly features observed in the mm data compared to those in and 1.25 mm (see Figure 2, panels A, D, and Figure 3, panels A, E), and the small effects that varying thermal inertia and porosity models have on the residual fits; together, these properties indicate that the ALMA observations at mm are sensitive to subsurface layers below a thermal skin depth, where diurnal temperature variations are significantly diminished. Further discussion is provided in Appendix B.
4.1 Derived Thermophysical properties
The weighted mean of our derived temperature and thermophysical properties are listed in Table 4.1. Our mean, disk-averaged brightness temperatures are compared to previous measurements of Europa at thermal wavelengths in Figure 4 (panel A). Measurements from each hemisphere are compared in Figure 4 (panel B). We observe an increasing divergence in hemispheric brightness temperature with wavelength (decreasing frequency in Figure 4, panel B), though this trend is only significant at lower frequencies (Band 3; mm). Temperatures derived from the ALMA and 1.25 mm observations are in good agreement with previous measurements from the IRAM 30-m telescope (Altenhoff et al., 1988) and SMA data acquired between 2008 and 2022 (Gurwell et al., private communication) at similar wavelengths. The SMA measurements show a similar hemispheric disparity to our ALMA Band 6 observations, and corroborate the decrease in brightness temperature with wavelength (Gurwell et al., private communication). It is unclear what the exact central longitude of Europa was during the observations of Altenhoff et al. (1988), but it appears to be of Europa’s leading to anti-Jovian hemisphere (W), and is similar to both ALMA and SMA measurements of the leading hemisphere. Our measurements at mm are lower than those found by Muhleman & Berge (1991) with the OVRO, although the value shown in Figure 4 (panel A) from that study corresponds to the trailing hemisphere of Europa, which is more in line with our measurements than for the leading hemisphere. Further observations with ALMA Band 4 and 5 (125–211 GHz; 1.4–2.4 mm) and the VLA could help determine if the observed hemispheric disparity is consistent with the mm observations and persists down to m depths. VLA observations at additional Europa longitudes would make for interesting comparisons with previous analyses by de Pater et al. (1984), Butler (2012), and Muhleman et al. (1986).
Note. — Properties listed are the weighted average of those detailed in Table 2.

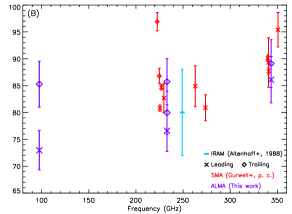
In contrast to the brightness temperatures derived for the other Galilean Satellites (see, e.g. de Kleer et al., 2021a, de Pater et al., 2021a, and Camarca et al., 2023 for recent work and literature comparisons) and Pluto (Lellouch et al., 2016), those measured at Europa do not appear to be monotonically increasing as a function of frequency (Figure 4, panel A). However, new measurements at frequencies <10 GHz are needed to confirm the discrepancies and large uncertainties found in early VLA observations (de Pater et al., 1984; Muhleman et al., 1986). As noted in previous works (e.g. de Kleer et al., 2021a), the decrease in brightness temperature measured with descending frequency across the ALMA wavelength range is indicative of the colder temperatures at depth where both the thermal inertia increases and, in the case of our ALMA Band 3 measurements, the emission is sourced from below the thermal skin depth.
We find the weighted averages of our leading and trailing hemisphere porosity values to range between , corresponding to J m-2 K-1 s-1/2 (Table 4.1). Our emissivity values are towards the higher end of the range found by Trumbo et al. (2018) for ALMA Band 6 (0.67–0.84), while our Band 6 value (both globally and, in particular, on the leading hemisphere) is more towards that derived by the Voyager Infrared Interferometer Spectrometer and Radiometer (IRIS) instrument for the surface (0.9; Spencer, 1987). It is reasonable, however, that the measured (sub)millimeter emissivity is lower than those derived from infrared measurements, as has been found with other objects (Lellouch et al., 2016, 2017; Brown & Butler, 2017; de Kleer et al., 2021a). Comparisons of our globally averaged thermal inertia values to previous measurements of Europa and the other Galilean Satellites from the surface to s of cm are listed in Table 4.1. A high porosity, low thermal inertia surface for Europa was initially inferred from ground-based eclipse observations at 10 m (Hansen, 1973), and a range of =40–150 J m-2 K-1 s-1/2 was found from the Galileo/PPR data across the surface (Spencer et al., 1999; Rathbun et al., 2010, 2014; Rathbun & Spencer, 2020). The ALMA Band 6 observations analyzed by Trumbo et al. (2018) resulted in a global average thermal inertia of 95 J m-2 K-1 s-1/2 and a typical range of J m-2 K-1 s-1/2, when considered with their best-fit emissivity value of 0.75. These values fall within the range of the Galileo/PPR measurements, and our measured ALMA Band 6 average is similar to their best-fit, global thermal inertia value, despite differences between the models with regards to the treatment of subsurface emission. Our Band 7 average, though larger, still falls within the range of previously measured values, as well as those found by Trumbo et al. (2018) in various portions of the surface at slightly lower depths. The derived thermal inertia values from the ALMA observations fall closer to the higher thermal inertia component of the 2-component model of Spencer (1987) using Voyager observations.
Note. — †Best-fit values or ranges across the surface are listed, depending on the data analyzed. Measurements represent the thermal inertia of Europa’s surface in some instances (e.g. infrared measurements) down to s of cm (e.g. ALMA Band 3). Models using 2 thermal inertia components are denoted as ‘2C’, and include values for both model components. aThe value for Europa in Morrison & Cruikshank (1973) was esimated only. bValues listed refer to proposed plume locations on Europa. cValues listed for Io correspond to frost and non-frost-covered surfaces. dValues derived for eclipse cooling of Io based on the Texas Echelon Cross Echelle Spectrograph (TEXES) instrument on the Gemini telescope (Tsang et al., 2016) and ALMA observations (de Pater et al., 2020).
Our retrieved values are consistent with previous studies indicating that Europa’s surface is covered in young, refractory regolith that may extend down to >m depths, as probed by radar (Moore et al., 2009). From the range of previously derived thermal inertia values at millimeter depths (Table 4.1), Europa likely has a more porous surface than what we find for the upper s of cm, which changes to a less porous, higher thermal inertia subsurface within s of mm. The relatively low spread of our porosity results – both in average and hemispheric quantities – indicates that Europa’s subsurface porosity does not change significantly over the top cm of regolith. However, the derivation of a compaction length scale (as was done for Ganymede by de Kleer et al. 2021a) may be possible with future ALMA studies at other frequencies. We find that the values are lower than those found for Ganymede and Callisto in the near subsurface (de Kleer et al., 2021a; Camarca et al., 2023), and like Ganymede in being much lower than solid ice ( = 2000 J m-2 K-1 s-1/2). Though thermal inertia values of the Galilean Satellite surfaces are generally larger than those of the icy Saturnian satellites as found by the Cassini Composite Infrared Spectrometer (CIRS; Howett et al., 2010, 2014, 2016; Ferrari, 2018), Cassini microwave observations of Iapetus and Rhea reveal elevated thermal inertiae (>100) at depths of a few meters (Le Gall et al., 2014; Bonnefoy et al., 2020; Le Gall et al., 2023). The thermal inertiae derived for both the Galilean and Saturnian satellites at depth are larger still than those found for Pluto, Charon, Centaurs, Trans-Neptunian Objects, and main-belt asteroids using Herschel, ALMA, and the VLA, where typically <30 J m-2 K-1 s-1/2 or even of order unity (Keihm et al., 2013; Lellouch et al., 2016, 2017).
4.2 Hemispheric Dichotomies and Thermal Anomalies
Fitting for the properties of each ALMA integration independently allowed us to investigate the previously observed differences between Europa’s leading and trailing hemispheres at cm depths. Although these differences are rendered somewhat minor due to the large uncertainties, we indeed find differences in the measured brightness temperature and best-fit porosity between each hemisphere across ALMA frequency bands (Table 2, Figure 4, panel B); the conversion from porosity to Europa’s effective thermal inertia (Equation 1) makes this dichotomy more apparent. We generally find that Europa’s trailing subsurface is warmer and less porous – or with elevated – compared to the leading hemisphere. While our hemispheric porosity and thermal inertia models do not provide perfect fits to the data, the single value porosity models yield residuals often <5 K. Localized anomalous temperature features correspond to areas of high porosity or emissivity (positive residuals), or less porous, less emissive, elevated thermal inertia surfaces (negative residuals). Overall, we find higher magnitude negative thermal anomalies than positive ones, particularly on the leading hemisphere; as a result, there exists a range of porosities and thermal inertiae corresponding to the largest thermal features that are not well described by the global average values presented in Table 4.1.
While the best-fit values are lower on the leading hemisphere, the larger magnitude negative residuals may indicate high thermal inertia regions at the mid-latitudes (compare negative residuals in Figure 2 and 3). The Band 6 and 7 trailing hemisphere observations (6T1, 6T2, and 7T) are generally better fit by a single porosity or thermal inertia value, with the largest residuals being towards the limb (those off-disk are likely artifacts induced through minute differences in model and data positioning) and at equatorial latitudes towards the center of the trailing hemisphere. In particular, the lowest magnitude residuals are found in the anti-Jovian swath mapped with the Band 7 observations (7T; Figure 3, panels D, H). Here, the model provides a fit to the data to within K, indicating that a near-surface ( cm depth) porosity of 50 – or an effective thermal inertia of 140 J m-2 K-1 s-1/2 – may be sufficient to describe the large banded and ridged plains that cover the surface from W (Leonard et al., 2017), or that the processes that generate inhomogeneous porosity surfaces on the other hemispheres are not as efficient here.
Variations in our thermal residuals could be due to emissivity or thermal inertia variations across the surface – the former an indication of physical (sub)surface properties (e.g. surface roughness, subsurface dielectric properties, grain sizes) that were not correctly accounted for in our model of Europa’s regolith. Rough or irregular terrain would elevate surface temperatures; this, along with volume scattering, are facets to be added to the model in the future. Trumbo et al. (2018) found residuals across the disk between and -8 K, which could be accounted for by varying the emissivity by of their derived best-fit value of 0.75; alternatively, the anomalies could be inferred as thermal inertia variations ranging from 40–300 J m-2 K-1 s-1/2 or more. In our case, the largest magnitude residuals are smaller (+5 to -6 K), but deviations from the best-fit models remain. These may similarly be expressed as variations in emissivity from and thermal inertia values <50 (warm residuals) or >200-300 J m-2 K-1 s-1/2 for the coldest residuals. As in de Kleer et al. (2021a), higher thermal inertia models produce diminishing improvements in model comparisons, preventing the highest negative residuals (those on the leading hemisphere at mid-latitudes) from being well quantified. Positive residuals are likely elevated porosity (or low thermal inertia) surfaces, indicating that localized regions on both the subJovian leading and trailing hemispheres are highly porous from the surface down to cm.
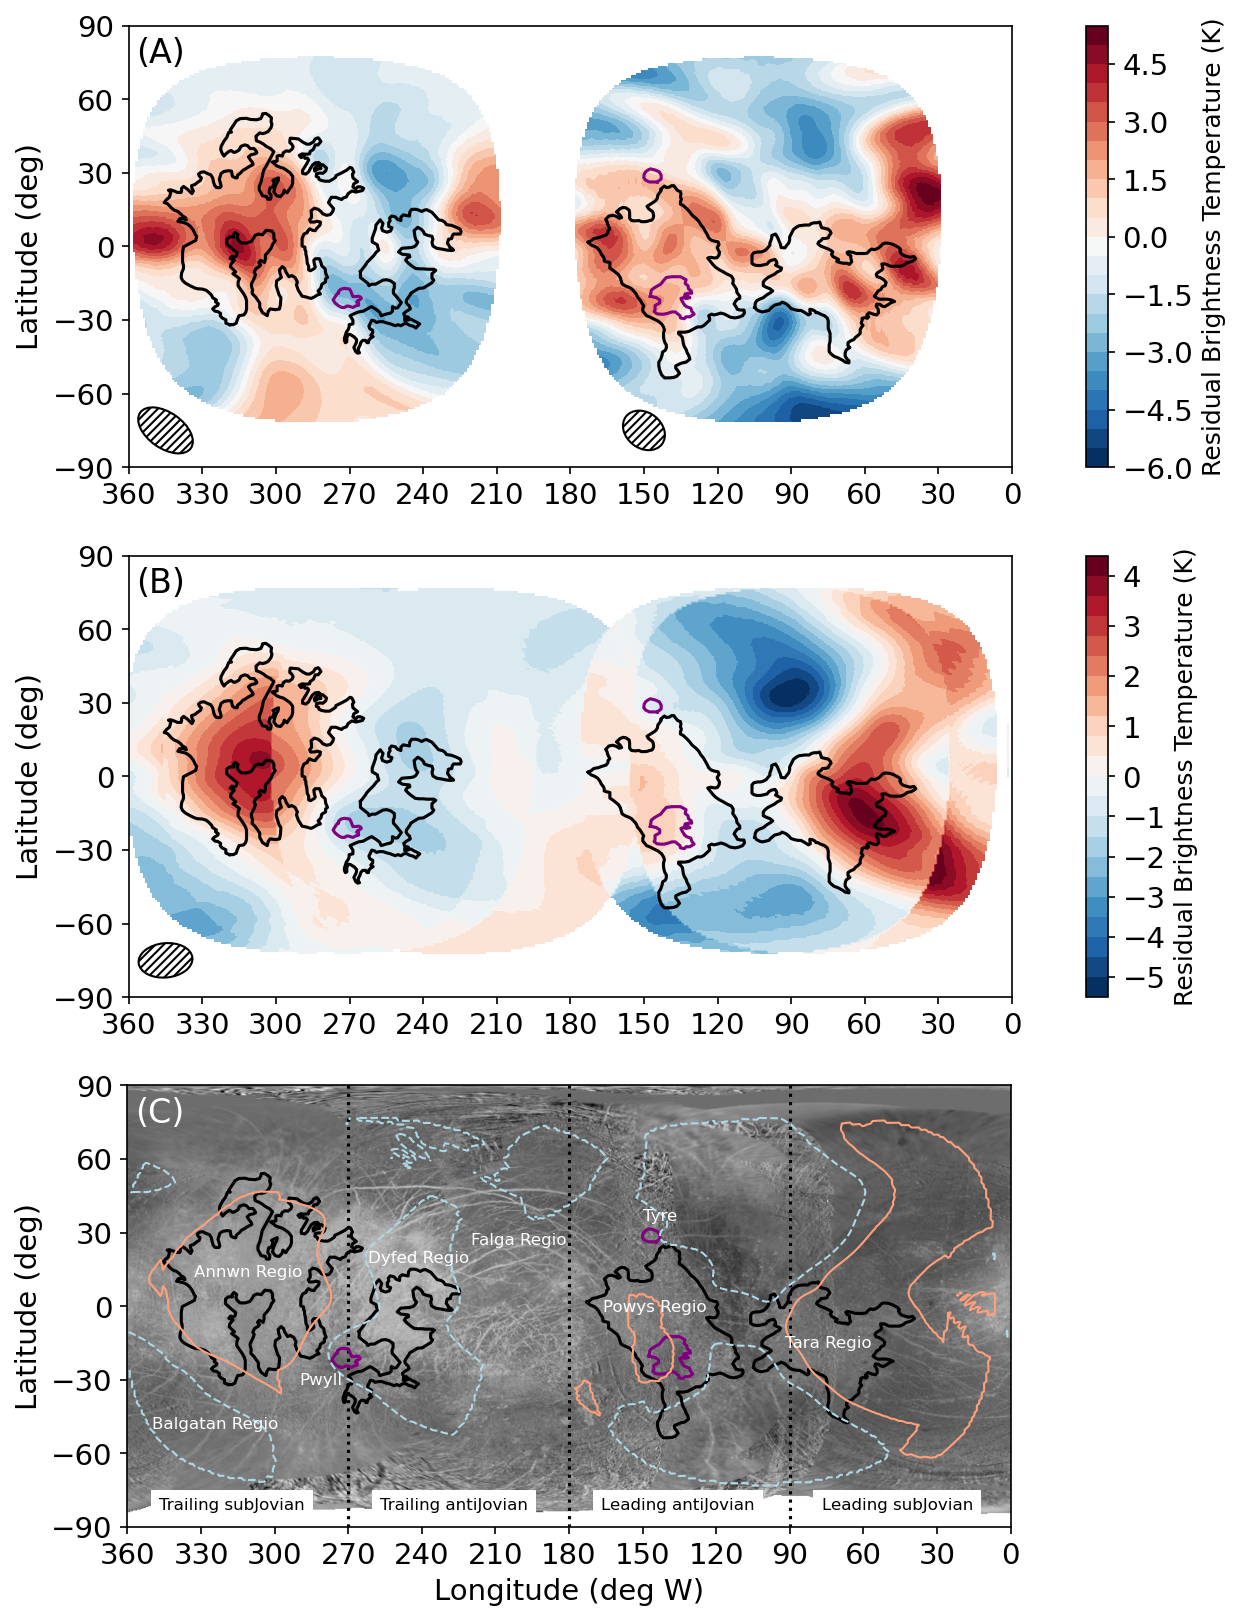
To better facilitate the comparison of thermal anomalies to known geological and compositional terrain, we projected ALMA residual maps into cylindrical coordinates shown in Figure 5. The models here are generated for the global average values listed in Table 4.1, so that anomalies represent deviations from the global average as opposed to hemispheric best-fits. Latitudes corresponding to large (>75∘) emission angles were excluded due to edge artifacts. Though the depths probed by the ALMA Band 6 and 7 ( and 0.88 mm) measurements are different, the residual patterns in Figures 2 and 3 are largely similar between the two where projected longitude ranges overlap. We combined Band 6 and 7 observations (including overlapping regions through averaged measurements) into a single residual map, which comprises most surface longitudes (Figure 5, panel B). As the Band 3 residuals are not as statistically significant as those exhibited by the Band 6 and 7 data, they were not included in this average, but are shown for comparison in Figure 5 (panel A). Some artifacts occur where the Band 6 and 7 residual maps overlap, and minor discrepancies between residual magnitudes exist, particularly on the leading hemisphere. Additionally, as these measurements probe different depths in the subsurface and different portions of Europa’s day, this map is used only for comparative purposes. However, this combined distribution reveals the significant positive thermal distributions across both the subJovian leading (W) and trailing (W) hemispheres, and the negative residuals present on the leading hemisphere at the mid-latitudes. Further, the redundant Band 6 observations corroborate the cool residual patterns in the southern, trailing hemisphere and around Pwyll crater (W, S), which were observed across observations and at slightly different local Europa time. While the residual maps from Band 3 appear to correlate somewhat with known terrain features (Figure 5, panel A), there are few locations where these residuals are greater than the background RMS; as such, we note these correlations with caution. Figure 5 (panel C) shows the regions from the averaged Band 6 and 7 map (Figure 5, panel B) where residual magnitudes are greater than the observation RMS noise (colored contours) overlaid on a composite image mosaic from the Voyager 1, 2, and Galileo spacecraft666https://astrogeology.usgs.gov/search/map/Europa/Voyager-Galileo/EuropaVoyagerGalileoSSIglobalmosaic500m.
Although co-located features exist between the ALMA Band 6 and 7 data both in the best-fit (Figures 2 and 3) and the global average (Figure 5) residuals, these patterns do not always correlate particularly well with known geographic features or Europa’s albedo distribution. This was previously noted in studies with the Galileo/PPR (Rathbun et al., 2010) and ALMA (Trumbo et al., 2018), and may result from subsurface properties that vary with the composition or structure (e.g. crystalline water ice) rather than macroscale surface terrain. Rathbun et al. (2014) found generally higher thermal inertia values on Europa’s trailing hemisphere from Galileo/PPR data, though their trailing hemisphere values were of lower magnitudes overall than we find here as inferred through porosity models. A slight difference was found by Rathbun et al. (2014) between chaos and plains regions across the disk, with the latter requiring slightly lower thermal inertias, but the correlation with longitude was stronger than with terrain type; our significantly elevated values on the trailing hemisphere corroborate this observation.
Our observations do not show residuals indicative of the focusing effect of low energy ions and charged particles on the center of the trailing hemisphere (the colloquially known ‘bullseye’ pattern seen in models; Nordheim et al., 2022). In our global average Band 6 and 7 residuals, we find that Annwn regio (320∘W, 20∘N) appears to require lower thermal inertia (or higher porosity) than the surrounding terrain on the trailing hemisphere; in contrast, the nearby Dyfed regio (250∘W, 10∘N) shows slightly negative residuals, requiring higher thermal inertia (lower porosity). The larger area covering these two regiones has been found to contain signatures of hydrated minerals and products of sulfur radiolysis – whose nature is complicated by the confluence of endo- and exogenic processes thought to occur at these longitudes – and dearth of water ice compared to the leading hemisphere (McEwen, 1986; Carlson et al., 2005; Grundy et al., 2007; Brown & Hand, 2013; Ligier et al., 2016; Trumbo et al., 2020; King et al., 2022). The comparisons of our residual maps in these longitudes may be somewhat complicated by the location of the Pwyll crater, which is relatively young and exhibits extensive rays outward up to km (Moore et al., 1998; Fanale et al., 2000; Schenk, 2002; Zahnle et al., 2003; Bierhaus et al., 2009). This ray system allows the larger extent of Pwyll’s ejecta cover an area equivalent to our average ALMA beam size ( km at Europa), and is consistently colder than our Band 6 and 7 models. This may be due its relative brightness and the ejection of less processed water ice from below, which has yet to be modified through exogenic processes. Pwyll was evident as a cold residual in the previous ALMA Band 6 observations (Trumbo et al., 2017a, 2018); similarly, individual large craters and complexes were notably cold in the ALMA observations of Ganymede and Callisto (de Kleer et al., 2021a; Camarca et al., 2023). The proximity of Pwyll to the nearby regiones thought to be heavily altered by sulfur radiolysis makes this area potentially difficult to fit with a single global porosity value, particularly for moderate ALMA resolution elements compared to the local features (regiones range from km).
We find that the leading hemisphere has larger magnitude residual values, which similarly indicates a conflict between differing terrain types that cannot quite be fit by a single, highly porous model. This was found by Trumbo et al. (2018) as well, with the largest range of potential emissivities and thermal inertia values required to fit longitudes 0–180∘W. While our most significant positive thermal residuals are co-located with Tara regio (75∘W, 10∘S), the residual pattern is not confined to it. As the best-fit porosity values for Europa’s leading hemisphere are already elevated compared to the trailing hemisphere, the large positive residual swath from W potentially represents the highest porosity (or lowest ) or emissivity surfaces we observe. The lack of significant positive anomalies at these locations in the Band 3 data (Figure 2, panel D) indicate that these anomalies are not the result of (large) endogenic heating, and instead due to compositional or material differences that elevate the emissivity or porosity compared to the surrounding terrain. Rough or irregular terrain could result in elevated temperatures in these regions. Increased salinity (or other non-water materials) in the chaos regions could also raise brightness temperatures compared to the model through the increase of the complex dielectric constant, which in effect would decrease the electrical skin depth and reveal more shallow, warmer layers of the regolith. Indeed, recent HST and JWST observations find NaCl and CO2 to be concentrated in this region (Trumbo et al., 2022; Trumbo & Brown, 2023; Villanueva et al., 2023), thought to be the result of endogenic emplacement. The western warm anomalies align somewhat with Powys region, though we do not find a similar cold residual at the location of the Taliesin crater (138∘W, 22∘S) and its surrounding ejecta blanket as exhibited by Pwyll on the trailing hemisphere.
We find the coldest ( K) thermal anomalies at the mid-latitudes of the leading hemisphere. These locations, while not co-located with known geographic features, align well with the pure, crystalline water-ice distribution found by previous studies (Hansen & McCord, 2004; Brown & Hand, 2013; Ligier et al., 2016). Galileo PPR measurements showed warmer nighttime temperatures at mid-latitudes than the equator on the leading hemisphere, which were attributed to higher thermal inertia values or endogenic heating (Spencer et al., 1999; Rathbun et al., 2010), though Trumbo et al. (2018) found a reduced emissivity (0.66) may be responsible for their cold residual at northern mid-latitudes. These regions are impacted by only the highest energy ( MeV) ions and particles from the Jovian radiation environment (Nordheim et al., 2022), and as such have been much less processed externally than the trailing hemisphere. Thus, it’s possible that the anomalous features we find on the leading hemisphere are more indicative of the endogenic properties (crystalline water-ice, salts and carbon-bearing molecules) sourced from Europa’s interior that sculpt its surface. Additionally, as the large thermal anomalies exhibited by the Band 6 and 7 data are less significant in the Band 3 observations, which probe below the thermal skin depth, two further possibilities arise: the anomalies present in the Band 6 and 7 data are due to thermal inertia variations alone (and thus do not manifest at depth), or they are due to thermal inertia and emissivity variations that are only substantial down to cm depths. The latter option may occur if the variations due to emissivity are not present at the depths probed by ALMA Band 3 ( cm).
High energy electrons and their associated bremsstrahlung radiation may still supply the subsurface with considerable processing down to cm, while heavy (S, O) ions from Io’s plasma torus only affect the upper few millimeters of the surface (Paranicas et al., 2001; Cooper et al., 2001; Paranicas et al., 2002). While the trailing hemisphere of Europa receives more total charged particle flux from the Jovian magnetosphere, the leading hemisphere still receives sufficient dosage at all but the equatorial latitudes from particles with higher energies (Paranicas et al., 2009; Nordheim et al., 2022); this, combined with the young relative age of Europa’s surface, renders the effects of magnetospheric radiation more difficult to discern on Europa than some of the Saturnian satellites, where the effects of charged particle bombardment focused on the trailing hemisphere are more directly evident through thermal emission (Howett et al., 2014). Erosion due to micrometeorite gardening may only affect the regolith down to 0.5–1 cm (Moore et al., 2009), which bounds our Band 7 and 6 measurements (see Appendix B). While the global average and best-fit trends between these frequency bands are fairly consistent, the effects of sputtering and gardening on regolith grain size and mixing may be important considerations for interpreting the best-fit values for our models at different depths.
Finally, it is worth noting that the average spatial resolution of our ALMA observations is relatively large compared to various surface features on Europa (chaos, craters, ringed features; Doggett et al., 2009; Leonard et al., 2017), which warrants future observations at higher angular resolution (e.g. km or better) to determine how much the size and shape of the ALMA resolution element affects the morphology of the residual features we show here. Future observations could also target specific areas at multiple local Europa times to disentangle the effects of porosity and emissivity on regional anomalies. Additionally, observations at additional frequency bands would probe depths above and below those investigated here, which may allow for better constraints on the compaction length scale, probe different subsurface processes, and determine the depth of the anomalous features found in Band 6 and 7. Data from ALMA bands 8 and 9 (385–500 and 602–720 GHz, respectively) may be more comparable to Galileo PPR and other IR observations that probe the shallow subsurface, while polarization measurements may reveal more about the (sub)surface roughness, scattering, and dielectric properties.
5 Conclusions
Through the analysis of multiple ALMA observations of Europa across three frequency bands – Band 3 (97.5 GHz; 3.05 mm), Band 6 (233 GHz; 1.25 mm), and Band 7 (343.5 GHz, 0.88 mm), which sound to depths of –20 cm – we are able to infer the best-fit hemispheric and global average thermophysical properties and brightness temperatures of the near subsurface at an average resolution of km. The comparison of the ALMA data to thermal models, incorporating subsurface emission and change in surface properties with depth (de Kleer et al., 2021a), allowed for the retrieval of porosity and emissivity values at discrete depths of , 1.5–3, and 10–20 cm. Through these derived properties, we conclude the following:
-
•
The derived, effective thermal inertia () values of 56–184 J m-2 K-1 s-1/2 for Europa are within the ranges found previously through studies of Voyager and Galileo data at the surface, and comparable to those retrieved by Trumbo et al. (2018) from separate ALMA Band 6 observations using different modeling methods.
-
•
Data from ALMA Band 3 revealed colder subsurface temperatures – though within the errors of those measured in ALMA Band 6 and 7 – that originate from below the thermal skin depth. As a result, the thermophysical properties were inferred indirectly, as models of subsurface emission for a range of porosity and thermal inertia values yielded similar, degenerate fits. The residuals are of less statistical significance than those found with the higher frequency ALMA bands.
-
•
Model comparisons with ALMA Band 6 and 7 data show both positive and negative thermal anomalies of at least 6, though the total magnitudes are often <5 K. The lowest residuals (<1 K) were found for Europa’s trailing antiJovian hemisphere (our image 7T), which is best-fit using a global porosity model (50) at cm depths.
-
•
The derived porosity and brightness temperature values differ between hemispheres consistently between frequency bands; we find that Europa’s leading hemisphere is generally cooler and more porous, though large, cold thermal anomalies exist in regions that may harbor significantly elevated thermal inertia regolith.
-
•
Despite the differences between leading and trailing hemispheres, the best-fit porosities between bands on the same hemisphere are similar enough that a compaction length scale cannot be derived. As such, we find no evidence for large changes in porosity or thermal inertia over the upper cm.
-
•
We find that thermal anomalies only partially align with geographic features in a consistent way, with larger magnitude positive anomalies co-located with Tara, Powys, and Annwn regiones, and negative anomalies with Dyfed regio and the vast rays and ejecta of Pwyll crater on the trailing hemisphere. Negative thermal anomalies on the leading hemisphere – the largest we observe of all residual temperatures – are co-located with regions of more pure, crystalline water ice. These may be due to elevated thermal inertia terrain, or a decrease in emissivity that only extends to <10 cm. Positive anomalies exist in regions with previously observed salt or CO2 features, and to some extent, chaos regions (Leonard et al., 2017).
-
•
As the depths probed by (sub)millimeter observations are below the upper layer of amorphous ice and the regolith affected by micrometeorite gardening (Hansen & McCord, 2004; Moore et al., 2009), our observations are more likely sensitive to the distribution of pure, crystalline water ice, though warm anomalies may be linked to the mixture of both endo- and exogenic processes (e.g. hydrated materials mixed with chaos terrain).
ALMA Bands 4 and 5 ( GHz) may probe just above the interface where our Band 3 observations are no longer sensitive to diurnal variability (just at the thermal skin depth or above), while ALMA Bands 8 and 9 ( GHz) sound the very upper subsurface (mm depths), which may provide a means to derive the compaction length scale of the shallow subsurface and more properly constrain the ALMA Band 3 measurements. The higher ALMA frequency observations are more readily comparable to measurements of the surface properties derived from IR data, while VLA observations at high resolution would probe >m depths; data from the Juno/MWR will provide constraints on the thermophysical properties at even greater depths. Tracing thermal emission from radio to infrared wavelengths will help elucidate the influence of external and internal processes on Europa’s subsurface properties and structure, and in addition inform our understanding of the surfaces of other icy satellites.
6 Acknowledgments
This material is based upon work supported by the National Science Foundation under Grant No. 2308280. This research was also funded in part by the Heising-Simons Foundation through grant 2019-1611. Funding for this paper was provided by the NASA ROSES Solar System Observations program (through Task Order 80NM0018F0612) for AET, KdK, AA. Contributions from AA were carried out at the Jet Propulsion Laboratory, California Institute of Technology, under a contract with the National Aeronautics and Space Administration (80NM0018D0004). We acknowledge support from the National Science Foundation Graduate Research Fellowship under Grant DGE-1745301 to MC.
We would like to acknowledge the North American ALMA Science Center staff for their expertise and help reducing data associated with this project, and in particular to R. Loomis and L. Barcos-Muoz for their assistance during an ALMA face-to-face visit. We would also like to acknowledge A. Moullet and R. Moreno for their contributions to the original ALMA proposal on which these observations were based.
This paper makes use of the following ALMA data: ADS/JAO.ALMA2016.1.00691.S. ALMA is a partnership of ESO (representing its member states), NSF (USA) and NINS (Japan), together with NRC (Canada), MOST and ASIAA (Taiwan), and KASI (Republic of Korea), in cooperation with the Republic of Chile. The Joint ALMA Observatory is operated by ESO, AUI/NRAO and NAOJ. The National Radio Astronomy Observatory is a facility of the National Science Foundation operated under cooperative agreement by Associated Universities, Inc.
Appendix A Removal of Effects of Interloping Moons
A noticeable increase in interferometric artifacts was evident in one observation each in Bands 3 and 7 (3T, 7L; see Table 2), resulting in excess background signal that was comparable to the thermal modeling residuals. These artifacts were largely removed by accounting for the presence of Ganymede and Callisto, which were within of Europa during these observations. We achieved this by increasing the image size from pixels to > pixels when creating images. This change allowed us to include the interloping moon in the image creation and self-calibration process, significantly reducing the presence of artifacts in the final image. Figure 6 shows a portion of the larger image created for the leading hemisphere observation of Europa in Band 7 (7L). The second satellite, Ganymede, appears in the image on the lower left. The dark region exhibited on the leading hemisphere of Ganymede was identified as the Tros impact crater by de Kleer et al. (2021a), which is similarly cooler than the disk in their Band 6 images (see their Figure 1).
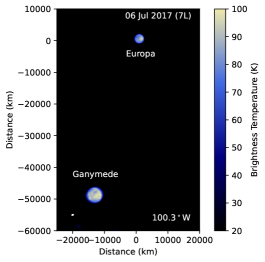
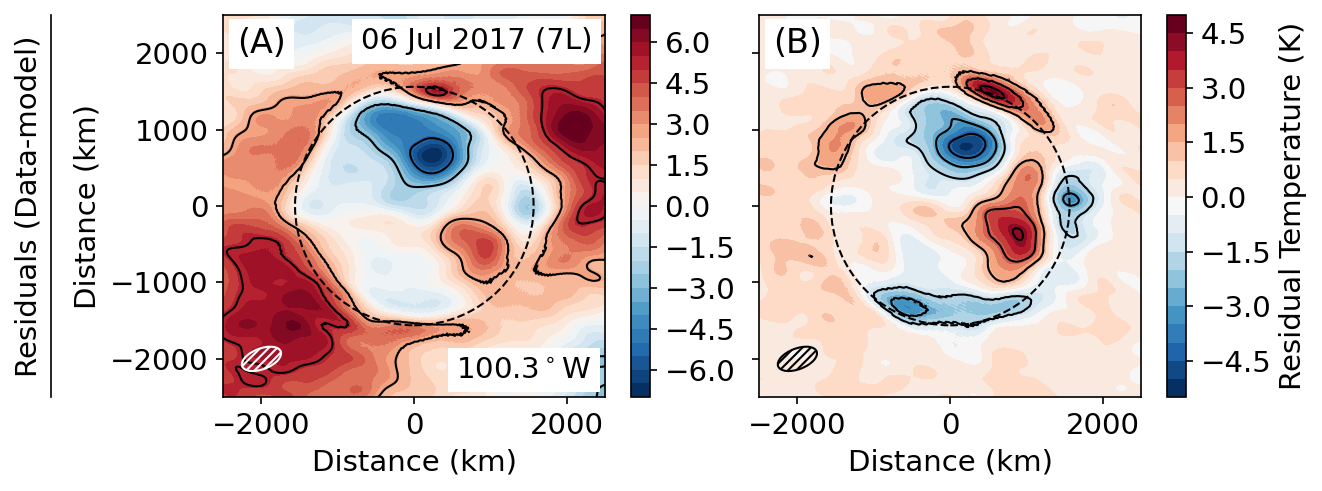
Figure 7 shows the difference in residual maps corresponding to imaging performed without the inclusion of Ganymede (A), and with Ganymede (B), as in Figure 6, using a nominal global thermal inertia model with J m-2 K-1 s-1/2. Large, off-disk image artifacts are present in the smaller image (created without the inclusion of Ganymede; Figure 7, A), which are removed when the larger image is created including Ganymede (Figure 7, B). Similar artifacts were present in the initial imaging of the Band 3 trailing hemisphere observation due to the interference of Callisto. As in Figure 2 (C, F), the image in Figure 7 (B) shows localized thermal anomalies on Europa’s disk only following the inclusion of Ganymede. Following these minor procedures, a reduction in background signal by factors of were achieved for these observations – largely through the decrease in the background interferometric artifacts. The final image SNR of >100–200 is much more comparable to the other observations where interloping satellites did not affect the data.
For future observations of the interior Galilean Satellites – as well as those for the Giant Planets – a careful consideration of the positions of neighboring satellites should be considered, in addition to the primary body, when imaging individual satellites. Other means of removing the effect of nearby planetary bodies in interferometric observations (e.g. de Pater et al., 2019) can achieve similar results and may be preferable for different observational situations. In particular, it is worth noting that the simple approach employed here is only effective when the observational duration is short, such that the objects do not move significantly with respect to one another on the sky.
Appendix B Derivation of ALMA Band 3 Porosities
Observations 3L and 3T (Figure 2 A, D, and Figure 3 A, E, respectively) show low level residuals when compared to the noise, particularly regions where thermal anomalies are present at higher frequencies. Further, Figure 8 shows the comparison of Band 3 residuals following the subtraction of models with global porosities of 20 and 80, which look remarkably similar. These results are indicative of thermal emission originating from below the thermal skin depth (), where temperature variability due to (sub)surface response to diurnal fluctuations are no longer substantial. As in de Kleer et al. (2021a), this term is parameterized by:
| (B1) |
or alternatively, in terms of the effective thermal inertia, (defined in Equation 1):
| (B2) |
Here, is the diurnal period of Europa. For temperatures relevant to Europa’s near surface, ranges from 5–15 cm depending on porosity or .
This value can be compared to the electrical skin depth, , which governs the sensitivity of different wavelengths to thermal emission vertically throughout the ice crust:
| (B3) |
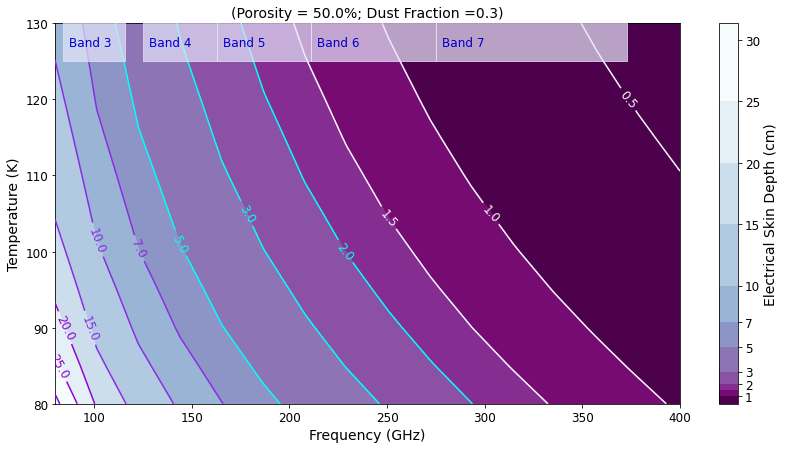
where is the wavelength, and is the imaginary portion of the complex index of refraction, which itself depends on the ice porosity, dust mass fraction, and temperature (see Section 3 of de Kleer et al. 2021a). An example of how varies across notional ALMA frequency bands for a range of temperatures appropriate for Europa and a surface porosity of 50 is shown in Figure 9. These calculations include the multiplicative scale factor applied to as discussed in Section 3.
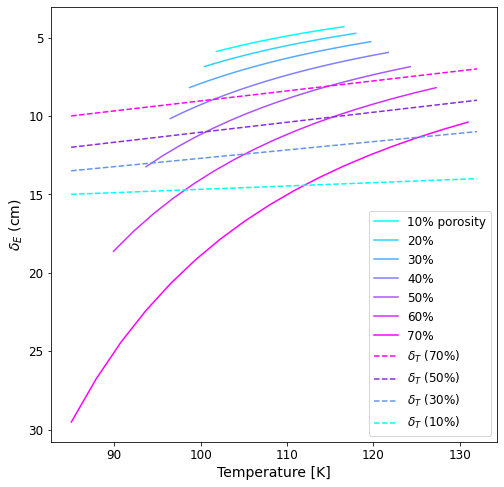
For a range of porosity values and relevant temperatures, the comparison of both and (including the applied scale factor, as in Figure 9) are shown in Figure 10. As the porosity of the ice increases, the depth at which thermal emission may be sensed remotely increases (solid curves in Figure 10); conversely, the thermal skin depth decreases (dashed lines in Figure 10), and as a result the diurnal variability influences more shallow layers with higher porosity. In addition to the aforementioned parameters, the dust mass fraction alters the range of depths sounded by radiation – increasing the dust fraction decreases . As such, there exists a parameter space in which , manifesting as residuals with minimal temperature variability across longitudes and at multiple porosity values, as we find in ALMA Band 3. Considering permutations of Figure 9 and 10, we find that a porosity of marks a physically realistic lower bound for depths down to cm, as sounded by ALMA frequencies of 100 GHz. There does not exist a combination of parameters for which these data could be sensitive to emission from the subsurface for porosities lower than while simultaneously sounding depths below the thermal skin depth, which would thus manifest more significant thermal anomalies. Though higher porosity values (e.g. >) allow for sensitivity far below , we assume the ice at depth is no more porous than that of the (near) surface. These physical constraints allow us to define the bounds for porosities as measured at low frequencies, and thus we infer a porosity of or for ALMA Band 3, sounding between cm depending on temperature, porosity, and dust fraction.
Future observations with ALMA at intermediate frequencies (e.g. ALMA Band 4 and 5, from GHz) may sound regions above Band 3 where diurnal temperature variations are still detectable (Figure 9, allowing for us to further examine the potential porosity gradient with depth at Europa.
References
- Addison et al. (2023) Addison, P., Liuzzo, L., & Simon, S. 2023, Journal of Geophysical Research (Space Physics), 128, e2023JA031734, doi: 10.1029/2023JA031734
- Altenhoff et al. (1988) Altenhoff, W. J., Chini, R., Hein, H., et al. 1988, AA, 190, L15
- Anderson et al. (1998) Anderson, J. D., Schubert, G., Jacobson, R. A., et al. 1998, Science, 281, 2019, doi: 10.1126/science.281.5385.2019
- Berge & Muhleman (1975) Berge, G. L., & Muhleman, D. O. 1975, Science, 187, 441, doi: 10.1126/science.187.4175.441
- Bierhaus et al. (2009) Bierhaus, E. B., Zahnle, K., & Chapman, C. R. 2009, in Europa, ed. R. T. Pappalardo, W. B. McKinnon, & K. K. Khurana (Cambridge University Press), 161
- Bonnefoy et al. (2020) Bonnefoy, L. E., Le Gall, A., Lellouch, E., et al. 2020, Icarus, 352, 113947, doi: 10.1016/j.icarus.2020.113947
- Briggs (1995) Briggs, D. S. 1995, in Bulletin of the American Astronomical Society, Vol. 27, American Astronomical Society Meeting Abstracts, 1444
- Brogan et al. (2018) Brogan, C. L., Hunter, T. R., & Fomalont, E. B. 2018, arXiv e-prints, arXiv:1805.05266, doi: 10.48550/arXiv.1805.05266
- Brown & Butler (2017) Brown, M. E., & Butler, B. J. 2017, AJ, 154, 19, doi: 10.3847/1538-3881/aa6346
- Brown & Hand (2013) Brown, M. E., & Hand, K. P. 2013, AJ, 145, 110, doi: 10.1088/0004-6256/145/4/110
- Brown et al. (2003) Brown, R. H., Baines, K. H., Bellucci, G., et al. 2003, Icarus, 164, 461, doi: 10.1016/S0019-1035(03)00134-9
- Bruzzone et al. (2013) Bruzzone, L., Plaut, J., Alberti, G., et al. 2013, in 2013 IEEE International Geoscience and Remote Sensing Symposium - IGARSS, 3907–3910
- Butler (2012) Butler, B. J. 2012, ALMA Memo 594, Tech. rep., NRAO
- Butler & Bastian (1999) Butler, B. J., & Bastian, T. S. 1999, Solar System Objects, Vol. 180 (ASP Conference Series), 625–656
- Camarca et al. (2023) Camarca, M., de Kleer, K., Butler, B., et al. 2023, PSJ, 4, 142, doi: 10.3847/PSJ/aceb68
- Cambioni et al. (2022) Cambioni, S., de Kleer, K., & Shepard, M. 2022, JGR (Planets), 127, e07091, doi: 10.1029/2021JE007091
- Carlson et al. (1996) Carlson, R., Smythe, W., Baines, K., et al. 1996, Science, 274, 385, doi: 10.1126/science.274.5286.385
- Carlson et al. (2005) Carlson, R. W., Anderson, M. S., Mehlman, R., & Johnson, R. E. 2005, Icarus, 177, 461, doi: 10.1016/j.icarus.2005.03.026
- Carlson et al. (2009) Carlson, R. W., Calvin, W. M., Dalton, J. B., et al. 2009, in Europa, ed. R. T. Pappalardo, W. B. McKinnon, & K. K. Khurana (The University of Arizona Press, LPI), 283
- Carr et al. (1998) Carr, M. H., Belton, M. J. S., Chapman, C. R., et al. 1998, Nature, 391, 363, doi: 10.1038/34857
- Cassidy et al. (2013) Cassidy, T., Paranicas, C., Shirley, J., et al. 2013, Planetary and Space Science, 77, 64, doi: https://doi.org/10.1016/j.pss.2012.07.008
- Chyba et al. (1998) Chyba, C. F., Ostro, S. J., & Edwards, B. C. 1998, Icarus, 134, 292, doi: 10.1006/icar.1998.5961
- Cooper et al. (2001) Cooper, J. F., Johnson, R. E., Mauk, B. H., Garrett, H. B., & Gehrels, N. 2001, Icarus, 149, 133, doi: 10.1006/icar.2000.6498
- Cornwell & Fomalont (1999) Cornwell, T., & Fomalont, E. B. 1999, in Astronomical Society of the Pacific Conference Series, Vol. 180, Synthesis Imaging in Radio Astronomy II, ed. G. B. Taylor, C. L. Carilli, & R. A. Perley, 187
- Dalton et al. (2012) Dalton, J. B., I., Shirley, J. H., & Kamp, L. W. 2012, Journal of Geophysical Research (Planets), 117, E03003, doi: 10.1029/2011JE003909
- de Kleer et al. (2021a) de Kleer, K., Butler, B., de Pater, I., et al. 2021a, PSJ, 2, 5, doi: 10.3847/PSJ/abcbf4
- de Kleer et al. (2021b) de Kleer, K., Cambioni, S., & Shepard, M. 2021b, PSJ, 2, 149, doi: 10.3847/PSJ/ac01ec
- de Pater et al. (1984) de Pater, I., Brown, R. A., & Dickel, J. R. 1984, Icarus, 57, 93, doi: 10.1016/0019-1035(84)90011-3
- de Pater et al. (2021a) de Pater, I., Fletcher, L. N., Reach, W. T., et al. 2021a, PSJ, 2, 226, doi: 10.3847/PSJ/ac2d24
- de Pater et al. (1982) de Pater, I., Jaffe, W. J., Brown, R. A., & Berge, G. L. 1982, ApJ, 261, 396, doi: 10.1086/160350
- de Pater et al. (2021b) de Pater, I., Keane, J. T., de Kleer, K., & Davies, A. G. 2021b, Annual Review of Earth and Planetary Sciences, 49, doi: 10.1146/annurev-earth-082420-095244
- de Pater et al. (2020) de Pater, I., Luszcz-Cook, S., Rojo, P., et al. 2020, PSJ, 1, 60, doi: 10.3847/PSJ/abb93d
- de Pater et al. (2019) de Pater, I., Sault, R. J., Wong, M. H., et al. 2019, Icarus, 322, 168, doi: 10.1016/j.icarus.2018.11.024
- de Pater et al. (1989) de Pater, I., Ulich, B. L., Kreysa, E., & Chini, R. 1989, Icarus, 79, 190, doi: 10.1016/0019-1035(89)90115-2
- Doggett et al. (2009) Doggett, T., Greeley, R., Figueredo, P., & Tanaka, K. 2009, in Europa, ed. R. T. Pappalardo, W. B. McKinnon, & K. K. Khurana (The University of Arizona Press, LPI), 137
- Domingue & Lane (1998) Domingue, D. L., & Lane, A. L. 1998, GRL, 25, 4421, doi: 10.1029/1998GL900209
- Ennis et al. (1982) Ennis, D. J., Neugebauer, G., & Werner, M. 1982, ApJ, 262, 460, doi: 10.1086/160441
- Fanale et al. (2000) Fanale, F. P., Granahan, J. C., Greeley, R., et al. 2000, JGR, 105, 22647, doi: 10.1029/1999JE001102
- Ferrari (2018) Ferrari, C. 2018, Space Sci. Rev., 214, 111, doi: 10.1007/s11214-018-0546-x
- Filacchione et al. (2019) Filacchione, G., Adriani, A., Mura, A., et al. 2019, Icarus, 328, 1, doi: 10.1016/j.icarus.2019.03.022
- Fimmel et al. (1974) Fimmel, R. O., Swindell, W., & Burgess, E. 1974, Pioneer odyssey : encounter with a giant, Vol. 349 (NASA AMES Research Center)
- Fischer et al. (2015) Fischer, P. D., Brown, M. E., & Hand, K. P. 2015, AJ, 150, 164, doi: 10.1088/0004-6256/150/5/164
- Fischer et al. (2017) Fischer, P. D., Brown, M. E., Trumbo, S. K., & Hand, K. P. 2017, AJ, 153, 13, doi: 10.3847/1538-3881/153/1/13
- Francis et al. (2020) Francis, L., Johnstone, D., Herczeg, G., Hunter, T. R., & Harsono, D. 2020, AJ, 160, 270, doi: 10.3847/1538-3881/abbe1a
- Greeley et al. (2004) Greeley, R., Chyba, C. F., Head, James W., I., et al. 2004, in Jupiter. The Planet, Satellites and Magnetosphere, ed. F. Bagenal, T. E. Dowling, & W. B. McKinnon, Vol. 1 (Cambridge University Press), 329–362
- Grundy et al. (2007) Grundy, W. M., Buratti, B. J., Cheng, A. F., et al. 2007, Science, 318, 234, doi: 10.1126/science.1147623
- Hansen & McCord (2004) Hansen, G. B., & McCord, T. B. 2004, Journal of Geophysical Research (Planets), 109, E01012, doi: 10.1029/2003JE002149
- Hansen (1973) Hansen, O. L. 1973, Icarus, 18, 237, doi: 10.1016/0019-1035(73)90208-X
- Hanuš et al. (2015) Hanuš, J., Delbo’, M., Ďurech, J., & Alí-Lagoa, V. 2015, Icarus, 256, 101, doi: 10.1016/j.icarus.2015.04.014
- Hartogh et al. (2013) Hartogh, P., Barabash, S., Beaudin, G., et al. 2013, in European Planetary Science Congress, EPSC2013–710
- Hendrix et al. (1998) Hendrix, A. R., Barth, C. A., Hord, C. W., & Lane, A. L. 1998, Icarus, 135, 79, doi: 10.1006/icar.1998.5983
- Howett et al. (2014) Howett, C. J. A., Spencer, J. R., Hurford, T., Verbiscer, A., & Segura, M. 2014, Icarus, 241, 239, doi: 10.1016/j.icarus.2014.05.047
- Howett et al. (2016) —. 2016, Icarus, 272, 140, doi: 10.1016/j.icarus.2016.02.033
- Howett et al. (2010) Howett, C. J. A., Spencer, J. R., Pearl, J., & Segura, M. 2010, Icarus, 206, 573, doi: 10.1016/j.icarus.2009.07.016
- Jaeger (2008) Jaeger, S. 2008, in Astronomical Society of the Pacific Conference Series, Vol. 394, Astronomical Data Analysis Software and Systems XVII, ed. R. W. Argyle, P. S. Bunclark, & J. R. Lewis, 623
- Janssen et al. (2017) Janssen, M. A., Oswald, J. E., Brown, S. T., et al. 2017, Space Sci. Rev., 213, 139, doi: 10.1007/s11214-017-0349-5
- Keihm et al. (2013) Keihm, S., Kamp, L., Gulkis, S., et al. 2013, Icarus, 226, 1086, doi: 10.1016/j.icarus.2013.07.005
- Kerton et al. (1996) Kerton, C. R., Fanale, F. P., & Salvail, J. R. 1996, JGR, 101, 7555, doi: 10.1029/95JE03700
- King et al. (2022) King, O., Fletcher, L. N., & Ligier, N. 2022, PSJ, 3, 72, doi: 10.3847/PSJ/ac596d
- Kivelson et al. (2000) Kivelson, M. G., Khurana, K. K., Russell, C. T., et al. 2000, Science, 289, 1340, doi: 10.1126/science.289.5483.1340
- Lane et al. (1981) Lane, A. L., Nelson, R. M., & Matson, D. L. 1981, Nature, 292, 38, doi: 10.1038/292038a0
- Le Gall et al. (2014) Le Gall, A., Leyrat, C., Janssen, M. A., et al. 2014, Icarus, 241, 221, doi: 10.1016/j.icarus.2014.06.011
- Le Gall et al. (2023) Le Gall, A. A., Bonnefoy, L. E., Sultana, R., et al. 2023, Icarus, 394, 115446, doi: 10.1016/j.icarus.2023.115446
- Lellouch et al. (2016) Lellouch, E., Santos-Sanz, P., Fornasier, S., et al. 2016, A&A, 588, A2, doi: 10.1051/0004-6361/201527675
- Lellouch et al. (2017) Lellouch, E., Moreno, R., Müller, T., et al. 2017, A&A, 608, A45, doi: 10.1051/0004-6361/201731676
- Leonard et al. (2018) Leonard, E. J., Pappalardo, R. T., & Yin, A. 2018, Icarus, 312, 100, doi: 10.1016/j.icarus.2018.04.016
- Leonard et al. (2017) Leonard, E. J., Patthoff, D. A., Senske, D., & Collins, G. C. 2017, in AGU Fall Meeting Abstracts, Vol. 2017, P33A–2862
- Ligier et al. (2016) Ligier, N., Poulet, F., Carter, J., Brunetto, R., & Gourgeot, F. 2016, AJ, 151, 163, doi: 10.3847/0004-6256/151/6/163
- Lucchitta & Soderblom (1982) Lucchitta, B. K., & Soderblom, L. A. 1982, in Satellites of Jupiter, 521–555
- Mätzler (1998) Mätzler, C. 1998, in Astrophysics and Space Science Library, Vol. 227, Solar System Ices, ed. B. Schmitt, C. de Bergh, & M. Festou, 241
- Matzler & Wegmuller (1987) Matzler, C., & Wegmuller, U. 1987, Journal of Physics D Applied Physics, 20, 1623, doi: 10.1088/0022-3727/20/12/013
- McCord et al. (2004) McCord, T. B., Orlando, T. M., Hansen, G. B., & Hibbitts, C. A. 2004, in Workshop on Europa’s Icy Shell: Past, Present, and Future, ed. P. Schenk, F. Nimmo, & L. Prockter, 7042
- McCord et al. (1998) McCord, T. B., Hansen, G. B., Fanale, F. P., et al. 1998, Science, 280, 1242, doi: 10.1126/science.280.5367.1242
- McEwen (1986) McEwen, A. S. 1986, JGR, 91, 8077, doi: 10.1029/JB091iB08p08077
- McEwen et al. (2004) McEwen, A. S., Keszthelyi, L. P., Lopes, R., Schenk, P. M., & Spencer, J. R. 2004, in Jupiter. The Planet, Satellites and Magnetosphere, ed. F. Bagenal, T. E. Dowling, & W. B. McKinnon, Vol. 1 (Cambridge University Press), 307–328
- Mishra et al. (2021) Mishra, I., Lewis, N., Lunine, J., et al. 2021, Icarus, 357, 114215, doi: 10.1016/j.icarus.2020.114215
- Moore et al. (2009) Moore, J. M., Black, G., Buratti, B., et al. 2009, in Europa, ed. R. T. Pappalardo, W. B. McKinnon, & K. K. Khurana (The University of Arizona Press, LPI), 329
- Moore et al. (1998) Moore, J. M., Asphaug, E., Sullivan, R. J., et al. 1998, Icarus, 135, 127, doi: 10.1006/icar.1998.5973
- Moore et al. (2004) Moore, J. M., Chapman, C. R., Bierhaus, E. B., et al. 2004, in Jupiter. The Planet, Satellites and Magnetosphere, ed. F. Bagenal, T. E. Dowling, & W. B. McKinnon, Vol. 1 (Cambridge University Press), 397–426
- Moreno (2007) Moreno, R. 2007, Internal Memo
- Morrison & Cruikshank (1973) Morrison, D., & Cruikshank, D. P. 1973, Icarus, 18, 224, doi: 10.1016/0019-1035(73)90207-8
- Morrison et al. (1972) Morrison, D., Cruikshank, D. P., & Murphy, R. E. 1972, ApJL, 173, L143, doi: 10.1086/180934
- Morrison et al. (1977) Morrison, D., Lebofsky, L. A., Cutts, J. A., Veeder, G. J., & Gross, S. H. 1977, Science, 195, 90, doi: 10.1126/science.195.4273.90-b
- Muhleman & Berge (1991) Muhleman, D. O., & Berge, G. L. 1991, Icarus, 92, 263, doi: 10.1016/0019-1035(91)90050-4
- Muhleman et al. (1986) Muhleman, D. O., Berge, G. L., Rudy, D., & Niell, A. E. 1986, AJ, 92, 1428, doi: 10.1086/114279
- Müller et al. (2016) Müller, T. G., Balog, Z., Nielbock, M., et al. 2016, AA, 588, A109, doi: 10.1051/0004-6361/201527371
- Noll et al. (1995) Noll, K. S., Weaver, H. A., & Gonnella, A. M. 1995, JGR, 100, 19057, doi: 10.1029/94JE03294
- Nordheim et al. (2022) Nordheim, T. A., Regoli, L. H., Harris, C. D. K., et al. 2022, PSJ, 3, 5, doi: 10.3847/PSJ/ac382a
- Ostro (1982) Ostro, S. J. 1982, in Satellites of Jupiter, 213–236
- Ostro et al. (1992) Ostro, S. J., Campbell, D. B., Simpson, R. A., et al. 1992, JGR, 97, 18227, doi: 10.1029/92JE01992
- Pappalardo et al. (2017) Pappalardo, R. T., Senske, D. A., Korth, H., et al. 2017, in European Planetary Science Congress, EPSC2017–304
- Pappalardo et al. (1999) Pappalardo, R. T., Belton, M. J. S., Breneman, H. H., et al. 1999, JGR, 104, 24015, doi: 10.1029/1998JE000628
- Pappalardo et al. (2004) Pappalardo, R. T., Collins, G. C., Head, James W., I., et al. 2004, in Jupiter. The Planet, Satellites and Magnetosphere, ed. F. Bagenal, T. E. Dowling, & W. B. McKinnon, Vol. 1 (Cambridge University Press), 363–396
- Paranicas et al. (2001) Paranicas, C., Carlson, R. W., & Johnson, R. E. 2001, GRL, 28, 673, doi: 10.1029/2000GL012320
- Paranicas et al. (2009) Paranicas, C., Cooper, J. F., Garrett, H. B., Johnson, R. E., & Sturner, S. J. 2009, in Europa, ed. R. T. Pappalardo, W. B. McKinnon, & K. K. Khurana (The University of Arizona Press, LPI), 529
- Paranicas et al. (2002) Paranicas, C., Ratliff, J. M., Mauk, B. H., Cohen, C., & Johnson, R. E. 2002, GRL, 29, 1074, doi: 10.1029/2001GL014127
- Pauliny-Toth et al. (1977) Pauliny-Toth, I. I. K., Witzel, A., & Gorgolewski, S. 1977, AA, 58, L27
- Phillips & Pappalardo (2014) Phillips, C. B., & Pappalardo, R. T. 2014, EOS Transactions, 95, 165, doi: 10.1002/2014EO200002
- Pilcher et al. (1972) Pilcher, C. B., Ridgway, S. T., & McCord, T. B. 1972, Science, 178, 1087, doi: 10.1126/science.178.4065.1087
- Rathbun et al. (2010) Rathbun, J. A., Rodriguez, N. J., & Spencer, J. R. 2010, Icarus, 210, 763, doi: 10.1016/j.icarus.2010.07.017
- Rathbun & Spencer (2020) Rathbun, J. A., & Spencer, J. R. 2020, Icarus, 338, 113500, doi: 10.1016/j.icarus.2019.113500
- Rathbun et al. (2014) Rathbun, J. A., Spencer, J. R., & Howett, C. J. A. 2014, in LPI Contributions, Vol. 1774, Workshop on the Habitability of Icy Worlds, ed. LPI Editorial Board, 4045
- Rathbun et al. (2004) Rathbun, J. A., Spencer, J. R., Tamppari, L. K., et al. 2004, Icarus, 169, 127, doi: 10.1016/j.icarus.2003.12.021
- Schenk (2002) Schenk, P. M. 2002, Nature, 417, 419, doi: 10.1038/417419a
- Schenk & Pappalardo (2004) Schenk, P. M., & Pappalardo, R. T. 2004, GRL, 31, L16703, doi: 10.1029/2004GL019978
- Sinton & Kaminski (1988) Sinton, W. M., & Kaminski, C. 1988, Icarus, 75, 207, doi: 10.1016/0019-1035(88)90002-4
- Smith et al. (1979) Smith, B. A., Soderblom, L. A., Beebe, R., et al. 1979, Science, 206, 927, doi: 10.1126/science.206.4421.927
- Spencer (1987) Spencer, J. R. 1987, PhD thesis, University of Arizona
- Spencer & Calvin (2002) Spencer, J. R., & Calvin, W. M. 2002, AJ, 124, 3400, doi: 10.1086/344307
- Spencer et al. (2006) Spencer, J. R., Grundy, W. M., Dumas, C., et al. 2006, Icarus, 182, 202, doi: 10.1016/j.icarus.2005.12.024
- Spencer et al. (1999) Spencer, J. R., Tamppari, L. K., Martin, T. Z., & Travis, L. D. 1999, Science, 284, 1514, doi: 10.1126/science.284.5419.1514
- Stebbins (1927) Stebbins, J. 1927, Lick Observatory Bulletin, 385, 1, doi: 10.5479/ADS/bib/1927LicOB.13.1S
- Stebbins & Jacobsen (1928) Stebbins, J., & Jacobsen, T. S. 1928, Lick Observatory Bulletin, 401, 180, doi: 10.5479/ADS/bib/1928LicOB.13.180S
- Thompson et al. (2001) Thompson, A. R., Moran, J. M., & Swenson, George W., J. 2001, Interferometry and Synthesis in Radio Astronomy, 2nd Edition (Wiley-VCH)
- Trumbo & Brown (2023) Trumbo, S. K., & Brown, M. E. 2023, Science, 381, 1308, doi: 10.1126/science.adg4155
- Trumbo et al. (2017a) Trumbo, S. K., Brown, M. E., & Butler, B. J. 2017a, AJ, 154, 148, doi: 10.3847/1538-3881/aa8769
- Trumbo et al. (2018) —. 2018, AJ, 156, 161, doi: 10.3847/1538-3881/aada87
- Trumbo et al. (2017b) Trumbo, S. K., Brown, M. E., Fischer, P. D., & Hand, K. P. 2017b, AJ, 153, 250, doi: 10.3847/1538-3881/aa6d80
- Trumbo et al. (2019a) Trumbo, S. K., Brown, M. E., & Hand, K. P. 2019a, Science Advances, 5, aaw7123, doi: 10.1126/sciadv.aaw7123
- Trumbo et al. (2019b) —. 2019b, AJ, 158, 127, doi: 10.3847/1538-3881/ab380c
- Trumbo et al. (2020) —. 2020, AJ, 160, 282, doi: 10.3847/1538-3881/abc34c
- Trumbo et al. (2022) Trumbo, S. K., Becker, T. M., Brown, M. E., et al. 2022, PSJ, 3, 27, doi: 10.3847/PSJ/ac4580
- Tsang et al. (2016) Tsang, C. C. C., Spencer, J. R., Lellouch, E., Lopez-Valverde, M. A., & Richter, M. J. 2016, Journal of Geophysical Research (Planets), 121, 1400, doi: 10.1002/2016JE005025
- Ulich (1981) Ulich, B. L. 1981, AJ, 86, 1619, doi: 10.1086/113046
- Ulich & Conklin (1976) Ulich, B. L., & Conklin, E. K. 1976, Icarus, 27, 183, doi: 10.1016/0019-1035(76)90001-4
- Ulich et al. (1984) Ulich, B. L., Dickel, J. R., & de Pater, I. 1984, Icarus, 60, 590, doi: 10.1016/0019-1035(84)90166-0
- Villanueva et al. (2023) Villanueva, G. L., Hammel, H. B., Milam, S. N., et al. 2023, Science, 381, 1305, doi: 10.1126/science.adg4270
- Walker et al. (2012) Walker, A. C., Moore, C. H., Goldstein, D. B., Varghese, P. L., & Trafton, L. M. 2012, Icarus, 220, 225, doi: 10.1016/j.icarus.2012.05.001
- Warren (1984) Warren, S. G. 1984, Applied Optics, 23, 1206, doi: 10.1364/AO.23.001206
- Zahnle et al. (1998) Zahnle, K., Dones, L., & Levison, H. F. 1998, Icarus, 136, 202, doi: 10.1006/icar.1998.6015
- Zahnle et al. (2003) Zahnle, K., Schenk, P., Levison, H., & Dones, L. 2003, Icarus, 163, 263, doi: 10.1016/S0019-1035(03)00048-4
- Zhang et al. (2023) Zhang, Z., Bolton, S. J., Brown, S., et al. 2023, in LPI Contributions, Vol. 2806, LPI Contributions, 2314