Analysis of Internet of Things implementation barriers in the cold supply chain: an integrated ISM-MICMAC and DEMATEL approach
Kazrin Ahmad1, Md. Saiful Islam1, Md Abrar Jahin1, and M. F. Mridha2*
1 Department of Industrial Engineering and Management, Khulna University of Engineering and Technology (KUET), Khulna 9203, Bangladesh
2 Department of Computer Science, American International University-Bangladesh, Dhaka 1229, Bangladesh
* firoz.mridha@aiub.edu
Abstract
Integrating Internet of Things (IoT) technology inside the cold supply chain can enhance transparency, efficiency, and quality, optimizing operating procedures and increasing productivity. The integration of IoT in this complicated setting is hindered by specific barriers that need a thorough examination. Prominent barriers to IoT implementation in the cold supply chain are identified using a two-stage model. After reviewing the available literature on the topic of IoT implementation, a total of 13 barriers were found. The survey data was cross-validated for quality, and Cronbach’s alpha test was employed to ensure validity. This research applies the interpretative structural modeling technique in the first phase to identify the main barriers. Among those barriers, “regularity compliance” and “cold chain networks” are key drivers for IoT adoption strategies. MICMAC’s driving and dependence power element categorization helps evaluate the barrier interactions. In the second phase of this research, a decision-making trial and evaluation laboratory methodology was employed to identify causal relationships between barriers and evaluate them according to their relative importance. Each cause is a potential drive, and if its efficiency can be enhanced, the system as a whole benefits. The research findings provide industry stakeholders, governments, and organizations with significant drivers of IoT adoption to overcome these barriers and optimize the utilization of IoT technology to improve the effectiveness and reliability of the cold supply chain.
1 Introduction
The supply chain (SC) is a network of related entities that includes every procedure step, starting with the procurement of raw materials or components to the consummation of the finished good. The cold SC (CSC) is a procedure that includes activities regulated by temperature and a specialized logistical infrastructure designed to maintain product quality and temperature consistency throughout its entire transit, beginning with the point of origin in manufacturing or procurement and ending with its eventual delivery to the final consumer [1]. Everything from preparing, storing, transporting, and monitoring temperature-sensitive goods from their providing areas to their receiving locations involves a sequence of activities in the CSC. Food, flowers, medicines, and chemicals are all examples of temperature-sensitive items because of their perishable nature [2].
The Internet of Things (IoT) refers to a network that links physical items to the Internet and allows them to broadcast data in order to intelligently identify themselves and enable their location, tracking, monitoring, and management with the assistance of radio frequency identification tags, sensors, actuators, and positioning systems [3]. The IoT emerged from networked devices, which started at MIT’s Auto-ID Centre in the nineties, according to Centre Director Kevin Ashton, who purportedly developed the concept of IoT at the turn of the millennium. The current concept of IoT is backed by the addition of GPS devices, smartphones, social networks, cloud computing, and data analytics to these existing networks [4]. The IoT plays a significant part in Industry 4.0, which encompasses a variety of innovative and revolutionary technologies, cyber-physical systems, the IoT, and cloud computing—in particular [5]. It links objects, sensors, actuators, and other smart technology, allowing immediate access to physical commodities data to support new services with great efficiency and productivity [6].
Improved operating processes, reduced risk and expense, more visibility and transparency, and greater adaptability and flexibility across the supply chain are merely a few of the many advantages of incorporating IoT into the supply chain [7]. IoT technology may drastically boost the monitoring and control of CSCs, particularly in areas like medications, food, and logistics where temperature-sensitive commodities are moved and preserved [8].
Integrated Interpretive Structural Modeling and Decision Making Trial and Evaluation Laboratory (ISM-DEMATEL) is an extensively used technique for decision-making and analysis in complex systems. ISM is beneficial for building hierarchical links among factors and analyzing the structure of complex systems, while DEMATEL delivers a quantitative assessment of the intensity and direction of interactions between factors [9][10]. Both approaches allow for a combination of qualitative and quantitative research, with DEMATEL specifically addressing feedback loops. They are straightforward and obvious, making them easier to explain and grasp by decision-makers [11][12][13].
The increasing volume of international trade and consumer spending has spurred the fast growth of the supply chains for perishable commodities. Logistics for “cold chain” items, such as perishables and frozen foods, constantly evolve. Global revenue for the sector is forecast to reach USD 277.69 billion by 2023, growing at a CAGR (cumulative aggregate gross revenue) of 7.24 percent between 2018 and 2023 [14].
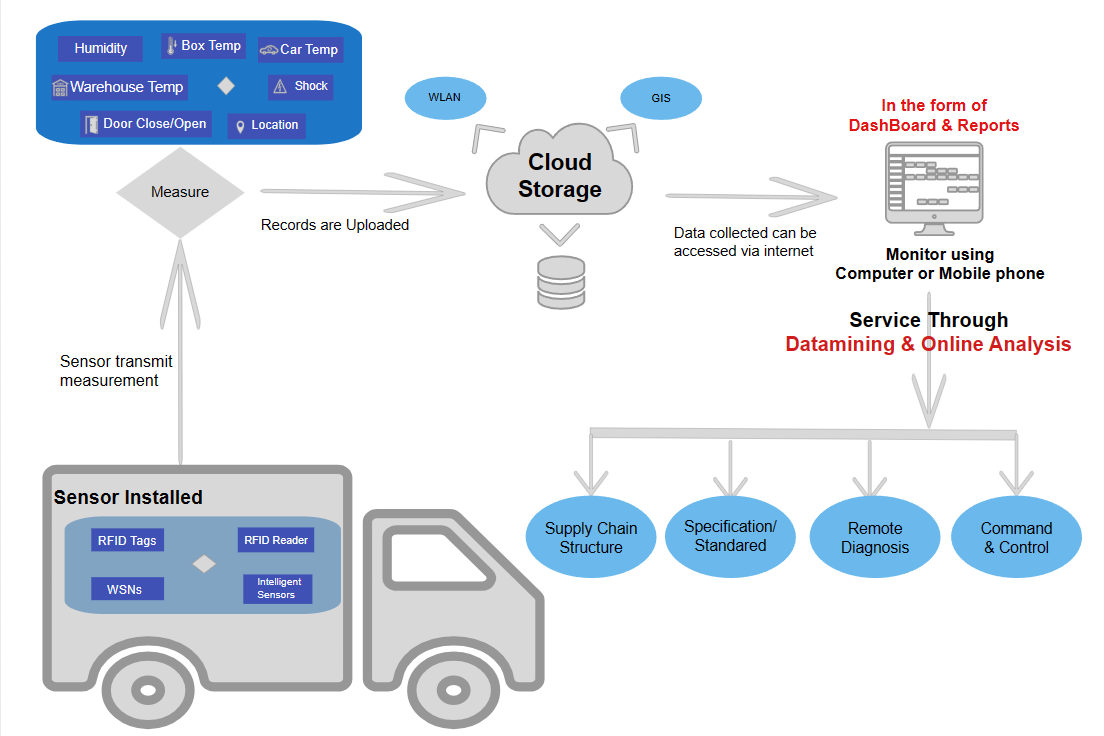
A simplified and technology-enhanced logistics method for CSC IoT implementation is shown in Fig 1. The graphic depicts IoT sensors installed across the CSC to track moisture, temperature, and other important factors, including refrigerated vehicles, warehouses, and storage facilities. To provide immediate insight into the state of the products in transit, data collected from these sensors is wirelessly connected and relayed in real-time to a centralized system [15]. In sectors like pharmaceuticals and food, where maintaining the proper temperature is crucial to product quality and safety, IoT devices make sure that temperature-sensitive commodities are stored and transported within the designated temperature range [16]. By considering traffic, weather, and the quality of the supplies, IoT may help enhance delivery routes [17]. This guarantees that perishable goods arrive on schedule and in the best possible shape. IoT sensors can monitor inventory levels to minimize overstocking or understocking of temperature-sensitive products, which lowers spoilage and perishable goods losses [18]. Well-organized logistics and transportation systems greatly affect product quality. Adopting a high-quality logistics system, especially for perishable items, involves frequent temperature monitoring, real-time product quality assessment, and shelf life determination [19].
Several studies have delved into barriers within specific countries and contexts; however, these investigations are not without limitations. Some have explored sectors unrelated to the CSC, and while certain studies have focused on IoT adoption in this context, they often fall short in establishing connections among identified barriers or evaluating their respective impacts on the overall system. Moreover, the exploration of the IoT implementation barriers in CSCs represented a significant gap in the existing literature, with no prior comprehensive studies identified in this specific domain. The lack of scholarly attention to this crucial aspect within CSC underscored the need for an in-depth investigation. Our research stands as a pioneering effort to bridge this notable gap by employing an integrated ISM-DMATEL approach.
The literature gap is particularly evident in the scarcity of empirical examinations and theoretical frameworks dedicated to understanding the intricacies of implementing IoT in CSCs. The unique challenges posed by the CSC environment, characterized by stringent temperature control requirements and perishable goods logistics, warranted a dedicated exploration.
To address these gaps, this paper contributes to the existing literature in the following ways:
-
1.
In-depth analysis of research on essential barriers to CSC IoT adoption, considering various perspectives, including supply chain stages, environmental effects, socio-economic scenery, and data complexity.
-
2.
Employing a survey-based approach to gather data and expert opinions on these barriers.
-
3.
The utilization of the ISM method to determine the interdependencies among the selected barriers.
-
4.
The application of the MICMAC strategy to comprehensively analyze the fundamental constructs, thereby offering valuable insights into their significance.
-
5.
The utilization of the DEMATEL approach to validate the causal interrelationships among the components within the model.
-
6.
Highlighting key barriers that play a fundamental role in efficiently managing the cold chain, offering insights to overcome challenges in IoT adoption.
-
7.
Systematic identification and ranking of barriers based on their influence on the system, addressing the current lack of comprehensive assessments in the literature.
-
8.
Contribution towards filling research gaps by focusing specifically on the CSC, distinguishing it from studies that extend across different sectors.
-
9.
Providing a structured approach to understanding and addressing the challenges associated with IoT implementation in the CSC, contributing to enhanced operational efficiency and reliability.
-
10.
Offering valuable insights for enterprises, governments, and technology developers to navigate and overcome obstacles in integrating IoT into CSC operations.
The rest of the paper is arranged as follows: “Literature review” provides a comprehensive literature review of IoT implementation in CSCs, including implementation challenges and comparable methodologies utilized in the present era; “Methodology” presents the research methodology that was used for the study; “Numerical illustration for results interpretation” covers the data analysis, along with the application of ISM-DEMATEL to the obtained barriers; “Discussions” describes the result of the implementation of ISM-DEMATEL techniques and discussion about the result. Finally, the study finishes with conclusions, limitations, and recommendations for future work in “Conclusions and future works”.
2 Literature review
This is part of the article’s aim to provide a summary of how cold SCM procedures may make use of IoT. We have used Google Scholar and many publishers’ websites, including Springer, Elsevier, Emerald, and Taylor-and-Francis, to compile the literature most relevant to our study.
2.1 Internet of Things (IoT)
First invented in 1999 by Kevin Ashton and many other scholars at the Massachusetts Institute of Technology, the IoT has gained broad interest because it can provide comfort, efficiency, and competitive benefits to the corporate sector [20]. IoT is an essential idea in the coming period. Numerous smart buildings and smart houses are being built using IoT technologies [21]. IoT presents a new opportunity to reduce risks, manage complexity, and produce concrete economic benefits via increasing transparency and flexibility across the supply chain [22]. The physical components that link the IoT include wireless devices like portable computers, smartphones, wearable gadgets, RFID tags, RFID readers, wireless sensors, etc. Users may interact with the IoT network using a variety of devices, including cellphones, implanted RFID transponders, wirelessly connected PCs, and wearable tech [23]. The popularity and success of IoT have skyrocketed in recent years. Industry leaders, technologists, and consumers see the importance of IoT, which has led to an industrial revolution and automated operations in organizations and homes [24]. Human-to-thing communication and autonomous coordination among “things” is possible even when they are kept at a facility or transported from one entity in the supply chain to another. Increased supply chain visibility, responsiveness, and adaptability to a variety of SCM challenges are all made possible by the IoT [25] [4].
2.2 IoT in CSC
The IoT, often known as the third wave of IT, has revolutionized supply chain management (SCM) and other sectors. This helps the supply chain function expand by offering technical assistance for greater visibility, stability, and intelligent management [26]. Ben-Daya et al. [4] analyzed the existing literature to learn more about the IoT and how it influences SCM. In addition, the majority of research has concentrated on the steps in the supply chain that pertain to food production, distribution, and processing. Kamble et al. [27] proposed an integrated ISM- DEMATEL model to identify the most significant barriers to the widespread deployment of IoT technologies in the food retail supply chain. The two most significant barriers to the widespread use of the IoT were found to be a lack of government regulation and an insufficient network infrastructure.
Numerous deployment strategies, constraints, and barriers in cold chain monitoring applications were discussed [28]. The feasibility of implementing modern technologies such as the IoT to enhance the cold SC was assessed in this article [29]. In order to enhance its service quality, the organization must invest additional funds in maintenance. Umamaheswari et al. [30] suggested smart cold storage that uses cutting-edge supply chain technology and the IoT to boost productivity and reduce wait times at all levels. Luo et al. [31] presented a smart monitoring system that stores data on defined servers to monitor cold chain items in real time while cutting costs, enhancing network capacity, and simplifying protocols. Cold chain transit is easy to track using this strategy. Afreen and Bajwa [32] implemented a system that utilizes the IoT to track and notify users of changes in cold storage conditions such as humidity, temperature, light, and gas concentration in real-time., alerting workers when these variables exceed safe thresholds. Goodarzian et al. [33] proposed a model for improving vaccine injection’s precision, swiftness, and fairness and implemented the inaugural responsive green-cold vaccine supply chain network in response to the COVID-19 pandemic. Intelligent control technology, a cellular network, wireless communication technology, temperature and humidity sensors, the IoT, and database technology all come together to form the cold chain management system[34]. Ceken and Abdurahman [35] presented an IoT-based cold chain logistics system that controls and monitors the cold chain’s ambient temperature in real-time and estimates perishable item shelf life to help all stakeholders make better decisions. The paper by [18] presented an IoT-based risk monitoring solution to handle product quality and safety concerns in the cold chain. Using this technology, the cold chain can be monitored in real-time, and risks assessed to ensure the safety of workers. Hernandez and Yamaura [36] suggested that IoT-enabled devices may reduce pharmaceutical waste from temperature changes. It also showed consistency in IoT implementation, including infrastructure, security, and device management. Due to perishable food and cross-regional transit, cold chain systems encounter several challenges in perishable food supply chains. This study of [37] addressed these difficulties by creating a perishable food supply chain model utilizing real-time IoT data and two supply hubs to increase performance. Future cold supply networks can be more resilient and sustainable if they use IoT technologies. This advancement is expected to result in less waste and decreased operational expenses, therefore benefiting both businesses and consumers [29] [38].
2.3 IoT implementation barriers
IoT deployment is challenging due to device and data security, interoperability issues, scalability, trust, privacy concerns, financial issues, a lack of qualified personnel, and compliance with data privacy laws. First, it is necessary to identify the barriers that hinder IoT implementation in the CSC to overcome these challenges. Table 1 lists the barriers to implementing IoT in CSC.
| Sl No. | Barriers | Implied Meaning | References |
|---|---|---|---|
| 01 | Regularity compliance | The CSC has strict temperature and data management guidelines. It may be challenging to implement IoT technology and meet these requirements. In the pharmaceutical and food industries, strict regulations are tough to follow. Failing to satisfy these regulations may result in product recalls or legal concerns. | [39] [40] [41] [42] |
| 02 | High implementation cost | In order to adopt the IoT, it may be necessary to make a sizable initial investment in things like sensors, devices, and infrastructure. Transporting and storing cold requires plenty of energy. Costs may rise with power prices. | [43] [28] [29] [38] |
| 03 | Lack of skilled workforce | Multiple sensors, data analytics, and system integration make IoT-enabled CSCs difficult. Implementing, deploying, and administering these systems may be challenging without trained people. Integration of IoT into CSCs demands expertise. Without qualified workers, organizations may struggle to analyze this data. | [44] [45] [46] [47] |
| 04 | Data security and privacy | Data generated and sent by IoT devices is often private. Extremely regulated sectors, such as healthcare and pharmaceuticals, make it difficult to safeguard this data and guarantee privacy compliance. | [48] [49] [36] |
| 05 | Technological infrastructure | Integrating the IoT into an already established supply chain might be challenging. On the other hand, it’s likely that some of the more recent IoT technologies won’t be compatible with more established networks and software. IoT devices can’t be deployed and used effectively without the right infrastructure in place. | [31] [50] [36] [51] |
| 06 | Scalability challenges | Scalability is a challenge for numerous sectors. It may be difficult to implement IoT throughout a complex supply chain. Cold supply networks need strict data monitoring and traceability. Implementing and running these systems need accurate data. Coordinating many linked devices and data becomes more difficult as IoT networks grow. | [52] [50] [53] [46] |
| 07 | Cultural and ethical consideration | Cultural norms and expectations must be addressed when adopting IoT devices that monitor behaviors and data. IoT devices that monitor and enhance work processes may affect employees differently by culture. Technological developments may not benefit all workers. As IoT automation reduces human control, workers may fear they will be outdated. | [54] [40] [47] |
| 08 | Acceptance and adoption | IoT implementation may involve organizational training and cultural changes; therefore, resistance to change and acceptance may be a significant obstacle. Several parties in the CSC may not understand IoT’s potential benefits, generating resistance. Worker resistance to the current system may hinder adoption. | [55] [56] |
| 09 | Data integration and management issue | Constructing a cohesive and efficient system might be difficult due to possible communication difficulties across different IoT devices and platforms. The IoT is the source of a lot of data. Without proper data management and analytics tools, it is very challenging to deal with this massive amount of data, let alone analyze it and derive any meaningful conclusions from it. | [31] [57] [14] [53] |
| 10 | Reliability issue | Inefficient asset monitoring and network concerns may cause asset loss, theft, customer distrust, delays, data loss, and inefficiency. IoT device failures may interrupt operations and raise maintenance expenses. Improper data input or modification without validation might affect reliability, resulting in non-compliance with industry standards and legal issues. | [28] [18] [42] [49] |
| 11 | ROI uncertainty | A thorough cost-benefit analysis is required to determine the potential return on investment. The overall cost of an IoT deployment might be more than expected if the time it takes to see a return on investment is greater than expected. | [28] [29] |
| 12 | Extreme environment issue | Extreme weather is a common occurrence for cold supply networks. Radio wave frequency is impacted by nearby elements, including metals and water, resulting in variable performance. It might be difficult to maintain the functionality and reliability of IoT devices when they are in cold storage or in transit. | [58] [28] [32] [59] |
| 13 | Cold chain network | Remote or mobile supply chain equipment powering might be difficult. IoT devices may have trouble delivering data in rural or poor areas with poor network coverage. Many temperature-sensitive items can not resist slight temperature fluctuations during transport, storage, and handling, which could affect the cold chain network. | [60] [61] [62] [56] [59] |
2.4 Methodology related literature
ISM is a computer-based learning method that assists individuals or groups in creating a visual representation of the intricate connections among several aspects of a complex situation. The fundamental idea is to use the practical skills and knowledge of specialists to dissect a complex system into many sub-systems and construct a multi-level structural model[9]. Raut et al. [63] employed the ISM approach to establish the interconnections among the drivers, enabling a comprehensive knowledge of the relative connections among the critical success factors but also defining their dependency when implementing sustainability.
The DEMATEL technique has been used proficiently for the purpose of identifying critical barriers in various vital processes, which was created to support methodical evaluations and organized decision-making processes. The effect connections map shows the relational linkages, with numbers denoting influence degree and arrows denoting influence direction. It is a comprehensive tool for assessing interrelations between system variables and emphasizing core-driving components [10]. Manoharan et al. [64] presented the DEMATEL model, which aids in comprehending the importance of drivers and barriers, creating matrices or digraphs to represent complex causal interactions, and discovering the relationships between these factors. Similar barrier analysis techniques employed in recent attempts are outlined in Table 2.
| Sl no. | Authors | Methodology | Problems | Findings |
|---|---|---|---|---|
| 1 | [65] | ISM MICMAC | Figured out what matters most for reducing food waste and loss in supply chains for fresh produce | Regulatory bodies, food policy, and market infrastructure are the most important elements that have a strong propensity to affect the lowering of FLW in FPSCs. |
| 2 | [66] | DEMATEL-MMDE-ISM | Identified and evaluated potential barriers to IoT deployment in the manufacturing industry | Highlighted the key challenges where academics and practitioners may concentrate their strategic efforts to overcome implicit concerns while deploying IoT Techniques in manufacturing. |
| 3 | [67] | Bayesian Best-Worst Method | Discovered barriers to the implementation of the circular economy in the manufacturing sector. | Recommended a more realistic PFS performance, allowing several uses. |
| 4 | [68] | Bayesian Best-Worst Method | Identified multiple barriers to implementing the IoT in the food industry | Major barrier to the IoT in the food industry is the absence of an adequate internet infrastructure. |
| 5 | [69] | ISM-DEMATEL | Examined the identified obstacles that impede the implementation of electronic waste management practices in India. | Key challenges pertaining to e-waste recycling are a lack of public knowledge and rules about the matter. |
| 6 | [70] | DEMATEL–ISM | Identified what circumstances affected the flight crew’s TSA protocol | Different levels of hierarchy, mutual impact, and the cause-and-effect link are shown for the flight crew’s TSA creation and management. |
| 7 | [71] | Fuzzy-ISM-DEMATEL | Identified barriers to implementing sustainable purchasing practices over the internet | Improved DEMATEL, ISM, and rough set theory into a unified framework. |
| 8 | [72] | ISM-DEMATEL | Analysed the challenges associated with waste recycling in India | For India’s trash recycling infrastructure to grow, significant barriers such as a lack of funds, input material, and subsidies have to be overcome. |
The literature investigation talks about every element of the CSC, covering transportation, cold storage, procurement, and occupational security across the cold chain. IoT supports SCM, enhancing visibility and stability, but problems include regulatory limitations and bad infrastructure. Most of the study focuses on distinct problems and seeks to solve these challenges with the provided solutions. In the combined ISM-MICMAC-DEMATEL approach, ISM-MICMAC is used for constructing hierarchical relationships among barriers and analyzing the structure of systems, while DEMATEL delivers a numerical evaluation of the strength and direction of interactions between factors. Numerous barrier analysis strategies are employed in modern methods that are also used to analyze obstacles. The choice between these tactics varies depending on individual circumstances, available data, and decision-makers’ preferences. From thirty-one research papers, thirteen barriers were found, and from the different barrier analysis techniques utilized in recent approaches, ISM-DEMATEL was chosen to analyze these barriers.
3 Methodology
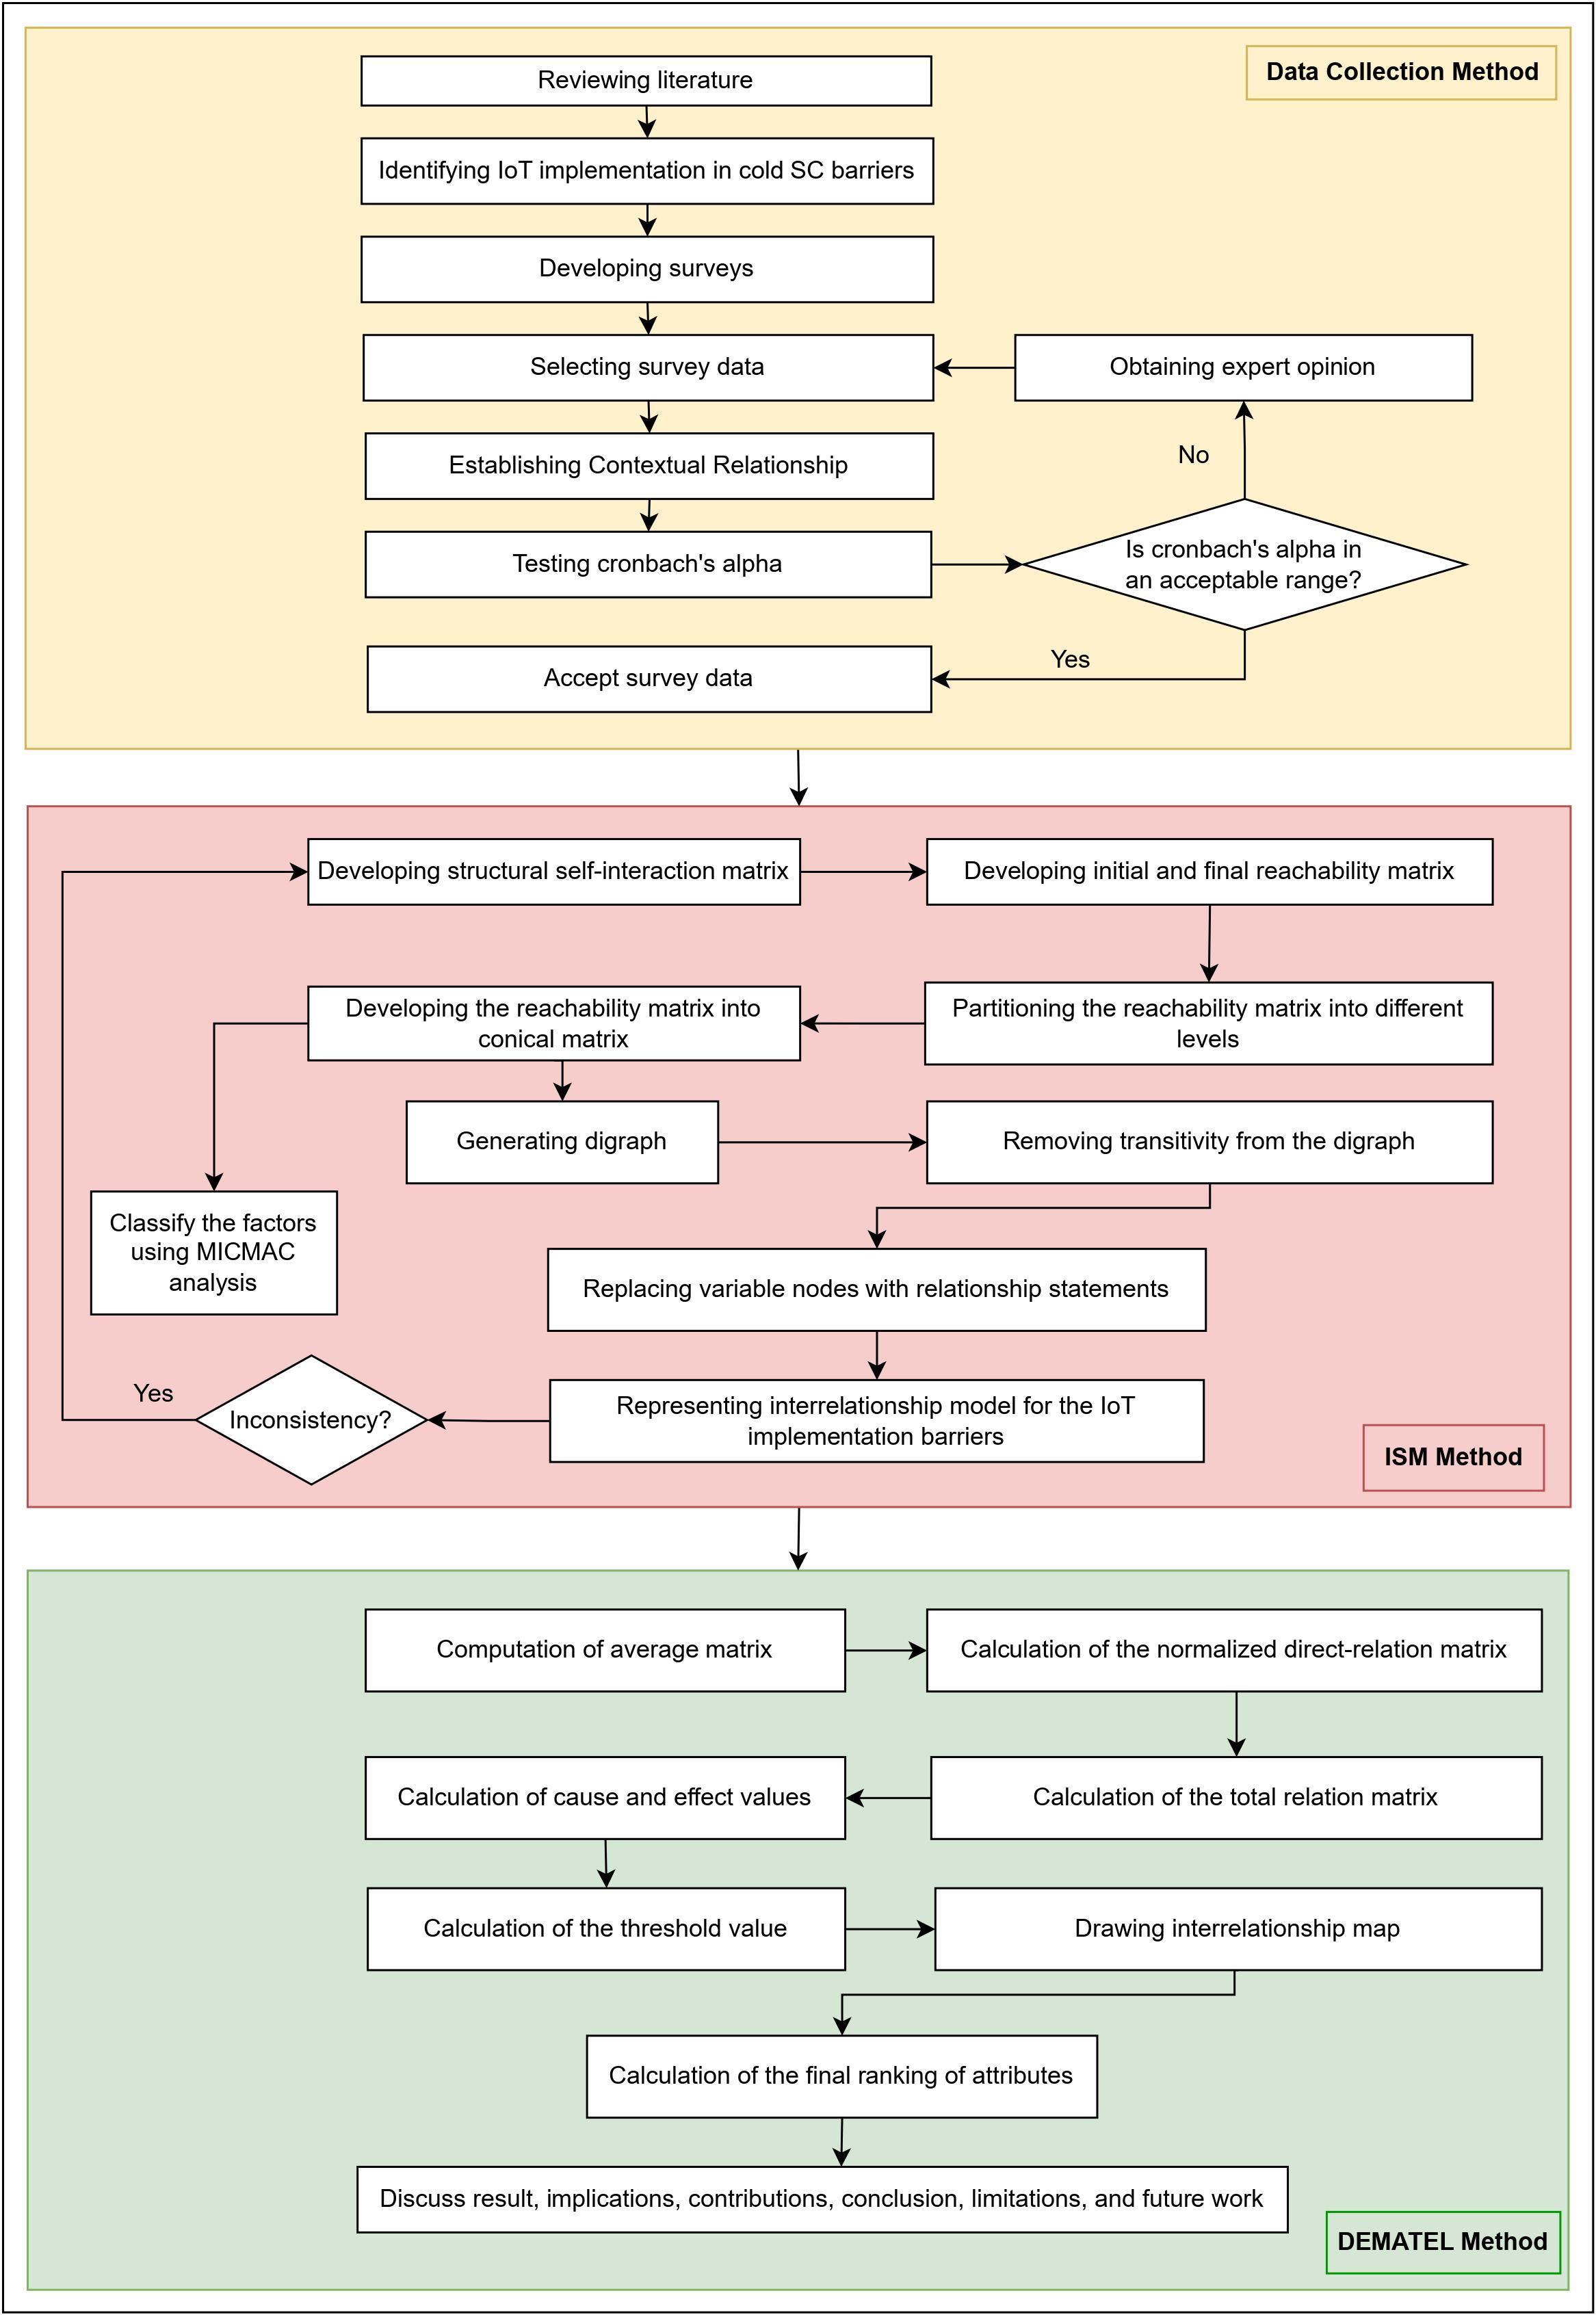
The research initiation involves several key stages, including the design of surveys, meticulous data collection, selection procedures, and rigorous reliability testing, as illustrated in Fig 2. Subsequently, the second phase unfolds with a process flow diagram outlining the development of an ISM model. The third phase is characterized by a process flow diagram that delineates the systematic steps employed in constructing the DEMATEL model.
3.1 Data collection method
3.1.1 Barriers identification
This involves identifying and recognizing possible obstacles or challenges inside the system. These obstacles might be technical, organizational, or connected to other system operation elements. With the use of literature research and expert comments, potential barriers to the system are identified, as described in Table 1.
3.1.2 Survey development and data selection procedure
Thirty experts participated in the ISM survey. The diagonal values in the ISM method are all zero. Only use one side of the diagonal value to create the initial reachability matrix. With the exception of the diagonal values, all thirteen rows and thirteen columns of the matrix were surveyed. This verification process guarantees that the data provided by the respondents is valid. After determining that the impact of barrier 1 on barrier 2 is V, the expert must have concluded that the impact of barrier 2 on barrier 1 is A. If O and X are on a diagonal, then their opposing sides must be the same. These checks will improve the survey’s quality, even if the initial reachability matrix ultimately decides the whole system.
The DEMATEL impact factor survey, which is likewise associated with the ISM survey, is also measured on a scale from 0 to 4. The next issue concerns the impact factor, which must be larger than or equal to 1 if the effect of barrier 1 on barrier 2 is V. A value of 0 is required for the influence factor if it is O, and a positive number is also required for X. Therefore, this method of cross-checking will enhance the survey’s quality.
Twelve reasonable answers were selected for each question, and twelve matrices were constructed from them. The average of these matrices was then calculated to determine the average matrix. For ISM, the structural self-interaction matrix is also prepared using the value that appears most often in these logical replies.
Table 3 provides a succinct overview of the varied characteristics present in the expert panel. The quantification of each category offers vital information about the group’s makeup. A table of this kind assists in visually representing and examining the distribution of expertise. The organized survey data from these thirty experts helps the comprehensibility of the information, which is essential for generating the outcome. The gender distribution comprises 26 males and 4 females. Regarding age, 13 panelists are below 30, 8 fall in the 30–40 range, 5 are aged 41–50, and 4 are 51 years and above. Regarding experience in their respective fields, 10 experts have less than five years, 7 possess 5–10 years, 10 have 10–15 years, and 6 hold 15 years and above. The domain of expertise includes 8 in Academics (Industrial Engineering), 5 in System Integration, 4 in Data Analysts, 6 in Data Security, and 7 in Cold Chain Executives.
| Demographics | Number of experts |
|---|---|
| Gender | |
| Male | 26 |
| Female | 4 |
| Age | |
| Below 30 years | 13 |
| 30–40 years | 8 |
| 41–50 years | 5 |
| 51 years and above | 4 |
| Experience in their field | |
| Less than five years | 10 |
| 5–10 years | 7 |
| 10–15 years | 7 |
| 15 years and above | 6 |
| Domain of expertise | |
| Academics (Industrial Engineering) | 8 |
| System Integration | 5 |
| Data Analyst | 4 |
| Data Security | 6 |
| Cold chain executives | 7 |
3.1.3 Establish relationships between barriers
Once the possible obstacles are discovered, it’s essential to understand how these barriers are interrelated or impact each other. This step assists in understanding the system’s complexity and how different challenges may be connected. In order to determine which pairs of barriers need further investigation, the contextual relationship between them is established.
3.1.4 Cronbach’s alpha testing
The reliability coefficient Cronbach’s alpha can be used for evaluating survey or test item internal consistency. Many psychological and educational surveys and assessments use Cronbach’s alpha in their formulation and testing. It aids researchers and practitioners in ensuring their measuring equipment accurately measures the idea in question. Cronbach’s alpha reliability is a measure of how well a sum or average of k measurements holds up, where k measures might be anything from k raters to alternate forms to items on a questionnaire or exam. We have a 169-item questionnaire (k = 156) to measure implementation barrier influence, with each item scored on a 0–4 Likert scale. A Cronbach’s alpha value should exceed 0.7 since a value equal to or more than 0.7 falls within an acceptable range [73].
The variance of the total score (270.52) and the sum of the item variances (67.88) provide this dependability measure. The survey dataset has an acceptable degree of internal consistency, as shown by the Cronbach’s alpha value of 0.7534. This measuring tool reliably captures the targeted construct since the coefficient is greater than the generally recognized requirements of 0.7.
3.2 Interpretative structural model (ISM)
The initial development of ISM can be attributed to J. Warfield in 1973 to examine intricate socioeconomic systems [72]. It is a method that may help individuals or teams better grasp a topic by organizing their understanding of it into a network diagram. The following is a detailed description of how ISM works [11][12].
3.2.1 Step 1: Developing structural self-interaction matrix (SSIM)
The pair-wise connection between barriers in the system can be observed by employing SSIM for barriers. The following four symbols each indicate a unique set of relationships:
-
•
V: Barrier influences barrier ;
-
•
A: Barrier influences barrier ;
-
•
X: Barriers and influence each other;
-
•
O: Barriers and have no relationship.
3.2.2 Step 2: Developing reachability matrix
The SSIM generates a reachability matrix; four symbols are converted to 0s and 1s to implement SSIM in the initial reachability matrix. matrix.
Specific rules of replacement are as follows:
-
•
If of SSIM is shown with the symbol “V,” and should be assigned in the initial reachability matrix;
-
•
If of SSIM is shown with the symbol “A,” and should be assigned in the initial reachability matrix;
-
•
If of SSIM is represented by an “X,” then and should be placed in the initial reachability matrix,
-
•
If of SSIM is represented by an “O,” then and should be assigned.
3.2.3 Step 3: Developing final reachability matrix
A transitivity test is then performed on the initial reachability matrix. ISM presupposes, as a given, that contextual relations are transitive. If barrier A is connected to barrier B, and B is related to barrier C, then barrier A must also be related to barrier C.
3.2.4 Step 4: Developing level partition
Level partition refers to categorizing or classifying distinct levels inside the information system. This can involve dividing the system into levels or hierarchies to understand its structure at various levels better. The resultant final reachability matrix is segmented into several hierarchical levels.
3.2.5 Step 5: Developing conical form
The conical form describes structuring or organizing the information system in an arrangement that resembles a conical shape, indicating a hierarchical structure. The conical form of the reachability matrix is subsequently created.
3.2.6 Step 6: Developing ISM model
A directed graph is constructed using a reachability matrix, eliminating transitive linkages. By exchanging the nodes of variables for statements, it is then converted into an ISM from the resultant digraph.
3.2.7 Step 7: Reviewing to check for inconsistency
After establishing the level partition, conical shape, and ISM model, it’s important to examine the full system to detect and resolve any discrepancies. This step verifies the system is consistent and functions smoothly without conflicting factors. The generated ISM model is reviewed for conceptual coherence, and any necessary revisions are implemented.
3.3 MICMAC analysis
MICMAC (multiplication of impact matrix applied to classification) study seeks to create a graph for categorizing various barriers. MICMAC algorithm is based on the multiplication characteristics of matrices [75].
To depict the interrelationships of a system’s components, the ISM framework requires the construction of a conical matrix. For each element, the driving power and dependence power are calculated by adding up the values in the rows and columns, respectively. These elements are further classified according to the effectiveness of their driving and dependent power in the MICMAC analysis. Factors are grouped into four categories: autonomous, dependent, linkage, and independent [76].
-
1.
Group I (Autonomous factors): Comprises autonomous factors characterized by minimal interdependencies.
-
2.
Group II (Dependent factors): Encompasses dependent factors exhibiting a substantial reliance but limited generative capacity.
-
3.
Group III (Linkage factors): Consists of linkage factors possessing robust propelling force and reliability.
-
4.
Group IV (Independent factors): Involves factors that significantly impact the outcomes of sustainable energy initiatives but are not markedly influenced by other variables. These factors can be adeptly utilized to manipulate other elements, thereby contributing to the preservation of sustainable energy objectives.
3.4 DEMATEL
The DEMATEL method may transform the complex web of interrelations between barriers into a clear structural model of the system by categorizing them into two groups: causes and effects. It’s a practical method for ranking the relative importance of different aspects of a complex system to inform strategic decisions over the long run and identify potential development areas [77]. It is extensively implemented across numerous domains, such as SCM, traceability, smart cities, healthcare, and consumer behavior [78]. The following is a detailed description of how DEMATEL works [13] [27].
3.4.1 Step 1: Computation of average matrix
Everyone on the expert panel that filled out the survey was asked to provide an integer value between 0 and 4 to represent the degree of influence they saw between any two barriers, utilizing five different integer scales as “very high influence (4)”, “high influence (3)”, “moderate influence (2)”, “low influence (1)”, and “no influence (0)”. A respondent’s estimate of how much variable influences variable is denoted by the symbol. For , 0 is assigned to each diagonal element.
For every respondent, we may generate a non-negative matrix using the formula , where means that there were a total of responders with and factor’s total number is denoted by . In this case, the responders’ matrices are denoted as .
The average matrix can be created as
| (1) |
3.4.2 Step 2: Calculation of the normalized direct-relation matrix
Normalize direct-relation matrix by , where
| (2) |
3.4.3 Step 3: Calculation of the total relation matrix
The total relation matrix is represented as
| (3) |
where is the identity matrix.
3.4.4 Step 4: Calculation of cause and effect values
and values, representing the sum of the values in rows and columns, are now used in the calculations. Where,
| (4) |
| (5) |
The transpose value of the column, denoted by , the sum of the values of the column, , shows the effect of the attribute on the other attributes. The influence of the row, denoted by , indicates the cause of the attribute on the other attributes. The sum represents the cumulative effects experienced and exerted by factor . It signifies the degree of importance of element within the overall system. The difference indicates the net effects that factor contributes to the system. If the difference between and is positive, the influence factor may be seen as a net cause. Conversely, if the difference between and is negative, factor can be regarded as a net receiver.
3.4.5 Step 5: Calculation of the threshold value
The determination of the threshold value is necessary in order to construct the interrelationship map. The interrelationship map only displays equations whose penetration matrix values are greater than the threshold value. The mean of the elements inside the entire penetration matrix is computed using the Equation 6.
| (6) |
3.4.6 Step 6: Drawing interrelationship map
The interrelationship map is created to comprehensively analyse the final solution, considering the values of and for each attribute in relation to the threshold value.
3.4.7 Step 7: Calculation of the final ranking of attributes
The interrelationship map derives a potential framework and hierarchy for the factors. This is achieved by organizing the values of in a descending order.
4 Numerical illustration for results interpretation
4.1 ISM-MICMAC application
The ISM and MICMAC techniques are strong ways to create a hierarchy and reveal contextual interactions between IoT adoption barriers, especially regarding CSC. The principal aim of utilizing MICMAC is to evaluate the importance of dimensions that affect the system. With the use of this methodology, researchers can examine the complex interrelationships and dependencies between different components, identifying important factors that have a major impact on the system as a whole. The ISM-MICMAC technique has two main phases, which have been applied in various settings such as supply chains, industry, and healthcare. A hierarchical structure of chosen IoT adoption barriers is first constructed using ISM. The relative importance and hierarchy of each barrier are then determined by methodically examining cause-and-effect interactions. After the dimensions are established, professionals evaluate the correlations, which results in the development of a binary relation matrix that is then converted into a reachability matrix. The hierarchy of the barriers is displayed in this matrix, highlighting their key and consequential functions within the framework of CSC. The MICMAC technique is used in the next step to further explore the relationships and interactions between the various IoT adoption barriers that have been identified. The emphasis turns to understanding the dynamic behavior of barriers and classifying them according to their reliance and driving force. Finding driving barriers with high influence but low dependence and dependent barriers with high influence but low driving power is made easier using MICMAC analysis. With this categorization, the role of each barrier in the bigger picture and the vital links that exist between them can be better understood.
4.1.1 Structural self‑interaction matrix (SSIM) development
Experts’ judgments on the relationships between 13 identified barriers are used to inform the SSIM’s development, which involves using four symbols to depict these interactions in a pairwise fashion described in subsubsection 3.2.1. In Table 4, SSIM depicts element intrinsic linkages and internal dynamics.
| Sl No. | Barriers | 1 | 2 | 3 | 4 | 5 | 6 | 7 | 8 | 9 | 10 | 11 | 12 | 13 |
|---|---|---|---|---|---|---|---|---|---|---|---|---|---|---|
| 1 | Regularity Compliance | V | V | V | V | V | V | V | V | V | V | V | V | |
| 2 | High implementation cost | A | A | A | A | O | V | A | V | X | A | A | ||
| 3 | Lack of skilled workforce | A | A | V | X | V | X | V | V | O | A | |||
| 4 | Data security and privacy | X | X | X | V | X | V | V | O | A | ||||
| 5 | Technological infrastructure | X | O | V | X | V | V | X | A | |||||
| 6 | Scalability challenges | O | V | X | V | V | X | A | ||||||
| 7 | Cultural and ethical consideration | V | O | V | O | O | A | |||||||
| 8 | Acceptance and adoption | A | X | A | A | A | ||||||||
| 9 | Data Integration and management issue | V | V | X | A | |||||||||
| 10 | Reliability issue | A | A | A | ||||||||||
| 11 | ROI uncertainty | A | A | |||||||||||
| 12 | Extreme environment issue | A | ||||||||||||
| 13 | Cold chain network |
The symbols V, A, X, and O are used to represent the specific sort of connection between the two components being examined. The notation “V” indicates that element will exert influence on element . A: signifies that element will be impacted by element .The symbol “X” denotes a bidirectional link, indicating that elements and will mutually impact each other. There is no relationship or connection between the elements of the symbol “O”.
Table 5 lists IoT adoption barriers using abbreviations for convenience. Each abbreviation provides a concise overview of the main barriers that each one represents. Researchers and stakeholders seeking to overcome and resolve these obstacles in the rapidly evolving field of IoT technology will find the table invaluable.
| Sl no. | Abbreviation | Full form of abbreviation |
|---|---|---|
| 1 | RC | Regularity Compliance |
| 2 | HIC | High implementation cost |
| 3 | LSW | Lack of skilled workforce |
| 4 | DSP | Data security and privacy |
| 5 | TI | Technological infrastructure |
| 6 | SC | Scalability challenges |
| 7 | CEC | Cultural and ethical consideration |
| 8 | AA | Acceptance and adoption |
| 9 | DIM | Data integration and management issue |
| 10 | RI | Reliability issue |
| 11 | ROI | ROI uncertainty |
| 12 | EE | Extreme environment issue |
| 13 | CCN | Cold chain network |
4.1.2 Reachability matrix formation
Four symbols of Table 4 are converted to 0s and 1s to implement SSIM in the first reachability matrix using rules described in subsubsection 3.2.2. A square matrix is prepared in Table 6 with binary values that show whether parts influence one other. The observed barriers are interconnected and have complicated relationships, which may be better understood using the reachability matrix.
| Barriers | RC | HIC | LSW | DSP | TI | SC | CEC | AA | DIM | RI | ROI | EE | CCN |
|---|---|---|---|---|---|---|---|---|---|---|---|---|---|
| RC | 1 | 1 | 1 | 1 | 1 | 1 | 1 | 1 | 1 | 1 | 1 | 1 | 1 |
| HIC | 0 | 1 | 0 | 0 | 0 | 0 | 0 | 1 | 0 | 1 | 1 | 0 | 0 |
| LSW | 0 | 1 | 1 | 0 | 0 | 1 | 1 | 1 | 1 | 1 | 1 | 0 | 0 |
| DSP | 0 | 1 | 1 | 1 | 1 | 1 | 1 | 1 | 1 | 1 | 1 | 0 | 0 |
| TI | 0 | 1 | 1 | 1 | 1 | 1 | 0 | 1 | 1 | 1 | 1 | 1 | 0 |
| SC | 0 | 1 | 0 | 1 | 1 | 1 | 0 | 1 | 1 | 1 | 1 | 1 | 0 |
| CEC | 0 | 0 | 1 | 1 | 0 | 0 | 1 | 1 | 0 | 1 | 0 | 0 | 0 |
| AA | 0 | 0 | 0 | 0 | 0 | 0 | 0 | 1 | 0 | 1 | 0 | 0 | 0 |
| DIM | 0 | 1 | 1 | 1 | 1 | 1 | 0 | 1 | 1 | 1 | 1 | 1 | 0 |
| RI | 0 | 0 | 0 | 0 | 0 | 0 | 0 | 1 | 0 | 1 | 0 | 0 | 0 |
| ROI | 0 | 1 | 0 | 0 | 0 | 0 | 0 | 1 | 0 | 1 | 1 | 0 | 0 |
| EE | 0 | 1 | 0 | 0 | 1 | 1 | 0 | 1 | 1 | 1 | 1 | 1 | 0 |
| CCN | 0 | 1 | 1 | 1 | 1 | 1 | 1 | 1 | 1 | 1 | 1 | 1 | 1 |
4.1.3 Final reachability matrix formation
Transitivity is used to create the final reachability matrix in Table 7. Following the completion of the ISM technique’s analytical phase, the final reachability matrix is produced, which contains the discovered hierarchical linkages among system parts. The final reachability matrix determines the “driving and dependency power”, providing insight into the system’s dynamics. Analyzing “driving and dependency power,” Table 7 classifies parameters into “dependent, autonomous, linkage, and independent” categories. The barriers that display significant driving force and dependence are categorized as belonging to the linking group; none of them are classed as autonomous, non-dependent, or dependent.
| Barriers | RC | HIC | LSW | DSP | TI | SC | CEC | AA | DIM | RI | ROI | EE | CCN | Driving Power |
|---|---|---|---|---|---|---|---|---|---|---|---|---|---|---|
| RC | 1 | 1 | 1 | 1 | 1 | 1 | 1 | 1 | 1 | 1 | 1 | 1 | 1 | 13 |
| HIC | 0 | 1 | 0 | 0 | 0 | 0 | 0 | 1 | 0 | 1 | 1 | 0 | 0 | 4 |
| LSW | 0 | 1 | 1 | 1* | 1* | 1 | 1 | 1 | 1 | 1 | 1 | 1* | 0 | 11 |
| DSP | 0 | 1 | 1 | 1 | 1 | 1 | 1 | 1 | 1 | 1 | 1 | 1* | 0 | 11 |
| TI | 0 | 1 | 1 | 1 | 1 | 1 | 1* | 1 | 1 | 1 | 1 | 1 | 0 | 11 |
| SC | 0 | 1 | 1* | 1 | 1 | 1 | 1* | 1 | 1 | 1 | 1 | 1 | 0 | 11 |
| CEC | 0 | 1* | 1 | 1 | 1* | 1* | 1 | 1 | 1* | 1 | 1* | 1* | 0 | 11 |
| AA | 0 | 0 | 0 | 0 | 0 | 0 | 0 | 1 | 0 | 1 | 0 | 0 | 0 | 2 |
| DIM | 0 | 1 | 1 | 1 | 1 | 1 | 1* | 1 | 1 | 1 | 1 | 1 | 0 | 11 |
| RI | 0 | 0 | 0 | 0 | 0 | 0 | 0 | 1 | 0 | 1 | 0 | 0 | 0 | 2 |
| ROI | 0 | 1 | 0 | 0 | 0 | 0 | 0 | 1 | 0 | 1 | 1 | 0 | 0 | 4 |
| EE | 0 | 1 | 1* | 1* | 1 | 1 | 1* | 1 | 1 | 1 | 1 | 1 | 0 | 11 |
| CCN | 0 | 1 | 1 | 1 | 1 | 1 | 1 | 1 | 1 | 1 | 1 | 1 | 1 | 12 |
| Dependence Power | 1 | 11 | 9 | 9 | 9 | 9 | 9 | 13 | 9 | 13 | 11 | 9 | 2 |
4.1.4 Level partition
Barriers are broken down into three distinct sets: the reachability set, which contains the factor and all other factors it influences; the antecedent set, which contains the factor and all other factors that influence it; and the intersubsection set, which contains all factors in both of these sets.
Table 8 provides an overview of the final reachability matrix’s detailed reachability set, antecedent set, and inter subsection set of IoT implementation barrier in the CSC. All barriers have been categorized into levels.
| Elements | Reachability Set | Antecedent Set | Intersection Set | Level |
|---|---|---|---|---|
| 1 | 1 | 1 | 1 | 5 |
| 2 | 2, 11 | 1, 2, 3, 4, 5, 6, 7, 9, 11, 12, 13 | 2, 11 | 2 |
| 3 | 3, 4, 5, 6, 7, 9, 12 | 1, 3, 4, 5, 6, 7, 9, 12, 13 | 3, 4, 5, 6, 7, 9, 12 | 3 |
| 4 | 3, 4, 5, 6, 7, 9, 12 | 1, 3, 4, 5, 6, 7, 9, 12, 13 | 3, 4, 5, 6, 7, 9, 12 | 3 |
| 5 | 3, 4, 5, 6, 7, 9, 12 | 1, 3, 4, 5, 6, 7, 9, 12, 13 | 3, 4, 5, 6, 7, 9, 12 | 3 |
| 6 | 3, 4, 5, 6, 7, 9, 12 | 1, 3, 4, 5, 6, 7, 9, 12, 13 | 3, 4, 5, 6, 7, 9, 12 | 3 |
| 7 | 3, 4, 5, 6, 7, 9, 12 | 1, 3, 4, 5, 6, 7, 9, 12, 13 | 3, 4, 5, 6, 7, 9, 12 | 3 |
| 8 | 8, 10 | 1, 2, 3, 4, 5, 6, 7, 8, 9, 10, 11, 12, 13 | 8, 10 | 1 |
| 9 | 3, 4, 5, 6, 7, 9, 12 | 1, 3, 4, 5, 6, 7, 9, 12, 13 | 3, 4, 5, 6, 7, 9, 12 | 3 |
| 10 | 8, 10 | 1, 2, 3, 4, 5, 6, 7, 8, 9, 10, 11, 12, 13 | 8, 10 | 1 |
| 11 | 2, 11 | 1, 2, 3, 4, 5, 6, 7, 9, 11, 12, 13 | 2, 11 | 2 |
| 12 | 3, 4, 5, 6, 7, 9, 12 | 1, 3, 4, 5, 6, 7, 9, 12, 13 | 3, 4, 5, 6, 7, 9, 12 | 3 |
| 13 | 13 | 1, 13 | 13 | 4 |
4.1.5 Conical matrix
The conical matrix in Table 9 displays transitivity interactions between adoption barriers. Identifying indirect linkages between components shows the domino impact of system effects. A more complete picture of the system’s dynamics and structure is achieved with the use of this matrix, which assists in understanding the wider effect of changing one element on other elements. The conical shape of the final reachability matrix is devised in Figure 3.
| Variables | 8 | 10 | 2 | 11 | 3 | 4 | 5 | 6 | 7 | 9 | 12 | 13 | 1 | Driving Power | Level |
| 8 | 1 | 1 | 0 | 0 | 0 | 0 | 0 | 0 | 0 | 0 | 0 | 0 | 0 | 2 | 1 |
| 10 | 1 | 1 | 0 | 0 | 0 | 0 | 0 | 0 | 0 | 0 | 0 | 0 | 0 | 2 | 1 |
| 2 | 1 | 1 | 1 | 1 | 0 | 0 | 0 | 0 | 0 | 0 | 0 | 0 | 0 | 4 | 2 |
| 11 | 1 | 1 | 1 | 1 | 0 | 0 | 0 | 0 | 0 | 0 | 0 | 0 | 0 | 4 | 2 |
| 3 | 1 | 1 | 1 | 1 | 1 | 1* | 1* | 1 | 1 | 1 | 1* | 0 | 0 | 11 | 3 |
| 4 | 1 | 1 | 1 | 1 | 1 | 1 | 1 | 1 | 1 | 1 | 1* | 0 | 0 | 11 | 3 |
| 5 | 1 | 1 | 1 | 1 | 1 | 1 | 1 | 1 | 1* | 1 | 1 | 0 | 0 | 11 | 3 |
| 6 | 1 | 1 | 1 | 1 | 1* | 1 | 1 | 1 | 1* | 1 | 1 | 0 | 0 | 11 | 3 |
| 7 | 1 | 1 | 1* | 1* | 1 | 1 | 1* | 1* | 1 | 1* | 1* | 0 | 0 | 11 | 3 |
| 9 | 1 | 1 | 1 | 1 | 1 | 1 | 1 | 1 | 1* | 1 | 1 | 0 | 0 | 11 | 3 |
| 12 | 1 | 1 | 1 | 1 | 1* | 1* | 1 | 1 | 1* | 1 | 1 | 0 | 0 | 11 | 3 |
| 13 | 1 | 1 | 1 | 1 | 1 | 1 | 1 | 1 | 1 | 1 | 1 | 1 | 0 | 12 | 4 |
| 1 | 1 | 1 | 1 | 1 | 1 | 1 | 1 | 1 | 1 | 1 | 1 | 1 | 1 | 13 | 5 |
| Dependence Power | 13 | 13 | 11 | 11 | 9 | 9 | 9 | 9 | 9 | 9 | 9 | 2 | 1 | ||
| Level | 1 | 1 | 2 | 2 | 3 | 3 | 3 | 3 | 3 | 3 | 3 | 4 | 5 |
The hierarchical relationships among different system parts are better understood using a conical matrix (Table 9), which is a tool for creating conical structures. This conical form clarifies the system’s architecture by visually depicting the hierarchical connections.
4.1.6 MICMAC analysis
MICMAC analysis is a useful tool for determining the drive and dependence power of barriers. This analysis is conducted with the use of barriers in order to divide the structure into separate groups.
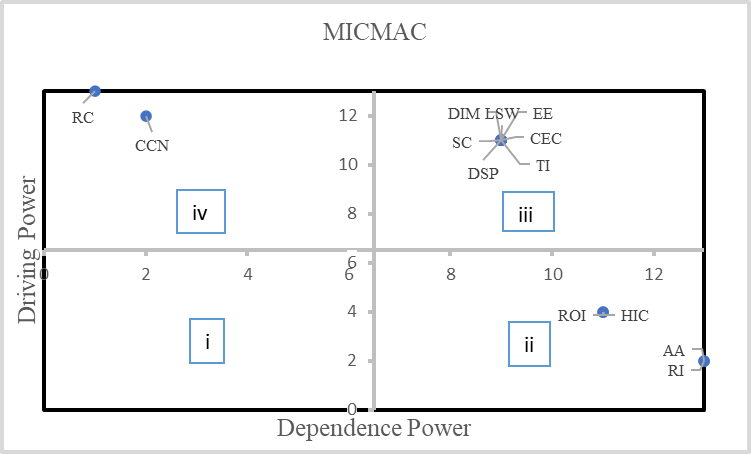
There are four distinct categories of barriers described in Fig 4:
Autonomous barriers: These barriers are located in the first quadrant. They aren’t very strong at either driving or being dependent.
Dependent barriers: These barriers are shown inside Quadrant-II. The driving power of the subject is weak, whereas their dependence power is strong.
Linkage barriers: These are inside Quadrant-III and exhibit strong driving and dependent power. In general, the instability of these barriers arises from the interconnectedness of their actions since any action done on one barrier might have consequences on others and could affect the barrier itself.
Independent barriers: These are shown in Quadrant-IV and exhibit strong driving power but weak dependence power.
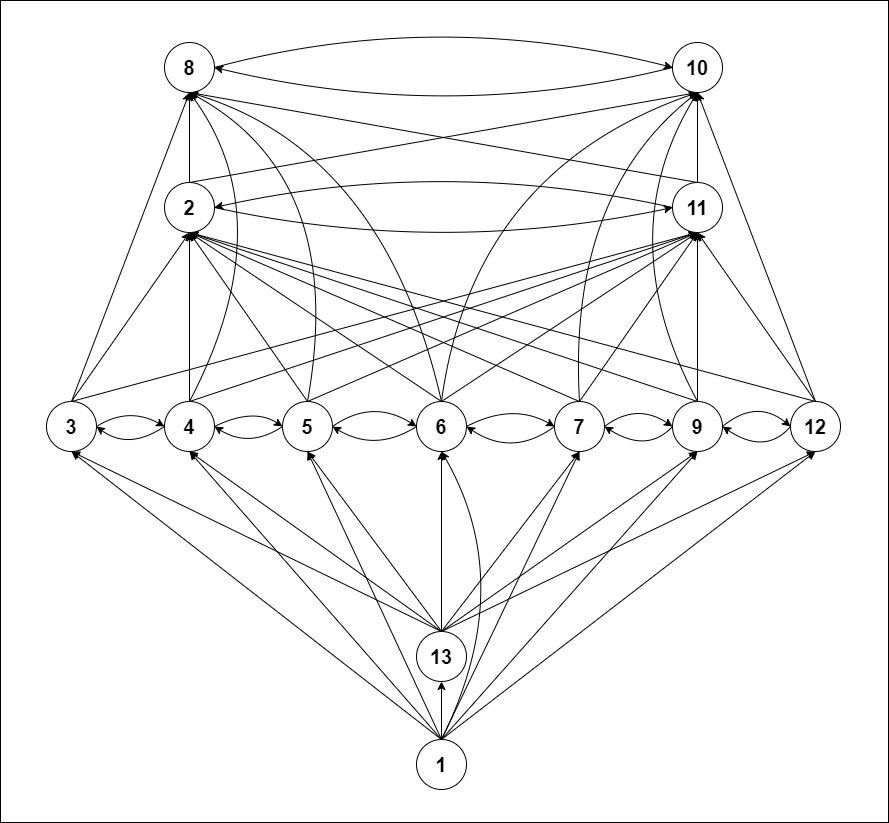
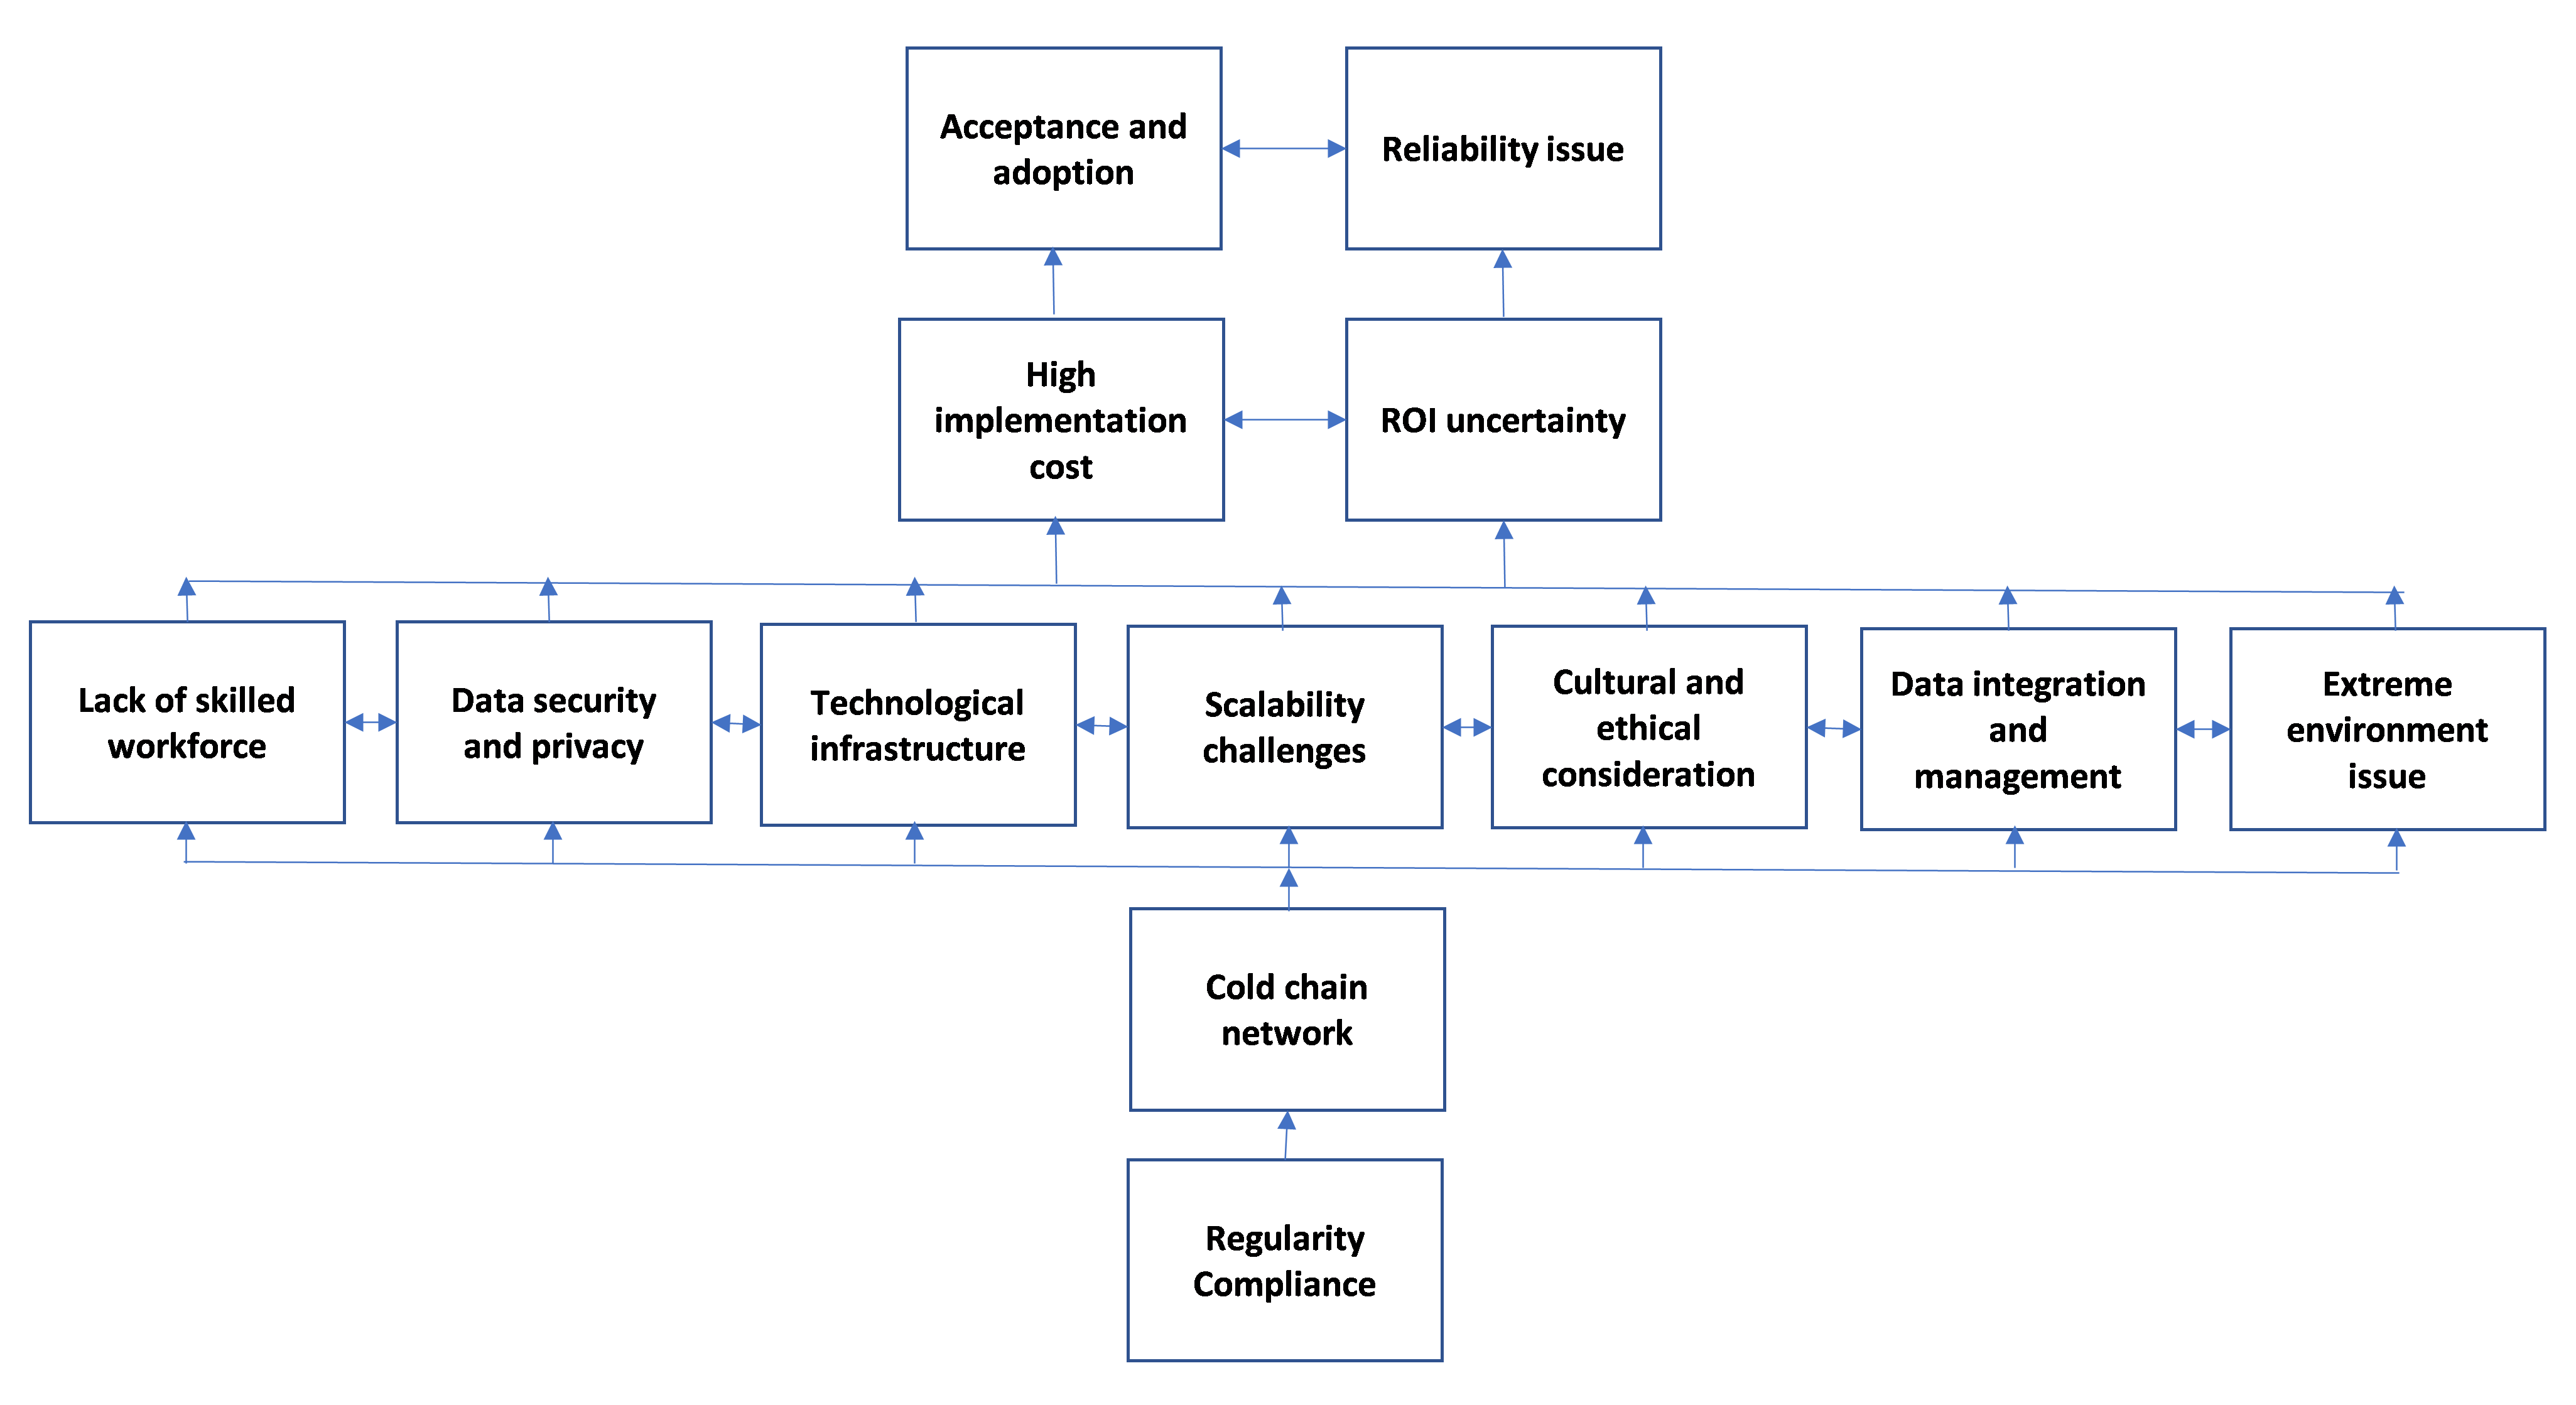
4.1.7 ISM model
This digraph of Fig 5 shows the barriers to preventing IoT adoption. It was made to identify the hierarchy levels associated with implementing IoT in cold SC. The conceptual coherence of the ISM model produced is checked, and any required adjustments are made.
4.2 DEMATEL application
4.2.1 Average matrix formation
Each expert on the panel filled out a survey with an integer value between 0 and 4 to indicate the level of impact they noticed between every given pair of obstacles. Using the matrix format of the survey data, an average matrix is determined using Equation 1 in Table 10.
| RC | HIC | LSW | DSP | TI | SC | CEC | AA | DIM | RI | ROI | EE | CCN | |
|---|---|---|---|---|---|---|---|---|---|---|---|---|---|
| RC | 0.000 | 2.250 | 2.417 | 3.750 | 2.583 | 1.750 | 1.583 | 3.417 | 2.000 | 2.750 | 3.583 | 2.500 | 1.750 |
| HIC | 0.167 | 0.000 | 0.750 | 0.750 | 0.333 | 0.250 | 0.333 | 2.417 | 0.417 | 3.500 | 3.583 | 0.333 | 1.000 |
| LSW | 0.167 | 2.333 | 0.000 | 0.167 | 0.833 | 3.500 | 1.750 | 2.833 | 3.500 | 3.500 | 1.833 | 1.083 | 1.167 |
| DSP | 0.167 | 3.500 | 1.917 | 0.000 | 3.000 | 1.833 | 3.583 | 2.083 | 2.000 | 2.583 | 0.583 | 0.167 | 1.750 |
| TI | 0.167 | 2.000 | 1.250 | 2.833 | 0.000 | 1.833 | 0.417 | 1.750 | 3.667 | 3.000 | 2.000 | 3.083 | 0.917 |
| SC | 0.167 | 2.917 | 1.083 | 1.333 | 1.833 | 0.000 | 1.000 | 3.083 | 3.167 | 3.250 | 2.000 | 1.667 | 0.667 |
| CEC | 1.000 | 0.417 | 2.917 | 3.333 | 0.250 | 1.000 | 0.000 | 3.750 | 0.083 | 2.833 | 0.917 | 0.250 | 0.250 |
| AA | 0.333 | 0.750 | 1.167 | 1.250 | 0.417 | 0.417 | 2.250 | 0.000 | 0.083 | 2.000 | 1.167 | 0.167 | 0.083 |
| DIM | 0.250 | 3.000 | 2.333 | 3.167 | 3.583 | 3.250 | 0.000 | 1.750 | 0.000 | 2.833 | 2.083 | 1.000 | 1.500 |
| RI | 0.000 | 0.333 | 0.333 | 0.250 | 0.333 | 0.500 | 1.000 | 2.167 | 0.250 | 0.000 | 0.333 | 1.083 | 0.250 |
| ROI | 0.000 | 3.333 | 1.250 | 0.083 | 0.667 | 1.167 | 1.000 | 3.000 | 0.167 | 2.167 | 0.000 | 2.000 | 0.750 |
| EE | 0.000 | 3.083 | 0.667 | 0.250 | 2.917 | 2.000 | 0.083 | 2.500 | 0.750 | 1.917 | 2.167 | 0.000 | 0.333 |
| CCN | 0.083 | 3.250 | 1.917 | 2.083 | 3.083 | 3.000 | 2.583 | 1.750 | 2.833 | 2.000 | 2.917 | 2.917 | 0.000 |
4.2.2 Normalized direct relation matrix formation
Using Equation 2, the normalized direct relation matrix is formulated from the average matrix in Table 11. Maximum summation is 32.333, which functions as a divisor, and every cell value from the average matrix is divided by this value.
| RC | HIC | LSW | DSP | TI | SC | CEC | AA | DIM | RI | ROI | EE | CCN | |
|---|---|---|---|---|---|---|---|---|---|---|---|---|---|
| RC | 0.000 | 0.070 | 0.075 | 0.116 | 0.080 | 0.054 | 0.049 | 0.106 | 0.062 | 0.085 | 0.111 | 0.077 | 0.054 |
| HIC | 0.005 | 0.000 | 0.023 | 0.023 | 0.010 | 0.008 | 0.010 | 0.075 | 0.013 | 0.108 | 0.111 | 0.010 | 0.031 |
| LSW | 0.005 | 0.072 | 0.000 | 0.005 | 0.026 | 0.108 | 0.054 | 0.088 | 0.108 | 0.108 | 0.057 | 0.034 | 0.036 |
| DSP | 0.005 | 0.108 | 0.059 | 0.000 | 0.093 | 0.057 | 0.111 | 0.064 | 0.062 | 0.080 | 0.018 | 0.005 | 0.054 |
| TI | 0.005 | 0.062 | 0.039 | 0.088 | 0.000 | 0.057 | 0.013 | 0.054 | 0.113 | 0.093 | 0.062 | 0.095 | 0.028 |
| SC | 0.005 | 0.090 | 0.034 | 0.041 | 0.057 | 0.000 | 0.031 | 0.095 | 0.098 | 0.101 | 0.062 | 0.052 | 0.021 |
| CEC | 0.031 | 0.013 | 0.090 | 0.103 | 0.008 | 0.031 | 0.000 | 0.116 | 0.003 | 0.088 | 0.028 | 0.008 | 0.008 |
| AA | 0.010 | 0.023 | 0.036 | 0.039 | 0.013 | 0.013 | 0.070 | 0.000 | 0.003 | 0.062 | 0.036 | 0.005 | 0.003 |
| DIM | 0.008 | 0.093 | 0.072 | 0.098 | 0.111 | 0.101 | 0.000 | 0.054 | 0.000 | 0.088 | 0.064 | 0.031 | 0.046 |
| RI | 0.000 | 0.010 | 0.010 | 0.008 | 0.010 | 0.015 | 0.031 | 0.067 | 0.008 | 0.000 | 0.010 | 0.034 | 0.008 |
| ROI | 0.000 | 0.103 | 0.039 | 0.003 | 0.021 | 0.036 | 0.031 | 0.093 | 0.005 | 0.067 | 0.000 | 0.062 | 0.023 |
| EE | 0.000 | 0.095 | 0.021 | 0.008 | 0.090 | 0.062 | 0.003 | 0.077 | 0.023 | 0.059 | 0.067 | 0.000 | 0.010 |
| CCN | 0.003 | 0.101 | 0.059 | 0.064 | 0.095 | 0.093 | 0.080 | 0.054 | 0.088 | 0.062 | 0.090 | 0.090 | 0.000 |
4.2.3 Total relation matrix formation
The total relation matrix is formulated using Equation 3 in Table 12. The values in the matrix indicate the degree of relation between pairs of factors. A higher value suggests a stronger relationship.
| RC | HIC | LSW | DSP | TI | SC | CEC | AA | DIM | RI | ROI | EE | CCN | ||
|---|---|---|---|---|---|---|---|---|---|---|---|---|---|---|
| RC | 0.012 | 0.193 | 0.152 | 0.189 | 0.162 | 0.143 | 0.126 | 0.243 | 0.142 | 0.235 | 0.207 | 0.145 | 0.100 | 2.050 |
| HIC | 0.009 | 0.048 | 0.053 | 0.049 | 0.039 | 0.041 | 0.044 | 0.130 | 0.039 | 0.162 | 0.143 | 0.040 | 0.047 | 0.843 |
| LSW | 0.014 | 0.155 | 0.058 | 0.065 | 0.085 | 0.166 | 0.102 | 0.187 | 0.158 | 0.214 | 0.129 | 0.083 | 0.067 | 1.485 |
| DSP | 0.016 | 0.190 | 0.121 | 0.068 | 0.147 | 0.122 | 0.162 | 0.172 | 0.123 | 0.197 | 0.098 | 0.060 | 0.087 | 1.565 |
| TI | 0.013 | 0.157 | 0.097 | 0.141 | 0.070 | 0.125 | 0.068 | 0.158 | 0.168 | 0.204 | 0.137 | 0.143 | 0.065 | 1.546 |
| SC | 0.014 | 0.169 | 0.087 | 0.095 | 0.112 | 0.061 | 0.080 | 0.188 | 0.145 | 0.203 | 0.131 | 0.097 | 0.053 | 1.436 |
| CEC | 0.037 | 0.077 | 0.130 | 0.139 | 0.051 | 0.078 | 0.052 | 0.188 | 0.048 | 0.167 | 0.078 | 0.042 | 0.034 | 1.121 |
| AA | 0.015 | 0.058 | 0.062 | 0.063 | 0.035 | 0.040 | 0.093 | 0.050 | 0.026 | 0.109 | 0.064 | 0.026 | 0.017 | 0.660 |
| DIM | 0.017 | 0.193 | 0.132 | 0.156 | 0.175 | 0.170 | 0.065 | 0.169 | 0.077 | 0.214 | 0.148 | 0.093 | 0.085 | 1.694 |
| RI | 0.003 | 0.034 | 0.028 | 0.025 | 0.026 | 0.033 | 0.047 | 0.095 | 0.022 | 0.032 | 0.031 | 0.045 | 0.016 | 0.438 |
| ROI | 0.006 | 0.149 | 0.071 | 0.035 | 0.053 | 0.071 | 0.063 | 0.155 | 0.038 | 0.136 | 0.050 | 0.089 | 0.041 | 0.959 |
| EE | 0.006 | 0.153 | 0.058 | 0.047 | 0.124 | 0.101 | 0.039 | 0.147 | 0.065 | 0.139 | 0.120 | 0.039 | 0.034 | 1.070 |
| CCN | 0.015 | 0.214 | 0.132 | 0.138 | 0.170 | 0.173 | 0.142 | 0.188 | 0.161 | 0.207 | 0.184 | 0.153 | 0.045 | 1.922 |
| 0.178 | 1.790 | 1.180 | 1.212 | 1.249 | 1.325 | 1.082 | 2.071 | 1.211 | 2.219 | 1.522 | 1.055 | 0.691 |
4.2.4 Identification of cause and effect
Table 13 provides information on the degree of influence of various factors related to IoT adoption in cold SC barriers. Each row represents a specific factor, while each column provides different metrics or totals. Row total and column total are calculated using Equation 4 and Equation 5. Causes have values greater than 0, whereas effects have smaller values.
| IoT implementation in cold SC barriers | Row Total | Column Total | Identify | ||
|---|---|---|---|---|---|
| Regularity Compliance | 2.050 | 0.178 | 2.228 | 1.872 | Cause |
| High implementation cost | 0.843 | 1.790 | 2.633 | -0.947 | Effect |
| Lack of skilled workforce | 1.485 | 1.180 | 2.665 | 0.304 | Cause |
| Data security and privacy | 1.565 | 1.212 | 2.776 | 0.353 | Cause |
| Technological infrastructure | 1.546 | 1.249 | 2.795 | 0.297 | Cause |
| Scalability | 1.436 | 1.325 | 2.761 | 0.110 | Cause |
| Cultural and ethical consideration | 1.121 | 1.082 | 2.203 | 0.039 | Cause |
| Acceptance and adoption | 0.660 | 2.071 | 2.731 | -1.412 | Effect |
| Data integration and management issue | 1.694 | 1.211 | 2.905 | 0.482 | Cause |
| Reliability issue | 0.438 | 2.219 | 2.657 | -1.781 | Effect |
| ROI uncertainty | 0.959 | 1.522 | 2.481 | -0.563 | Effect |
| Extreme environment issue | 1.070 | 1.055 | 2.125 | 0.015 | Cause |
| Cold chain network | 1.922 | 0.691 | 2.613 | 1.231 | Cause |
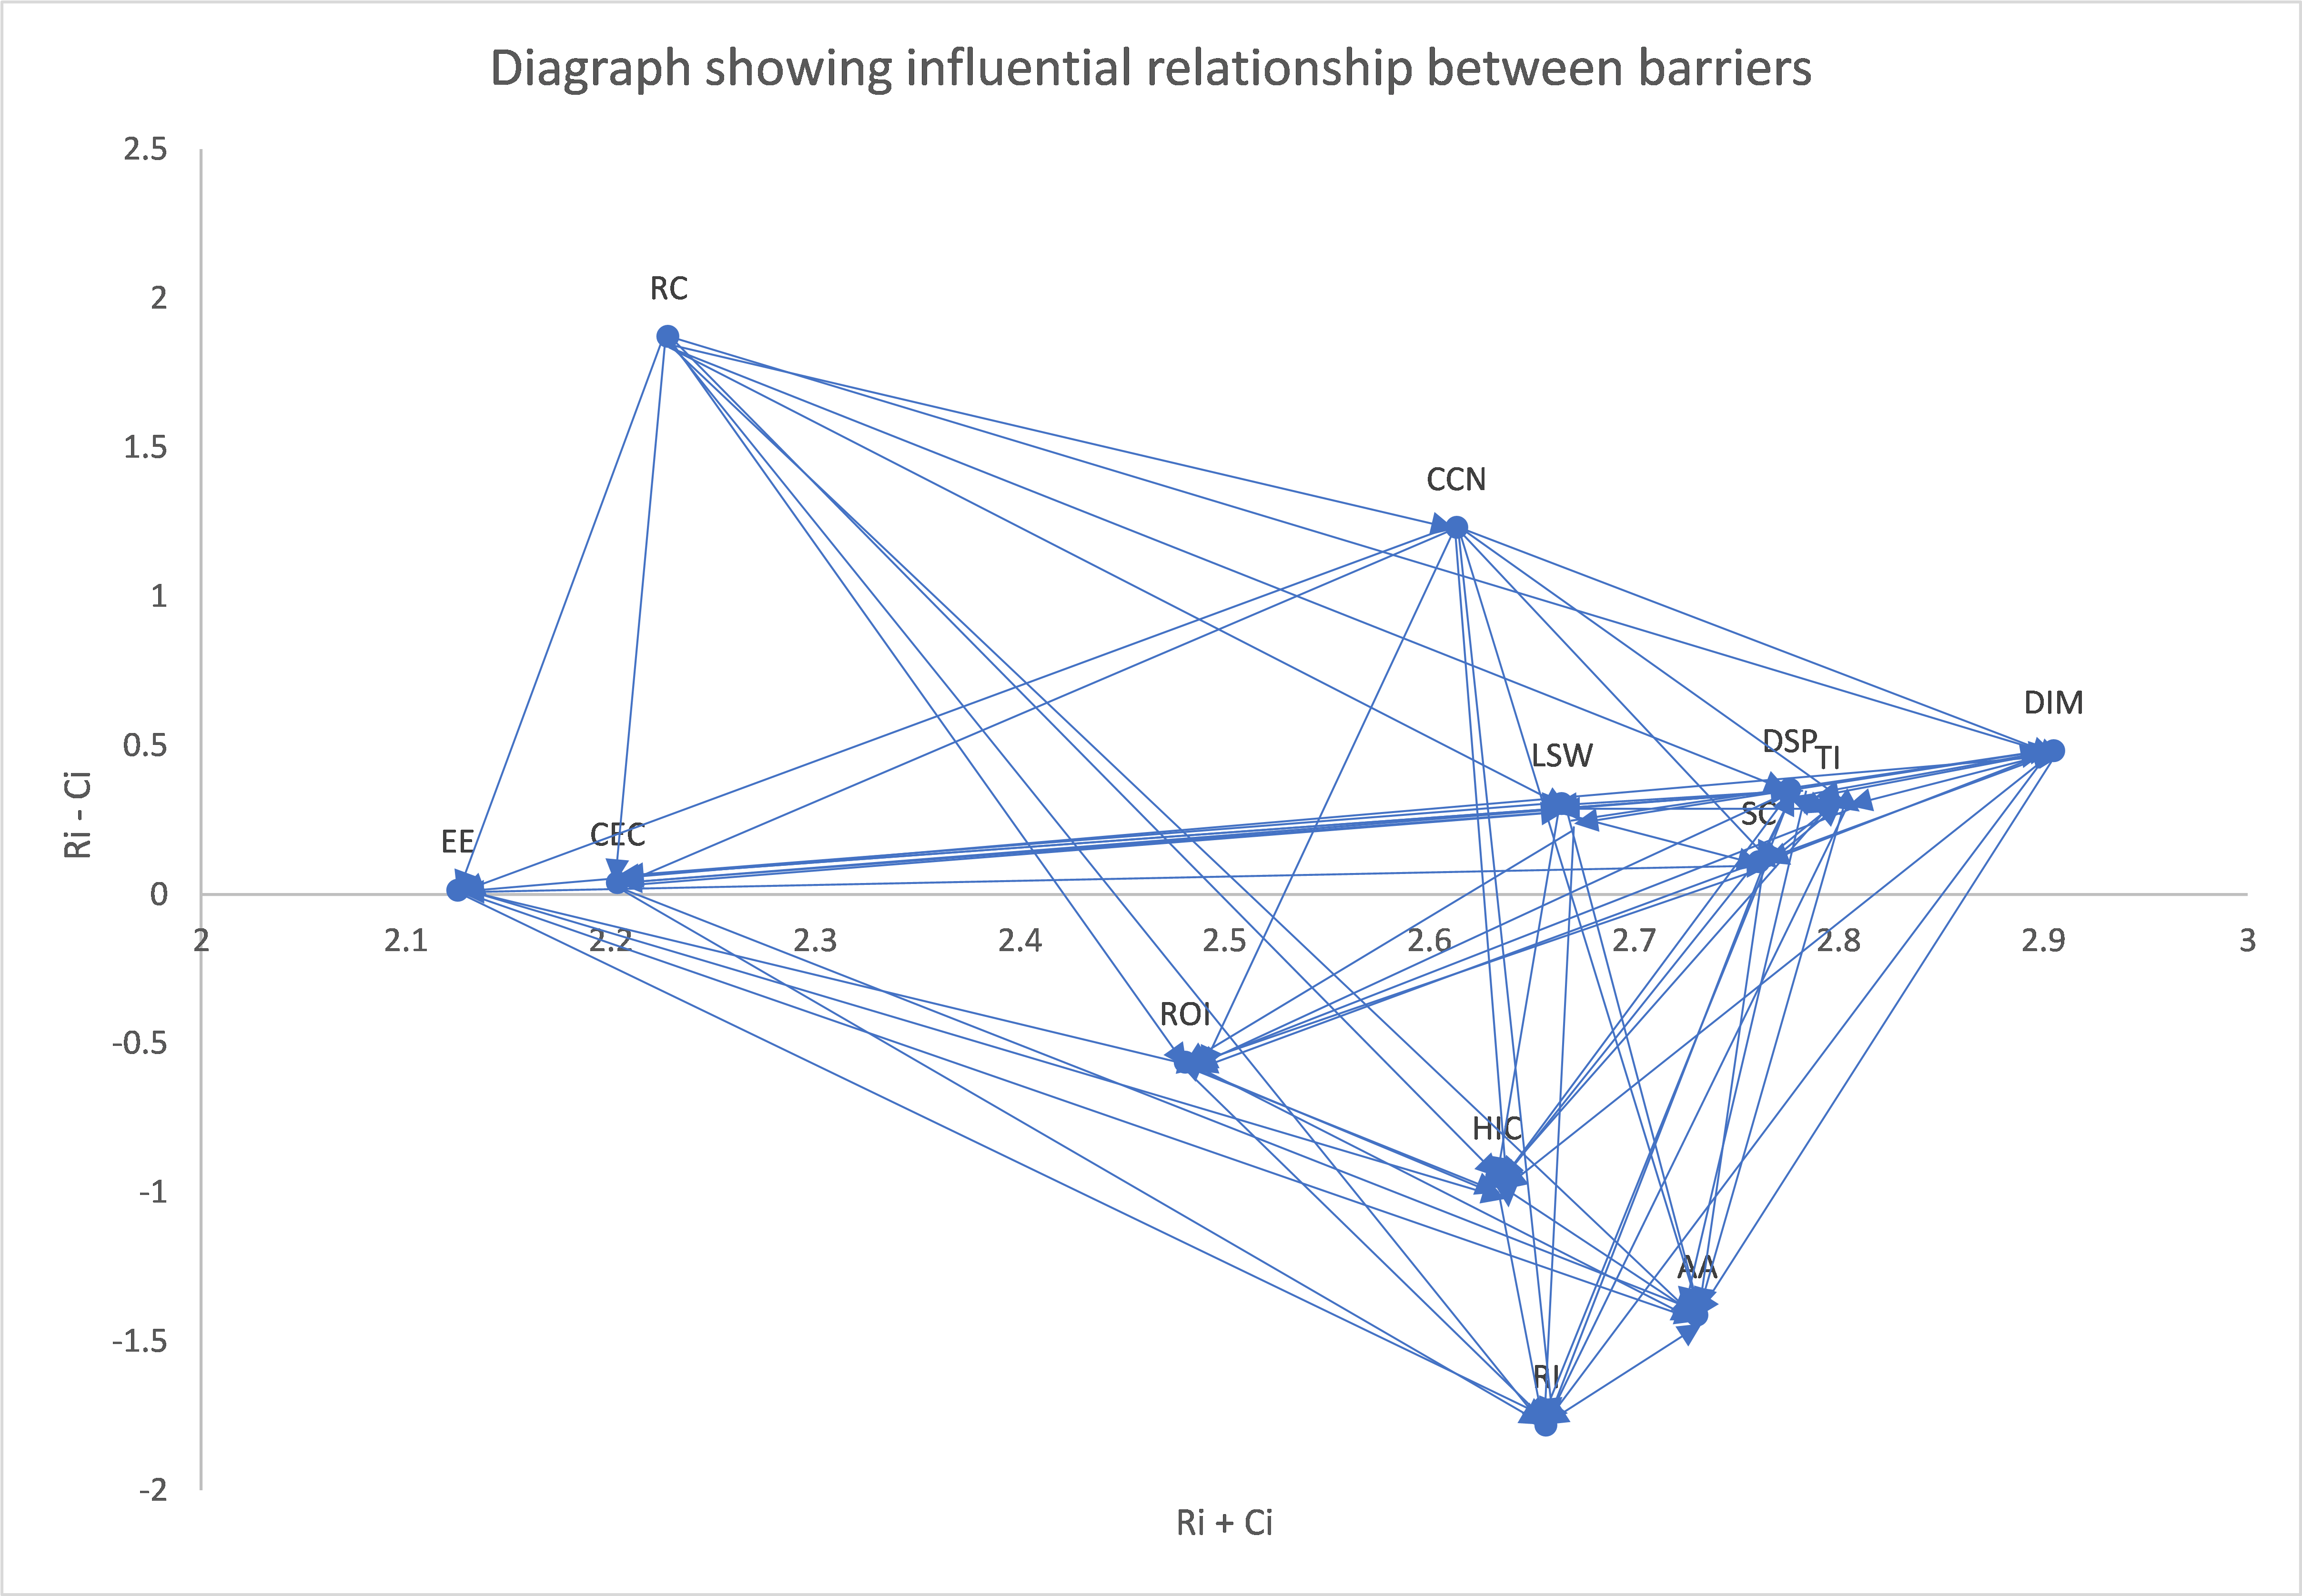
4.2.5 Developing interrelationship map
A digraph illustrating the influential relationship between the barriers is shown in Fig 6. The threshold value calculated using Equation 6 is 0.099. Once the threshold value has been determined, the interrelationship map is produced. In this map, values above the threshold reflect the influence of barrier on barrier . In contrast, when the value is lower than the threshold value, barrier is influenced by barrier . The arrows serve to demonstrate the influence, demonstrating the important link among barriers. Values that are positioned above the neutral horizontal line are categorized as belonging to the cause group, while values that are positioned below the neutral horizontal line are categorized as belonging to the effect group.
4.2.6 Developing final ranking of attributes
DIM TI DSP SC AA LSW RI HIC CCN ROI RC CEC EE
Where Full form of these abbreviations described in Table 5.
5 Discussions
The numerous and interconnected barriers to extensive IoT implementation in the cold SC are analyzed in this thesis. The data from the survey was double-checked to make sure it was accurate. The Cronbach’s alpha test is used to ensure that survey results are acceptable and valid. Reliable measurement is ensured by this coefficient, which evaluates the internal consistency of the survey questions. After it has been confirmed that the alpha value is above the acceptable range, the subsequent stage of the process is initiated.
In order to ascertain, The ISM-MICMAC-DEMATEL method is constructed to determine important barriers; this section is divided into three subsections: subsection 4.1 for ISM, subsection 4.1.6 for MICMAC and the other subsection 4.2 for DEMATEL.
The ISM model was created to determine the hierarchy levels of IoTBs so CSC practitioners could see their dependence links and focus on the biggest adoption barriers to IoT deployment. This research identified five hierarchical layers to explain the linkages among chosen IoTBs. The implementation barrier at higher levels exhibits a greater susceptibility to the effect of other factors, whilst components situated at lower levels strongly influence other factors.
Variables that are classified as high levels, namely Levels 1 and 2, are prone to being influenced by other variables. We identified acceptance, adoption, and reliability issues at the top of the hierarchy, driven by the four hierarchies below it. At the second level, we identified two barriers: high implementation cost and ROI uncertainty, caused by three hierarchical layers below it. On the third tier, there are six interconnected barriers that have mutual effects. These barriers are a lack of skilled workforce, data security and privacy, technological infrastructure, scalability challenges, cultural and ethical considerations, data integration and management, and extreme environment. Conversely, components categorized as low levels, namely Levels 4 and 5, can influence other factors more. IoT adoption barriers in level 4 are cold chain networks and level 5 is regulatory compliance. These factors serve as the foundational elements within the broader network of relationships.
From MICMAC analysis, independent barriers are cold chain network and regulatory compliance; dependent barriers are ROI uncertainty and high implementation cost. The other seven are linkage barriers, and no autonomous barriers exist. Among the many forms of barriers, linkage, and independent barriers exhibit significant driving forces, making them crucial barriers.
The interdependence of barriers is depicted on the interrelationship map. Regularity compliance, lack of skilled workforce, data security and privacy, technological infrastructure, scalability challenges, cultural and ethical considerations, data integration and management issues, extreme environment issues, and cold chain networks are in the cause group. High implementation cost, acceptance and adoption, reliability issues, and ROI uncertainty are in the effect group. The regularity compliance and cold chain network have been identified as the most important causes, respectively, with respective values of 1.8719 and 1.2308. These two barriers drive more in the larger context. Thus, improving its performance may promote system development. Reliability issues, acceptance and adoption, and high implementation costs are the most important effects influenced by other barriers. These effects have been quantified with values of -1.7808, -1.4118, and -94707, respectively. In accordance with the final ranking of attributes, the most important criteria are technological infrastructure, data security and privacy, and data integration and management. The criterion of extreme environment is of the least importance.
5.1 Managerial and practical implications
Given that the implementation of the IoT is in its early stages, the results presented in this paper offer valuable guidance for practitioners. The study has revealed several implications for both managerial and practical considerations, providing insights that can inform decision-making in this evolving field.
-
•
This article guides innovative supply chain methods that use new technologies like IoT. This study helps provide crucial barriers to understanding supply chain strategies by considering IoT while creating a coordinating system. Managers may also learn about the most prevalent IoT technological difficulties. With additional insight, managers can quickly improve processes and fix issues, making decisions more informed.
-
•
This research helps CSC managers plan IoT programs to protect perishable goods from packaging and processing to storage, transportation, and distribution by providing precise temperature and humidity data with a data integration system. IoT sensors may warn of temperature changes or equipment breakdown. Managers schedule proactive maintenance to prevent breakdowns and product spoilage. High-quality goods and adequate regulation may profit from this research.
-
•
The study promotes new efforts to provide supply chain stakeholders with a single platform to exchange information to establish a strong system. This study’s focus on efficient information transmission made the cold SC more trustworthy. IoT devices collect enough data for managers to see patterns and trends. Analytics may optimize processes, routes, and resource use.
-
•
This research suggests that IoT technology might enhance cold SC product quality, customer demands, and services. If it uses this study well, management may replace conventional supply chain linkages with real-time data interchange via radio frequency identification tags, readers, and other embedded electronic devices.
-
•
The findings of this paper can convince managerial staff to invest in GPS, RFID tags and readers, and other monitoring technologies. Managers will hire suitable candidates to maximize IoT technology use using this knowledge. The conclusions of this research may also motivate higher management to expand staff training and development.
5.2 Unique theoretical contribution
In order to guarantee a long-term, IoT-based CSC system, this study examined the challenges associated with using IoT in CSC. Thirteen obstacles were identified with the assistance of the stakeholders. According to the results of this research, various stakeholders in CSC need distinct responses. Since the transport management system (TMS) is the most influential party, it follows that TMS should take the initiative and rely on policies to guide its actions. These stakeholders are the ones who initiate the HIC, TI, SC, DIM, EE, and CCN barriers.
Additionally, any and all obstacles may serve as a roadmap for different groups of people engaged in logistics, product processing, quality inspection, and secure packaging. To sum up the theoretical contribution, this study found two kinds of barriers—cause and effect—based on stakeholder theory that prevents the implementation of IoT in CSC systems. The specific barriers to the effective deployment of IoT in the CSC may be better understood by exploring each of these categories. Combine insights from the fields of management, engineering, logistics, and information systems into a comprehensive plan. This approach facilitates the identification of problems as a whole and the development of comprehensive solutions. This paper also used a socio-technical systems approach to examine the social-technical interactions inside the CSC. Human traits, organizational culture, and socioeconomic context influence the process of identifying and removing barriers. This model demonstrated how obstacles in one part of a system may affect other parts of the system and how the removal of certain obstacles can cause other benefits to trickle down.
6 Conclusions and future works
The primary purpose of this research was to identify and examine the barriers hindering IoT implementation in the cold SC. Our research sought to identify and examine the barriers preventing the IoT from being widely used. As a result of the IoT’s infancy, CSC partners are unaware of its technological requirements and the benefits that accompany them; consequently, they are hesitant to implement it. Significant findings and insights were derived from the ISM-MICMAC-DEMATEL analysis, which clarified the connection between implementation barriers and their effect on CSC. ISM provides hierarchical linkages, but the impact of IoTBs on each other is not quantified. The DEMATEL method was employed to identify the most crucial IoTBs and overcome ISM’s limitations. DEMATEL prioritizes the interactions between the selected barriers more than ISM does. According to the research results, there are two primary factors that practitioners in the field of CSCs should focus on: regularity compliance and cold chain networks. The thesis serves as a catalyst for advancement by focusing on the barriers hindering development. With MICMAC’s element classification based on driving and dependence powers, interconnections inside a complicated system may be fully understood, and decisions can be made more effectively. Practitioners must give special attention to the highlighted barriers to IoT adoption. Hence, the thesis highlights the present barriers and provides the groundwork for future developments that might revolutionize the use of the IoT in the cold SC.
While our research has shed light on significant insights into IoT implementation barriers within CSCs, it is imperative to acknowledge certain limitations and outline avenues for future exploration. Our primary constraint lies in the indirect nature of our investigation, as we couldn’t directly observe industry-specific barriers. Instead, we thoroughly examined existing IoT studies in CSCs. Another limitation of this research is the lack of digital archives like Scopus and the ACM Digital Library in the systematic literature review. However, we selected respectable scientific archives like IEEE Xplore, Springer, Elsevier, Taylor & Francis, Wiley Online Library, ResearchGate, and Science Direct. These repositories provide plenty of high-quality research. Tracing the references of selected publications has included all relevant studies using the backward snowballing method. Identifying thirteen major IoT implementation barriers is a foundation, but it is essential to recognize that additional barriers may surface during real-world implementation. To mitigate potential bias, we sought input from twelve industry professionals; however, the evaluation by these topic experts introduces a degree of subjectivity to our study’s final conclusions. Enhancing the robustness of our findings would involve soliciting input from a more extensive array of industry firms. Increased participation would validate our identified barriers and enrich the diversity of perspectives, thus improving the overall quality of our study. Furthermore, our study’s focus on CSC prompts the need for broader investigations into other sectors, such as the food supply chain, agriculture, and perishable goods. Conducting additional research in these areas will provide a more comprehensive contextual understanding and allow for the generalization of our findings beyond the specific case at hand. Additionally, alternative methods should be explored to test hypotheses regarding the interrelationships of IoT barriers. While our research has made valuable contributions, addressing these limitations and pursuing future avenues of exploration will undoubtedly refine and extend the scope of our understanding of IoT implementation challenges in various industries.
References
- 1. Khan AU, Ali Y. Sustainable supplier selection for the cold supply chain (CSC) in the context of a developing country. Environment, development and sustainability. 2021; p. 1–30.
- 2. Li L. Managing supply chain and logistics: Competitive strategy for a sustainable future. World Scientific Publishing Company; 2014.
- 3. Tan MII, Desa MI, et al. Logistics and information technology: Previous research and future research expension. In: 2010 The 2nd International Conference on Computer and Automation Engineering (ICCAE). vol. 5. IEEE; 2010. p. 242–246.
- 4. Ben-Daya M, Hassini E, Bahroun Z. Internet of things and supply chain management: a literature review. International journal of production research. 2019;57(15-16):4719–4742.
- 5. Frederico GF, Garza-Reyes JA, Anosike A, Kumar V. Supply Chain 4.0: concepts, maturity and research agenda. Supply Chain Management: An International Journal. 2019;25(2):262–282.
- 6. Li dX. Engineering informatics: state of the art and future trends. Frontiers of Engineering Management. 2015;1(3):270–282.
- 7. Mineraud J, Mazhelis O, Su X, Tarkoma S. A gap analysis of Internet-of-Things platforms. Computer Communications. 2016;89:5–16.
- 8. Salunkhe P, Nerkar R. IoT driven smart system for best cold chain application. In: 2016 International Conference on Global Trends in Signal Processing, Information Computing and Communication (ICGTSPICC). IEEE; 2016. p. 64–67.
- 9. George JP, Pramod V. An interpretive structural model (ISM) analysis approach in steel re rolling mills (SRRMS). International Journal of Research in Engineering & Technology. 2014;2(4):161–174.
- 10. Du YW, Li XX. Hierarchical DEMATEL method for complex systems. Expert Systems with Applications. 2021;167:113871.
- 11. Zhang F, Li D, Ahrentzen S, Feng H. Exploring the inner relationship among neighborhood environmental factors affecting quality of life of older adults based on SLR–ISM method. Journal of Housing and the Built Environment. 2020;35:215–242.
- 12. Li Y, Sankaranarayanan B, Thresh Kumar D, Diabat A. Risks assessment in thermal power plants using ISM methodology. Annals of Operations Research. 2019;279:89–113.
- 13. Alinezhad A, Khalili J, Alinezhad A, Khalili J. DEMATEL Method. New Methods and Applications in Multiple Attribute Decision Making (MADM). 2019; p. 103–108.
- 14. Wanganoo L, Shukla VK. Real-time data monitoring in cold supply chain through NB-IoT. In: 2020 11th International Conference on Computing, Communication and Networking Technologies (ICCCNT). IEEE; 2020. p. 1–6.
- 15. Shih CW, Wang CH. Integrating wireless sensor networks with statistical quality control to develop a cold chain system in food industries. Computer Standards & Interfaces. 2016;45:62–78.
- 16. Hasanat RT, Rahman MA, Mansoor N, Mohammed N, Rahman MS, Rasheduzzaman M. An IoT based real-time data-centric monitoring system for vaccine cold chain. In: 2020 IEEE East-West Design & Test Symposium (EWDTS). IEEE; 2020. p. 1–5.
- 17. Chen J, Xu S, Chen H, Zhao C, Xue K. Research on optimization of food cold chain logistics distribution route based on internet of things. In: Journal of Physics: Conference Series. vol. 1544. IOP Publishing; 2020. p. 012086.
- 18. Tsang YP, Choy KL, Wu CH, Ho GT, Lam CH, Koo P. An Internet of Things (IoT)-based risk monitoring system for managing cold supply chain risks. Industrial Management & Data Systems. 2018;118(7):1432–1462.
- 19. Esmizadeh Y, Bashiri M, Jahani H, Almada-Lobo B. Cold chain management in hierarchical operational hub networks. Transportation Research Part E: Logistics and Transportation Review. 2021;147:102202.
- 20. Aryal A, Liao Y, Nattuthurai P, Li B. The emerging big data analytics and IoT in supply chain management: a systematic review. Supply Chain Management: An International Journal. 2020;25(2):141–156.
- 21. Shi W, Gao T, Kulshrestha S, Bose R, Haga A, Okada Y. A framework for automatically generating IoT security quizzes in 360VR images/videos based on linked data. In: Advances in Internet, Data and Web Technologies: The 8th International Conference on Emerging Internet, Data and Web Technologies (EIDWT-2020). Springer; 2020. p. 259–267.
- 22. Al-Talib M, Melhem WY, Anosike AI, Reyes JAG, Nadeem SP, et al. Achieving resilience in the supply chain by applying IoT technology. Procedia Cirp. 2020;91:752–757.
- 23. Krotov V. The Internet of Things and new business opportunities. Business Horizons. 2017;60(6):831–841.
- 24. Saleem J, Hammoudeh M, Raza U, Adebisi B, Ande R. IoT standardisation: Challenges, perspectives and solution. In: Proceedings of the 2nd international conference on future networks and distributed systems; 2018. p. 1–9.
- 25. Ben-Daya M, Hassini E, Bahroun Z, Banimfreg BH. The role of internet of things in food supply chain quality management: A review. Quality management journal. 2020;28(1):17–40.
- 26. Cui Y. Supply Chain Innovation with IoT. In: Multi-Criteria Methods and Techniques Applied to Supply Chain Management. IntechOpen; 2018.
- 27. Kamble SS, Gunasekaran A, Parekh H, Joshi S. Modeling the internet of things adoption barriers in food retail supply chains. Journal of Retailing and Consumer Services. 2019;48:154–168.
- 28. Badia-Melis R, Mc Carthy U, Ruiz-Garcia L, Garcia-Hierro J, Villalba JR. New trends in cold chain monitoring applications-A review. Food Control. 2018;86:170–182.
- 29. Gupta VK, Chaudhuri A, Tiwari MK. Modeling for deployment of digital technologies in the cold chain. IFAC-PapersOnLine. 2019;52(13):1192–1197.
- 30. Umamaheswari K, Susneha M, Kala BS. IoT based smart cold storage system for efficient stock management. In: 2020 International Conference on Communication and Signal Processing (ICCSP). IEEE; 2020. p. 0051–0055.
- 31. Luo H, Zhu M, Ye S, Hou H, Chen Y, Bulysheva L. An intelligent tracking system based on internet of things for the cold chain. Internet Research. 2016;26(2):435–445.
- 32. Afreen H, Bajwa IS. An IoT-based real-time intelligent monitoring and notification system of cold storage. IEEE Access. 2021;9:38236–38253.
- 33. Goodarzian F, Navaei A, Ehsani B, Ghasemi P, Muñuzuri J. Designing an integrated responsive-green-cold vaccine supply chain network using Internet-of-Things: artificial intelligence-based solutions. Annals of Operations Research. 2023;328(1):531–575.
- 34. Zhang N, Liu Y. NB-IOT drives intelligent cold chain for best application. In: 2019 IEEE 9th international conference on electronics information and emergency communication (ICEIEC). IEEE; 2019. p. 1–4.
- 35. Çeken C, Abdurahman D. Simulation modeling of an iot based cold chain logistics management system. Sakarya University Journal of Computer and Information Sciences. 2019;2(2):89–100.
- 36. Hernández A, Yamaura M. Cold chain management with Internet of Things (IoT) enabled solutions for pharmaceutical industry. Malaysia Institute for Supply Chain Innovation. 2017; p. 1–6.
- 37. Zhang Y, Zhao L, Qian C. Modeling of an IoT-enabled supply chain for perishable food with two-echelon supply hubs. Industrial Management & Data Systems. 2017;117(9):1890–1905.
- 38. Abdel-Basset M, Manogaran G, Mohamed M. Internet of Things (IoT) and its impact on supply chain: A framework for building smart, secure and efficient systems. Future generation computer systems. 2018;86(9):614–628.
- 39. Babagolzadeh M, Shrestha A, Abbasi B, Zhang Y, Woodhead A, Zhang A. Sustainable cold supply chain management under demand uncertainty and carbon tax regulation. Transportation Research Part D: Transport and Environment. 2020;80:102245.
- 40. Stuurman K, Kamara I. IoT Standardization-The Approach in the Field of Data Protection as a Model for Ensuring Compliance of IoT Applications? In: 2016 IEEE 4th International Conference on Future internet of things and Cloud Workshops (FiCloudW). IEEE; 2016. p. 336–341.
- 41. Jerkins JA. Motivating a market or regulatory solution to IoT insecurity with the Mirai botnet code. In: 2017 IEEE 7th annual computing and communication workshop and conference (CCWC). IEEE; 2017. p. 1–5.
- 42. Zhou W, Piramuthu S. IoT and supply chain traceability. In: Future Network Systems and Security: First International Conference, FNSS 2015, Paris, France, June 11-13, 2015, Proceedings 1. Springer; 2015. p. 156–165.
- 43. Urbano O, Perles A, Pedraza C, Rubio-Arraez S, Castelló ML, Ortola MD, et al. Cost-effective implementation of a temperature traceability system based on smart RFID tags and IoT services. Sensors. 2020;20(4):1163.
- 44. Manavalan E, Jayakrishna K. A review of Internet of Things (IoT) embedded sustainable supply chain for industry 4.0 requirements. Computers & industrial engineering. 2019;127:925–953.
- 45. Madanayake U, Seidu R, Young B. Investigating the Skills and Knowledge Requirements for IOT implementation in Construction. In: 5th NA International Conference on Industrial Engineering and Operations Management; 2020.
- 46. Hussain MI. Internet of Things: challenges and research opportunities. CSI transactions on ICT. 2017;5:87–95.
- 47. Seet PS, Jones J, Klarin A, Suseno Y. IoT and the Future Workforce: Potential Implications. Australian Council of Learned Academies; 2021.
- 48. Zhang H, Sakurai K. Blockchain for iot-based digital supply chain: A survey. In: Advances in Internet, Data and Web Technologies: The 8th International Conference on Emerging Internet, Data and Web Technologies (EIDWT-2020). Springer; 2020. p. 564–573.
- 49. Nakamura S, Enokido T, Takizawa M. A TBOI (time-based operation interruption) protocol to prevent late information flow in the IoT. In: International Conference on Broadband and Wireless Computing, Communication and Applications. Springer; 2019. p. 93–104.
- 50. Mohsin A, Yellampalli SS. IoT based cold chain logistics monitoring. In: 2017 IEEE International Conference on Power, Control, Signals and Instrumentation Engineering (ICPCSI). IEEE; 2017. p. 1971–1974.
- 51. Karimi T, Azar A, Mohebban B, Ghasemi R. Developing an Internet of Things-based Intelligent Transportation Technology Roadmap in the Food Cold Supply Chain. Industrial Management Journal. 2022;14(2):195–219.
- 52. Raut RD, Gardas BB, Narwane VS, Narkhede BE. Improvement in the food losses in fruits and vegetable supply chain-a perspective of cold third-party logistics approach. Operations research perspectives. 2019;6:100117.
- 53. Li G. Development of cold chain logistics transportation system based on 5G network and Internet of things system. Microprocessors and Microsystems. 2021;80:103565.
- 54. Sodhi MS, Tang CS. Supply chain management for extreme conditions: research opportunities. Journal of Supply Chain Management. 2021;57(1):7–16.
- 55. Kokkinos K, Exadactylos A, Vafidis D, Hatziioannou M. Efficient traceability of aquatic products on the cold supply chain management via IoT and artificial neural networks. In: Proceedings of the 3rd International Congress on Applied Ichthyology & Aquatic Environment, Volos, Greece; 2018. p. 8–11.
- 56. Gillespie J, da Costa TP, Cama-Moncunill X, Cadden T, Condell J, Cowderoy T, et al. Real-Time Anomaly Detection in Cold Chain Transportation Using IoT Technology. Sustainability. 2023;15(3):2255.
- 57. Sarkar S, Akshatha K, Saurabh A, Samanvitha B, Sarwar MF. IoT Enabled Cold Supply Chain Monitoring System. In: 2022 IEEE 3rd Global Conference for Advancement in Technology (GCAT). IEEE; 2022. p. 1–6.
- 58. Tsang Y, Choy K, Wu CH, Ho G, Lam H, Koo P. An IoT-based cargo monitoring system for enhancing operational effectiveness under a cold chain environment. International Journal of Engineering Business Management. 2017;9:1847979017749063.
- 59. Shashi M. Digitalization of pharmaceutical cold chain systems using IoT digital enabler. Int J Eng Adv Technol. 2022;11:133–137.
- 60. Soh ZHC, Zamri LBM, Sulaiman SN, CheAbdullah SA, Yahaya SZ, Ibrahim MN. Cold Chain Management System via Low Power Wide Area Network and IoT. In: 2021 6th IEEE International Conference on Recent Advances and Innovations in Engineering (ICRAIE). vol. 6. IEEE; 2021. p. 1–6.
- 61. Zhang P, Liu X, Li W, Yu X. Pharmaceutical cold chain management based on blockchain and deep learning. Journal of Internet Technology. 2021;22(7):1531–1542.
- 62. Wanganoo L, Shukla VK, Panda BP. NB-IoT Powered Last-Mile Delivery Framework for Cold Supply Chain. In: Data Driven Approach Towards Disruptive Technologies: Proceedings of MIDAS 2020. Springer; 2021. p. 257–268.
- 63. Raut RD, Narkhede B, Gardas BB. To identify the critical success factors of sustainable supply chain management practices in the context of oil and gas industries: ISM approach. Renewable and Sustainable Energy Reviews. 2017;68:33–47.
- 64. Manoharan S, Pulimi VSK, Kabir G, Ali SM. Contextual relationships among drivers and barriers to circular economy: An integrated ISM and DEMATEL approach. Sustainable Operations and Computers. 2022;3:43–53.
- 65. Gokarn S, Choudhary A. Modeling the key factors influencing the reduction of food loss and waste in fresh produce supply chains. Journal of environmental management. 2021;294:113063.
- 66. Singh R, Bhanot N. An integrated DEMATEL-MMDE-ISM based approach for analysing the barriers of IoT implementation in the manufacturing industry. International Journal of Production Research. 2020;58(8):2454–2476.
- 67. Cui Y, Liu W, Rani P, Alrasheedi M. Internet of Things (IoT) adoption barriers for the circular economy using Pythagorean fuzzy SWARA-CoCoSo decision-making approach in the manufacturing sector. Technological Forecasting and Social Change. 2021;171:120951.
- 68. Abkenar ZA, Lajimi HF, Hamedi M, Parkouhi SV. Determining the importance of barriers to IoT implementation using bayesian best-worst method. In: Advances in Best-Worst Method: Proceedings of the Second International Workshop on Best-Worst Method (BWM2021). Springer; 2022. p. 144–159.
- 69. Kumar A, Dixit G. An analysis of barriers affecting the implementation of e-waste management practices in India: A novel ISM-DEMATEL approach. Sustainable Production and Consumption. 2018;14:36–52.
- 70. Meng B, Lu N, Lin C, Zhang Y, Si Q, Zhang J. Study on the influencing factors of the flight crew’s TSA based on DEMATEL–ISM method. Cognition, Technology & Work. 2022; p. 1–15.
- 71. Song W, Zhu Y, Zhao Q. Analyzing barriers for adopting sustainable online consumption: A rough hierarchical DEMATEL method. Computers & Industrial Engineering. 2020;140:106279.
- 72. Chauhan A, Singh A, Jharkharia S. An interpretive structural modeling (ISM) and decision-making trail and evaluation laboratory (DEMATEL) method approach for the analysis of barriers of waste recycling in India. Journal of the Air & Waste Management Association. 2018;68(2):100–110.
- 73. Bonett DG, Wright TA. Cronbach’s alpha reliability: Interval estimation, hypothesis testing, and sample size planning. Journal of organizational behavior. 2015;36(1):3–15.
- 74. Attri R, Dev N, Sharma V. Interpretive structural modelling (ISM) approach: an overview. Research journal of management sciences. 2013;2319(2):1171.
- 75. Dewangan DK, Agrawal R, Sharma V. Enablers for competitiveness of Indian manufacturing sector: an ISM-fuzzy MICMAC analysis. Procedia-Social and Behavioral Sciences. 2015;189:416–432.
- 76. Sindhwani R, Malhotra V. Modelling and analysis of agile manufacturing system by ISM and MICMAC analysis. International Journal of System Assurance Engineering and Management. 2017;8:253–263.
- 77. Si SL, You XY, Liu HC, Zhang P. DEMATEL technique: A systematic review of the state-of-the-art literature on methodologies and applications. Mathematical Problems in Engineering. 2018;2018:1–33.
- 78. Khan S, Singh R, Haleem A, Dsilva J, Samar Ali S. Exploration of Critical Success Factors of Logistics 4.0: A DEMATEL Approach. Logistics 2022, 6, 13; 2022.