Dynamics of Onsager vortex clustering in decaying turbulent polariton quantum fluids
Abstract
We investigate the turbulent properties of a confined driven-dissipative polariton quantum fluid after a pulsed excitation. Using numerical simulations, we provide insight into the vortex clustering processes that emerge during the relaxation dynamics of the initially injected vortex cloud. A confrontation between conservative and non-conservative dynamics reveals that the onset of clusterization strongly depends on the interplay between the different characteristic system lengths and time-scales at stake, with an additional time-scale due to dissipation in the non-conservative case. Quantification of the clustering observables allows us to numerically characterize the optimal conditions for observing Onsager condensation in decaying polariton systems, demonstrating its experimental reachability under pulse excitation. These findings hold significance for exploring the onset of turbulent dynamics in open systems, spanning both classical and quantum domains.
Quantum turbulence Barenghi et al. (2023); García-Orozco et al. (2022), characterized by the re-organization of chaotic motion of topological defects and waves in quantum fluids, has been widely explored in many systems, such as Bose Einstein condensates of ultracold atoms, superfluid helium He3 and He4 White et al. (2014); C. F. Barenghi (2016); Kwon et al. (2021). In two dimensions (2D), nonequilibrium turbulent phenomena in quantum systems have sparked renewed interest over the past decade, both experimentally Chesler et al. (2013); Weiler et al. (2008); Chomaz et al. (2015); Johnstone et al. (2019); Gauthier et al. (2019) and theoretically Kagan and Svistunov (1997); Berloff and Svistunov (2002); Kobayashi and Tsubota (2005, 2007); White et al. (2010); Bradley and Anderson (2012); Müller and Krstulovic (2023). Photonic systems are emerging as an alternative platform for the investigation of 2D turbulence, allowing the direct measurement of the phase of the quantum fluid with interferometric techniques Drori et al. (2023); Ballarini et al. (2020); Baker-Rasooli et al. (2023); Congy et al. (2024). In particular, the hybrid light-matter nature of exciton-polariton in semiconductor microcavities enables effective photon–photon interactions and a light mass, which lead to the observation of superfluidity Carusotto and Ciuti (2004); Amo et al. (2009); Lerario et al. (2017) and Bose–Einstein condensation Kasprzak et al. (2006); Wertz et al. (2009). While extensive investigations have been performed on the dynamics of quantum vortices Lagoudakis et al. (2008); Dominici et al. (2015), which can be formed during the nonlinear dynamics of the polariton quantum fluid Maître et al. (2021); Nardin et al. (2011); Sanvitto et al. (2011); Gnusov et al. (2023) or externally imprinted by optical means Caputo et al. (2019); Panico et al. (2021), their clustering dynamics was addressed only recently Panico et al. (2023a, b).
A generalised picture of two dimensional confined quantum systems dynamics is given by means of statistical tools, similar to those employed in the study of classical chaos Kraichnan (1967). In a pioneering paper, Onsager was able to justify the formation of vortex clusters —directly connected with the inverse cascade of the system’s energy from small to large length scales — using only equilibrium arguments. The theory predicts a transition from a configuration of randomly distributed vortices to more energetic —and less-entropic— configurations of giant clouds of defects, the so-called Onsager vortices Simula et al. (2014). Previously investigated in numerous numerical works Bradley and Anderson (2012); Reeves et al. (2013); Groszek et al. (2018); Han and Tsubota (2018), emergence of Onsager order has been reported in ultracold gases Gauthier et al. (2019); Johnstone et al. (2019). The spontaneous emergence of order from chaos, even in the absence of a constant energy injection (decaying turbulence), has been explained by means of an evaporative-heating mechanism: the number of vortices decreases, due to vortex-pairs annihilation and vortex losses at the edges of the trap, but the total kinetic energy of the system is conserved, leading to an increase of the mean energy per vortex Billam et al. (2014); Kanai and Guo (2021). This leads the randomly distributed vortex cloud to eventually evolve to a negative temperature, low-entropic state.
In the aforementioned studies, this phenomenon is discussed for systems where the particle number is conserved. Notably, the formation of vortex clusters is generally not guaranteed in a non-conservative system Groszek et al. (2020), where the decaying energy is expected to preclude the relaxation towards negative-temperature states Groszek et al. (2018). It is therefore relevant to investigate the conditions required for the emergence of Onsager clustering in a paradigmatic driven-dissipative system such as exciton-polariton quantum fluids. The question of i) whether a decaying vortex cloud in a polariton condensate formed after an initial pulsed excitation can still exhibit clustering of same-sign vortices toward Onsager order, and ii) what are the underlying competing mechanisms which regulate their dynamics, and their importance, remain therefore unanswered and of high relevance for a comprehensive understanding of turbulent regimes in light quantum fluids.
In this paper, we numerically investigate and extract the optimal conditions for the observation of vortex clustering in the decaying turbulence regime of a dissipative polariton condensate. We demonstrate that the onset of order depends on the interplay of different spatial and temporal scales, and it is eventually the result of the competition between opposite tendencies driven by particle dissipation and vortex interactions, respectively. Moreover, we discuss the interaction between vortices and sound waves, showing the important role played by the initial density of the polariton fluid. Finally, we show that the observation of Onsager condensation in decaying polariton fluids is experimentally achievable within realistic length and time scales.
The document is structured as follows. In the first section of the paper, we describe our numerical modeling and the parameters used. In the second section, we discuss how we model and probe the vortex dynamics after a high-entropy initial configuration of vortices is imprinted in the polariton condensate. In section III, we investigate the conservative polariton case, revealing how vortex clustering is affected by the intervortex distance. In section IV, we investigate the vortex dynamics in dissipative systems, using different decay rates. In section V, we discuss how clustering dynamics changes in a dissipative system as a function of both the initial particle density and the intervortex distance. Finally, we summarise our conclusions in the last section.
Section I - Theoretical model and system parameters.
The dynamics of the polariton fluid is described by means of a generalized equation of motion for the 2D polariton field for the lower-polariton branch, a function of the position and time ; it can be derived from both truncated Wigner (TW) and Keldysh field theories Carusotto and Ciuti (2013); Szymańska et al. (2006) and reads ():
| (1) |
Here represents the polariton mass, the polariton-polariton interaction strength, the polariton loss rate , with the polariton lifetime. We consider a simplified case where the complex relaxation processes Wouters et al. (2010); Comaron et al. (2018) are disregarded, and where the exciton reservoir is treated as adiabatically following the condensate dynamics Bobrovska and Matuszewski (2015).
The renormalized density includes the subtraction of the Wigner commutator contribution (where is the volume element of our grid of spacing ). The zero-mean white Wiener noise fulfills
| (2) |
as required by the TW approach. The two-dimensional fluid of light is confined in a radially-symmetric potential with diameter . In typical experiments, the potential landscape can be created by means of an additional laser that confines the polariton fluid or it can be obtained by lithographic etching of the sample surface. Both optical and lithographic techniques enable further engineering of the polariton dispersion, an additional tool we anticipate to be useful to control the dynamics of polariton quantum fluid in future investigations. For simplicity, in this work, the potential is modeled as a hard-bounded box. In order to avoid numerical boundary effects, we choose values of the ratio (between the diameter and the extent of the numerical grid ) less than . Typical experimental parameters for the polariton system are used Panico et al. (2021, 2023a): , , . We solve Eq. (1) using an eigth-order Runge-Kutta method on a numerical grid.
Section II: Modelling the vortex dynamics.
In this study, we simulate turbulent processes of a decaying driven-dissipative system after an initial pulsed excitation. To do so, we solve the system dynamics starting from a condensate at ns with homogeneous initial density . The spatially homogeneous but arbitrary phase emulates a quasi-resonant laser excitation. This initial state can be also thought of as the density state corresponding to a non-resonant pumping with strength , where is the system saturation density Wouters and Carusotto (2007). At the same time (), a random configuration of is imprinted; this configuration corresponds to an entropy-dominated vortex gas state Simula et al. (2014). The position of the -th vortex, centered at , with the center of the potential, is randomly chosen at each stochastic realization. To imprint the vortex cloud, the polariton wavefunction is initialized as , with a parameter regulating the shape of the vortex core. We then let the system evolve with Eqs. (1)-(2). Topological defects are numerically detected at each snapshot of the evolution as in Ref. Comaron et al. (2018). Vortex number and their positions are inferred from the phase gradients around closed paths of each grid point after a Gaussian filtering is applied in order to get rid of highest-order fluctuations (see Ref. Comaron et al. (2021) for details on the vortex tracking algorithm). Evaluation of the position, vorticity, and charge of each vortex allows us to track the behavior of the vortex gas, and to extract the relevant clustering observables.
In order to quantify the clustering processes, we monitor the evolution of the averaged dipole moment and the correlation function Gauthier et al. (2019). Here is the total vortex number, the circulation sign, the position, and the product of the circulations between the -th vortex and its nearest neighbor. As such, increasing values of C correspond to higher energetic states of the vortex gas. In the Onsager model, negative temperatures are associated to , whereas corresponds to the infinite temperature limit (maximum entropy) and is the lowest (positive) temperature Kraichnan (1967); Simula et al. (2014). The limits , correspond to a gas of vortex-antivortex pairs, a completely random configuration, and to configurations where same-sign vortices gather into giant clusters, respectively Groszek et al. (2018). We also track the evolution of the average distance between the vortex cores . In a disc with diameter , by modelling the single vortices as rigid objects with radius , the average inter-vortex length can be calculated as .
In the following analysis, we show how the nature of the clustering processes strongly depends on the interplay of different system lengths and timescales of the physical processes, namely the healing length (proportional to the size of the vortex core)
| (3) |
the circular trapping diameter and the average inter-vortex length , where . Here, the inter-vortex length is defined as . In our numerical experiments, we impose the initial polariton density —which also sets the initial healing length of the system — as well as the number of initial vortices . Fixing allows us to use the disc diameter as a parameter controlling the initial intra-vortex length . We are careful to set such a ratio to be about a decade, large enough to avoid finite-size effects. We chose a configuration of vortices that is highly random and free of clusters, by carefully checking that the initial condition for the dipole moment, averaged over the realizations, always reads . Since we are interested in the early stages of the dynamics, in all our simulations we probe the polaritons up to ns (5 times the value of the polariton lifetime in typical high-quality samples Panico et al. (2021)). In the Supplementary Information, we provide movies of simulated conservative (supplementary movie 1) and dissipative (supplementary movie 2) condensate evolution, cases discussed in the next sections SIm .
Section III: Onsager condensation in the conservative case.
First, we focus on the investigation of clustering within the conservative case (). We compute dynamics for different initial inter-vortex lengths , which allow us to both i) gain an understanding of the vortex dynamics in terms of different system sizes; ii) reveal the interplay between the different mechanisms that regulate the clustering dynamics iii) use the conservative case as a reference for the dissipative cases analyzed in the next sections.
Throughout conservative dynamics, the total number of particles and angular momentum are constant in time. As a consequence, the healing length set at the beginning of the simulation will be preserved overall in the system dynamics .
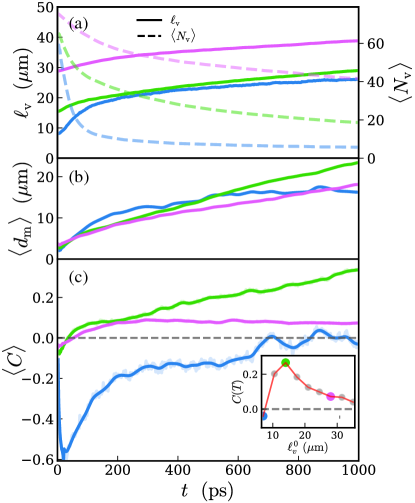
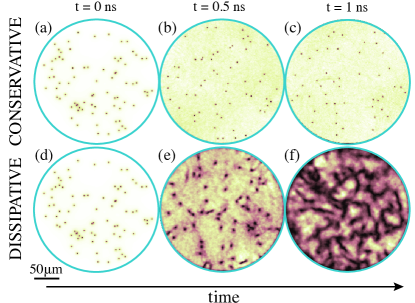
In Fig. 2 we plot the relevant vortex and clustering observables along the system evolution: average number of vortices (panel a, dashed lines), inter-vortex length (panel a, solid lines), average dipole moment (panel c), and the clustering correlation function . Ensemble averaging is applied over different initial random vortex configurations. An example of vortex dynamics is given by the case depicted in pink color, corresponding to . For this case, the real-space density distributions are reported in Fig. 1, at different times: , and (panels a, b, c, respectively). The system evolves as follows: at the beginning, a large number of vortex-antivortex pair annihilate, followed by the consequent emission of sound waves. In agreement with previous literature Simula et al. (2014); Gauthier et al. (2019), as the vortex cloud decays, evaporative heating processes take place followed by the tendency of the system to form same-sign vortex clusters of different sizes. The decay towards a higher-temperature state is verified by the growth of the clustering quantities and towards larger positive values. An example of vortex dynamics in the conservative case is provided in the supplementary movie 1 SIm .
Let us now discuss how clustering behaves under the change of the inter-vortex length . Fig. 2(a) shows that decreasing , the number of vortices exhibits a faster decay in time —especially in the first transients of the evolution—; this shows that annihilation processes become more efficient as we increase the initial density of the vortex gas. This behavior can be naively justified if one considers that the dynamics of a single interacting quantum vortex pair accelerates in the case two vortices are placed closer to one another C. F. Barenghi (2016). Thus, a denser, therefore more strongly interacting, gas of defects (with opposite circulations in equal numbers), is expected to accelerate pair-collapse processes. To tentatively quantify this behavior, we extract at time ns. In the inset of Fig. 2(c) we plot as a function of the . The data verifies the inverse proportionality between the two quantities, but up to a threshold value for ( for the set of parameters chosen) below which changes behavior and decreases.
Fig. 2(c) shows that this behavior can be explained by a quenching of the clustering processes taking place in the very early stage of dynamics ( for the case , blue curves). Inspection of the density profiles (see supplementary movie 1 SIm ) reveals that the quenching effect is mainly originated by the fast vortex-antivortex annihilation events which, given the more dense gas of vortex-antivortex pairs, take place at shorter times-scales than the clustering processes. As a result, in the diluted (therefore less interacting) vortex gas, the onset of clustering is delayed. Only when the density of the vortex gas (due to the abrupt decay of the number of vortices) reaches sufficiently low values to slow down the vortex interactions and trigger the clusterization processes, the “evaporative cooling” observed at early times transforms to “evaporative heating”, allowing to grow towards positive values. In the meantime, a large amount of incompressible energy has been already transformed to compressible energy, resulting in a total clusterization process being slowed down in comparison to cases with larger .
Section IV: Onsager condensation in the dissipative case.
We proceed by investigating how the vortex clustering is affected when accounting for a finite lifetime. The main difference is that the dissipative Hamiltonian of the polariton equation of motion (1) does not preserve the total average number of particles. Due to the cavity leaks (modeled by the term proportional to ), the polariton density exponentially decays in time as . Consequently, dissipation introduces a temporal dependence to the healing length (3), which is redefined as . This is expected to bear important consequences on the vortex dynamics, and it is still unclear if (and in which range of realistic system parameters) vortex clustering occurs.
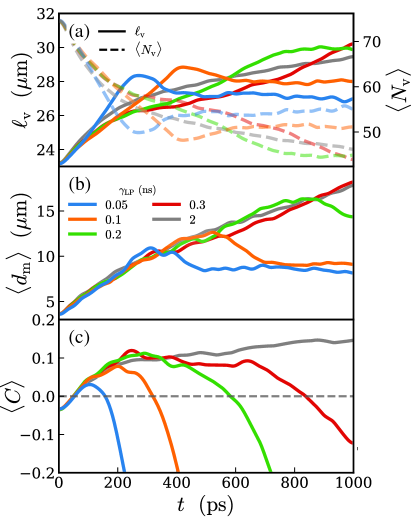
In Fig. 3 we re-propose the same analysis as in Fig. 2 for different values of the particle lifetime , in a system with fixed geometry (i.e. fixed ) and fixed initial density . We choose from the range of typical experimental polariton lifetimes . Similarly to the conservative case discussed in the previous section, clustering observables are monitored along the system evolution. Importantly, Fig. 3(c) shows that, despite the presence of dissipation, the clustering processes are still able to take place at early-stage dynamics, where and dipole moment grow. We note, however, that the onset of clustering takes place only up to a certain time, after which starts decreasing due to the effects of dissipation. This results in the presence of a maximum in the dynamical curve of the clustering correlation function. Fig. 3(c) shows that both i) the maximum value of and ii) the times-scale measured along the clustering process increase as a function of .
The condensate profiles depicted in Fig. 1, panels (d), (e) and (f), show that this behavior is intrinsically linked to the time dependence of the size of a single vortex core. An example of the vortex dynamics in the dissipative case is also provided in the supplementary movie 2 SIm . The density profiles show that as the density decays, the vortex cores expand, slowing down the vortex gas dynamics. The slowing down of the vortex dynamics corresponds to a deceleration of the clustering of the vortex gas. This is explained by a decrease of the energy per single vortex, which scales as : along the system dynamics, the incompressible energy —stored in the vortex cloud— transforms in compressible energy, compromising the evaporative heating. We note that eventually, in the final part of the dynamics, the system reaches very low density, allowing small density fluctuations to generate new random vortex-antivortex pairs. This interferes further with the clustering processes. We conclude by noting that the clustered fraction of the vortex cloud starts decreasing much earlier than dipole moment .
Section V: Optimal condition for Onsager condensation.
We proceed to study the onset of Onsager condensation as a function of both the confinement size (i.e. ) and initial densities of the decaying system. Given the competition of the different length- and time-scales of the relevant processes discussed in the previous sections, understanding the vortex dynamics and clustering becomes a non-trivial problem.
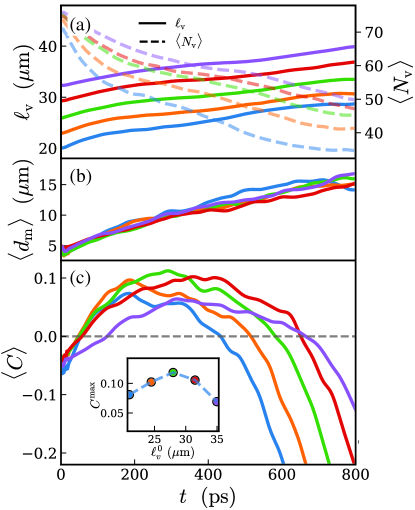
First, we solve the polariton dynamics for the dissipative case with , with constant but varying the initial intra-vortex length: results are shown in fig. 4. The evolution of depicted in Fig. 4(c) shows that there exists an optimal curve which maximises the onset of vortex clustering. This is in analogy with the conservative case, but the optimal intervortex length is in general larger in the dissipative case. Then, we extend our analysis by investigating the influence of the initial density .
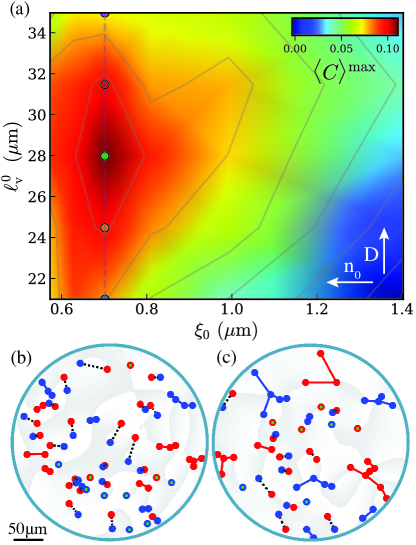
Fig. 5(a) depicts a carpet plot of as a function of the two relevant lengths of the system, namely (proportional to the trap size ) and the initial healing length (function of the initial density , as in Eq. (3) at ). The vertical dashed blue line and points at correspond to those depicted in the inset of fig. 4(c). The plot presents a maximum at and , which corresponds to the optimal condition for vortex clustering with experimentally available system parameters. The maximum is reached at ps, as reported in fig. 4(c); the real-space distribution of the vortex gas for the optimal case at the maximum point is shown, for a single realization, in fig. 5(c), and compared with the initial vortex gas shown in fig. 5(b). Fig. 5(a) also shows that for any fixed , by decreasing from large values, the clustering processes are enhanced. This is an expected behavior, as the energy per vortex would increase as its healing length decreases. Interestingly, we note that there exists an optimal condition also for (namely ), below which decreases. Investigation of the density and phase snapshots suggests this is due to the large amount of sound produced by the annihilation of vortex-antivortex pair —produced in more quantity at larger densities—, sound which eventually hampers vortex clustering over the whole evolution.
Discussion and conclusions.
In this work, we give a qualitative and quantitative analysis of vortex clustering for dissipative condensates in the decaying turbulence scenario. We study the evolution of an initially disordered vortex cloud towards more ordered states, revealing how the dynamics are affected by changing the relevant physical quantities, such as system size, initial density, and decay rates. Our investigation gives a clearer qualitative picture of the role and interplay of the different physical processes involved.
The analysis of the conservative case, using realistic system parameters, already provides important information: while a denser and more interacting vortex cloud speeds up the clustering processes, there exists a threshold above which the annihilation prevails over clustering, diluting the gas too fast and retarding the evaporative heating mechanisms. A similar scenario is also found modulating the initial density of the system: while larger densities speed up vortex clustering, there exists a threshold above which the sound emitted by the frequent vortex annihilations would slow down the motion of vortices.
As expected, when accounting for dissipation, evaporative heating is compromised. Our calculations reveal that, with respect to the conservative case, the optimal intervortex length is larger and the maximum value of the clustering correlation function is limited by the dissipation rate. However, we show that, for experimentally accessible parameters, the onset of vortex clustering can be observed in decaying polariton systems. Additionally, the persistence of a global dipole orientation over the nearest neighbor correlation motivates further research and deeper insights on the mechanisms underlying the onset of turbulence in driven-dissipative condensates. In this context, the possibility to inject a large number of vortices and to precisely measure higher-order spatial correlations can be an asset of optical systems. Finally, these findings point towards the intriguing possibility of tuning the density and phase of exciton-polaritons quantum fluids to access different regimes of 2D quantum turbulence, ranging from superfluid turbulence to weak wave turbulence Berloff (2010); Koniakhin et al. (2020); Claude et al. (2020).
Acknowledgements. —
We are grateful for stimulating discussions with A. S. Lanotte and D. Sanvitto. We acknowledge financial support from National Science Centre, Poland, grant no. 2016/22/E/ST3/00045. D.B and R.P. acknowledge financial support from PNRR MUR project PE0000023-NQSTI, financed by the European Union – Next Generation EU, and from EIC-Pathfinder project - “Quantum Optical Networks based on Exciton-polaritons - Q-ONE” (Id: 101115575), financed by the European Union.
References
- Barenghi et al. (2023) C. F. Barenghi, L. Skrbek, and K. R. Sreenivasan, Quantum Turbulence (Cambridge University Press, 2023).
- García-Orozco et al. (2022) A. D. García-Orozco, L. Madeira, M. A. Moreno-Armijos, A. R. Fritsch, P. E. S. Tavares, P. C. M. Castilho, A. Cidrim, G. Roati, and V. S. Bagnato, Phys. Rev. A 106, 023314 (2022).
- White et al. (2014) A. C. White, B. P. Anderson, and V. S. Bagnato, Proceedings of the National Academy of Sciences 111, 4719 (2014).
- C. F. Barenghi (2016) N. G. P. C. F. Barenghi, A primer on Quantum Fluids (Springer, 2016).
- Kwon et al. (2021) W. J. Kwon, G. Del Pace, K. Xhani, L. Galantucci, A. Muzi Falconi, M. Inguscio, F. Scazza, and G. Roati, Nature 600, 64 (2021).
- Chesler et al. (2013) P. M. Chesler, H. Liu, and A. Adams, Science 341, 368 (2013).
- Weiler et al. (2008) C. N. Weiler, T. W. Neely, D. R. Scherer, A. S. Bradley, M. J. Davis, and B. P. Anderson, Nature 455, 948 (2008).
- Chomaz et al. (2015) L. Chomaz, L. Corman, T. Bienaimé, R. Desbuquois, C. Weitenberg, S. Nascimbène, J. Beugnon, and J. Dalibard, Nature Commun. 6, 6162 (2015).
- Johnstone et al. (2019) S. P. Johnstone, A. J. Groszek, P. T. Starkey, C. J. Billington, T. P. Simula, and K. Helmerson, Science 364, 1267 (2019).
- Gauthier et al. (2019) G. Gauthier, M. T. Reeves, X. Yu, A. S. Bradley, M. A. Baker, T. A. Bell, H. Rubinsztein-Dunlop, M. J. Davis, and T. W. Neely, Science 364, 1264 (2019).
- Kagan and Svistunov (1997) Y. Kagan and B. V. Svistunov, Phys. Rev. Lett. 79, 3331 (1997).
- Berloff and Svistunov (2002) N. G. Berloff and B. V. Svistunov, Phys. Rev. A 66, 013603 (2002).
- Kobayashi and Tsubota (2005) M. Kobayashi and M. Tsubota, Phys. Rev. Lett. 94, 065302 (2005).
- Kobayashi and Tsubota (2007) M. Kobayashi and M. Tsubota, Phys. Rev. A 76, 045603 (2007).
- White et al. (2010) A. C. White, C. F. Barenghi, N. P. Proukakis, A. J. Youd, and D. H. Wacks, Phys. Rev. Lett. 104, 075301 (2010).
- Bradley and Anderson (2012) A. S. Bradley and B. P. Anderson, Phys. Rev. X 2, 041001 (2012).
- Müller and Krstulovic (2023) N. P. Müller and G. Krstulovic, arXiv:2306.17735 (2023).
- Drori et al. (2023) L. Drori, B. C. Das, T. D. Zohar, G. Winer, E. Poem, A. Poddubny, and O. Firstenberg, Science 381, 193 (2023).
- Ballarini et al. (2020) D. Ballarini, D. Caputo, G. Dagvadorj, R. Juggins, M. D. Giorgi, L. Dominici, K. West, L. N. Pfeiffer, G. Gigli, M. H. Szymańska, and D. Sanvitto, Nature Communications 11, 217 (2020).
- Baker-Rasooli et al. (2023) M. Baker-Rasooli, W. Liu, T. Aladjidi, A. Bramati, and Q. Glorieux, Phys. Rev. A 108, 063512 (2023).
- Congy et al. (2024) T. Congy, P. Azam, R. Kaiser, and N. Pavloff, Phys. Rev. Lett. 132, 033804 (2024).
- Carusotto and Ciuti (2004) I. Carusotto and C. Ciuti, Phys. Rev. Lett. 93, 166401 (2004).
- Amo et al. (2009) A. Amo, J. Lefrère, S. Pigeon, C. Adrados, C. Ciuti, I. Carusotto, R. Houdré, E. Giacobino, and A. Bramati, Nature Physics 5, 805 (2009).
- Lerario et al. (2017) G. Lerario, A. Fieramosca, F. Barachati, D. Ballarini, K. S. Daskalakis, L. Dominici, M. De Giorgi, S. A. Maier, G. Gigli, S. Kéna-Cohen, and D. Sanvitto, Nature Physics 13, 837 (2017).
- Kasprzak et al. (2006) J. Kasprzak et al., Nature (London) 443, 409 (2006).
- Wertz et al. (2009) E. Wertz, L. Ferrier, D. D. Solnyshkov, P. Senellart, D. Bajoni, A. Miard, A. Lemaître, G. Malpuech, and J. Bloch, Applied Physics Letters 95, 051108 (2009).
- Lagoudakis et al. (2008) K. G. Lagoudakis, M. Wouters, M. Richard, A. Baas, I. Carusotto, R. André, L. S. Dang, and B. Deveaud-Plédran, Nature Physics 4, 706 (2008).
- Dominici et al. (2015) L. Dominici, G. Dagvadorj, J. M. Fellows, D. Ballarini, M. D. Giorgi, F. M. Marchetti, B. Piccirillo, L. Marrucci, A. Bramati, G. Gigli, M. H. Szymańska, and D. Sanvitto, Science Advances 1, e1500807 (2015).
- Maître et al. (2021) A. Maître, F. Claude, G. Lerario, S. Koniakhin, S. Pigeon, D. Solnyshkov, G. Malpuech, Q. Glorieux, E. Giacobino, and A. Bramati, Europhysics Letters 134, 24004 (2021).
- Nardin et al. (2011) G. Nardin, G. Grosso, Y. Léger, B. Pietka, F. Morier-Genoud, and B. Deveaud-Plédran, Nature Physics 7, 635 (2011).
- Sanvitto et al. (2011) D. Sanvitto, S. Pigeon, A. Amo, D. Ballarini, M. De Giorgi, I. Carusotto, R. Hivet, F. Pisanello, V. G. Sala, P. S. S. Guimaraes, R. Houdré, E. Giacobino, C. Ciuti, A. Bramati, and G. Gigli, Nature Photonics 5, 610 (2011).
- Gnusov et al. (2023) I. Gnusov, S. Harrison, S. Alyatkin, K. Sitnik, J. Topfer, H. Sigurdsson, and P. Lagoudakis, Science Advances 9, eadd1299 (2023).
- Caputo et al. (2019) D. Caputo, N. Bobrovska, D. Ballarini, M. Matuszewski, M. De Giorgi, L. Dominici, K. West, L. N. Pfeiffer, G. Gigli, and D. Sanvitto, Nature Photonics 13, 488 (2019).
- Panico et al. (2021) R. Panico, G. Macorini, L. Dominici, A. Gianfrate, A. Fieramosca, M. De Giorgi, G. Gigli, D. Sanvitto, A. S. Lanotte, and D. Ballarini, Phys. Rev. Lett. 127, 047401 (2021).
- Panico et al. (2023a) R. Panico, P. Comaron, M. Matuszewski, A. S. Lanotte, D. Trypogeorgos, G. Gigli, M. D. Giorgi, V. Ardizzone, D. Sanvitto, and D. Ballarini, Nature Photonics 17, 451 (2023a).
- Panico et al. (2023b) R. Panico, A. S. Lanotte, D. Trypogeorgos, G. Gigli, M. De Giorgi, D. Sanvitto, and D. Ballarini, Applied Physics Reviews 10, 041418 (2023b).
- Kraichnan (1967) R. H. Kraichnan, The Physics of Fluids 10, 1417 (1967).
- Simula et al. (2014) T. Simula, M. J. Davis, and K. Helmerson, Phys. Rev. Lett. 113, 165302 (2014).
- Reeves et al. (2013) M. T. Reeves, T. P. Billam, B. P. Anderson, and A. S. Bradley, Phys. Rev. Lett. 110, 104501 (2013).
- Groszek et al. (2018) A. J. Groszek, M. J. Davis, D. M. Paganin, K. Helmerson, and T. P. Simula, Phys. Rev. Lett. 120, 034504 (2018).
- Han and Tsubota (2018) J. Han and M. Tsubota, Journal of the Physical Society of Japan, Journal of the Physical Society of Japan 87, 063601 (2018).
- Billam et al. (2014) T. P. Billam, M. T. Reeves, B. P. Anderson, and A. S. Bradley, Phys. Rev. Lett. 112, 145301 (2014).
- Kanai and Guo (2021) T. Kanai and W. Guo, Phys. Rev. Lett. 127, 095301 (2021).
- Groszek et al. (2020) A. J. Groszek, M. J. Davis, and T. P. Simula, SciPost Phys. 8, 039 (2020).
- Carusotto and Ciuti (2013) I. Carusotto and C. Ciuti, Rev. Mod. Phys. 85, 299 (2013).
- Szymańska et al. (2006) M. H. Szymańska, J. Keeling, and P. B. Littlewood, Phys. Rev. Lett. 96, 230602 (2006).
- Wouters et al. (2010) M. Wouters, T. C. H. Liew, and V. Savona, Phys. Rev. B 82, 245315 (2010).
- Comaron et al. (2018) P. Comaron, G. Dagvadorj, A. Zamora, I. Carusotto, N. P. Proukakis, and M. H. Szymańska, Phys. Rev. Lett. 121, 095302 (2018).
- Bobrovska and Matuszewski (2015) N. Bobrovska and M. Matuszewski, Phys. Rev. B 92, 035311 (2015).
- Wouters and Carusotto (2007) M. Wouters and I. Carusotto, Phys. Rev. Lett. 99, 140402 (2007).
- Comaron et al. (2021) P. Comaron, I. Carusotto, M. H. Szymańska, and N. P. Proukakis, EPL (Europhysics Letters) 133, 17002 (2021).
- (52) “See Supplementary Information at the url […] for movies of the simulated condensate evolution in the conservative (supplementary movie 1, SM1) and dissipative cases (supplementary movie 2, SM2).” .
- Berloff (2010) N. G. Berloff, arXiv:1010.5225v2 (2010).
- Koniakhin et al. (2020) S. Koniakhin, O. Bleu, G. Malpuech, and D. Solnyshkov, Chaos, Solitons & Fractals 132, 109574 (2020) .
- Claude et al. (2020) F. Claude, S. V. Koniakhin, A. Maître, S. Pigeon, G. Lerario, D. D. Stupin, Q. Glorieux, E. Giacobino, D. Solnyshkov, G. Malpuech, and A. Bramati, Optica 7, 1660 (2020).