Learning from Two Decades of Blood Pressure Data: Demography-Specific Patterns Across 75 Million Patient Encounters
Abstract
Hypertension remains a global health concern with a rising prevalence, necessitating effective monitoring and understanding of blood pressure (BP) dynamics. This study delves into the wealth of information derived from BP measurement, a crucial approach in informing our understanding of hypertensive trends. Numerous studies have reported on the relationship between BP variation and various factors. In this research, we leveraged an extensive dataset comprising 75 million records spanning two decades, offering a unique opportunity to explore and analyze BP variations across demographic features such as age, race, and gender. Our findings revealed that gender-based BP variation was not statistically significant, challenging conventional assumptions. Interestingly, systolic blood pressure (SBP) consistently increased with age, while diastolic blood pressure (DBP) displayed a distinctive peak in the forties age group. Moreover, our analysis uncovered intriguing similarities in the distribution of BP among some of the racial groups. This comprehensive investigation contributes to the ongoing discourse on hypertension and underscores the importance of considering diverse demographic factors in understanding BP variations. Our results provide valuable insights that may inform personalized healthcare approaches tailored to specific demographic profiles.
Index Terms:
Blood Pressure; Demographic Features; Age; Race; Gender; Cuff-based blood pressure; Bias in blood pressure; Machine learning;I Introduction
In 2021, the World Health Organization highlighted a concerning statistic: cardiovascular diseases (CVDs) are responsible for 32% of all global deaths [1]. Hypertension, often termed the “silent killer”, is the most significant risk factor for strokes and heart attacks [2, 3]. Alarmingly, hypertension, frequently remains undetected due to its lack of early symptoms, leading to substantial damage to vital organs like the heart and kidneys [4].
Blood pressure (BP) monitoring is a critical tool in diagnosing and mitigating the prevalence of CVDs [5]. There is an increasing shift towards ambulatory BP monitoring, which allows patients to monitor their BP outside clinical settings and more frequently [6]. This approach, while convenient, raises questions about its comparative accuracy to traditional in-clinic measurements.
The existing benchmarks for delineating normal, borderline, and hypertensive BP categories were established several decades ago, forming the current standards of CVD risk evaluation [7]. Nevertheless, these guidelines lack individualization for demographics including sex, age, and race. The benchmarks were mainly set based upon data derived from dominantly male Caucasian cohorts in the Global North, which questions their universality and relevance across the global demographic spectrum. Moreover, the conventional methodology of reporting systolic (SBP) and diastolic blood pressure (DBP) as discrete quantities fails to consider the clinical significance of their interdependence (correlation). As a result, the current standardized BP thresholds, while instrumental for the triage of potential hypertensive individuals, are inadequate for use as precise biomarkers in determining the gradation of hypertension or as accurate quantitative indices of CVD risk. This situation underscores the necessity for a refinement in BP measurement standards — that could be significantly advanced through the application of state-of-the-art machine learning (ML) algorithms. Such technological approaches have the potential to integrate and learn from vast datasets, capturing demographics and individualized factors, and mitigating unintentional algorithmic biases, thus enabling a more personalized and discriminating assessment of CVD risks.
In this study, We will investigate the statistical characteristics of BP and examine how various demographic variables — such as sex, age, and race — affect it. We will analyze the variation of BP alongside these demographic features.
II Method
II-A Dataset
In this research, we analyzed a very large dataset comprising about 90 million records of cuff-based (noninvasive) BP, collected from more than 2.4 million distinct patients across varied demographics and clinical outcomes. These records, have been collected between 2000 and 2022 at Emory Healthcare, the most comprehensive academic health system in Georgia, providing a rich resource for understanding population-wide BP trends. The study has been approved by Emory University’s Internal Review Board (Protocol ID: STUDY00006568).
II-B Pre-processing
To ensure the reliability and accuracy of our findings, we conducted a three-stage pre-processing procedure. Initially, we examined the BP records to ensure they fell within a reasonable range (DBP_min = 30, DBP_max = 120, SBP_min = 60, SBP_max = 200). Subsequently, an analysis of age values was performed to eliminate negative values and those exceeding 150 years old. Finally, a comprehensive assessment of the dataset was conducted to identify and address any missing values. As a result of these pre-processing steps, the dataset in our study, encompassing all demographic features and BP values, is now related to about 75 million records, associated with over 1.6 million unique patients.
II-C Data distribution
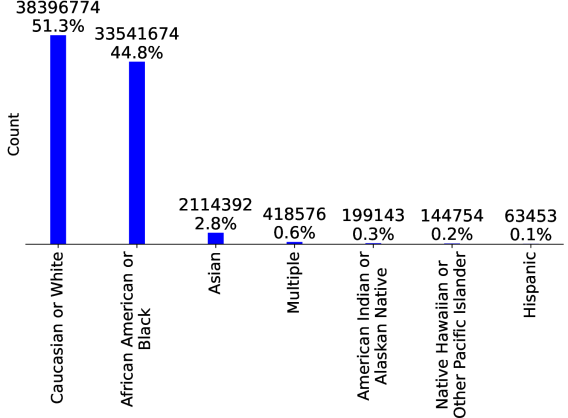
The Emory dataset exhibits a balanced distribution, with females comprising 53.8% (40,303,826) and males representing 46.2% (34,574,940) of the total. This dataset encompasses seven race groups: Caucasian or White, African American or Black, Asian, Multiple, American Indian or Alaskan Native, Native Hawaiian or Other Pacific Islander, and Hispanic. Fig. 1 presents a bar chart depicting the prevalence of data in each group, with over 96% associated with the first two race groups.
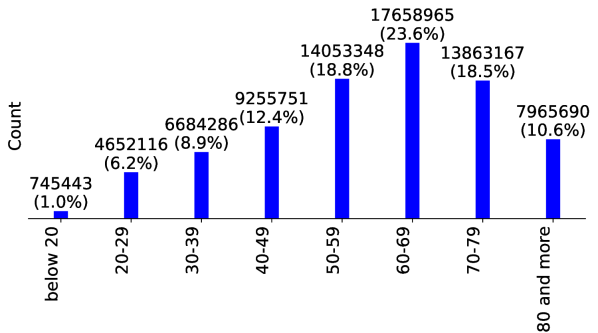
Age details in the Emory dataset have been determined by considering both the birth date and the date of BP measurement, allowing for the computation of age for each record. To facilitate analysis, we have grouped individuals into specific age categories. The age groups are defined with a decade-long interval, ranging from 0 to 150 years. In other words, we have grouped the age data with a 10-year span, where the minimum age is greater than 0, and the maximum age is 150 years old. Additionally, two special groups have been established, encompassing individuals younger than 20 years in one category and those aged more than 80 years in another. Fig. 2 demonstrates that over 60% of the records are concentrated within the age groups of the fifties, sixties, and seventies. This substantial concentration can be attributed to factors like heightened health monitoring in older age and an increased awareness of health concerns.
III Results
Demographic features have physiological impacts that influence BP measurements. Many studies have investigated the relationship between BP and demographic factors [6]. In this section, we will present our findings from the extensive dataset, providing insights into this relationship.
III-A Impact of Gender on Blood Pressure Values
Most previous studies have consistently reported higher BP levels in males compared to females [8, 9, 6]. These differences, as observed in several studies with more than 1000 BP records, range from 3 to 10 mmHg for mean SBP and 2.3 to 4.4 mmHg for DBP, respectively [10, 11, 12, 13, 14, 15, 16, 6].
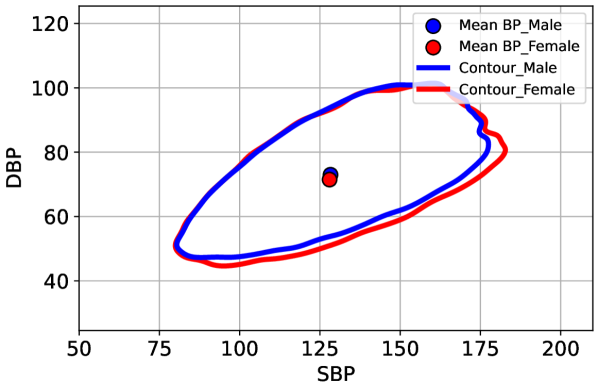
Our findings reveal minimal differences between female and male BP levels. The mean SBP difference is only 0.29 mmHg, and for DBP, it is 0.37 mmHg. Table I provides a concise summary of the statistical information. Furthermore, the contour plot (Fig. 3) illustrates the striking similarity in the distributions of BP based on gender and their density trends. The figure includes contour plots generated using Kernel Density Estimation (KDE). It’s crucial to note that we constructed this plot using a subset of randomly selected 100 thousand data points, focusing on the first contour that encloses the region with the highest density of data points.
| Gender | mean | std | mean | std | mod | mod | Correlation |
|---|---|---|---|---|---|---|---|
| SBP | SBP | DBP | DBP | SBP | DBP | ||
| Female | 128.01 | 22.37 | 71.48 | 12.76 | 120 | 70 | 0.58 |
| Male | 128.30 | 22.00 | 72.98 | 12.82 | 120 | 70 | 0.63 |
III-B Impact of Race on Blood Pressure Values
Examining BP values across diverse racial groups has garnered significant attention. Numerous studies have delved into the correlation between BP and race. According to the literature, certain racial groups exhibit higher BP values compared to others [6].
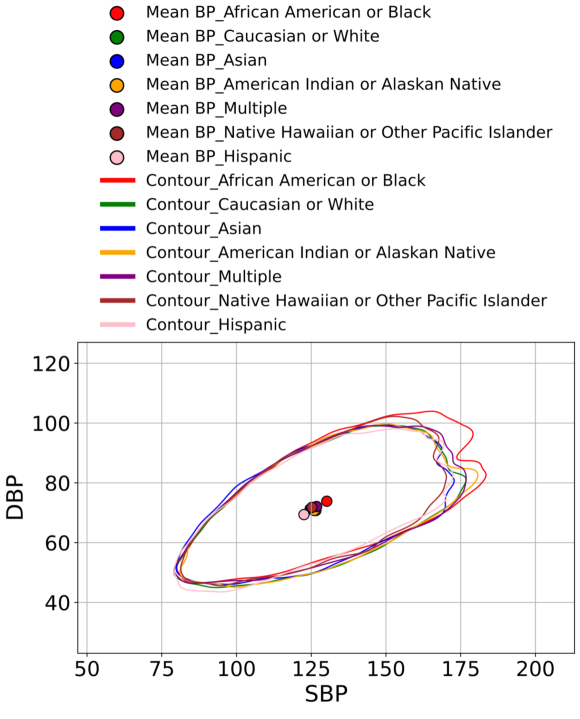
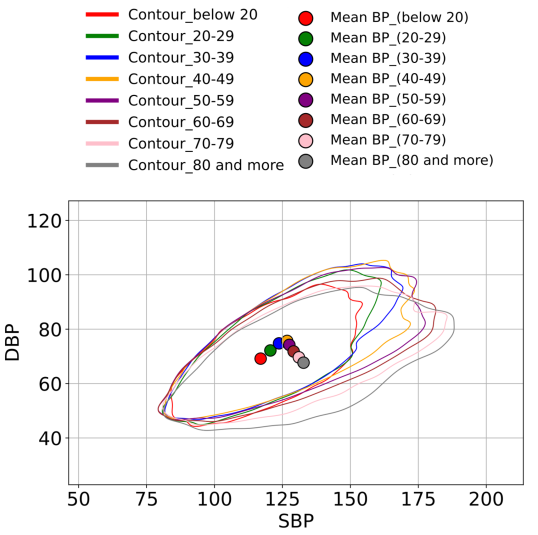
Table II details mean and standard deviation for DBP and SBP across these groups, exposing significant differences. The maximum and minimum differences in mean SBP among race groups are 7.6 mmHg and 0.25 mmHg, respectively. Similarly, for mean DBP, the maximum difference is 4.5 mmHg, and the minimum difference is 0 mmHg. African American and Black individuals exhibit the highest BP values, while Hispanics display the lowest. In addition, the contour plot (Fig. 4) indicates that certain race groups share similar distributions, while the African American or Black group exhibits a distinctly different density pattern compared to others.
| Race | mean | std | mean | std | mod | mod | Correlation |
|---|---|---|---|---|---|---|---|
| SBP | SBP | DBP | DBP | SBP | DBP | ||
| 1 | 130.22 | 23.15 | 73.86 | 13.05 | 120 | 70 | 0.63 |
| 2 | 126.57 | 21.25 | 70.77 | 12.45 | 120 | 70 | 0.56 |
| 3 | 124.65 | 21.37 | 71.25 | 12.25 | 120 | 70 | 0.55 |
| 4 | 126.01 | 21.45 | 70.76 | 12.29 | 120 | 70 | 0.55 |
| 5 | 126.82 | 21.49 | 72.10 | 12.44 | 120 | 70 | 0.58 |
| 6 | 125.22 | 20.72 | 71.80 | 12.48 | 110 | 70 | 0.56 |
| 7 | 122.57 | 21.48 | 69.63 | 12.60 | 110 | 70 | 0.68 |
III-C Impact of Age on Blood Pressure Values
Age is another significant demographic feature. The relationship between age and BP is a well-documented aspect of cardiovascular health. As individuals age, changes in the cardiovascular system often result in alterations to BP levels [17]. In general, it is common for BP to gradually increase with age. This phenomenon is attributed to factors such as the stiffening of arteries, reduced elasticity, and changes in the overall structure and function of the cardiovascular system. A notable research reported, overall BP values increase with age, but decrease again after approximately 70 years of age [18].
Table III offers a succinct overview of the statistical information pertaining to various age groups. The intriguing discovery from the analysis is that the age group of 80 and more exhibits the maximum mean SBP (132.77 mmHg), minimum mean DBP (67.69 mmHg), and the lowest correlation between SBP and DBP values (0.54). The analysis reveals that the age group of 40-49 demonstrates the maximum mean DBP and the age group of 30-39 has the highest correlation between SBP and DBP. Furthermore, it’s worth noting that the age group below 20 years old shows the lowest mean SBP. The maximum and minimum differences in mean SBP among age groups are 15.8 mmHg and 0.8 mmHg, respectively. Likewise, for mean DBP, the maximum difference is 8 mmHg, and the minimum difference is 0.36 mmHg.
| Age | mean | std | mean | std | mod | mod | Correlation |
|---|---|---|---|---|---|---|---|
| SBP | SBP | DBP | DBP | SBP | DBP | ||
| 20 | 116.98 | 15.42 | 69.18 | 10.96 | 110 | 70 | 0.62 |
| 20-29 | 120.57 | 17.90 | 72.18 | 12.55 | 110 | 70 | 0.72 |
| 30-39 | 123.74 | 20.03 | 74.79 | 13.12 | 120 | 70 | 0.74 |
| 40-49 | 126.74 | 21.54 | 75.69 | 13.15 | 120 | 80 | 0.71 |
| 50-59 | 127.54 | 22.17 | 74.24 | 12.79 | 120 | 80 | 0.67 |
| 60-69 | 129.12 | 22.55 | 71.82 | 12.28 | 120 | 70 | 0.62 |
| 70-79 | 131.05 | 22.74 | 69.65 | 12.08 | 130 | 70 | 0.58 |
| 80 | 132.77 | 23.50 | 67.69 | 12.53 | 130 | 70 | 0.54 |
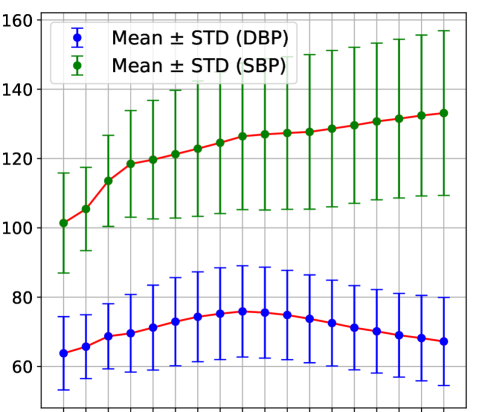
For the analysis of BP variations with increasing age, we plotted the mean BP within age groups at 5-year intervals (Fig. 5). SBP exhibits a continuous increase from birth until the old age, rising from 100 to 135 mmHg. However, DBP exhibits a different trend. It gradually increases during the first 45 years, ranging from approximately 65 to 75 mmHg. Subsequently, it gradually decreases over the next years, reaching about 65 mmHg. Finally, the density plots of age groups at high values of blood pressure exhibit distinct patterns in contrast to those at low values (Fig. 6).
IV Discussion and Conclusion
Our study reveals that, despite males having more BP values than females, there is no significant gender-based difference. Notably, SBP values exhibit an upward trend with age, while DBP follows a distinct pattern, reaching maximum values during the forties. We observe similarities in BP distributions among various race groups. However, a notable limitation in this study is the imbalanced distribution of data across age, gender, and race categories. In all three tables provided in this study, we have information about records with the highest repetitions. An intriguing observation is that the mode BP is significantly biased toward 120/70 mmHg, suggesting that many values are reported without actual measurements The study emphasizes the potential of ML algorithms in unraveling complex relationships between demographic features and contributing to the development of algorithms for personalized BP measurement technology. Despite this potential, the effectiveness of ML depends on access to large-scale, diverse, and high-quality datasets for training models.
References
- [1] World Health Organization, “Cardiovascular Diseases (CVDs),” https://www.who.int/news-room/fact-sheets/detail/cardiovascular-diseases-(cvds), 2021, accessed: 2021-06-21.
- [2] R. Mukkamala, J.-O. Hahn, O. T. Inan, L. K. Mestha, C.-S. Kim, H. Töreyin, and S. Kyal, “Toward ubiquitous blood pressure monitoring via pulse transit time: theory and practice,” IEEE Transactions on Biomedical Engineering, vol. 62, no. 8, pp. 1879–1901, 2015.
- [3] J. P. Kalehoff and S. Oparil, “The story of the silent killer,” Current Hypertension Reports, vol. 22, no. 9, pp. 1–14, 2020.
- [4] B. M. Brenner, D. L. Garcia, and S. Anderson, “Glomeruli and blood pressure: Less of one, more the other?” American Journal of Hypertension, vol. 1, no. 4 Pt 1, pp. 335–347, Oct. 1988. [Online]. Available: https://doi.org/10.1093/ajh/1.4.335
- [5] S. Rastegar, H. GholamHosseini, and A. Lowe, “Non-invasive continuous blood pressure monitoring systems: current and proposed technology issues and challenges,” Physical and Engineering Sciences in Medicine, vol. 43, no. 1, pp. 11–28, 2020.
- [6] S. S. Mousavi, M. A. Reyna, G. D. Clifford, and R. Sameni, “A survey on blood pressure measurement technologies: Addressing potential sources of bias,” 2023. [Online]. Available: https://arxiv.org/abs/2306.08451
- [7] P. K. Whelton, R. M. Carey, W. S. Aronow, D. E. Casey, K. J. Collins, C. D. Himmelfarb, S. M. DePalma, S. Gidding, K. A. Jamerson, D. W. Jones, E. J. MacLaughlin, P. Muntner, B. Ovbiagele, S. C. Smith, C. C. Spencer, R. S. Stafford, S. J. Taler, R. J. Thomas, K. A. Williams, J. D. Williamson, and J. T. Wright, “2017 ACC/AHA/AAPA/ABC/ACPM/AGS/APhA/ASH/ASPC/NMA/PCNA guideline for the prevention, detection, evaluation, and management of high blood pressure in adults,” Journal of the American College of Cardiology, vol. 71, no. 19, pp. e127–e248, May 2018. [Online]. Available: https://doi.org/10.1016/j.jacc.2017.11.006
- [8] K. Sandberg and H. Ji, “Sex differences in primary hypertension,” Biology of Sex Differences, vol. 3, no. 1, p. 7, 2012. [Online]. Available: https://doi.org/10.1186/2042-6410-3-7
- [9] J. F. Reckelhoff, “Gender differences in the regulation of blood pressure,” Hypertension, vol. 37, no. 5, pp. 1199–1208, May 2001.
- [10] Y.-L. Lan and T.-L. Chen, “Prevalence of high blood pressure and its relationship with body weight factors among inpatients with schizophrenia in Taiwan,” Asian Nursing Research, vol. 6, no. 1, pp. 13–18, 2012.
- [11] E. Privšek, M. Hellgren, L. Råstam, U. Lindblad, and B. Daka, “Epidemiological and clinical implications of blood pressure measured in seated versus supine position,” Medicine, vol. 97, no. 31, 2018.
- [12] J. Cui, J. L. Hopper, and S. B. Harrap, “Genes and family environment explain correlations between blood pressure and body mass index,” Hypertension, vol. 40, no. 1, pp. 7–12, 2002.
- [13] A. Vallée, A.-L. Perrine, V. Deschamps, J. Blacher, and V. Olié, “Relationship between dynamic changes in body weight and blood pressure: the ESTEBAN survey,” American Journal of Hypertension, vol. 32, no. 10, pp. 1003–1012, 2019.
- [14] P. P. Giggey, C. R. Wendell, A. B. Zonderman, and S. R. Waldstein, “Greater coffee intake in men is associated with steeper age-related increases in blood pressure,” Am. J. Hypertens., vol. 24, no. 3, pp. 310–315, Mar. 2011.
- [15] B. Bourgeois, K. Watts, D. M. Thomas, O. Carmichael, F. B. Hu, M. Heo, J. E. Hall, and S. B. Heymsfield, “Associations between height and blood pressure in the United States population,” Medicine, vol. 96, no. 50, 2017.
- [16] W. H. Pan, S. Nanas, A. Dyer, K. Liu, A. Mcdonald, J. A. Schoenberger, R. B. Shekelle, R. Stamler, and J. Stamler, “The role of weight in the positive association between age and blood pressure,” American journal of epidemiology, vol. 124, no. 4, pp. 612–623, 1986.
- [17] P. Muntner, D. Shimbo, R. M. Carey, J. B. Charleston, T. Gaillard, S. Misra, M. G. Myers, G. Ogedegbe, J. E. Schwartz, R. R. Townsend et al., “Measurement of blood pressure in humans: a scientific statement from the American Heart Association,” Hypertension, vol. 73, no. 5, pp. e35–e66, 2019.
- [18] R. J. Carrico, S. S. Sun, A. P. Sima, and B. Rosner, “The predictive value of childhood blood pressure values for adult elevated blood pressure,” Open journal of pediatrics, vol. 3, no. 2, p. 116, 2013.