Dark resonance spectra of trapped ions under the influence of micromotion
Abstract
We study the influence of micromotion on the spectrum of trapped ions with a lambda-type level scheme, leading to dark resonances due to coherent population trapping. We work with calcium ions trapped in a ring-shaped Paul trap, in which one can compensate excess micromotion for only one ion of the crystal. We observe that micromotion affects the shapes of the dark resonances and causes the appearance of “echoes” separated by intervals given by the drive frequency. We present a theoretical model that provides good fits to the measurements and can be used to estimate the amplitude of the micromotion modulation of the atomic motion. We estimate an effective temperature of the ions from the spectra and observe clear micromotion heating as well as impaired cooling for sufficiently large excess micromotion.
Keywords: micromotion, trapped ions, atomic spectrum, dark resonance, coherent population trapping, RF heating
I Introduction
Trapped-ion systems are versatile platforms which in the last decades led to the development of quantum technologies such as quantum simulators [1, 2], optical clocks [3, 4, 5, 6], and small-scale prototype quantum computers [7, 8]. They have also served as a platform for the study of fundamental physics at the quantum level and for the search of new physics via precision measurements [9, 10, 11, 12, 13].
Paul traps, and more generally radiofrequency (RF) traps, employ electric RF fields to confine ions in vacuum [14, 15]. The dynamics of the ions within these traps can generally be understood in terms of two contributions: macro or secular motion, and micromotion. For appropriate trap parameters, the oscillating RF field creates an effective static harmonic potential with a characteristic frequency that is much slower than that of the RF field; the movement of the ions due to this effective potential is called secular motion. This motion can be externally controlled by cooling, coherent excitation and preparation of quantum motional states [16]. On the other hand, the oscillating character of the trapping field creates a driven motion at the RF drive frequency, named micromotion. The micromotion amplitude is generally small and, in lowest-order approximation, proportional to the displacement of the ions with respect to the center of the trap, where the RF field vanishes.
As has been shown in the last years, it is possible to use micromotion as a resource to enhance the speed and fidelity of entangling gates in trapped ions [17, 18, 19]. Nevertheless, it remains generally desirable to have low micromotion, for example to achieve efficient ion cooling [20, 21, 22], reduce heating [23, 24], and reduce Doppler related shifts in trapped ion clocks [25, 26]. With this goals in mind, several techniques were developed that allow for the reduction of micromotion, usually referred to as micromotion compensation [27, 28, 29].
Micromotion-related spurious effects are particularly problematic in ion crystals. In this case, the micromotion will affect the ions differently depending on their locations within the trap [30]. The geometry of the trap and the potentials used then determine the possible ion crystal shapes and the properties of the micromotion for each ion. For instance, the linear Paul trap is specially well-suited to work with linear ion chains since ions can be made to lie along an axis of vanishing oscillating field. On the other hand, in three-dimensional (3D) traps like ring traps the RF field vanishes at only one point in space, so excess micromotion can at best be fully compensated for a single ion.
Micromotion has important modulation effects in the atomic spectra of ions, which are different depending on the width of the relevant spectral features. Considering that the typical drive frequency in RF traps is usually in the MHz regime, micromotion will be reflected either as broadening of the spectral lines, or echoes at the drive frequency, depending on whether the width of the spectral lines is wider or narrower than the drive frequency, respectively. The first case is typical of dipole transitions, and its effects are commonly used to compensate excess micromotion. The procedure consists in driving a fluorescence transition with a detuning equal to the drive frequency and minimizing the fluorescence when varying the voltage of several electrodes. This reduces the micromotion, which in turn sharpens the spectrum [31]. On the other hand, for narrow transitions like quadrupolar or stimulated Raman transitions, the spectral lines are replicated as smaller echoes separated by the drive frequency [32, 33].
A mixed behavior between these two regimes can be found in dark resonance spectra, which we study in detail in this article. The atomic spectra of atoms with lambda-type level schemes present narrow negative peaks, known as dark resonances, when the detunings of the lasers that drive the transitions from the lower states to the excited one are similar. This is due to coherent population trapping (CPT) phenomena [34, 35, 36]. The widths of the dark resonances are typically much smaller than those of dipolar transitions.
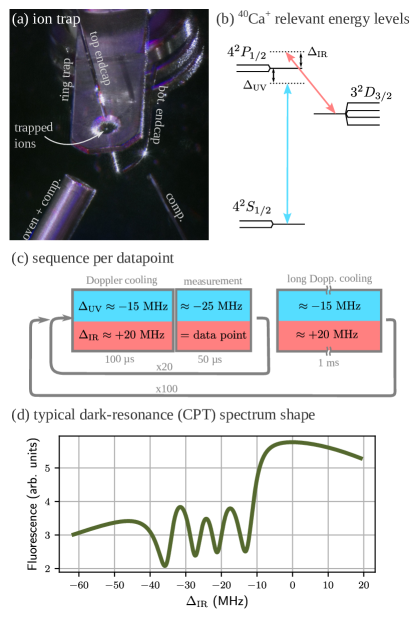
For multi-level systems, many dark resonances can emerge depending on the polarizations of the lasers and the geometry of the optics. A typical dark resonance spectrum is shown in Fig. 1(d), where the polarizations are such that four dark resonances emerge. The widths are related to the product of the two Rabi frequencies and the dephasing mechanisms at work, and reach values of up to a few MHz. For these spectra, the micromotion will manifest as a mixture of further broadening of the already broad main line together with echoes of the dark resonances which appear as dips within the main line.
In this paper we present a detailed study of the effects of micromotion in dark resonance spectra in trapped ions. We work with 40Ca+ ions confined in a 3D ring-shaped Paul trap. By displacing a single ion within the trap we measure its dark resonance spectrum under different micromotion conditions. We show how to retrieve the modulation factor of the ion using a theoretical model to fit the spectra. We also estimate an effective temperature of the ion, evidencing the presence of an additional heating mechanism due to micromotion known as RF heating [37, 38]. Moreover, we measure the spectra of more than one ion at the same time and retrieve the modulation factor of each ion through a fit to the model for the full measurement.
The paper is organized as follows. In Sec. II we present the experimental setup and the measurement algorithm as well as the compensation scheme. In Sec. III we show how to calculate dark resonance spectra with and without micromotion. In Sec. IV we present results for micromotion-modulated spectra with a single ion and analyze how it alters the final temperature of the ion. Finally, in Sec. V we present results on dark resonance spectra for two ions and study how to model the sum of their spectra.
II Experimental setup and compensation scheme
We perform our experiments with singly-ionized 40Ca atoms trapped in a 3D ring-shaped Paul trap, as shown in Fig. 1(a). The ions sit at the center of the ring-shaped electrode, set to a voltage of V oscillating at 22.1 MHz which is responsible for the radial trapping. The axial confinement, on the other hand, is produced by two endcaps, top and bottom, with V each. One extra electrode located below the trap is used to compensate the position of the ion. The oven, which is the source of neutral 40Ca atoms, is also used as an additional electrode for compensation. In this work, we will vary the voltage of the top endcap electrode to controllably add micromotion to the ions.
The calcium ion of interest has a multi-lambda type electronic level system, schematized in Fig. 1(b). The two ground 42S1/2 states are connected through a dipole transition near 397 nm (which we label UV for “ultraviolet”) to two excited 42P1/2 states, with a lifetime of ns [39]. From this P level, the ion has a probability of 0.94 to decay back to the S states, and a probability of 0.06 to decay to one of the four metastable 32D3/2 states [40, 41]. These metastable states are connected to the excited ones through another dipolar transition near 866 nm (labelled IR for “infrared”). A closed fluorescence cycle, which avoids pumping to dark metastable states, is established through the UV and IR lasers together with an additional magnetic field [42]. The polarizations of the lasers are set to be linear and orthogonal to the magnetic field which has a magnitude of G. Then both lasers have polarization in the atomic (magnetic) eigenbasis of the ion. In such a configuration, the atomic spectrum will show four dark resonances, as in Fig. 1(d).
We measure atomic spectra by collecting scattered ultraviolet light of the ion for different values of IR detuning while keeping the UV detuning fixed. To ensure that the temperature of the ion is the same for all data points, we perform a pulsed algorithm where we interleave cooling and detection [43, 44]. A scheme of the algorithm is represented in Fig. 1(c). We start by performing a Doppler cooling stage for 100 s with the UV laser red-detuned around MHz and the IR laser blue-detuned around MHz. With these cooling parameters, which we use for all measurements, we prepare the ion in a thermal state at a temperature close to the Doppler limit for a single well-compensated ion. After this, we switch to MHz and to the measurement value and collect the scattered light of the ion for 50 s. This time interval is chosen so that the scattering does not affect significantly the temperature of the ion. We repeat this sequence 20 times, and then perform a longer Doppler cooling stage of 1 ms to avoid excess heating of the ion and to remedy heating from other extreme events such as background gas collisions. Each sub-loop is repeated 100 times to reduce statistical uncertainties. Each datapoint then consists of 2000 measurements.
In order to compensate excess micromotion for a single ion we use the DC endcaps, one compensation electrode and the atom oven, located below the trap. For the compensation we use the following algorithm. First, we set MHz and , where is the drive frequency. Then, we manually sweep the voltage of each compensation electrode and look for a minimum of the fluorescence. This reduces the power in the first-order modulation sideband of the UV spectrum, hence finding the position of the ion with minimum micromotion along the propagation direction of the UV laser [25]. In order to do a full 3D compensation, this procedure should be iterated with three different lasers coming from from three different directions, ideally orthogonal between them, finding a global minimum. For the experiments presented in this paper, we only compensate the ion in two directions.
III Dark resonance spectra with micromotion
In this section we present measurements of dark resonance spectra including micromotion effects. We then introduce a theoretical model that fits the measurements and subsequently describe how to retrieve relevant experimental parameters with it.
III.1 Experimental spectra
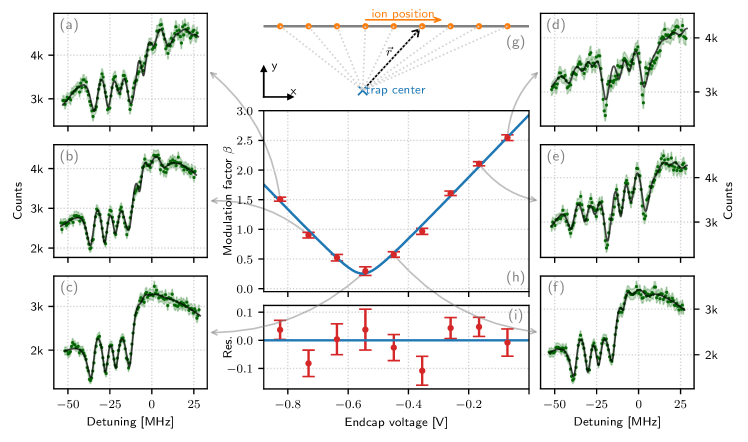
We measure the dark resonance spectra of a single ion for different positions in the ion trap where it is subjected to varying degrees of micromotion. As we vary the potential applied to the top endcap electrode, , the ion is displaced to different positions with respect to the center of the trap following a straight line, as shown at the sketch in Fig. 2(g). When the ion is closer to the center we expect it to experience less micromotion than when it is further away. For each position a spectrum was measured and the modulation factor was determined by a fit of the model. Some representative spectra are shown in Figs. 2(a)-(f). The one with the least micromotion, when the ion is closest to the center of the trap, corresponds to Fig. 2(c). There, the four fundamental dark resonances can be identified. Further away from the center, when micromotion is more pronounced, echoes of the four fundamental resonances appear in the spectrum, as can be seen in the other subplots.
For all spectra in Fig. 2, the data are plotted along with fits to a model which considers micromotion. In the following subsection we show how to build such a formalism, which adds a modulation at the drive frequency in the atomic spectra. This allows us to retrieve a modulation factor that quantifies the amount of micromotion in the ion, as well as the temperature of the ion.
III.2 Numerical calculation of spectra including micromotion
To calculate the spectra including micromotion effects we closely follow [43] and [45], in which similar theoretical approaches were developed. To model the atomic dynamics of the full eight-level system interacting with the two lasers, we resort to a master equation of the form
| (1) |
Here, is the density matrix of the system, is the Hamiltonian of the eight-level system interacting with the two lasers under the rotating wave approximation in the frame rotating with the lasers, and is a Lindblad superoperator that models the spontaneous emission from the upper levels into the two lower manifolds, as well as finite laser linewidths and thermal motion as described in [46].
To include micromotion in the dynamics, we consider the Doppler shift that the ion experiences due to its periodic motion with respect to the beams. This can be treated by adding the corresponding Doppler shift to the detuning of each laser for the ion at rest, , as
| (2) |
where IR,UV, is the wave vector of the corresponding laser, is the drive frequency and is the instantaneous velocity of the atom, considering only the contribution due to micromotion. The magnitude of is proportional to the displacement of the ion from the trap center. Motion due to thermal effects is introduced in the following section.
We define a dimensionless modulation factor for each beam as
| (3) |
which quantifies the strength of micromotion effects [27]. It is important to note that the value of depends on the product between the wavevector of the corresponding beam and the driven ion motion. As in our case both beams are co-propagating, we have that . Therefore only one of the needs to be specified as a free parameter in the mathematical model. For the sake of simplicity we refer to and use it as the free parameter that quantifies the micromotion.
The explicit time-dependence of the dynamics is treated through a Floquet-like approach, where we map the master equation to a Liouvillian equation of the form
| (4) |
where is the vectorized form of and is a Liouvillian superoperator in the corresponding matrix form. This can in turn be written as
| (5) |
where is the Liouvillian for the system without modulation, and is a matrix with constant elements [45].
For the trivial case where , i.e. without micromotion, the steady state can be found by inverting with a normalization constraint over . We calculate the atomic spectrum by plotting, as a function of the detuning , the sum of the populations of the two excited P states , which is proportional to the fluorescence of the ion. The plot of Fig. 1(d) was calculated in this way, and exhibits the four expected dark resonances.
If , the atomic populations will oscillate around a mean value with frequency components that are multiples of . This will be reflected in the spectrum as modulation sidebands displaced from the original dips by integer multiples of . To obtain the time-averaged value of the populations, we propose a solution for times longer than all transient times of the system [41] with the form
| (6) |
When introducing this ansatz into Eq. (4), we get the recursive relation
| (7) |
We are interested in obtaining , i.e. the mean value of . To do so, we define two operators of the form
| (8) |
| (9) |
It is straightforward to see that for and for , so the defined operators act as raising and lowering operators respectively, in the sense that they relate components that oscillate at neighbouring frequencies.
In terms of these operators, we can evaluate Eq. (7) for and obtain
| (10) |
Finally, to calculate we truncate the sum in Eq. (6) such that . This is equivalent to saying that we will include only up to modulation sidebands in the spectrum. The appropriate value of depends on the value of : for larger micromotion, a higher number of sidebands will appear, and a higher will be required to properly describe the atomic spectra. One can choose by imposing that the Bessel function is negligible for . Nevertheless, setting is sufficient for all practical considerations. For all fits in this work, we set , since never surpassed that value in our experiments.
III.3 Estimation of the modulation parameter
In Figs. 2(a)-(f) we plot, in solid line, a fit to the model for the six measured spectra, which are shown in green dots along with their uncertainties. The fits are in very good agreement with the measurements, evidencing the robustness of the model to predict how micromotion affects the atomic spectra. From them, we retrieve a value for the modulation factor for each voltage, as well as the temperature of the ion as explained in the next section.
In Fig. 2(h) we show how depends on the endcap voltage . There is an optimal point at V in which is minimum, but not zero. This is due to extra stray fields not compensated in directions that are orthogonal to the one of the endcaps.
Considering that the ion moves along a trajectory that misses the center of the trap while sweeping by an amount of , that its position varies linearly with it, as it is shown in Fig. 2(g), following and the proportionality of with the distance to the center (), the data can be modeled by a hyperbola function of the form
| (11) |
Bringing the inside the square root, the four parameters in the equation above can be grouped and reduced to three in the regression model. The fitted model is plotted in a solid blue line over the experimental data in Fig. 2(h), showing good agreement with the data. From this fit we extract the minimum value of which is . Furthermore, in Fig. 2(i) we plot the residuals of the fit, showing a random dispersion around zero.
IV Micromotion and thermal effects
IV.1 Inclusion of thermal effects in the spectrum
We incorporate the temperature of the ion in the model following the approximation presented in [46], where the effect is accounted for as an additional dephasing term proportional to the square root of , which is added as an extra broadening of the laser linewidths
| (12) |
One can understand this approximation the following way. The Doppler effect generates a shift proportional to . As we are analyzing a two photon transition, we replace for the difference . Because we are considering a thermal state, fluctuates with a standard deviation . This is modelled through stochastic shifts in the frequency of the lasers.
This method implies then two important approximations, the first by only considering two-photon processes, and the second by approximating a Gaussian distribution by a Lorentzian one. The in the denominator of Eq. (12) was chosen because it was found to provide the best approximation. We note, however, that the proportionality factor leading to the best results is generally dependent on the temperature regime of interest as well as on the relevant linewidths. A more detailed analysis of this is beyond the scope of this paper and will the subject of a future publication. Finally, to include in the model, we multiply it by , where }, and add it to the corresponding linewidth of the laser.
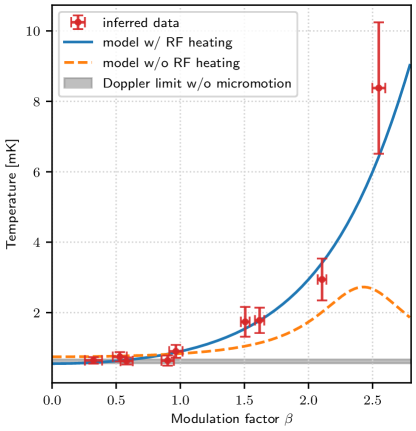
Following this procedure, the ion temperature becomes a parameter that we can retrieve from the fits. The temperatures estimated from the spectra of Fig. 2 are plotted as a function of the modulation factor in Fig. 3. The plot shows a temperature that is approximately constant and close to the Doppler limit for . For larger micromotion, the temperature exhibits a significant boost upon increasing . To understand this behavior, we now characterize the RF heating that the ion experiences and add this effect to the equation describing the thermalization of the ion.
IV.2 Thermalization in the presence of micromotion
When the ion is close to the Doppler temperature, the equation determining the energy balance under laser cooling is
| (13) |
where represents the Doppler cooling mechanism due to the interaction of the atom with the lasers, is the recoil heating due to the random emission of one photon of the atom, and is the RF heating. In the following, we show how to calculate the three terms separately.
IV.2.1 Doppler cooling
Doppler cooling works as a dissipation channel [47]. It acts on the ion through a force of the form
| (14) |
where is the wave vector of the Doppler cooling laser, is the linewidth of the cooling transition, and is the excited state population, that is modulated by the micromotion. We will approximate the dynamics by a two-level system corresponding to the SP transition which is the most relevant for the Doppler cooling. Thus, all laser parameters in this subsection will correspond to the UV laser.
In the low saturation limit we can express the excited state population using Bessel functions as [20]
| (15) |
where is the electric dipole moment of the transition and is the electric field of the laser. To include the motion of the atom, we will consider low velocities such that , where is the wave vector of the cooling laser. We can then approximate
| (16) |
Considering that since the atom is trapped in a harmonic potential, the cooling power turns to be
| (17) |
where is the velocity of the ion projected in the direction of . Finally, assuming a thermal state we relate the mean value of the squared of the velocity with the temperature as . In this form, we can write in terms of the temperature of the ion.
IV.2.2 Recoil heating
Recoil heating is a mechanism that balances Doppler cooling leading to a non-vanishing temperature limit. It is due to the spontaneous emission of a photon when the atom is excited, which causes a recoil kick of the atom in a random direction. The rate of heating is proportional to the energy of the emitted photon, the decay rate and the emission probability linked to the excited state population , resulting in
| (18) |
IV.2.3 RF heating
The RF heating mechanism is given by electric noise at frequency components of the driving field in , where is a secular frequency of the ion. This causes a periodic ponderomotive noise force at that adds extra heating. In [38], the resulting RF heating rate was shown to scale as
| (19) |
Here, we are using that the electric field is approximately linear in the ion displacement from the trap center, and that the modulation factor is also proportional to this displacement. We can then express the rate for RF heating as
| (20) |
where is a factor that depends on experimental parameters like the amount of electric noise. Therefore, it is a quantity that must be estimated from the measurements.
IV.2.4 Stationary temperature
Considering all the above contributions one can find the stationary value of by setting . The expression for the temperature then becomes
| (21) |
If we set we obtain , which corresponds to the well-known Doppler limit temperature.
In Fig. 3 we show a fit to Eq. (21) in solid blue line, leaving and as fitting parameters. For comparison, we also include in orange dashed line a fit to the model without RF heating, i.e. setting and leaving as the only fitting parameter. From this last fit, we obtain MHz. However, this model does not properly fit the measurements for . In particular, neglecting RF heating leads to the prediction of a temperature decrease when becomes larger than , in clear contradiction with the experiments.
We can see that the inclusion of the RF heating term captures the increasing behavior of with increasing , in good agreement with the measurements. From this fit we retrieve MHz, consistent with the detuning used to Doppler cool the ion before the measurements.
On the other hand, we obtain J/s. We can rewrite it in terms of a phonon heating rate of one motional mode of the ion [16]. Considering one of the radial modes of the ion, with MHz, the heating rate becomes
| (22) |
This result is in good agreement with other similar measurements of RF heating effects [25].
V Multi-ion spectra
In a final phase of this work, we measure spectra for a system of two ions. The setup used collects the light of all the trapped ions globally on a photo-multiplier tube, not allowing to distinguish each one individually, but allowing fast measurements with low background. The spectra are therefore composed of the light emitted by all ions. As each ion is in a different position in the trap, they will experience different micromotion, and therefore contribute differently to the summed spectrum. We aimed at extracting the modulation factor and temperature of each ion from the global signal.
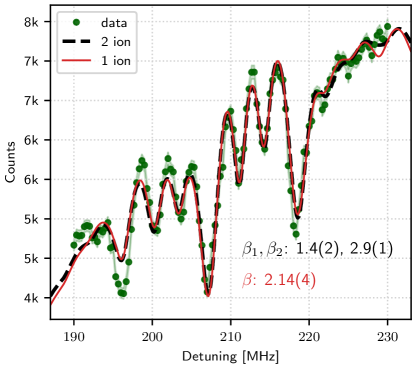
In Fig. 4 we show one typical spectrum for two ions and different model fits. We find that a two-ion model, with an independent modulation factor for each one, adequately fits the data, but the retrieved parameters are very sensitive in their initial guess. Moreover, we see that a one-ion model, with only one , can also produce reasonable fits. Also, we studied the behaviour of the fitted modulation factors as a function of the position of the ion crystal in the trap, and found that the results obtained were also very sensitive to the initialization of the parameters.
We conclude that extracting independent modulation parameters or temperatures for multiple ions from a single signal is an ill-defined problem, with too many free parameters. For an appropriate measurement, independent collection of each ion’s fluorescence would be necessary. This has to be combined with the short collection times (50 s), which ensures that the temperatures of the ions are marginally affected by the measurement. Such a procedure is rather challenging with electron multiplying charge-coupled devices (EMCCDs) or complementary metal–oxide–semiconductor (CMOS) cameras, but multi-pixel photomultiplier tubes, avalanche photodiode detectors or photon counting cameras could provide useful alternatives.
VI Conclusions
We have analyzed the effects of micromotion in dark-resonance atomic spectra. We presented experimental results obtained with a single trapped calcium ion for which the amplitude of the RF-driven motion was varied applying a controllable voltage to one trap electrode. We introduced a theoretical model that accurately describes the corresponding spectra, and used it to fit our measurements. From these fits, we were able to retrieve the micromotion modulation factor of each curve.
The same fits were used to estimate the temperature of the ion under different micromotion amplitudes. Our results evidence the presence of a micromotion-induced heating mechanism, also known as RF heating. We include this phenomenon in the standard description of Doppler cooling and show that it leads to good predictions of the final temperature of the ion depending on the value of the micromotion modulation parameter.
These methods could be used to study heat transport in trapped ion systems where excess micromotion is unavoidable due to crystal geometry, for example 2D crystals in linear traps. However, we note that a proper description of the dynamics of several ions requires single-ion detection. Indeed, our studies of the spectra obtained by collecting the light emitted by two ions together indicate that global light collection is not sufficient for a good characterization of the motional state.
Data availability statement
The original contributions presented in the study are included in the article; further inquiries can be directed to the corresponding author.
Author contributions
CTS and NANB were responsible for planning the research objectives an goals. NANB, ML and MB were responsible for carrying out the experiments and for the analysis of the measured data. NANB developed the numerical models together with MB and CC. The theoretical methods were supervised by CTS and CC. ML was in charge of producing the final figures. NANB was in charge of writing the article, with contributions from all authors who approved the submitted version.
Funding
NANB, MB, ML and CTS acknowledge support for grants PICT2018-03350, PICT2019-04349 and PICT2021-I-A-01288 from ANPCyT (Argentina) and grant UBACYT 2018 Mod I - 20020170100616BA from Universidad de Buenos Aires. CC acknowledges funding from grant PICT 2020-SERIEA-00959 from ANPCyT (Argentina).
Acknowledgements
We acknowledge the contribution of M. Drechsler in the building of the ion trap and early experiments. We thank F. Schmidt-Kaler for his invaluable support and generosity, as well as J. P. Paz for his unconditional help in the setting up of the laboratory. Finally, we thank F. Meconi for taking the photo of Fig. 1(a).
Conflict of interest
The authors declare that the research was conducted in the absence of any commercial or financial relationships that could be construed as a potential conflict of interest.
References
- Porras and Cirac [2004] D. Porras and J. I. Cirac, Effective quantum spin systems with trapped ions, Physical review letters 92, 207901 (2004).
- Friedenauer et al. [2008] A. Friedenauer, H. Schmitz, J. T. Glueckert, D. Porras, and T. Schätz, Simulating a quantum magnet with trapped ions, Nature Physics 4, 757 (2008).
- Rosenband et al. [2008] T. Rosenband, D. Hume, P. Schmidt, C.-W. Chou, A. Brusch, L. Lorini, W. Oskay, R. E. Drullinger, T. M. Fortier, J. E. Stalnaker, et al., Frequency ratio of Al+ and Hg+ single-ion optical clocks; metrology at the 17th decimal place, Science 319, 1808 (2008).
- Chwalla et al. [2009] M. Chwalla, J. Benhelm, K. Kim, G. Kirchmair, T. Monz, M. Riebe, P. Schindler, A. Villar, W. Hänsel, C. Roos, et al., Absolute frequency measurement of the Ca+ 40 4 s S 1/2 2- 3 d D 5/2 2 clock transition, Physical review letters 102, 023002 (2009).
- Chou et al. [2010] C.-w. Chou, D. Hume, J. Koelemeij, D. J. Wineland, and T. Rosenband, Frequency comparison of two high-accuracy Al+ optical clocks, Physical review letters 104, 070802 (2010).
- Huntemann et al. [2012] N. Huntemann, M. Okhapkin, B. Lipphardt, S. Weyers, C. Tamm, and E. Peik, High-accuracy optical clock based on the octupole transition in Yb+ 171, Physical Review Letters 108, 090801 (2012).
- Cirac and Zoller [1995] J. I. Cirac and P. Zoller, Quantum computations with cold trapped ions, Physical review letters 74, 4091 (1995).
- Blatt and Wineland [2008] R. Blatt and D. Wineland, Entangled states of trapped atomic ions, Nature 453, 1008 (2008).
- Safronova et al. [2018] M. Safronova, D. Budker, D. DeMille, D. F. J. Kimball, A. Derevianko, and C. W. Clark, Search for new physics with atoms and molecules, Reviews of Modern Physics 90, 025008 (2018).
- Shaniv et al. [2018] R. Shaniv, R. Ozeri, M. Safronova, S. Porsev, V. Dzuba, V. Flambaum, and H. Häffner, New methods for testing Lorentz invariance with atomic systems, Physical review letters 120, 103202 (2018).
- Berengut et al. [2018] J. C. Berengut, D. Budker, C. Delaunay, V. V. Flambaum, C. Frugiuele, E. Fuchs, C. Grojean, R. Harnik, R. Ozeri, G. Perez, et al., Probing new long-range interactions by isotope shift spectroscopy, Physical review letters 120, 091801 (2018).
- Keller et al. [2019] J. Keller, D. Kalincev, T. Burgermeister, A. Kulosa, A. Didier, T. Nordmann, J. Kiethe, and T. Mehlstäubler, Probing time dilation in Coulomb crystals in a high-precision ion trap, Physical Review Applied 11, 011002 (2019).
- Counts et al. [2020] I. Counts, J. Hur, D. P. A. Craik, H. Jeon, C. Leung, J. C. Berengut, A. Geddes, A. Kawasaki, W. Jhe, and V. Vuletić, Evidence for nonlinear isotope shift in Yb+ search for new boson, Physical Review Letters 125, 123002 (2020).
- Neuhauser et al. [1980] W. Neuhauser, M. Hohenstatt, P. Toschek, and H. Dehmelt, Localized visible Ba+ mono-ion oscillator, Physical Review A 22, 1137 (1980).
- Paul [1990] W. Paul, Electromagnetic traps for charged and neutral particles, Reviews of modern physics 62, 531 (1990).
- Leibfried et al. [2003] D. Leibfried, R. Blatt, C. Monroe, and D. Wineland, Quantum dynamics of single trapped ions, Reviews of Modern Physics 75, 281 (2003).
- Bermudez et al. [2017] A. Bermudez, P. Schindler, T. Monz, R. Blatt, and M. Müller, Micromotion-enabled improvement of quantum logic gates with trapped ions, New Journal of Physics 19, 113038 (2017).
- Ratcliffe et al. [2020] A. K. Ratcliffe, L. M. Oberg, and J. J. Hope, Micromotion-enhanced fast entangling gates for trapped-ion quantum computing, Physical Review A 101, 052332 (2020).
- Gaebler et al. [2021] J. Gaebler, C. Baldwin, S. Moses, J. Dreiling, C. Figgatt, M. Foss-Feig, D. Hayes, and J. Pino, Suppression of midcircuit measurement crosstalk errors with micromotion, Physical Review A 104, 062440 (2021).
- DeVoe et al. [1989] R. DeVoe, J. Hoffnagle, and R. Brewer, Role of laser damping in trapped ion crystals, Physical Review A 39, 4362 (1989).
- Cirac et al. [1994] J. Cirac, L. Garay, R. Blatt, A. Parkins, and P. Zoller, Laser cooling of trapped ions: The influence of micromotion, Physical review A 49, 421 (1994).
- Sikorsky et al. [2017] T. Sikorsky, Z. Meir, N. Akerman, R. Ben-Shlomi, and R. Ozeri, Doppler cooling thermometry of a multilevel ion in the presence of micromotion, Physical Review A 96, 012519 (2017).
- Turchette et al. [2000] Q. A. Turchette, B. King, D. Leibfried, D. Meekhof, C. Myatt, M. Rowe, C. Sackett, C. Wood, W. Itano, C. Monroe, et al., Heating of trapped ions from the quantum ground state, Physical Review A 61, 063418 (2000).
- Brouard and Plata [2001] S. Brouard and J. Plata, Heating of a trapped ion by random fields: The influence of the micromotion, Physical Review A 63, 043402 (2001).
- Keller et al. [2015] J. Keller, H. L. Partner, T. Burgermeister, and T. Mehlstäubler, Precise determination of micromotion for trapped-ion optical clocks, Journal of Applied Physics 118, 10.1063/1.4930037 (2015).
- Ludlow et al. [2015] A. D. Ludlow, M. M. Boyd, J. Ye, E. Peik, and P. O. Schmidt, Optical atomic clocks, Reviews of Modern Physics 87, 637 (2015).
- Berkeland et al. [1998] D. Berkeland, J. Miller, J. C. Bergquist, W. M. Itano, and D. J. Wineland, Minimization of ion micromotion in a Paul trap, Journal of applied physics 83, 5025 (1998).
- Ibaraki et al. [2011] Y. Ibaraki, U. Tanaka, and S. Urabe, Detection of parametric resonance of trapped ions for micromotion compensation, Applied Physics B 105, 219 (2011).
- Higgins et al. [2021] G. Higgins, S. Salim, C. Zhang, H. Parke, F. Pokorny, and M. Hennrich, Micromotion minimization using Ramsey interferometry, New Journal of Physics 23, 123028 (2021).
- van Mourik et al. [2022] M. W. van Mourik, P. Hrmo, L. Gerster, B. Wilhelm, R. Blatt, P. Schindler, and T. Monz, rf-induced heating dynamics of noncrystallized trapped ions, Physical Review A 105, 033101 (2022).
- Pruttivarasin et al. [2014] T. Pruttivarasin, M. Ramm, and H. Häffner, Direct spectroscopy of the 2S1/2- 2P1/2 and 2D3/2- 2P1/2 transitions and observation of micromotion modulated spectra in trapped 40Ca+, Journal of Physics B: Atomic, Molecular and Optical Physics 47, 135002 (2014).
- Peik et al. [1999] E. Peik, J. Abel, T. Becker, J. Von Zanthier, and H. Walther, Sideband cooling of ions in radio-frequency traps, Physical Review A 60, 439 (1999).
- Goham and Britton [2022] C. J. Goham and J. W. Britton, Resolved-sideband micromotion sensing in Yb+ on the 935 nm repump transition, AIP Advances 12, 10.1063/5.0128113 (2022).
- Arimondo and Orriols [1976] E. Arimondo and G. Orriols, Nonabsorbing atomic coherences by coherent two-photon transitions in a three-level optical pumping, Nuovo Cimento Lettere 17, 333 (1976).
- Gray et al. [1978] H. Gray, R. Whitley, and C. Stroud, Coherent trapping of atomic populations, Optics letters 3, 218 (1978).
- Vanier [2005] J. Vanier, Atomic clocks based on coherent population trapping: a review, Applied Physics B 81, 421 (2005).
- Blümel et al. [1989] R. Blümel, C. Kappler, W. Quint, and H. Walther, Chaos and order of laser-cooled ions in a Paul trap, Physical Review A 40, 808 (1989).
- Kalincev et al. [2021] D. Kalincev, L. Dreissen, A. Kulosa, C. Yeh, H. Fürst, and T. Mehlstäubler, Motional heating of spatially extended ion crystals, Quantum Science and Technology 6, 034003 (2021).
- Hettrich et al. [2015] M. Hettrich, T. Ruster, H. Kaufmann, C. Roos, C. Schmiegelow, F. Schmidt-Kaler, and U. Poschinger, Measurement of dipole matrix elements with a single trapped ion, Physical Review Letters 115, 143003 (2015).
- Ramm et al. [2013] M. Ramm, T. Pruttivarasin, M. Kokish, I. Talukdar, and H. Häffner, Precision measurement method for branching fractions of excited P 1/2 states applied to Ca+ 40, Physical review letters 111, 023004 (2013).
- Barreto et al. [2023a] N. A. N. Barreto, L. T. Giardino, C. J. Crucianelli, M. Bonetto, M. Drechsler, and C. T. Schmiegelow, Transient fluorescence with a single trapped ion, JOSA B 40, C48 (2023a).
- Barreto et al. [2023b] N. A. N. Barreto, C. Cormick, and C. T. Schmiegelow, Polarization vs. magnetic field: competing eigenbases in laser-driven atoms, arXiv preprint arXiv:2310.18525 (2023b).
- Barreto et al. [2022] N. A. N. Barreto, M. Drechsler, and C. T. Schmiegelow, Three-laser coherent population trapping in a multi- system: theory, experiment, and applications, Physical Review A 106, 053708 (2022).
- Reiß et al. [2002] D. Reiß, K. Abich, W. Neuhauser, C. Wunderlich, and P. Toschek, Raman cooling and heating of two trapped Ba+ ions, Physical Review A 65, 053401 (2002).
- Oberst [1999] H. Oberst, Resonance fluorescence of single barium ions (master’s thesis, 1999).
- Roßnagel et al. [2015] J. Roßnagel, K. N. Tolazzi, F. Schmidt-Kaler, and K. Singer, Fast thermometry for trapped ions using dark resonances, New Journal of Physics 17, 045004 (2015).
- Yan et al. [2019] L.-L. Yan, S.-L. Su, and M. Feng, Analytical investigation of one-dimensional Doppler cooling of trapped ions with -type configuration, Physical Review A 100, 033418 (2019).