Dark Matter-Electron Scattering Search Using Cryogenic Light Detectors
Abstract
The CSC (cryogenic scintillating calorimeter) technology devoted to rare event searches is reaching the sensitivity level required for the hunt of dark matter-electron scatterings. Dark matter-electron interactions in scintillating targets are expected to stimulate the emission of single photons, each of energy equal to the target electronic band gap. The electronic band gap in scintillators like NaI/GaAs is of (eV). The search for this signal can be done by an array of cryogenic light detectors with eV/sub-eV energy resolution. In this work, we describe the detection principle, the detector response and the envisioned detector design to search for dark matter interacting with electrons via the measurement of the scintillation light at millikelvin. First sensitivity projections are provided, which show the potential of this research.
I Introduction
The consistency between the cosmological data and the CDM model [1, 2, 3] strongly points towards the existence of a non-baryonic matter component of our Universe, which requires an extension of the Standard Model of particles [4].
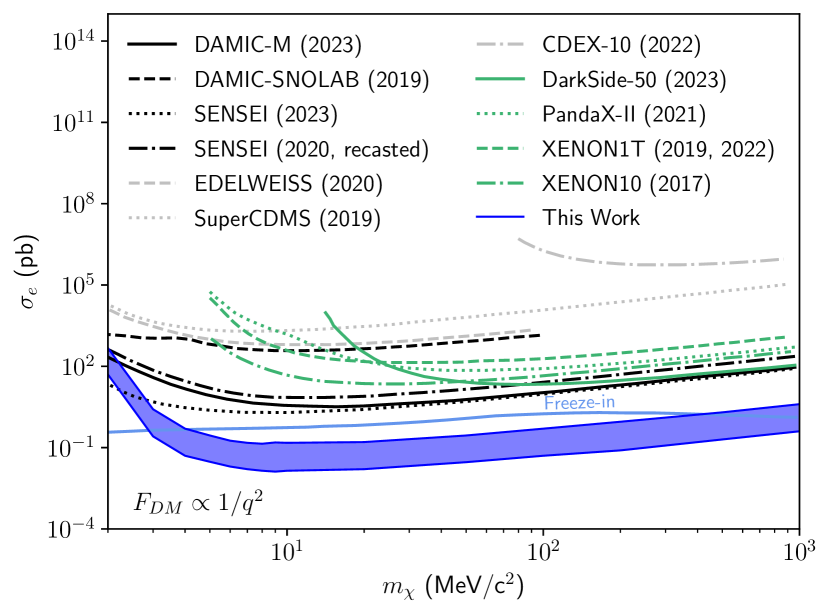
Several theories which predict the interaction of DM with ordinary matter have been proposed (see e.g. [5] for a recent review). Among these, there are models which have successfully predicted the correct relic abundance, with light DM candidates below the GeV scale and a new gauge boson/mediator [6, 7, 8, 9, 10, 11, 12, 13, 14]. For example, the existence of an additional vector particle, a dark photon, acting as mediator to a new particle portal, has been postulated [15] and extensively investigated as possible solution to the DM problem [16, 17, 18, 19, 20]. At the energy scale probed by DM direct detection experiments, the dark photon can generate an effective coupling of DM with electrons, which implies that DM-electron interactions could be observed in such experiments [16, 21, 22, 23, 24]. Models beyond the dark-photon can also produce the same phenomenology [25]. Diverse experimental observations from cosmology, astrophysics and earth-bounded DM direct detection experiments have been used to constrain the coupling and mass parameter space of DM interacting with electrons [26, 27, 28, 29]. DAMIC-M [30], DarkSide-50 [31], EDELWEISS [32], PANDA-X [33], SENSEI [34], SuperCDMS [35] and XENON-1T [36] reached the sensitivity to DM-electron scatterings and are probing this region, providing new constraints. While the sensitivity to DM-nuclei interactions achieved by DM direct detection experiments is such that the neutrino fog is now at the door [37, 38], a large parameter space corresponding to DM-electron interactions is still to be disclosed [39].
In this landscape, the contribution of the experiments based on the cryogenic scintillating calorimeters (CSCs) is missing. CSCs with transition-edge-sensors have been developed for more than three decades by CRESST [40] for the search of DM-nuclei interactions and in the recent years also by COSINUS [41] for the search of DM-nuclei interactions in NaI targets and by NUCLEUS [42] for the search of neutrino-nuclei coherent scatterings. The employment of the CSCs in the search for DM-electron interactions, which was first discussed in [43], requires a dedicated optimized detector design and theoretical framework. A similar effort is underway by the TESSERACT project using GaAs absorbers [24]. In this study, we present preliminary investigations of the detector response and expected signature of the signal in CSCs, as well as on the sensitivity of CSCs to DM-electron interactions in presence of a known monotonically decaying background.
II DM-electron interaction
The theory of DM-electron interactions in direct detection experiments has been extensively studied in the recent years in numerous works [21, 44, 45, 43, 46, 47, 48, 49]. Without delving into the full treatment here, we highlight the most relevant aspects for this work.
The electronic energy levels in scintillators are in a superposition of states which distribute into two continuous bands separated by an energy gap, the valence and the conduction band. The electronic band structure and the electronic wave functions are calculated for each target using density functional theory (DFT) calculations. These functions can be obtained for instance by running the open source software QUANTUM ESPRESSO (QE) [50] and used as inputs to open source codes such as QEdark [44], for the calculation of the DM-electron scattering rates. DarkELF [47] is an open source code that provides the DM-electron scattering rate including the dielectric function to consider in-medium screening effects [51]. EXCEED-DM [52, 53] is also an open source code independent from QE and can receive as input the electronic band structure calculated with any DFT software. It can compute the dielectric function and also include screening effects. Recently, an updated version of QEDark was released, called QCDark [54], which employes a different modelling of the electronic wave function calculation with respect to EXCEED-DM and provides similar results. The band structure of the ordered lattice of inorganic scintillators and semiconductors which are solid state targets (e.g. NaI, GaAs, Si, Ge) is different to the one in noble-gas liquids (e.g. Xe, Ar), where the atoms are treated as isolated systems. In the case of electron inelastic scattering, the energy difference between the final and initial state of the scattered electron is estimated using the conservation of energy,
| (1) |
and it is equal to,
| (2) |
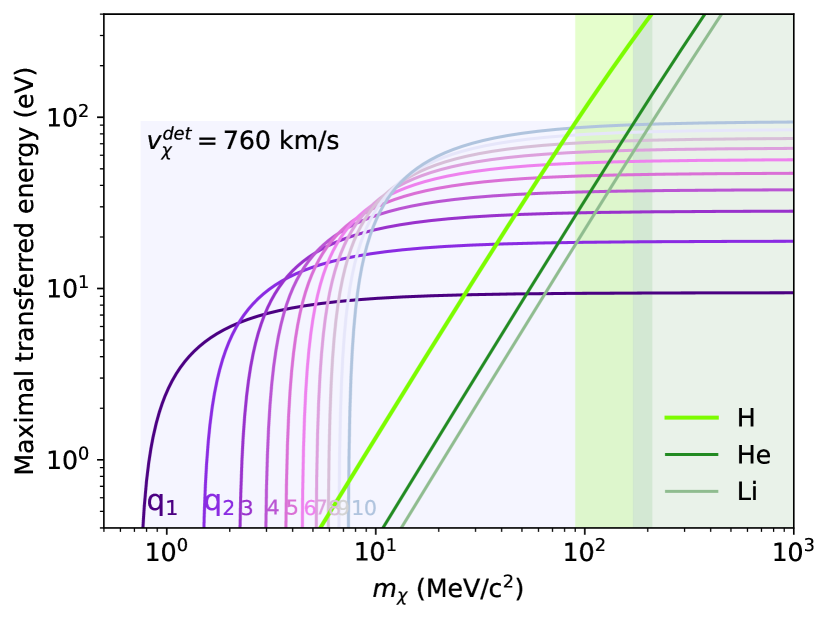
where is the transferred momentum, with p () the DM initial (final) momentum, is the DM mass and is the DM velocity in the detector reference frame. The maximal , corresponding to and calculated for a galactic escape velocity in the detector reference frame, km/s [55], is shown in Fig. 1 as a function of the DM mass, for ten different transferred momenta, , with . In literature [44, 43, 46], the transferred momentum is assumed equal to the electron momentum, because the electron velocity, , with , is larger than the DM velocity, and . Thus, [44], where is the DM-electron reduced mass. Using this approximation, in Fig. 1, we compare the kinematics of DM-scattering off electrons with the one of DM elastic scattering off nuclei as a function of the DM mass. We show that the maximal-energy-transfer can be larger for electronic excitation than for H, He or 6Li nucleus recoils (depicted in solid green), for DM masses below about 90 MeV/c2, 170 MeV/c2 and 210 MeV/c2, respectively. Helium and 6Li are the lightest target nuclei considered [56] or employed [40] for DM search by the time of this work. It follows that DM-electron scatterings can correspond to larger energy depositions than DM-nuclei scatterings for .
.
The generic rate of electronic excitation from the valence to the conduction band in the crystal is [48],
| (3) |
where the factor 2 comes from spin degeneracy, () is the initial (final) electronic band index, k () the initial (final) wavevector in the first Brillouin zone (BZ), is the volume of the crystal. The rate of electronic transitions is equal to [48],
| (4) | ||||
with the DM number density, () the DM (electron) mass, the DM velocity distribution in the detector reference frame, and the scattering amplitude between the initial and final electron wave functions and , integrated over the electron momenta, averaged over the initial spin states and summed over the final ones. In this notation, can include all possible DM-electron interactions [48]. If we select the first term in Eq. (9) of Ref. [48], in our Eq. 3 corresponds to in Eq. (1) of Ref. [43]. With this selection, the differential rate can be expressed as [43],
| (5) | ||||
is the total number of unit cells, with the mass of one unit cell, is the DM-electron reduced mass, is the velocity distribution integral, contains information on the DM model, for instance it is for heavy mediators () and for ultralight mediators () [44], is the crystal form factor and is defined as,
| (6) |
where is the elastic scattering matrix element of DM and a free electron computed for [44, 43]. As an example, we show in Fig. 2 the differential rate of DM-electron interactions in NaI (in light blue) and Si (in dark yellow) calculated using a python version of QEdark111The Mathematica module of QEDark was re-written as a python notebook to employ all the crystals there provided [44], for (i) , (ii) (solid line) and (dashed line), i.e. equal to the first term in Eq. 9 of Ref [48], (iii) time of the year in the velocity distribution equal to March, (iv) and (v) energy gap and in NaI and Si, respectively [43]. The difference in the rate in NaI and Si comes from the different electronic configurations and band gaps. The DM model is used as a benchmark for comparison with previous studies 222Figure 2 is in agreement with Fig. 4 of [43]..

III Detection principle
III.1 Response of the scintillator
The mechanisms following the primary excitation of an electron into the conduction band induced by DM scattering in scintillators are equivalent to the ones following known scattering processes, thus widely studied. They can be divided in three sub-processes described e.g. in [57],
-
1.
(i) primary excitation, (ii) relaxation by creation of further electron (and hole) excitations, and (iii) thermalization of the produced electrons and holes into electron-hole-pairs of energy roughly equal to the energy gap, ;
-
2.
(i) further relaxation by formation of excitonic states and (ii) energy migration to luminescence centers;
-
3.
luminescence.
The number of scintillation photons produced, , is,
| (7) |
where is the energy of the primary electron, is the energy necessary for the creation of an electron-hole pair at the band gap edge, is the efficiency of migration to luminescence centers and is the yield of the final luminescent process. Note that , for . The electrons lose energy in the thermalization into electron-hole-pair formation, a material-dependent mechanism described by the energy loss function [57, 47].
To the aim of employing the scintillator as a target for DM-electron interactions, the scintillator response to an electron recoil must be studied. Exemplary, the measurement of the energy loss function for the specific crystal, ideally at low energies (below ) and at the operating temperature (), is necessary as the threshold energies for the production of a specific number of scintillation photons, , depend on it. Similarly, experimental studies, ideally at the energy and temperature of interest, of the parameters and are required to perform an actual energy and detector efficiency reconstruction. In the following we fix for , and , with , for , according to [21]. Under this assumption, the list of threshold energies is for the production of scintillation photons, respectively.
III.2 Observables
CSCs employed for rare event searches [41, 40, 42] are realized by combining a scintillating target crystal with good phonon propagation properties (e.g. with high Debye temperature, low impurity concentration and lattice defects, polished surfaces) with a second crystal absorbing the scintillation light of the target. The target crystal is coupled to a sensitive thermometer to measure the phonon signal generated by the primary interaction in the target (phonon detector). The scintillation light absorbed by the second crystal is measured using a thermometer placed on its surface; the absorber of the scintillation and its sensor constitute the cryogenic light detector. The double channel readout of phonon and light is a successful technique to perform particle identification and electromagnetic background rejection on an event-by-event basis in the search for DM-nucleus interactions [40, 41]. The energy measured in the phonon channel gives a measure of the total deposited energy in the target. The coincident energy measured in the light channel depends on the type of interaction (electromagnetic vs elastic nuclear recoil). The ratio of the two energies, , enables event-by-event particle discrimination.
The ensemble of scintillating absorber and light detector is extremely suitable for investigating the presence of DM-electron interactions in DM direct search experiments. Indeed, scintillators are characterized by electronic band gaps of . The primary DM-electron interaction described in Sec. II is expected to trigger the scintillation process, thus the emission of photons of energy equal to the band gap size, [43]. The observable would be single photon peaks, detectable with a cryogenic light detector with eV/sub-eV energy resolution.
In ref. [43], the light detector is an array of sensors placed on the target surface itself, a suitable choice to reach the required (eV) energy threshold. However, in such layout the expected background from the target scales with the target size, and consequently, with the exposure to the signal. By separating the light detector from the scintillator, the background can be mitigated by decreasing the mass of the light detector without affecting the exposure. The configuration of the CSCs optimized for the DM-nucleus scattering search fulfills this requirement, but the required sensitivity of the cryogenic light detectors was not yet demonstrated when this idea was first proposed.
Recently, the sensitivity to DM-electron interactions has been shown to be in reach of cryogenic light detectors read out with transition-edge-sensors: the first single photon detection in a CRESST light detector was, indeed, proven [58]. Inspired by Refs. [43] and [58], here we propose to optimize the cryogenic light detectors which are already operated in several cryogenic calorimeters [41, 40, 42] and employ them for the detection of single photons emitted after primary DM-electron interactions in scintillating target crystals.
The expected energy in the light () and phonon () detectors, under the assumption that the energy not converted into scintillation is converted into phonons, are,
| (8) |
We recall that is defined in Eq. 7, where is the threshold energy for the creation of an electron-hole pair at the band gap edge, is the electronic energy gap, is the energy of the primary electron and the relation among these that we consider is for , and , with , for , according to [21]. Following the assumptions on the scintillator response given in Sec. III.1, the number of emitted photons, , which corresponds to the number of created electron-hole pairs, is,
| (9) |
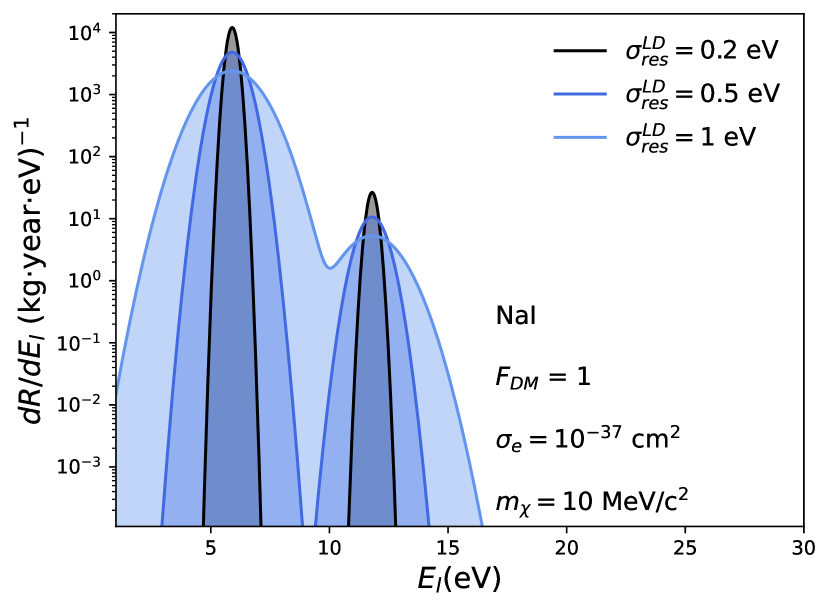
The signature of DM-electron interactions in a light detector with gaussian energy resolution, , is peaks centered at multiple energies of , as shown in Fig. 3, for and eV (black, blue and light-blue, respectively). This plot is obtained using the same DM model as in Fig. 2, the energy gap , the ideal assumption of scintillation and collection efficiency equal to 1 and zero background (the role of the background is discussed later). The performance scenarios for the energy resolution are based on the state-of-the-art cryogenic light detectors. Exemplary, CRESST-III has achieved the high baseline resolution of 1.0 eV in a silicon-on-sapphire (SOS) light detector [58]. We assume that the total energy not converted into scintillation converts entirely into phonons.
III.3 DM mass estimation
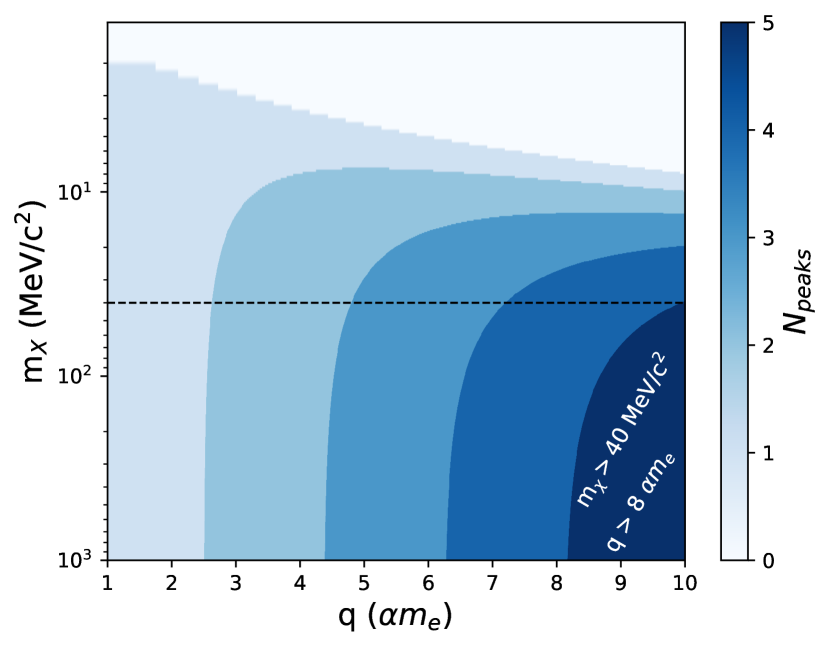
When fixing the detector response parameters and in Eq. 7, the number of emitted scintillation photons depends on the transferred momentum, , and the DM mass, . For a specific DM mass, the spectrum of energy of the recoiling electron is a series of peaks seen in the light channel. Considering the uncertainty on the primary electron momentum, a quantity which allows to estimate the range of DM masses compatible with the signal is the number of observed peaks in the light detector. This method is shown in Fig. 4, where the number of peaks is depicted using the color map on the right y-axis and estimated as a function of the DM mass and transferred momentum. For instance, if five peaks were observed, using Fig. 4 it would be possible to conclude that the DM particle mass is larger than about 40 MeV/c2 (dark blue region) and transferred momenta above are feasible. We find that an extremely sensitive phonon detector with resolution better than (eV), could help to improve the estimation of the DM mass. This is shown in Fig. 5. We plot as a function of the DM mass the number of peaks in the light channel on the left y-axis (the steps depicted as shaded regions) and the maximal energy in the phonon channel on the right y-axis (the solid lines, calculated for ). Using the previous example, if five peaks were observed, the maximal energy measured in the phonon channel in coincidence to the events in the fifth peak of the light channel, would correspond to a specific DM mass, as visible in Fig. 5.

III.4 Envisioned Detector Design
Modifications to the CSC design state-of-the-art must be conceived to optimize the detectors for the DM-electron interaction search. To maximize the scintillation collection efficiency, a full coverage of the target crystal is required. A key rule of calorimetry is that the sensitivity degrades while increasing the heat capacity, thus the calorimeter mass, see e.g. [59]. CRESST-III achieved a baseline resolution of 1 eV with a mm3 silicon-on-sapphire wafer [58]. An array of wafers all equipped with transition-edge-sensors which can be read out as a single channel can provide both the -coverage and the baseline resolution necessary to detect the single photon peaks. Regarding the required performance of the phonon channel, we already showed that a phonon channel with sub-eV baseline resolution can pin down the DM mass after a range of values is identified using the number of peaks detected in the light channel. The detection in coincidence of light and phonon signal can discriminate background events, such as direct hits in the light detector, from the signal. However, one of the strengths of the DM-electron search using CSCs is that the signal spectral shape is single photon peaks, which is different from the spectral shape of the typical backgrounds, which is exponentially decaying. Thus, the readout of the phonon channel is not required for signal detection but only for model selection. It follows that the sensitivity of the phonon channel can be traded with a larger exposure to the signal, that is with an increase of the target mass. In Sec. IV, the expected significance as a function of the exposure will be discussed.
III.5 Method for Energy Gap Measurement at mK
The energy gap between the conduction and valence electronic bands is a characteristic of the scintillator which depends on the atomic composition and other properties, like the presence of impurities or dopants. For the same target material, different energy gap values can be found in literature [43, 60, 61, 62]. Thus, a dedicated measurement of the energy gap of the target employed is crucial for this research. To this aim, we propose to use as temporary light detector a superconducting foil (or a normal-superconducting bilayer) connected to a sensor, for example using the remoTES design [63] or directly a thermometer, e.g. a TES [64]. The requirements for this measurement are a calibrated sensor with sensitivity of (eV) to direct hits and a target with known light yield - we will consider of the total deposited energy in the target for pure NaI crystals, which is the percentage of energy in light detected by the beaker-shaped silicon light detector encapsulating a pure NaI crystal in Ref. [65]. A scheme of the setup is given in Fig. 6.

The superconducting foil is fixed to a copper holder. An X-ray source, e.g. 55Fe which emits 5.9 keV and 6.4 keV from the K- and K- atomic shells, is placed below the other face of the scintillator. A detection of of the deposited energy in form of scintillation light, corresponds to about 780 eV for an average X-ray energy of keV. The goal is to lower the total collection efficiency in the temporary light detector to increase the probability of the single photon detection. In this way, the 1-peak is intensified and the estimation of the mean of the peak is directly the estimation of the energy gap. If multiples of these peaks are also observed, the energy gap estimation can be further refined using the distance between consecutive peaks [58]. For instance, in the configuration of Fig. 3, a detected energy eV would be a good choice, since it is larger than eV and lower than eV. In this way, the temporary light detector is reached by a high rate of single scintillating photons and the mean of the resulting peak is the scintillator energy gap. The single photon detection with a Au-Ir superconducting bilayer was recently demonstrated with a monocromatic source at 850 nm [64]. We propose a similar experiment, tuned to the lower wavelength window of (200-400) nm where the pure NaI scintillation at low temperature is expected, as part of the proof-of-principle of the calibration method. The geometry of the setup in Fig. 6 can be adapted to this purpose by using the following formula,
| (10) |
where is the surface area of the sensor and is the distance of the sensor from the scintillator surface. For a superconducting foil of radius as in Fig. 6, Eq. 10 gives the following relation between the size of the superconducting foil and the required distance from the scintillator,
| (11) |
III.6 Expected Background
The background in searches for DM-electron interactions using CSCs originates both from the scintillating target and from the light detector. Starting from the former, the energy deposited by ionizing radiation, charged and neutral particles in the target, can produce scintillation light, which would distribute in the same peaks as the ones populated by the DM events. All the surroundings (light detector included) can emit particles, mainly photons, interacting in the target and leading to scintillation. The dominant atomic interaction with photons at energies below about 1 keV is the photoelectric absorption [66, 4]. A dedicated simulation of the surroundings is necessary to model the scintillation background and take it into account in a likelihood framework.
The second type of background originates from any type of direct energy deposition in the light detector, since the absorbed light is converted into phonons and then measured by the temperature sensor. The expected background in the light detector currently represents a serious limitation to this experiment. Cryogenic experiments have reached very low energy thresholds (eV). In these energy regions cryogenic calorimeters observe an excess of events, named Low Energy Excess (LEE), which does not have a clear explanation yet [67]. In Fig. 7 we show the photon peaks induced by DM particles of 10 MeV with cm2, as assumed for previous plots, and we add the LEE detected by CRESST-III [68], suppressed by a factor . A milder suppression of the current background of CRESST-III is required to explore a new parameter space, as discussed in Sec. IV, but in Fig. 3 it is emphasized for visualization purposes. An exceptional suppression of the LEE is expected to be required for accessing a new DM-electron parameter space. However, considering the large unexplored region corresponding to light DM particles (c2), the LEE can be less severe for this search than for heavier DM particles. Also, the advantage of the experimental configuration proposed is that the target mass, thus the exposure, can be scaled up freely if the phonon channel is not considered, with no reduction of the detector performance, a novelty for DM search using cryogenic calorimeters.

IV SIGNAL DISCOVERY POTENTIAL
IV.1 Statistical method
The potential for signal discovery is studied using a profile-likelihood (PL)-based test and Monte Carlo (MC) data [69]. The null-hypothesis is the background-only model, the alternative-hypothesis is the signal-plus-background model. Data are labelled as and , if simulated under the null- or the alternative-hypothesis, respectively. The probability density function of signal-plus-background is,
| (12) |
where is the strength parameter, thus the parameter of interest, is fixed (), indicates the nuisance parameters corresponding to the background modelling [68], , and are,
| (13) |
| (14) |
| (15) |
where is the energy range considered. The test statistics used is,
| (16) |
where for and for and is the binned likelihood,
| (17) |
where and is the number of simulated events falling in the -bin. For a fixed DM-mass, several data-sets can be simulated under and the can be calculated for each of them, thus obtaining a distribution of , . However, since is the background-only hypothesis, can be well approximated by a half chi-squared distribution, [69], with one degree of freedom. We verified that the distribution fits well the simulated distribution of for a combination of DM mass and cross-section, and used the analytical equation of a for the . With this approximation, we save the computational cost of the for each cross-section and mass. We then simulated 1000 data-sets under . is fixed by selecting a DM mass in the range and a cross-section, . This latter is treated as a free parameter in the minimization of the negative log-likelihoods in Eq. 17. For each of the 1000 realizations, we compute the . The median, , of the distribution is compared to , where is fixed by the equation,
| (18) |
where is the desired confidence level (CL). If , we can reject the null-hypothesis with CL.
IV.2 Sensitivity projection
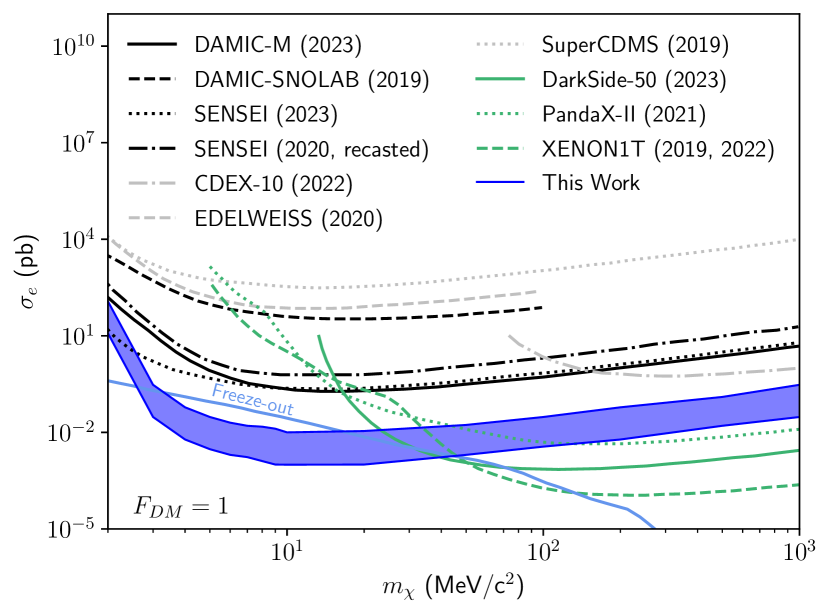
The comparison of and described in the previous section is made by scanning on the cross-section, , in different ranges for the different DM masses, from lower to larger cross-sections. We fix our desired CL to 90%, corresponding to () and check the condition . We label the cross-section of the simulation which satisfies this condition “”, where is the scanning index. We compute a finer scanning between and , using 1000 simulations for each intermediate cross-section and define the discovery limit at the cross-section in this interval which corresponds to the condition , namely to a conservative confidence interval larger than 90%, but lower than 95%. With this method a limit at 90% CL is statistically conservative at the advantage of the computational time. The projection band in Fig. 8 is calculated using a light emission times collection efficiency equal to 0.1 (upper limit) and 1 (lower limit). The background is simulated using in Eq. 14 multiplied by a suppression factor, . We assume that the shape of the background is known, thus we fix the parameters to the estimated values reported in TABLE I of [68] and that we mitigate the total background level by a factor . The result shown in Fig. 8 is obtained for . We chose this value for computational convenience. A higher background level may also be affordable to probe a new parameter space. A mitigation of a factor is, indeed, optimistic. Different groups are focusing their efforts to study and reject this background. The level recorded by CRESST [40] and used here as reference is considered likely to be of the same origin as the ones of other cryogenic experiments and a common effort to reduce it was established [70].
V CONCLUSIONS
The CSCs have been employed so far for the search of DM interacting with nuclei. This work sets the ground for the employment of the CSCs in the search of DM particles interacting with electrons. We show that the phonon-channel is not required for the discovery of the signal, which instead can be detected in the light channel in the form of peaks on top of the expected background. We discuss a method for the measurement of the electronic band energy gap which does not require the installation of an optical window in the cryostat. We also discuss the role of the low energy excess (LEE) observed in all cryogenic detectors on this search and plot a sensitivity curve which shows the potential contribution of the CSCs to the search of DM-electron interactions. This work is a reference for the performance of CSCs required to open a new frontier of research with a very established technology. Developments of these ideas are already ongoing and will be topic of future publications.
Acknowledgements.
We are very grateful to Riccardo Catena, Dominik Fuchs, Gonzalo Herrera, Federica Petricca and Florian Reindl for the interesting discussions related to this study. We additionally thank Riccardo Catena, Dominik Fuchs and Gonzalo Herrera for their comments on a draft of this article, which enriched the final manuscript.References
- Aghanim et al. [2020] N. Aghanim et al., Planck 2018 results-VI. Cosmological parameters, Astronomy & Astrophysics 641, A6 (2020).
- Workman et al. [2022a] R. L. Workman et al. (Particle Data Group), Review of Particle Physics. 24 The Big Bang Nucleosynthesis., PTEP 2022, 083C01 (2022a).
- Peebles [2022] P. J. E. Peebles, Anomalies in physical cosmology, Annals Phys. 447, 169159 (2022), arXiv:2208.05018 .
- Workman et al. [2022b] R. L. Workman et al. (Particle Data Group), Review of Particle Physics, PTEP 2022, 083C01 (2022b).
- Workman et al. [2022c] R. L. Workman et al. (Particle Data Group), Review of Particle Physics. 27 Dark Matter, PTEP 2022, 083C01 (2022c).
- Boehm and Fayet [2004] C. Boehm and P. Fayet, Scalar dark matter candidates, Nuclear Physics B 683, 219 (2004).
- Feng and Kumar [2008] J. L. Feng and J. Kumar, The WIMPless Miracle: Dark-Matter Particles without Weak-Scale Masses or Weak Interactions, Phys. Rev. Lett. 101, 231301 (2008), arXiv:0803.4196 .
- Hooper and Zurek [2008] D. Hooper and K. M. Zurek, A Natural Supersymmetric Model with MeV Dark Matter, Phys. Rev. D 77, 087302 (2008), arXiv:0801.3686 .
- Lin et al. [2012] T. Lin et al., On Symmetric and Asymmetric Light Dark Matter, Phys. Rev. D 85, 063503 (2012), arXiv:1111.0293 .
- Hochberg et al. [2014] Y. Hochberg et al., Mechanism for thermal relic dark matter of strongly interacting massive particles, Physical review letters 113, 171301 (2014).
- Kuflik et al. [2016] E. Kuflik et al., Elastically Decoupling Dark Matter, Phys. Rev. Lett. 116, 221302 (2016), arXiv:1512.04545 .
- Dvorkin et al. [2019] C. Dvorkin et al., Making dark matter out of light: Freeze-in from plasma effects, Phys. Rev. D 99, 115009 (2019).
- Boehm et al. [2021] C. Boehm et al., Scalar dark matter candidates revisited, Physical Review D 103, 075005 (2021).
- Zurek [2024] K. M. Zurek, Dark Matter Candidates of a Very Low Mass 10.1146/annurev-nucl-101918-023542 (2024), arXiv:2401.03025 .
- Holdom [1986] B. Holdom, Two U(1)’s and charge shifts, Physics Letters B 166, 196 (1986).
- An et al. [2015] H. An et al., Direct Detection Constraints on Dark Photon Dark Matter, Phys. Lett. B 747, 331 (2015), arXiv:1412.8378 .
- Mitridate et al. [2021] A. Mitridate et al., Dark matter absorption via electronic excitations, JHEP 09, 123, arXiv:2106.12586 .
- Essig et al. [2013] R. Essig et al., Working Group Report: New Light Weakly Coupled Particles, in Snowmass 2013: Snowmass on the Mississippi (2013) arXiv:1311.0029 .
- Alexander et al. [2016] J. Alexander et al., Dark Sectors 2016 Workshop: Community Report (2016) arXiv:1608.08632 .
- Battaglieri et al. [2017] M. Battaglieri et al., US Cosmic Visions: New Ideas in Dark Matter 2017: Community Report, in U.S. Cosmic Visions: New Ideas in Dark Matter (2017) arXiv:1707.04591 .
- Essig et al. [2012] R. Essig et al., Direct detection of sub-GeV dark matter, Physical Review D 85, 10.1103/physrevd.85.076007 (2012).
- Bloch et al. [2017] I. M. Bloch et al., Searching for Dark Absorption with Direct Detection Experiments, JHEP 06, 087, arXiv:1608.02123 .
- Blanco et al. [2023] C. Blanco et al., Dark matter direct detection with quantum dots, Phys. Rev. D 107, 095035 (2023), arXiv:2208.05967 .
- Essig et al. [2022] R. Essig et al., Snowmass2021 Cosmic Frontier: The landscape of low-threshold dark matter direct detection in the next decade, in Snowmass 2021 (2022) arXiv:2203.08297 .
- Catena et al. [2023] R. Catena et al., Dark matter-electron interactions in materials beyond the dark photon model, JCAP 03, 052, arXiv:2210.07305 .
- Knapen et al. [2017] S. Knapen et al., Light Dark Matter: Models and Constraints, Phys. Rev. D 96, 115021 (2017), arXiv:1709.07882 .
- Chang et al. [2018] J. H. Chang et al., Supernova 1987A Constraints on Sub-GeV Dark Sectors, Millicharged Particles, the QCD Axion, and an Axion-like Particle, JHEP 09, 051, arXiv:1803.00993 .
- Buen-Abad et al. [2022] M. A. Buen-Abad et al., Cosmological constraints on dark matter interactions with ordinary matter, Phys. Rept. 961, 1 (2022).
- Chu and Pradler [2023] X. Chu and J. Pradler, On the minimal mass of thermal dark matter and the viability of millicharged particles affecting 21cm cosmology, (2023), arXiv:2310.06611 .
- Arnquist et al. [2023] I. Arnquist et al. (DAMIC-M), First Constraints from DAMIC-M on Sub-GeV Dark-Matter Particles Interacting with Electrons, Phys. Rev. Lett. 130, 171003 (2023), arXiv:2302.02372 .
- Agnes et al. [2023] P. Agnes et al. (DarkSide), Search for Dark Matter Particle Interactions with Electron Final States with DarkSide-50, Phys. Rev. Lett. 130, 101002 (2023), arXiv:2207.11968 .
- Arnaud et al. [2020] Q. Arnaud et al. (EDELWEISS Collaboration), First germanium-based constraints on sub-mev dark matter with the edelweiss experiment, Phys. Rev. Lett. 125, 141301 (2020).
- Cheng et al. [2021] C. Cheng et al. (PandaX-II), Search for Light Dark Matter-Electron Scatterings in the PandaX-II Experiment, Phys. Rev. Lett. 126, 211803 (2021), arXiv:2101.07479 .
- Barak et al. [2020] L. Barak et al. (SENSEI), SENSEI: Direct-Detection Results on sub-GeV Dark Matter from a New Skipper-CCD, Phys. Rev. Lett. 125, 171802 (2020), arXiv:2004.11378 .
- Agnese and Others [2018] R. Agnese and Others, First dark matter constraints from a supercdms single-charge sensitive detector, Phys. Rev. Lett. 121, 051301 (2018).
- Aprile et al. [2022] E. Aprile et al. (XENON), Emission of single and few electrons in XENON1T and limits on light dark matter, Phys. Rev. D 106, 022001 (2022), arXiv:2112.12116 .
- Akerib et al. [2022] D. S. Akerib et al., Snowmass2021 Cosmic Frontier Dark Matter Direct Detection to the Neutrino Fog, in Snowmass 2021 (2022) arXiv:2203.08084 .
- Aprile et al. [2021] E. Aprile et al. (XENON Collaboration), Search for Coherent Elastic Scattering of Solar Neutrinos in the XENON1T Dark Matter Experiment, Phys. Rev. Lett. 126, 091301 (2021).
- Carew et al. [2023] B. Carew et al., The neutrino fog for dark matter-electron scattering experiments, (2023), arXiv:2312.04303 .
- Angloher et al. [2022] G. Angloher et al. (CRESST), Probing spin-dependent dark matter interactions with 6Li: CRESST Collaboration, Eur. Phys. J. C 82, 207 (2022), arXiv:2201.03863 .
- Angloher et al. [2023a] G. Angloher et al. (COSINUS), Deep-underground dark matter search with a COSINUS detector prototype, (2023a), arXiv:2307.11139 .
- Angloher et al. [2019] G. Angloher et al. (NUCLEUS), Exploring with NUCLEUS at the Chooz nuclear power plant, Eur. Phys. J. C 79, 1018 (2019), arXiv:1905.10258 .
- Derenzo et al. [2017] S. Derenzo et al., Direct Detection of sub-GeV Dark Matter with Scintillating Targets, Phys. Rev. D 96, 016026 (2017), arXiv:1607.01009 .
- Essig et al. [2016] R. Essig et al., Direct Detection of sub-GeV Dark Matter with Semiconductor Targets, JHEP 05, 046, arXiv:1509.01598 .
- Lee et al. [2015] S. K. Lee et al., Modulation Effects in Dark Matter-Electron Scattering Experiments, Phys. Rev. D 92, 083517 (2015), arXiv:1508.07361 .
- Catena et al. [2020] R. Catena, T. Emken, N. A. Spaldin, and W. Tarantino, Atomic responses to general dark matter-electron interactions, Phys. Rev. Res. 2, 033195 (2020), arXiv:1912.08204 .
- Knapen et al. [2022] S. Knapen et al., Python package for dark matter scattering in dielectric targets, Phys. Rev. D 105, 015014 (2022), arXiv:2104.12786 .
- Catena et al. [2021] R. Catena et al., Crystal responses to general dark matter-electron interactions, Phys. Rev. Res. 3, 033149 (2021), arXiv:2105.02233 .
- Hochberg et al. [2021] Y. Hochberg et al., Determining Dark-Matter–Electron Scattering Rates from the Dielectric Function, Phys. Rev. Lett. 127, 151802 (2021), arXiv:2101.08263 .
- [50] QUANTUM ESPRESSO, https://www.quantum-espresso.org.
- Ashcroft and Mermin [1978] N. W. Ashcroft and N. D. Mermin, Solid State Physics (Holt, Rinehart and Winston, New York, 1978).
- Griffin et al. [2021] S. M. Griffin et al., Extended calculation of dark matter-electron scattering in crystal targets, Phys. Rev. D 104, 095015 (2021), arXiv:2105.05253 .
- Trickle [2023] T. Trickle, Extended calculation of electronic excitations for direct detection of dark matter, Phys. Rev. D 107, 035035 (2023).
- Dreyer et al. [2023] C. E. Dreyer et al., Fully ab-initio all-electron calculation of dark matter–electron scattering in crystals with evaluation of systematic uncertainties, (2023), arXiv:2306.14944 .
- Piffl et al. [2014] T. Piffl et al., The RAVE survey: the Galactic escape speed and the mass of the Milky Way, Astron. Astrophys. 562, A91 (2014), arXiv:1309.4293 .
- Biekert et al. [2022] A. Biekert et al. (SPICE/HeRALD), Scintillation yield from electronic and nuclear recoils in superfluid He4, Phys. Rev. D 105, 092005 (2022), arXiv:2108.02176 .
- Rodnyi et al. [1995] P. A. Rodnyi et al., Energy loss in inorganic scintillators, physica status solidi (b) 187, 15 (1995).
- D. Fuchs [CRESST Collaboration] D. Fuchs (CRESST Collaboration), First observation of single photons in a CRESST detector and new Dark Matter exclusion limits (TAUP23 Conference, 2023) https://indico.cern.ch/event/1199289/ .
- Strauss et al. [2017] R. Strauss et al., Gram-scale cryogenic calorimeters for rare-event searches, Phys. Rev. D 96, 022009 (2017), arXiv:1704.04317 .
- Rotman [1997] S. R. Rotman, Wide-gap luminescent materials: theory and applications (Springer, 1997).
- Moszynski et al. [2002] M. Moszynski et al., Study of pure NaI at room and liquid nitrogen temperatures, in 2002 IEEE Nuclear Science Symposium Conference Record, Vol. 1 (IEEE, 2002) pp. 346–351.
- West and Collinson [1970] J. B. West and A. J. L. Collinson, The low temperature scintillation response of unactivated sodium iodide to gamma-rays, Journal of Physics B: Atomic and Molecular Physics 3, 1363 (1970).
- Angloher et al. [2023b] G. Angloher et al. (COSINUS), First measurements of remoTES cryogenic calorimeters: Easy-to-fabricate particle detectors for a wide choice of target materials, Nucl. Instrum. Meth. A 1045, 167532 (2023b), arXiv:2111.00349 .
- Jodoi et al. [2022] T. Jodoi et al., Iridium–gold bilayer optical transition edge sensor, Journal of Low Temperature Physics 209, 556 (2022).
- Reindl et al. [2020] F. Reindl et al. (COSINUS), Results of the first NaI scintillating calorimeter prototypes by COSINUS, J. Phys. Conf. Ser. 1342, 012099 (2020), arXiv:1711.01482 .
- Hubbell et al. [1980] J. H. Hubbell et al., Pair, triplet, and total atomic cross sections (and mass attenuation coefficients) for 1 mev-100 gev photons in elements z= 1 to 100, Journal of physical and chemical reference data 9, 1023 (1980).
- Adari et al. [2022a] P. Adari et al., EXCESS workshop: Descriptions of rising low-energy spectra, SciPost Physics Proceedings 10.21468/scipostphysproc.9.001 (2022a).
- Angloher et al. [2023c] G. Angloher et al. (CRESST), Results on sub-Gev dark matter from a 10 eV threshold CRESST-III silicon detector, Phys. Rev. D 107, 122003 (2023c).
- Cowan [2011] G. a. Cowan, Asymptotic formulae for likelihood-based tests of new physics, Eur. Phys. J. C 71, 1554 (2011), [Erratum: Eur.Phys.J.C 73, 2501 (2013)], arXiv:1007.1727 .
- Adari et al. [2022b] P. Adari et al., EXCESS workshop: Descriptions of rising low-energy spectra, SciPost Phys. Proc. 9, 001 (2022b), arXiv:2202.05097 .
- Adari et al. [2023] P. Adari et al. (SENSEI), SENSEI: First Direct-Detection Results on sub-GeV Dark Matter from SENSEI at SNOLAB, (2023), arXiv:2312.13342 .