Blackbody radiation and thermal effects on chemical reactions and phase transitions in cavities
Abstract
An important question in polariton chemistry is whether reacting molecules are in thermal equilibrium with their surroundings. If not, can experimental changes observed in reaction rates of molecules in a cavity (even without optical pumping) be attributed to a higher/lower temperature inside the cavity? In this work, we address this question by computing temperature differences between reacting molecules inside a cavity and the air outside. We find this temperature difference to be negligible for most reactions. On the other hand, for phase transitions inside cavities, as the temperature of the material is actively maintained by a heating/cooling source in experiments, we show cavities can modify observed transition temperatures when mirrors and cavity windows are ideal (non-absorbing); however, this modification vanishes when real mirrors and windows are used. Finally, we find substantial differences in blackbody spectral energy density between free space and infrared cavities, which reveal resonance effects and could potentially play a role in explaining changes in chemical reactivity in the dark.
When a material is placed inside a Fabry-Perot cavity, experiments report changes in chemical reaction rates thomas2016ground ; thomas2019tilting ; ahn2023modification ; vergauwe2019modification ; hirai2020modulation ; lather2020improving ; lather2019cavity and phase transition temperatures wang2014phase ; brawley2023sub ; jarc2023cavity even in the absence of optical pumping. Several theoretical explanations have been proposed for these cavity-mediated effects galego2015cavity ; herrera2016cavity ; flick2018cavity ; campos2019resonant ; li2021cavity ; schafer2022shining , but there is no consensus on what causes changes in reactivity fregoni2022theoretical ; mandal2023theoretical ; campos2023swinging ; ruggenthaler2023understanding ; herrera2020molecular ; sidler2022perspective . They are often attributed to polariton modes that emerge under strong light-matter coupling; however, most of these experiments are performed in the collective strong coupling regime where theory predicts negligible modification of reaction rates vurgaftman2020negligible ; campos2020polaritonic ; zhdanov2020vacuum ; li2020origin and phase transitions pilar2020thermodynamics . In this regime, a large number of molecular modes, , collectively couple to a single photon mode to form two polariton and dark modes. Here, the collective coupling strength surpasses losses from the system. The dark modes, devoid of any photon character and expected to behave similarly to bare molecular modes, outnumber the hybrid polariton modes by a factor of and dominate the kinetics and thermodynamics of the system; disorder does not qualitatively change the conclusion du2022catalysis .
The disparity between theory and experiment prompts a critical examination of whether assumptions in theoretical models align with conditions present in the experimental setup. In this work, we specifically investigate a crucial assumption in polariton chemistry: that the temperature of the material within the cavity matches that of the surrounding air. This is assumed despite the fact that heat is generated/absorbed during a reaction. Given that cavities can modify the rate of heat transfer—an aspect applied even in practical scenarios such as radiative cooling of photovoltaic cells taylor2017vanadium ; cho2023directional —this question becomes both important and reasonable. We proceed to quantify whether changes in experimentally observed reaction rates and phase transition temperatures can be attributed to temperature differences between the material within the cavity and external air. These inquiries are in line with recent experiments that emphasize the role of non-polaritonic effects in cavity systems thomas2023non . Furthermore, we also compute differences between blackbody radiation inside a cavity and in free space, which could play a role in explaining the aforementioned experiments.
Results and discussion
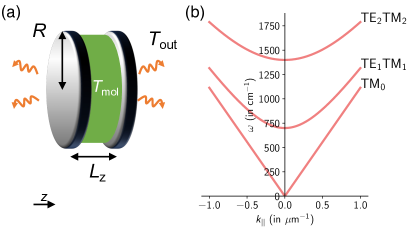
We study heat transfer from a Fabry-Perot cavity to the air surrounding it (Fig. 1). In our model, we include all modes of a Fabry-Perot cavity as multimode models capture important qualitative features missed by single-mode ones ribeiro2022multimode ; ying2023resonance ; engelhardt2023polariton . The dispersion relation of photon modes within such a cavity, depicted in Fig. 1b, is given by:
| (1) |
when the mirrors are ideal (100% reflectivity) ellingson2020electromagneticsv2 . Here, labels the branch of the cavity modes, is the wavevector component parallel to the mirrors, the refractive index of the material filling the cavity, the speed of light, and the distance between the mirrors. For each , two polarizations of modes exist: TE and TM. When , only TM0 modes exist which are not observed in the reflection spectrum in experiments due to zero component of their wavevector . Consequently, the lowest observed frequency, corresponding to at normal incidence (), is labeled the cavity frequency .
The microcavity system dissipates energy to surrounding air via: (i) radiation and (ii) convection. We simplify the analysis by assuming local thermal equilibrium between the molecules and cavity, both sharing the same temperature (this assumption is actually violated in jarc2023cavity , as we discuss later) while the temperature of external air equals (Fig. 1a). The net power lost through radiation follows the Stefan-Boltzmann law, expressed as
| (2) |
while that through convection is given by
| (3) |
Here, denotes the Stefan-Boltzmann constant, is the surface area of the emitting object, is its emissivity, and is the convective heat transfer coefficient. For an object losing energy to air through free convection, is kosky2012exploring . Radiation and convection contribute to the power lost by a blackbody to air with comparable magnitudes when the temperature difference is K and air is at room temperature; this can be verified using with K, and . The heat lost by the cavity through convection is readily calculated using Eq. 3, while that through radiation is more involved since we need to calculate its emissivity .
For typical infrared or UV cavities where the lateral size (see Fig. 1a), we can neglect radiation through and approximate . The emissivity of such a cavity can be computed directly using Maxwell’s equations and the fluctuation-dissipation theorem luo2004thermal ; narayanaswamy2004thermal ; however, this is a complex task and a simpler strategy involves obtaining the emissivity indirectly from absorption as Kirchhoff’s law dictates that they must be equal cornelius1999modification . Following the second approach, we obtain the spectral directional emissivity, , using Kirchoff’s law where we compute the absorption from transfer matrix simulations. Here, , , and are the reflection, transmission, and absorption, respectively, for incident light with wavevector and polarization .
For a given , integrating over all and a restricted range of and summing the TE/TM contributions gives the spectral hemispherical emissivity ,
| (4) |
(Supplementary S1). The total emissivity can then be calculated by integrating over all where ,
| (5) |
Note that and when it equals for all , the total emissivity and the object becomes a blackbody.
The maximum of the function in Eq. 5 occurs at ; this condition gives the well-known Wien’s displacement law for a blackbody, . The value of around dominates the contribution to . Thus, at room temperature, within the frequency range has the largest impact on the total emissivity . From here on, we consider a temperature of K for all emissivity calculations unless specified otherwise.
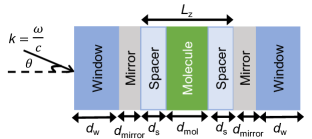
To explore variations in emissivity with cavity frequency, , and its potential impact on temperature-induced modifications in reaction rate constants, we conduct transfer matrix simulations on the structure depicted in Fig. 2. This includes an absorbing molecular layer, spacers, mirrors, and windows of thicknesses m, , nm, and mm, respectively, based on characteristic values in experiments ahn2023modification , for a range of mirror separations . Additionally, their respective refractive indices are taken to be , , , and where the molecular permittivity is modeled using a Lorentzian and the mirrors using a Drude permittivity . We treat the mm thick windows incoherently and all other layers coherently in our transfer matrix simulations centurioni2005generalized (Supplementary S2). Calculations are performed for two parameter sets: (i) with non-absorbing mirrors and windows (ideal system) and (ii) absorbing mirrors and windows (realistic system).
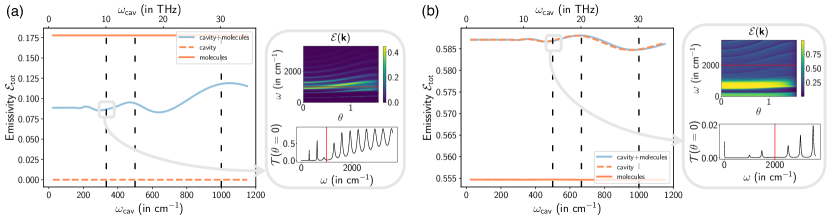
In the first set (Fig. 3a), the refractive index of the windows is real-valued, , and we consider a non-absorbing mirror with parameters and . Given that the refractive indices of the window, mirror, and spacer are all real-valued, they do not absorb, and the molecular layer is solely responsible for all absorption and emission. For the molecular layer, we consider a resonance centered at and other parameters , , and .
For the second set of parameters (Fig. 3b), we use windows with a complex-valued refractive index taken from experiments li2017new ; kelly2017complex . windows are commonly used in vibrational strong coupling chemical reactivity experiments wiesehan2021negligible ; imperatore2021reproducibility ; ahn2023modification ; vergauwe2019modification . As 2mm thick windows absorb a substantial portion of the radiation when (as observed in the inset of Fig. 3b) dominating the total emissivity, the variation of with is smaller than that in Fig. 3a. On the other hand, 2mm of , transparent for and also previously used for strong coupling experiments thomas2016ground ; thomas2019tilting ; imperatore2021reproducibility ; hirai2020modulation , will likely show larger changes in emissivity with cavity length. For the mirror, we adopt Drude parameters of gold, and fs olmon2012optical and for molecular parameters, we consider a resonance centered at with , , and .
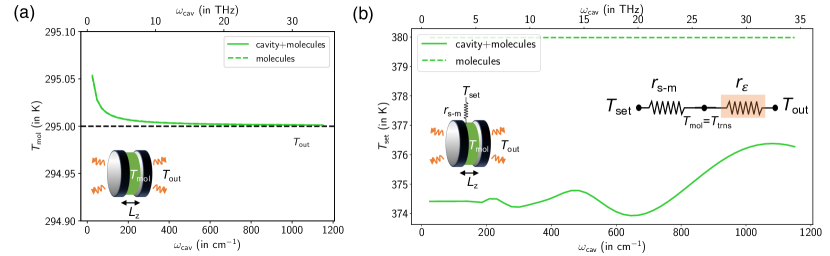
Fig. 3a-b depict as a function of for the two parameter sets mentioned above. These parameters were used to calculate the cavity+molecules (blue line) plots in Fig. 3a-b. To obtain the plots for molecules (solid orange line), nm was changed to , and for cavity (dashed orange line), was changed to . The cavity+molecules plots reveal oscillatory behavior of with extrema not necessarily appearing when the resonance condition is satisfied (dashed black lines in Fig. 3); here, is a positive integer. The reason for oscillations of emissivity with differ between Fig. 3a and 3b. In Fig. 3a, filtering of the emissivity of molecules through the non-absorbing cavity is responsible for this variation as clearly seen from the fact that there is no variation in the bare molecular emissivity (solid orange line) and that the empty cavity has zero emissivity (dashed orange line). In contrast, in Fig. 3b, the emissivity of the empty cavity (dashed orange line) closely matches that of the cavity+molecule system (blue line), indicating the dominant role played by the absorbing mirrors and windows in determining the emissivity of this structure. Changes in emissivity with are in Fig. 3b which is smaller than in Fig. 3a, as it is dominated by the emissivity of the CaF2 windows. The oscillation in emissivity with in Fig. 3b is due to changes in the modes of the cavity present above the absorption cut-off set by the CaF2 windows (, see Fig. 3b inset).
Chemical reaction.– We assume variations in the measured rate constant in vibrational strong coupling experiments, without optical pumping (vibropolaritonic chemistry), stem solely from differences between the outside temperature and the real temperature of molecules . The rate constant for a reaction with activation energy is . For a bimolecular reaction, is the rate of energy generation inside a volume , where is the reactant concentration and is the molar enthalpy change. The energy generation rate during the reaction should equal the rate of energy leaving the cavity at steady state (Supplementary S3). This leads to an expression satisfied by ,
| (6) | ||||
where is the volume of the cell. In Eq. 6, two factors change with : firstly, , and secondly as observed in Fig. 3.
To maintain a K temperature difference with external air at K, we estimate the power that needs to be generated by the reaction to be for a blackbody in a cavity of size m using the right-hand side of Eq. 6. For a typical reaction, M, and . Plugging these into the left-hand side of Eq. 6 yields which is orders of magnitude smaller than the required power of . Therefore, we expect the difference between and to be negligible.
We solve Eq. 6 for with computed using refractive indices as in Fig. 3b but without spacers ( and ) (see Fig. S1a), and we take reaction parameters from ahn2023modification : , M, , K and . In Fig. 4a, the molecular temperature is plotted against with a dashed green line for the case of bare molecules (structure in Fig. 2 with , and ) and a solid green line for molecules in a cavity (structure in Fig. 2 with , nm and ). We observe an increase in K as decreases ( increases; the smallest used in Fig. 4a is ) due to in Eq. 6. As increases, increases, leading to an increase in the amount of heat generated by the reaction while the area through which the heat can escape remains constant, as a result, increases. In the limit , we see from Eq. 6 that approaches infinity. Notably, in Fig. 4a, there is no discernible difference between cases with and without the cavity, and the temperature difference between and is minimal for cavities with .
Phase transition.– When measuring phase transition temperature changes in microcavities, the sample’s temperature is externally adjusted to approach the transition temperature . As may deviate from , there is constant net energy flux between the sample and external air during the measurement. Additionally, the device actively maintaining the sample temperature is at which may not equal due to potential thermal resistance between them, as illustrated in the inset of Fig. 4b along with the circuit. As previously assumed, the sample and entire cavity structure share the same temperature . The thermal resistance between the cavity and external air depends on its emissivity. At steady state, we have
| (7) |
which can be rewritten as
| (8) |
| (9) |
Therefore, required to achieve the transition can vary as changes. This can lead to experimentally observed cavity-dependent modifications in the external device temperature required for the phase transition as seen in brawley2023sub and jarc2023cavity .
In contrast to reactions, where energy generated by the reaction is crucial for maintaining a temperature distinct from the surroundings, systems undergoing phase transitions are actively maintained at a temperature different from surrounding air, through an external device. To demonstrate that modifications in emissivity indeed lead to changes in required for the transition, we consider a transition temperature K and a thermal resistance of . We choose this value of by applying the condition K in the absence of mirrors ( - solid orange line in Fig. S1b) for the structure in Fig. 2 when K and the area with cm (jarc2023cavity has a K difference between and in free space). We use the same parameters for the emissivity calculation as in Fig. 3a but with temperature K (see Fig. S1b). We plot the results in Fig. 4b, revealing that the temperature follows the same trend as the emissivity. Note that these results are for the ideal system of non-absorbing windows and mirrors. For the realistic system with CaF2 windows and gold mirrors, we find negligible changes K in with .
Blackbody radiation.– We showed that changes in chemical reaction rates cannot be explained through differences in temperature between molecules and external air; however, even at the same temperature, the thermal energy density inside a cavity is different from that in free space and may lead to changes in reactivity. The thermal energy density, , is given by the product of mean energy in a mode and the photon density of states (DoS) where reiser2013geometric . Here, we ignore the zero-point contribution to the mean energy reggiani2022revisiting . The energy density inside a cavity of frequency is
| (10) |
In the limit or equivalently , this reduces to free space blackbody radiation,
| (11) |
We plot for two cavity frequencies at K using solid lines and at the same temperature using black circles in Fig. 5a.
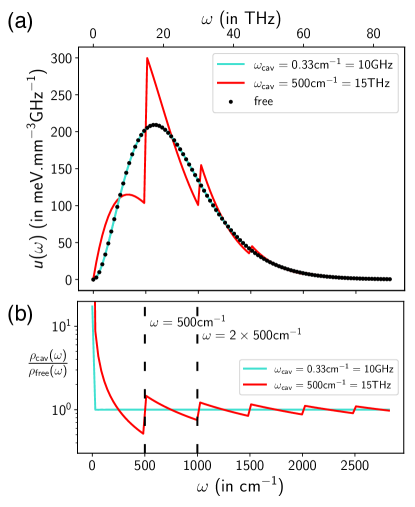
The ratio of the spectral energy densities in a cavity and in free space equals where,
| (12) |
From Eq. 12 (plotted in Fig. 5b), we see in the limit that . However, since and , their difference goes to when as seen in Fig. 5a.
We expect the energy density within a cavity to differ from that in free space appreciably only when , i.e.,
| (13) |
as seen from Fig. 5a. A similar result was noted in the context of thermal emission from photonic band gap materials cornelius1999modification . Interestingly, this condition is satisfied by cavities used in most experiments of modified chemical reactivity under collective vibrational strong coupling thomas2019tilting ; ahn2023modification . This difference in energy density may have an effect on chemical reactivity as it shows sharp changes at the normal incidence () cavity frequency (Fig. 5a). This is an interesting direction that we will explore in more detail in future work. In previous work, it has been shown that the photon DoS is different inside a cavity vurgaftman2022comparative and can potentially modify chemical reactivity even in the dark and may explain resonance effects in polariton chemistry ying2023resonance .
Notice, on the other hand, how the thermal spectral energy density within a cavity – similar to those used by jarc2023cavity in their phase transition experiments – is close to that in free space. Furthermore, our theory for modification of observed phase transition temperatures shows changes for IR cavities but does not explain their experiment as the temperature change (Fig. 4b) and emissivity (Fig. 3) become a constant for low frequency cavities due to the condition in Eq. 13. However, we have assumed that the temperature of the entire cavity structure is a constant while in their experiments, the mirror and sample have different temperatures and when they vary the mirror temperature, the observed phase transition temperature changes. Our emissivity calculations can be generalized to structures with non-uniform temperature wang2011direct and the distance-dependent changes in the rate of radiative heat transfer between the mirror and sample might explain their work.
As pointed out in chiriaco2023thermal , the theoretical framework presented in jarc2023cavity does not accurately account for the photon DoS in a Fabry-Perot cavity. Chiriacò chiriaco2023thermal explains the experiments in jarc2023cavity using a thermal Purcell effect, arising from the difference in photon DoS between the cavity and free space. They expect the heat transfer rate of a sample inside a Fabry-Perot cavity with GHz to be the same as in free space because the photon DoS of such a cavity is nearly identical to that in free space for the frequency range over which the blackbody energy density is substantial. Consequently, they claim that a cavity with spherical mirrors is required to explain the observations in jarc2023cavity . In their model, the photon DoS along with the temperature difference between the sample and cavity photons determines the net heat flux between them and plays a crucial role. Their conclusions hold if the photon modes have a well-defined temperature; however, in the experiments of jarc2023cavity , where mirrors and sample are at different temperatures, the cavity photons do not have a well-defined temperature due to interactions with both. In our calculations, we do not need to define a temperature for the photon modes; the net heat flux can be computed as the rate of radiative heat transfer between the sample and mirrors when altering the distance between the mirrors. This may explain results of jarc2023cavity , even in a Fabry-Perot cavity, as discussed in the previous paragraph.
Additionally, the lowest TM0 mode (see Fig. 1) was not included in chiriaco2023thermal while calculating the photon DoS of a Fabry-Perot cavity, leading to the incorrect conclusion that the photon DoS inside a Fabry-Perot cavity is always smaller than that in free space for all frequencies (however, this does not affect the main conclusion of their paper, as in a Fabry-Perot cavity with GHz is very close to that in free space; see Fig. 5a).
Conclusions
In summary, we theoretically demonstrate that temperature differences between reacting molecules in a cavity and external air are negligible – ruling out the possibility that collective VSC chemical reaction rate modifications can be explained purely through increase/decrease in the temperature within a cavity from the heat generated/absorbed during a reaction. In contrast, our calculations reveal that cavities indeed exert a notable thermal influence on observed phase transition temperatures if cavity windows are non-absorbing (ideal system). In this case, the material’s temperature is actively controlled by a heating/cooling source, and significant temperature gradients exist between the material and surrounding air, as observed in recent experiments brawley2023sub and jarc2023cavity . Additionally, we show that the blackbody spectrum inside Fabry-Perot cavities differs from free space when they satisfy . As this condition is typically satisfied by the IR cavities used for VSC experiments and there are discontinuities in the blackbody spectrum at multiples of the cavity frequency, differences in the blackbody spectrum can potentially explain the resonance effect observed in reaction rates. This will be explored in future work.
Acknowledgements.
S.P.S. thanks Gerrit Groenhof for useful discussions. S.P.S. and J.Y.Z acknowledge funding support from the W. M. Keck Foundation.Code availability
The code used in this work is available at https://github.com/SindhanaPS/blackbody_and_thermal_effects_polaritons.
References
- (1) A. Thomas, J. George, A. Shalabney, M. Dryzhakov, S. J. Varma, J. Moran, T. Chervy, X. Zhong, E. Devaux, C. Genet et al., “Ground-state chemical reactivity under vibrational coupling to the vacuum electromagnetic field,” Angew. Chem. Int. Ed. 55, 11462–11466 (2016).
- (2) A. Thomas, L. Lethuillier-Karl, K. Nagarajan, R. M. A. Vergauwe, J. George, T. Chervy, A. Shalabney, E. Devaux, C. Genet, J. Moran, and T. W. Ebbesen, “Tilting a ground-state reactivity landscape by vibrational strong coupling,” Science 363, 615–619 (2019).
- (3) W. Ahn, J. F. Triana, F. Recabal, F. Herrera, and B. S. Simpkins, “Modification of ground-state chemical reactivity via light–matter coherence in infrared cavities,” Science 380, 1165–1168 (2023).
- (4) R. M. A. Vergauwe, A. Thomas, K. Nagarajan, A. Shalabney, J. George, T. Chervy, M. Seidel, E. Devaux, V. Torbeev, and T. W. Ebbesen, “Modification of enzyme activity by vibrational strong coupling of water,” Angew. Chem. Int. Ed. 58, 15324–15328 (2019).
- (5) K. Hirai, R. Takeda, J. A. Hutchison, and H. Uji-i, “Modulation of prins cyclization by vibrational strong coupling,” Angew. Chem. Int. Ed. 59, 5332–5335 (2020).
- (6) J. Lather and J. George, “Improving enzyme catalytic efficiency by co-operative vibrational strong coupling of water,” J. Phys. Chem. Lett. 12, 379–384 (2020).
- (7) J. Lather, P. Bhatt, A. Thomas, T. W. Ebbesen, and J. George, “Cavity catalysis by cooperative vibrational strong coupling of reactant and solvent molecules,” Angew. Chem. Int. Ed. 58, 10635–10638 (2019).
- (8) S. Wang, A. Mika, J. A. Hutchison, C. Genet, A. Jouaiti, M. W. Hosseini, and T. W. Ebbesen, “Phase transition of a perovskite strongly coupled to the vacuum field,” Nanoscale 6, 7243–7248 (2014).
- (9) Z. Brawley, J. E. Yim, S. Pannir-Sivajothi, Y. R. Poh, J. Yuen-Zhou, and M. Sheldon, “Sub-wavelength chemical imaging of a modified reaction due to vibrational strong coupling,” chemRxiv preprint (2023).
- (10) G. Jarc, S. Y. Mathengattil, A. Montanaro, F. Giusti, E. M. Rigoni, R. Sergo, F. Fassioli, S. Winnerl, S. Dal Zilio, D. Mihailovic et al., “Cavity-mediated thermal control of metal-to-insulator transition in ,” Nature 622, 487–492 (2023).
- (11) J. Galego, F. J. Garcia-Vidal, and J. Feist, “Cavity-induced modifications of molecular structure in the strong-coupling regime,” Phys. Rev. X 5, 041022 (2015).
- (12) F. Herrera and F. C. Spano, “Cavity-controlled chemistry in molecular ensembles,” Phys. Rev. Lett. 116, 238301 (2016).
- (13) J. Flick and P. Narang, “Cavity-correlated electron-nuclear dynamics from first principles,” Phys. Rev. Lett. 121, 113002 (2018).
- (14) J. A. Campos-Gonzalez-Angulo, R. F. Ribeiro, and J. Yuen-Zhou, “Resonant catalysis of thermally activated chemical reactions with vibrational polaritons,” Nat. Commun. 10, 4685 (2019).
- (15) X. Li, A. Mandal, and P. Huo, “Cavity frequency-dependent theory for vibrational polariton chemistry,” Nat. Commun. 12, 1315 (2021).
- (16) C. Schäfer, J. Flick, E. Ronca, P. Narang, and A. Rubio, “Shining light on the microscopic resonant mechanism responsible for cavity-mediated chemical reactivity,” Nat. Commun. 13, 7817 (2022).
- (17) J. Fregoni, F. J. Garcia-Vidal, and J. Feist, “Theoretical challenges in polaritonic chemistry,” ACS Photonics 9, 1096–1107 (2022).
- (18) A. Mandal, M. A. Taylor, B. M. Weight, E. R. Koessler, X. Li, and P. Huo, “Theoretical advances in polariton chemistry and molecular cavity quantum electrodynamics,” Chem. Rev. 123, 9786–9879 (2023).
- (19) J. A. Campos-Gonzalez-Angulo, Y. R. Poh, M. Du, and J. Yuen-Zhou, “Swinging between shine and shadow: Theoretical advances on thermally activated vibropolaritonic chemistry,” J. Chem. Phys. 158, 230901 (2023).
- (20) M. Ruggenthaler, D. Sidler, and A. Rubio, “Understanding polaritonic chemistry from ab initio quantum electrodynamics,” Chem. Rev. 123, 11191–11229 (2023).
- (21) F. Herrera and J. Owrutsky, “Molecular polaritons for controlling chemistry with quantum optics,” J. Chem. Phys. 152, 100902 (2020).
- (22) D. Sidler, M. Ruggenthaler, C. Schäfer, E. Ronca, and A. Rubio, “A perspective on ab initio modeling of polaritonic chemistry: The role of non-equilibrium effects and quantum collectivity,” J. Chem. Phys. 156 (2022).
- (23) I. Vurgaftman, B. S. Simpkins, A. D. Dunkelberger, and J. C. Owrutsky, “Negligible effect of vibrational polaritons on chemical reaction rates via the density of states pathway,” J. Phys. Chem. Lett. 11, 3557–3562 (2020).
- (24) J. A. Campos-Gonzalez-Angulo and J. Yuen-Zhou, “Polaritonic normal modes in transition state theory,” J. Chem. Phys. 152, 161101 (2020).
- (25) V. P. Zhdanov, “Vacuum field in a cavity, light-mediated vibrational coupling, and chemical reactivity,” Chem. Phys. 535, 110767 (2020).
- (26) T. E. Li, A. Nitzan, and J. E. Subotnik, “On the origin of ground-state vacuum-field catalysis: Equilibrium consideration,” J. Chem. Phys. 152, 234107 (2020).
- (27) P. Pilar, D. De Bernardis, and P. Rabl, “Thermodynamics of ultrastrongly coupled light-matter systems,” Quantum 4, 335 (2020).
- (28) M. Du and J. Yuen-Zhou, “Catalysis by dark states in vibropolaritonic chemistry,” Phys. Rev. Lett. 128, 096001 (2022).
- (29) S. Taylor, Y. Yang, and L. Wang, “Vanadium dioxide based Fabry-Perot emitter for dynamic radiative cooling applications,” J. Quant. Spectrosc. Radiat. Transf. 197, 76–83 (2017). The Eight International Symposium on Radiative Transfer.
- (30) J.-W. Cho, Y.-J. Lee, J.-H. Kim, R. Hu, E. Lee, and S.-K. Kim, “Directional radiative cooling via exceptional epsilon-based microcavities,” ACS Nano 17, 10442–10451 (2023).
- (31) P. A. Thomas, W. J. Tan, V. G. Kravets, A. N. Grigorenko, and W. L. Barnes, “Non-polaritonic effects in cavity-modified photochemistry,” Adv. Mater. p. 2309393.
- (32) R. F. Ribeiro, “Multimode polariton effects on molecular energy transport and spectral fluctuations,” Commun. Chem. 5, 48 (2022).
- (33) W. Ying, M. Taylor, and P. Huo, “Resonance theory of vibrational polariton chemistry at the normal incidence,” chemRxiv preprint (2023).
- (34) G. Engelhardt and J. Cao, “Polariton localization and dispersion properties of disordered quantum emitters in multimode microcavities,” Phys. Rev. Lett. 130, 213602 (2023).
- (35) S. W. Ellingson, Electromagnetics, Vol. 2 Blacksburg, VA: Virginia Tech Publishing, (2020).
- (36) P. Kosky, R. T. Balmer, and W. D. Keat, Exploring Engineering: An Introduction to Engineering and Design Elsevier Science, (2020), 5th ed.
- (37) C. Luo, A. Narayanaswamy, G. Chen, and J. D. Joannopoulos, “Thermal radiation from photonic crystals: A direct calculation,” Phys. Rev. Lett. 93, 213905 (2004).
- (38) A. Narayanaswamy and G. Chen, “Thermal emission control with one-dimensional metallodielectric photonic crystals,” Phys. Rev. B 70, 125101 (2004).
- (39) C. M. Cornelius and J. P. Dowling, “Modification of Planck blackbody radiation by photonic band-gap structures,” Phys. Rev. A 59, 4736–4746 (1999).
- (40) E. Centurioni, “Generalized matrix method for calculation of internal light energy flux in mixed coherent and incoherent multilayers,” Appl. Opt. 44, 7532–7539 (2005).
- (41) X. Li, C. Wang, J. Zhao, and L. Liu, “A new method for determining the optical constants of highly transparent solids,” Appl. Spectrosc. 71, 70–77 (2017).
- (42) M. R. K. Kelly-Gorham, B. M. DeVetter, C. S. Brauer, B. D. Cannon, S. D. Burton, M. Bliss, T. J. Johnson, and T. L. Myers, “Complex refractive index measurements for and via single-angle infrared reflectance spectroscopy,” Opt. Mater. 72, 743–748 (2017).
- (43) G. D. Wiesehan and W. Xiong, “Negligible rate enhancement from reported cooperative vibrational strong coupling catalysis,” J. Chem. Phys. 155, 241103 (2021).
- (44) M. V. Imperatore, J. B. Asbury, and N. C. Giebink, “Reproducibility of cavity-enhanced chemical reaction rates in the vibrational strong coupling regime,” J. Chem. Phys. 154, 191103 (2021).
- (45) R. L. Olmon, B. Slovick, T. W. Johnson, D. Shelton, S.-H. Oh, G. D. Boreman, and M. B. Raschke, “Optical dielectric function of gold,” Phys. Rev. B 86, 235147 (2012).
- (46) A. Reiser and L. Schächter, “Geometric effects on blackbody radiation,” Phys. Rev. A 87, 033801 (2013).
- (47) L. Reggiani and E. Alfinito, “Revisiting the boltzmann derivation of the stefan law,” Fluct. Noise Lett. 21, 2230001 (2022).
- (48) I. Vurgaftman, B. S. Simpkins, A. D. Dunkelberger, and J. C. Owrutsky, “Comparative analysis of polaritons in bulk, dielectric slabs, and planar cavities with implications for cavity-modified reactivity,” J. Chem. Phys. 156, 034110 (2022).
- (49) L. P. Wang, S. Basu, and Z. M. Zhang, “Direct and indirect methods for calculating thermal emission from layered structures with nonuniform temperatures,” J. Heat Transfer 133, 072701 (2011).
- (50) G. Chiriacò, “Thermal Purcell effect and cavity-induced renormalization of dissipations,” arXiv preprint arXiv:2310.15184 (2023).