Comparing growth of titania and carbonaceous dusty nanoparticles in weakly magnetised capacitively coupled plasmas
Abstract
This study investigates the growth cycles of titania and carbonaceous dusty nanoparticles in capacitively coupled radiofrequency plasmas, focusing on the impact of weak magnetic field of approximately 480 Gauss. The growth of dusty nanoparticles in these plasmas is cyclic, with particles reaching their maximum size and subsequently moving out of the plasma, followed by the initiation of a new particle growth cycle. We compare the growth of titania and carbonaceous dusty particles in the presence and absence of a magnetic field. The presence of the magnetic field fastens the growth cycle in both types of dusty plasmas. Langmuir probe measurement of the background plasma parameters such as electron temperature and floating potential reveal radial variations in floating potential but not electron temperature. Furthermore, the magnetic field changes the radial variation of floating potential. The magnetic field also influences the spatial distribution of the two dust cloud differently. It is possible that these differences arises due to the material’s different response to the magnetic field. These findings shed light on the intricate dynamics of titania and carbonaceous dusty plasma particle growth, offering insights into the impact of weak magnetization on dust behavior, which have implications for various applications, from space science to semiconductor processing.
Keywords: Dusty plasma, Weakly magnetised, Nano particles, Growth cycle
1 Introduction
A dusty plasma is a four component system consisting of electrons, ions, neutrals, and nanometer (nm) to micrometer (m) sized charged solids, i.e., dust. All the charged species interact with each other and the background neutrals to form a complex, coupled system [1, 2]. Because the dust particles are significantly more massive than the other species, these systems can exhibit a broad range of phenomena such as self-organization [3, 4, 5, 6], clustering [7, 8, 9, 10], and new types of wave phenomena [11, 12]. Moreover, the large mass and size of the dust particle enables direct visualization of these phenomena in the laboratory [13, 14, 15].
Dusty plasmas can be formed in a variety of natural [16, 17, 18, 19, 20], and laboratory environments [21, 22, 23, 24]. Many dusty plasma experiments are performed by directly introducing the dust particles into the plasma. However, if a reactive gas is used to generate the plasma, chemical processes can lead to the spontaneous nucleation and growth of dust particles directly from the gas phase. Studies regarding the formation of dusty plasma have a broad range of applications from understanding the formation of dust in space [25] to semiconductor processing [26]. The majority of the visible universe is made up of plasma and dusty plasmas are believed to be prevalent in planetary rings and star formation [1, 27, 17]. For laboratory studies involving the growth of dusty plasma, the background background plasma is usually ignited from an inert gas such as argon (Ar). Over the past three decades, different kinds of particles growth have been reported in literature. Silicate dusts has been grown in Ar/silane plasmas [28]. Carbonaceous dusts [29] and carbon nitride [30] have been grown in Ar/acetylene and Ar//nitrogen plasmas respectively. Polyaniline, which are conducting polymers, have been grown in Ar/aniline plasmas [31]. Organosilicon been grown in Ar/hexamethyldisiloxane (HDMSO) plasmas [32]; similar precursors have been used to grow low dielectric constant thin films in plasma enhanced chemical vapor deposition (PECVD) [33, 34]. Aluminum nanocrystals have been grown in Ar/hydrogen/aluminum trichloride plasmas [35]. Titanium dioxide , also known as titania, nanoparticles have been grown in an Ar/titanium tetraisopropoxide (TTIP) plasmas [36]. Whereas studies for the past 30 years have mostly focused on the growth of carbonaceous and silicate particles in dusty plasma, there has been a shift towards exploring other particles growth in the past 10 years, as given by the examples above. Therefore, there is a need to study the properties of the new kinds of dusty plasma.
The focus of this paper is to grow titania nanoparticles in a weakly-magnetized dusty plasma environment with an accompanying detailed investigation of the cyclical growth process in this system. This growth will be compared with carbonaceous dust growth. Titania dust, along with other oxides of titanium, have been proposed as candidates for the first condensates in primitive solar nebula [37, 38, 39]. In semiconductor processing, TTIP has been commonly used in PECVD to grow thin films. In general, it is common in PECVD to take at least 10 minutes to nucleate nm to m-sized particles prior to thin film growth [40, 41, 42, 43, 44, 45]. Dusty plasma particle growth offers the advantage of nucleating nm-sized particles within milliseconds (ms) [46] and growing to 100 nm within tens of seconds (s) [47].
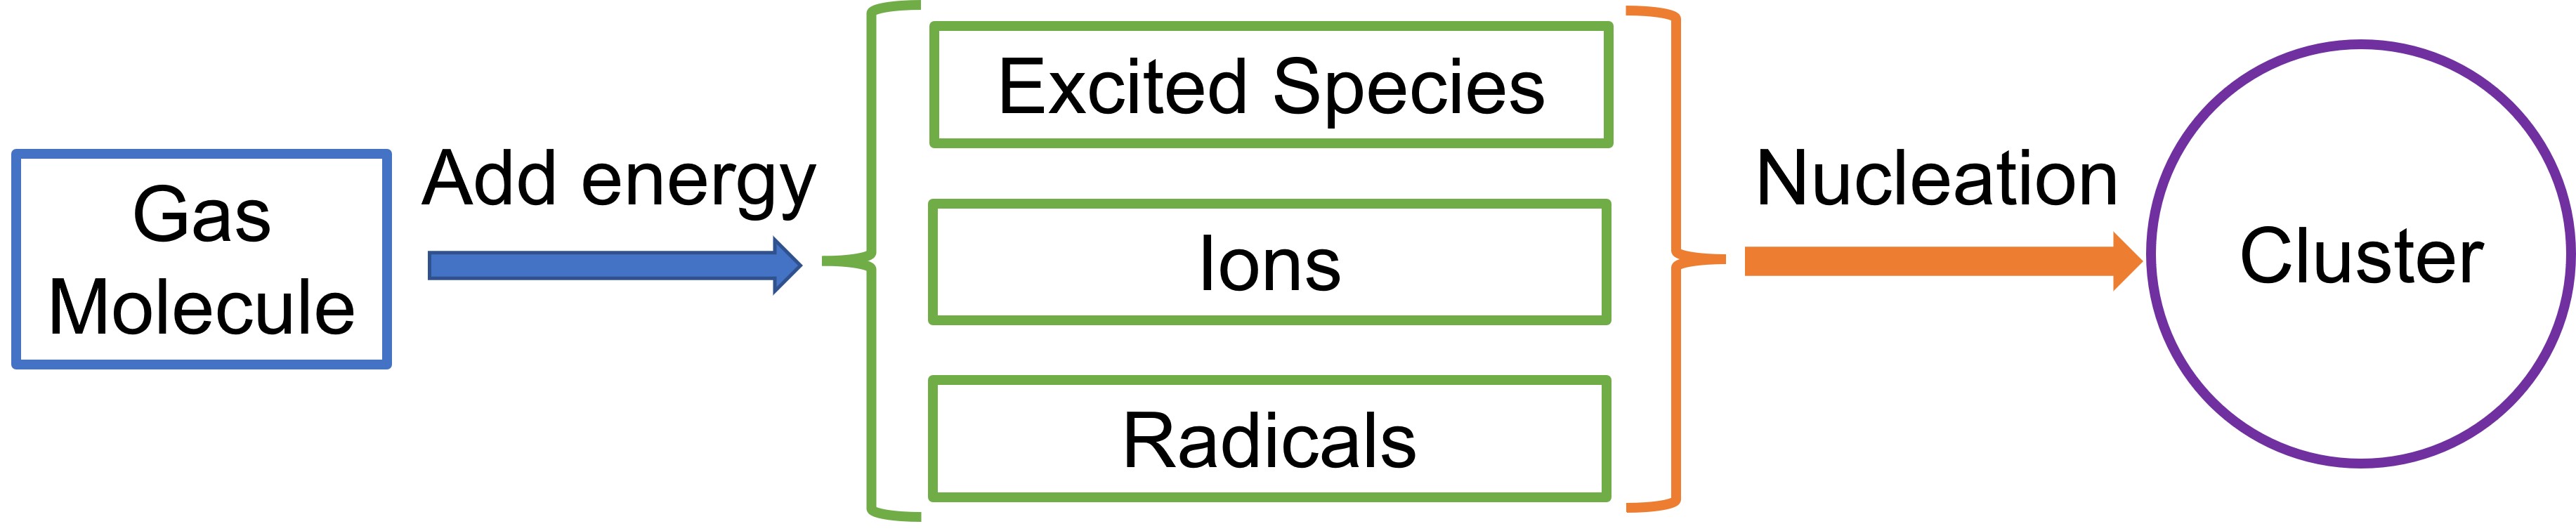
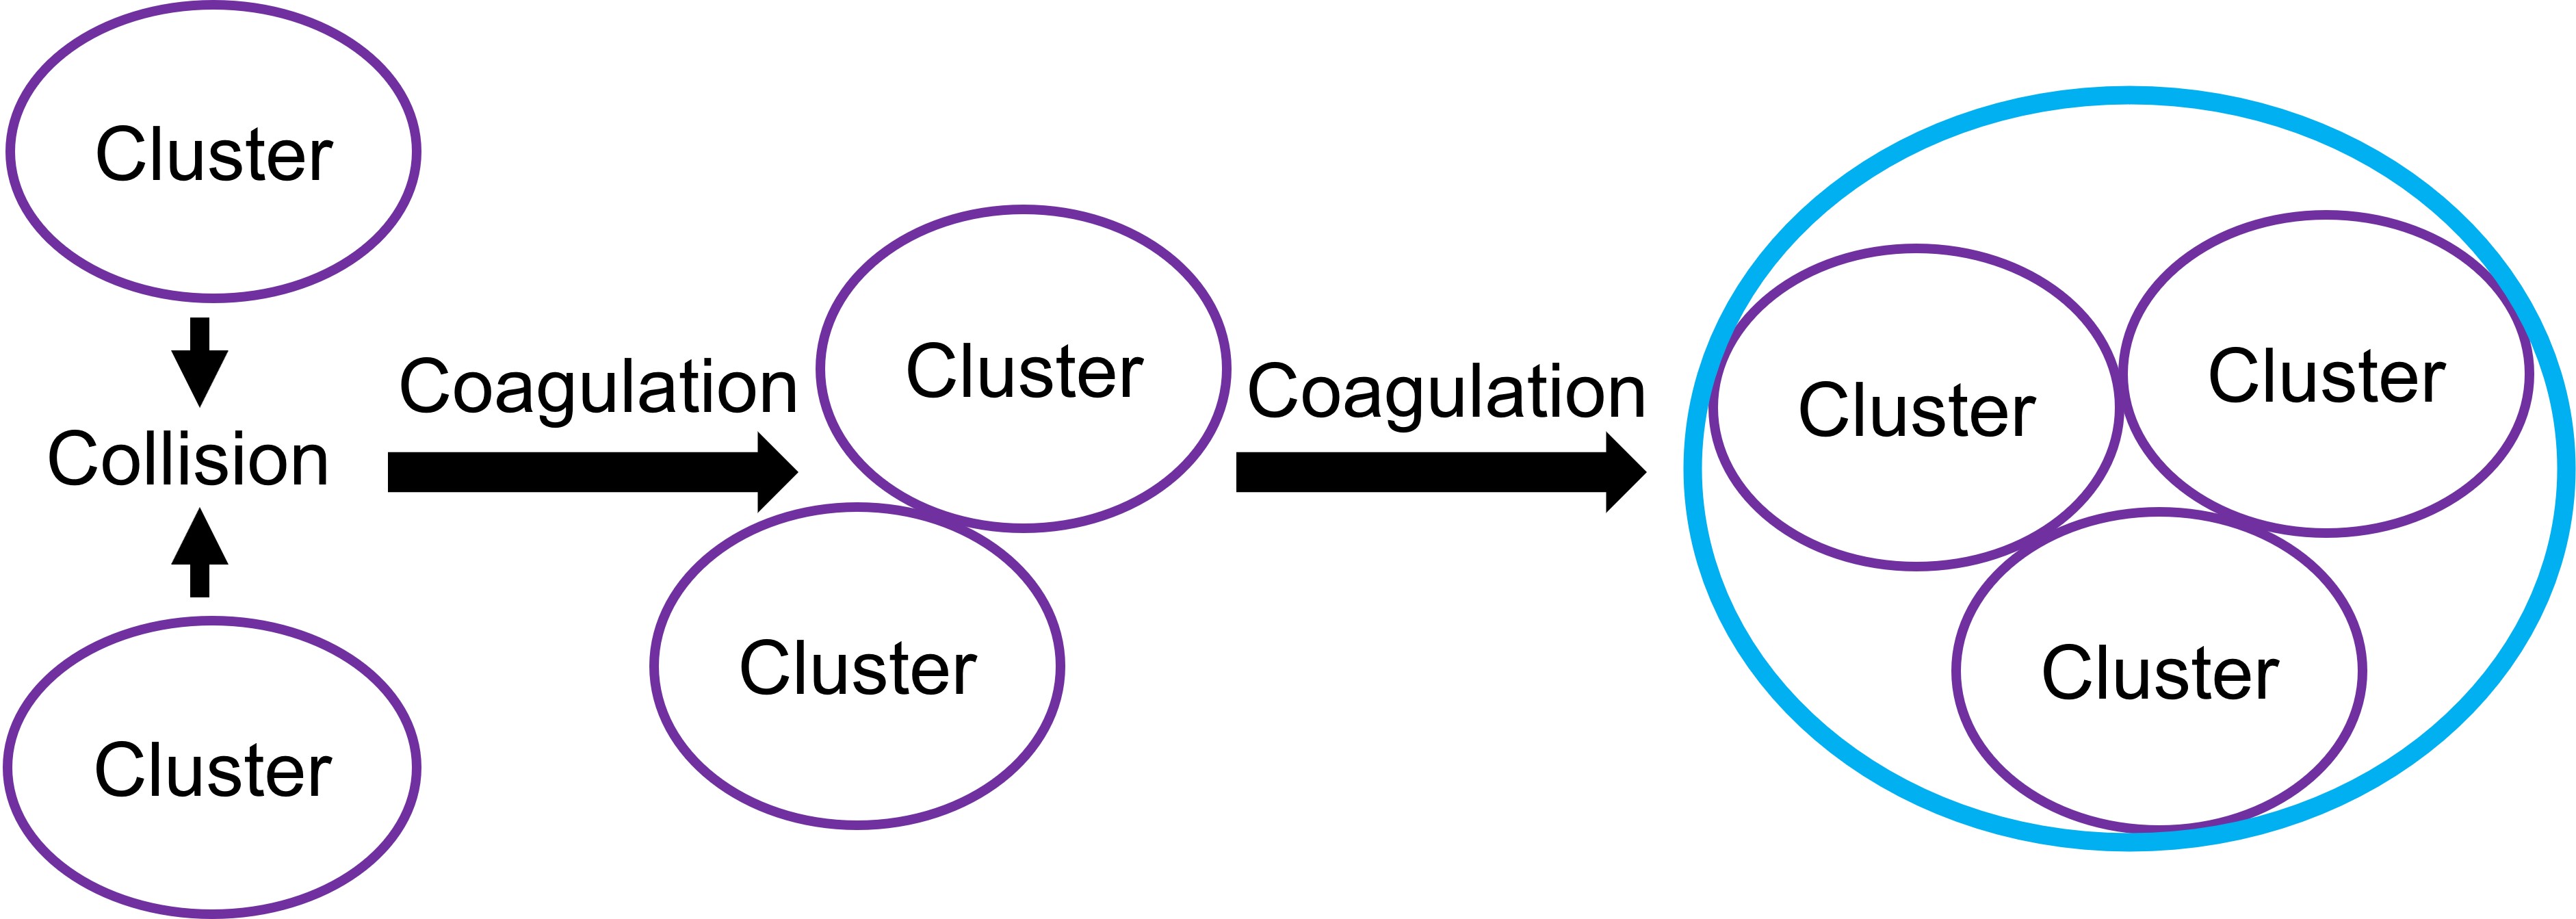
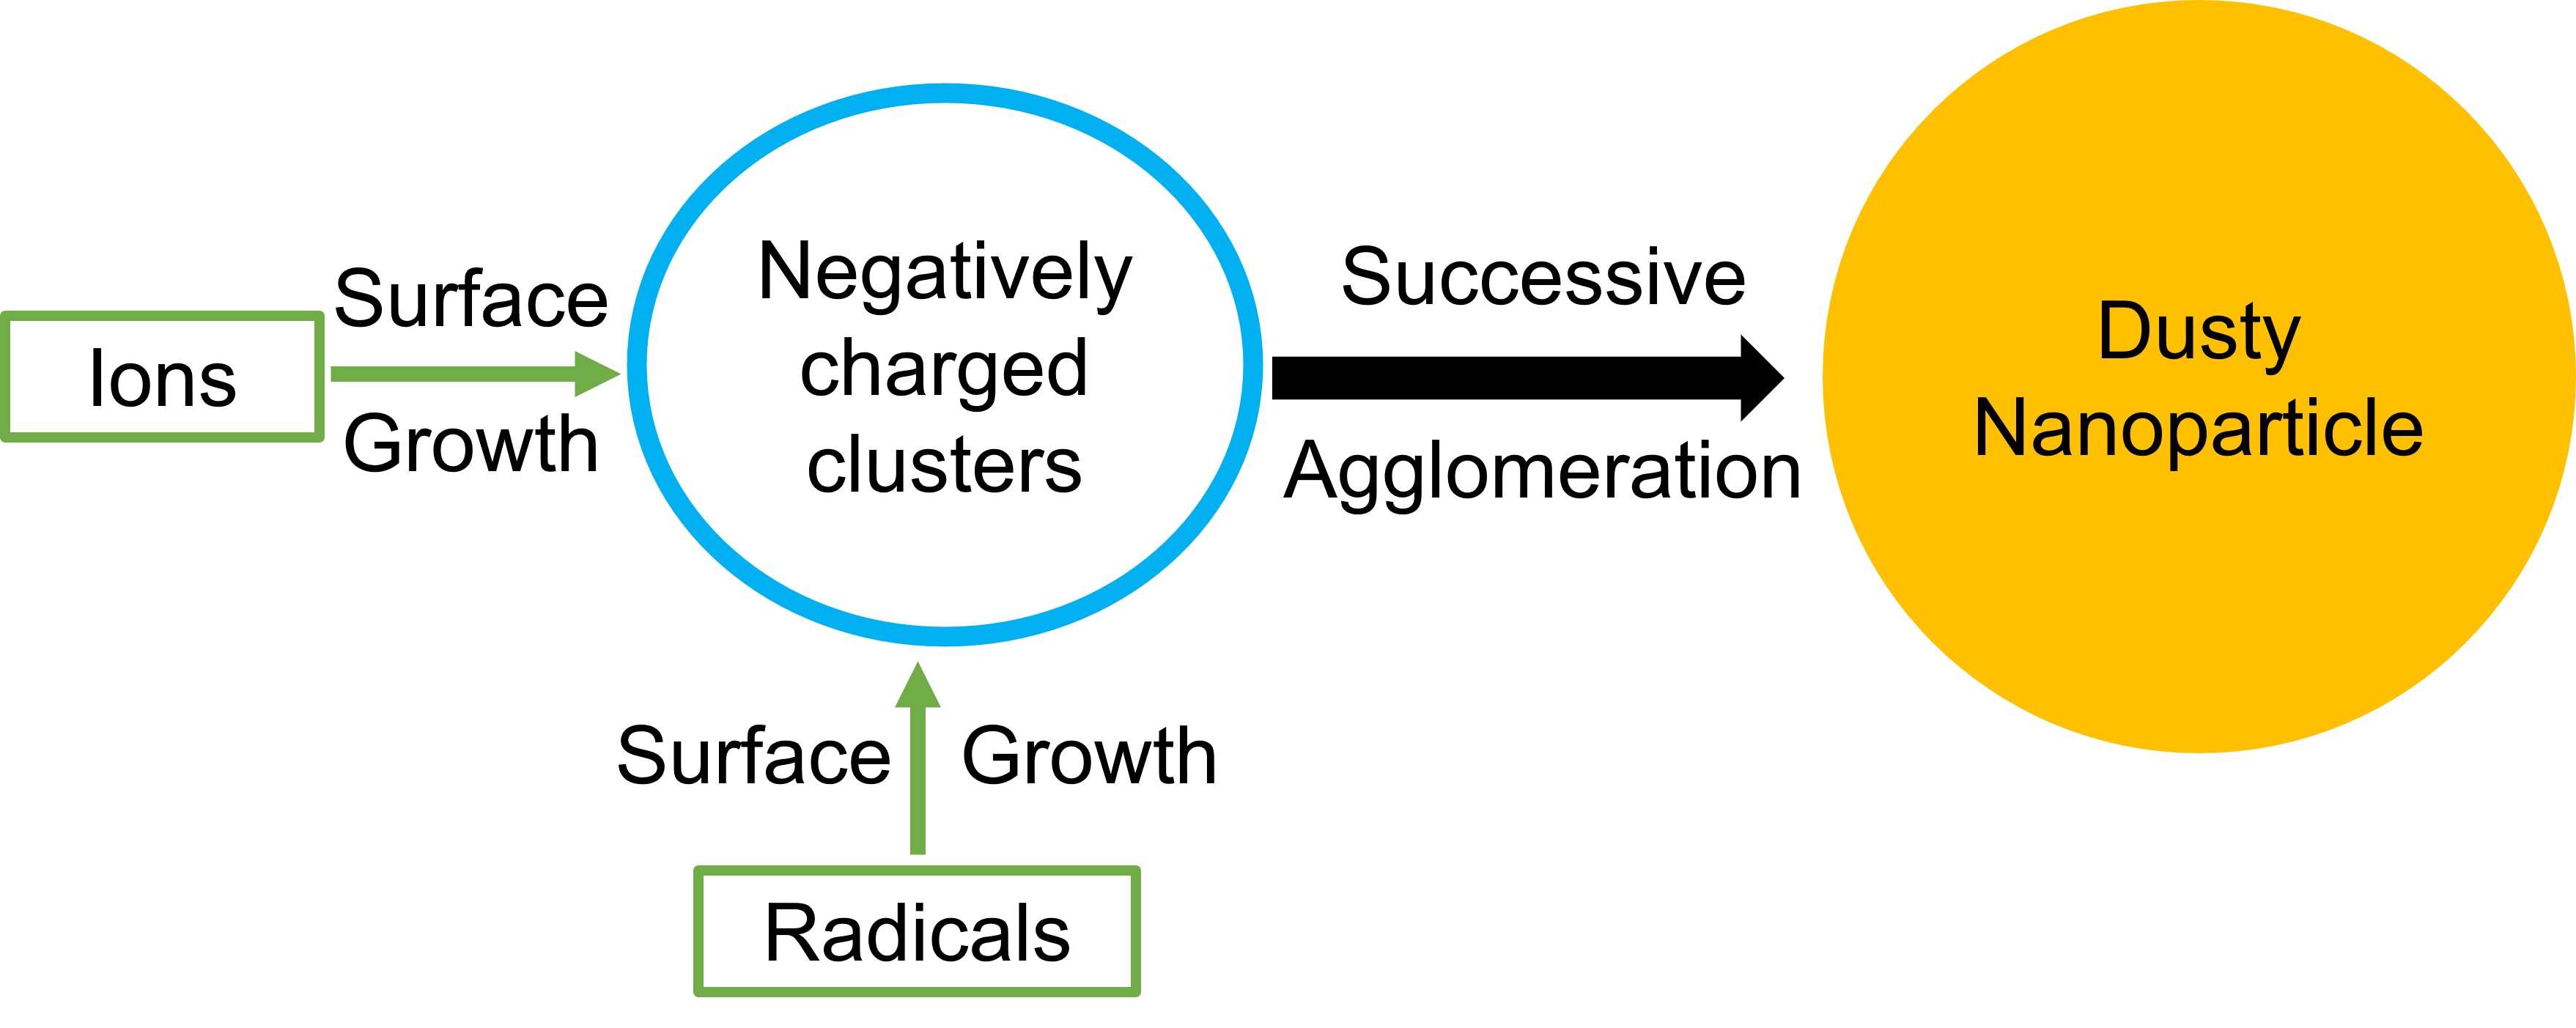
Dusty plasma particle growth happens in three steps, (i) nucleation, (ii) coagulation, and (iii) agglomeration [26, 29, 36, 46, 48, 49, 50]. They are depicted in Fig. 1(a), 1(b) and 1(c) respectively. The initial Ar ions in the background plasma bombard the reactive gases to facilitate the formation of other ions and excited species. During nucleation, clusters are formed from radicals and ions in the plasma within. During coagulation, clusters collide with each other and bond to create bigger particles. At this stage, the particles have accumulated a negative charge. During agglomeration, new growth occur on the surface of the bigger clusters. This occurs because the negatively charged dust can attract ions and radicals back to its surface. The particles’ size in the three aforementioned steps are in the order of 1 nm, 10 nm and 500 nm, respectively. Coagulation and agglomeration are dominated by chemisorption and physisorption, respectively. Additionally, we highlight that dust chemical properties can vary with size; for instance, coagulation in Ar/ dusty plasma resulted in sp2-rich cores, while agglomeration lead to sp2-poor mantles [29].
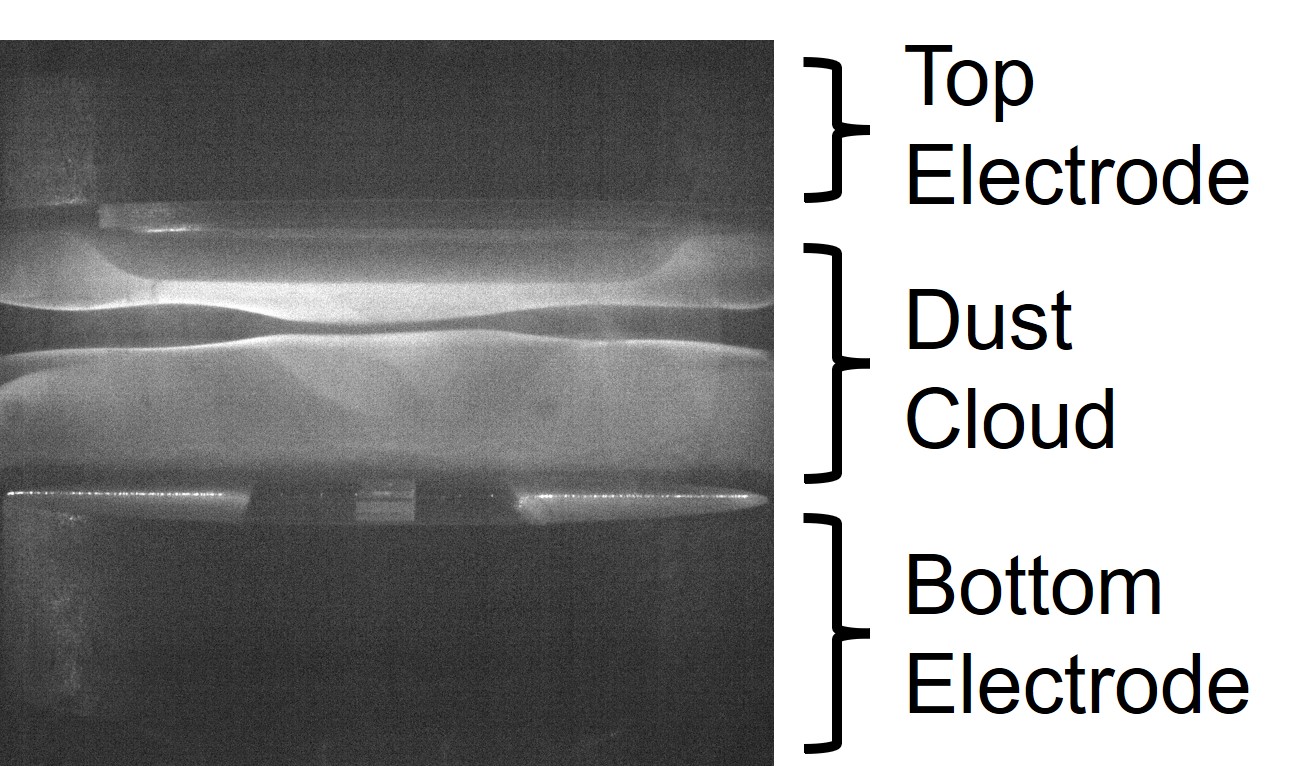
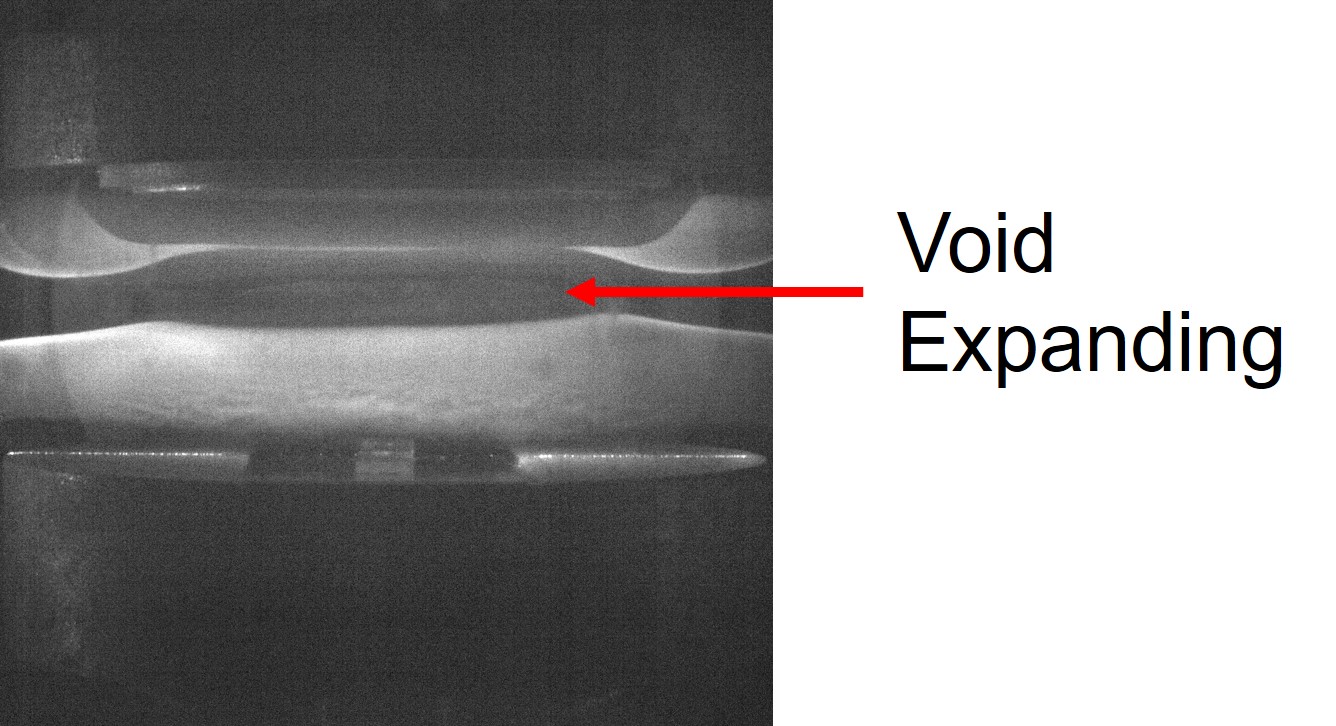
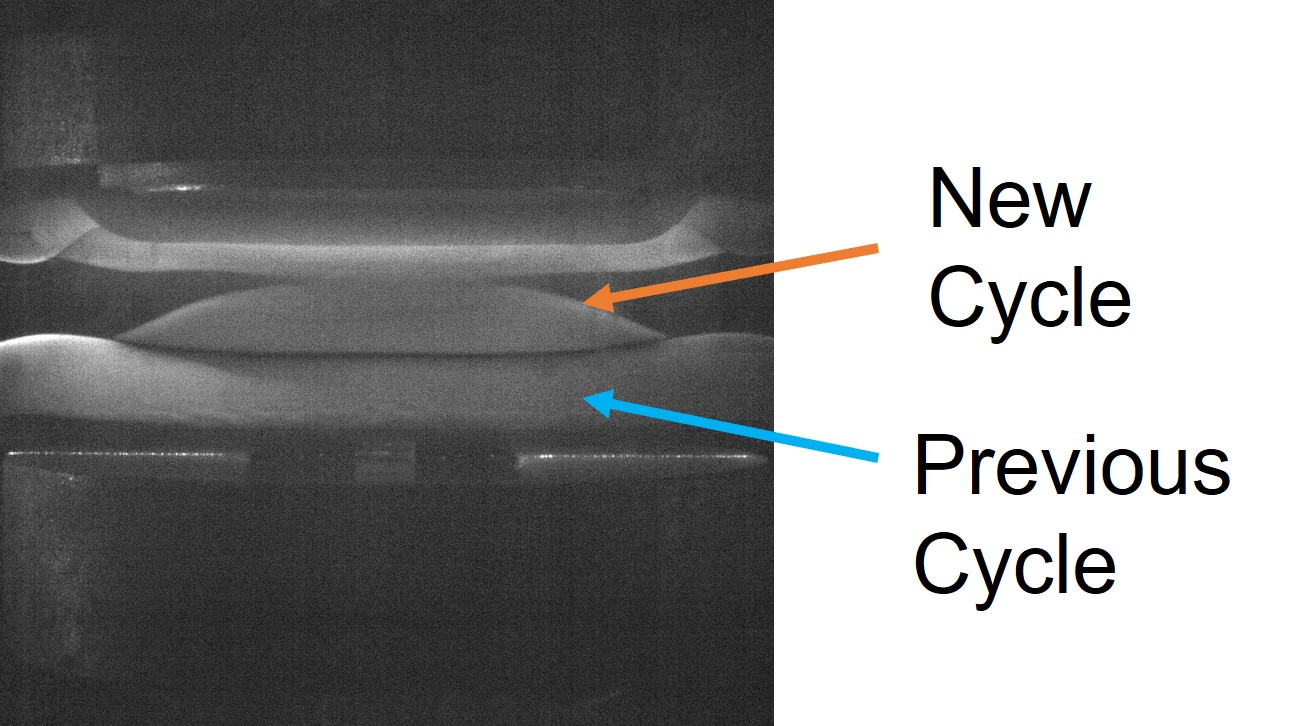
During growth, the particles form a dust cloud, as shown in Fig. 2(a), that is levitated in the plasma due to a balance of several forces such as gravitational force, electric force, thermophoretic force, ion drag force, and neutral drag force [51, 52, 53]. It is common to have a void, i.e., dust-free region, in the dust cloud. At some time during the agglomeration, the particles accumulate enough mass so that gravitational force becomes dominant and the particles are no longer levitated in the plasma. The particles move away from the plasma and the void expands, as shown in Fig. 2(b). That amount of time from the nucleation until the particles move away from the dust cloud is known as a growth cycle. A new cycle of growth immediately begins in the void, as shown in Fig. 2(c), and similarly reported in other literature [36, 54, 55].
In capacitively coupled radiofrequency (RF) plasmas, particles have grown from different reactive gases, but the timing of their growth cycles have varied between experiments, likely due to differences in experimental set ups. The cycle time in plasma is influenced by various factors, including plasma conditions and the concentration of reactive gases [56]. Nonetheless, a consistent pattern emerges in each case: particles undergo a growth cycle, gradually increasing in size and mass before ultimately losing their electrostatic balance and becoming unconfined. For example, in one Ar/ dusty plasma with 30 cm diameter electrodes, 8 cm electrode spacing, and 10 - 20 W of applied RF power, a cycle length of 35 minutes was measured using Rayleigh/Mie scattering of infrared signals [57]. In another Ar/ dusty plasma with 75 mm diameter electrodes, 25 mm electrode spacing, and 5 - 30 W of applied RF power, a cycle length of 55 s was measured using pictures taken with a USB camera [58]. In yet another experiment using Ar/ dusty plasma, with 10 cm diameter electrodes, 4 cm electrode spacing, and 20 W of RF power, a 2-minute cycle was measured by analyzing the scattered laser beam intensity [59]. Ar/ dusty plasma have been well studied in literature. However, as mentioned above, there has been a shift towards exploring different kinds of materials in plasma. Other gases besides Ar/ have also demonstrated a growth cycle. For example, in the same experimental set up at the previously mentioned one, when switching to Ar/methane plasma, it required 60 W of RF power to initiate plasma ignition and a 15-minute cycle time was measured [59]. Using techniques such as mass spectrometry, optical emission spectroscopy (OES), and measurements of electron temperature and electron density, a 150 s cycle was observed in Ar/HDMSO plasma with a top electrode diameter of 10 cm, bottom electrode diameter of 12 cm, electrode spacing ranging from 3.5 to 4 cm, and an RF power of 30 W [60, 61, 62].
This study reports the growth cycles of nm-sized spherical titania particles in Ar/TTIP plasma and compares them to Ar/ dusty plasma in both magnetized and non-magnetized conditions. Specifically, it investigates the impact of a 480 Gauss magnetic field on cycle times, which can offer precise control over dust size. The growth cycles were monitored using techniques such as OES, laser light scattering and temporal dust size distributions, shedding light on the dynamics of particle formation in these plasmas.
2 Method
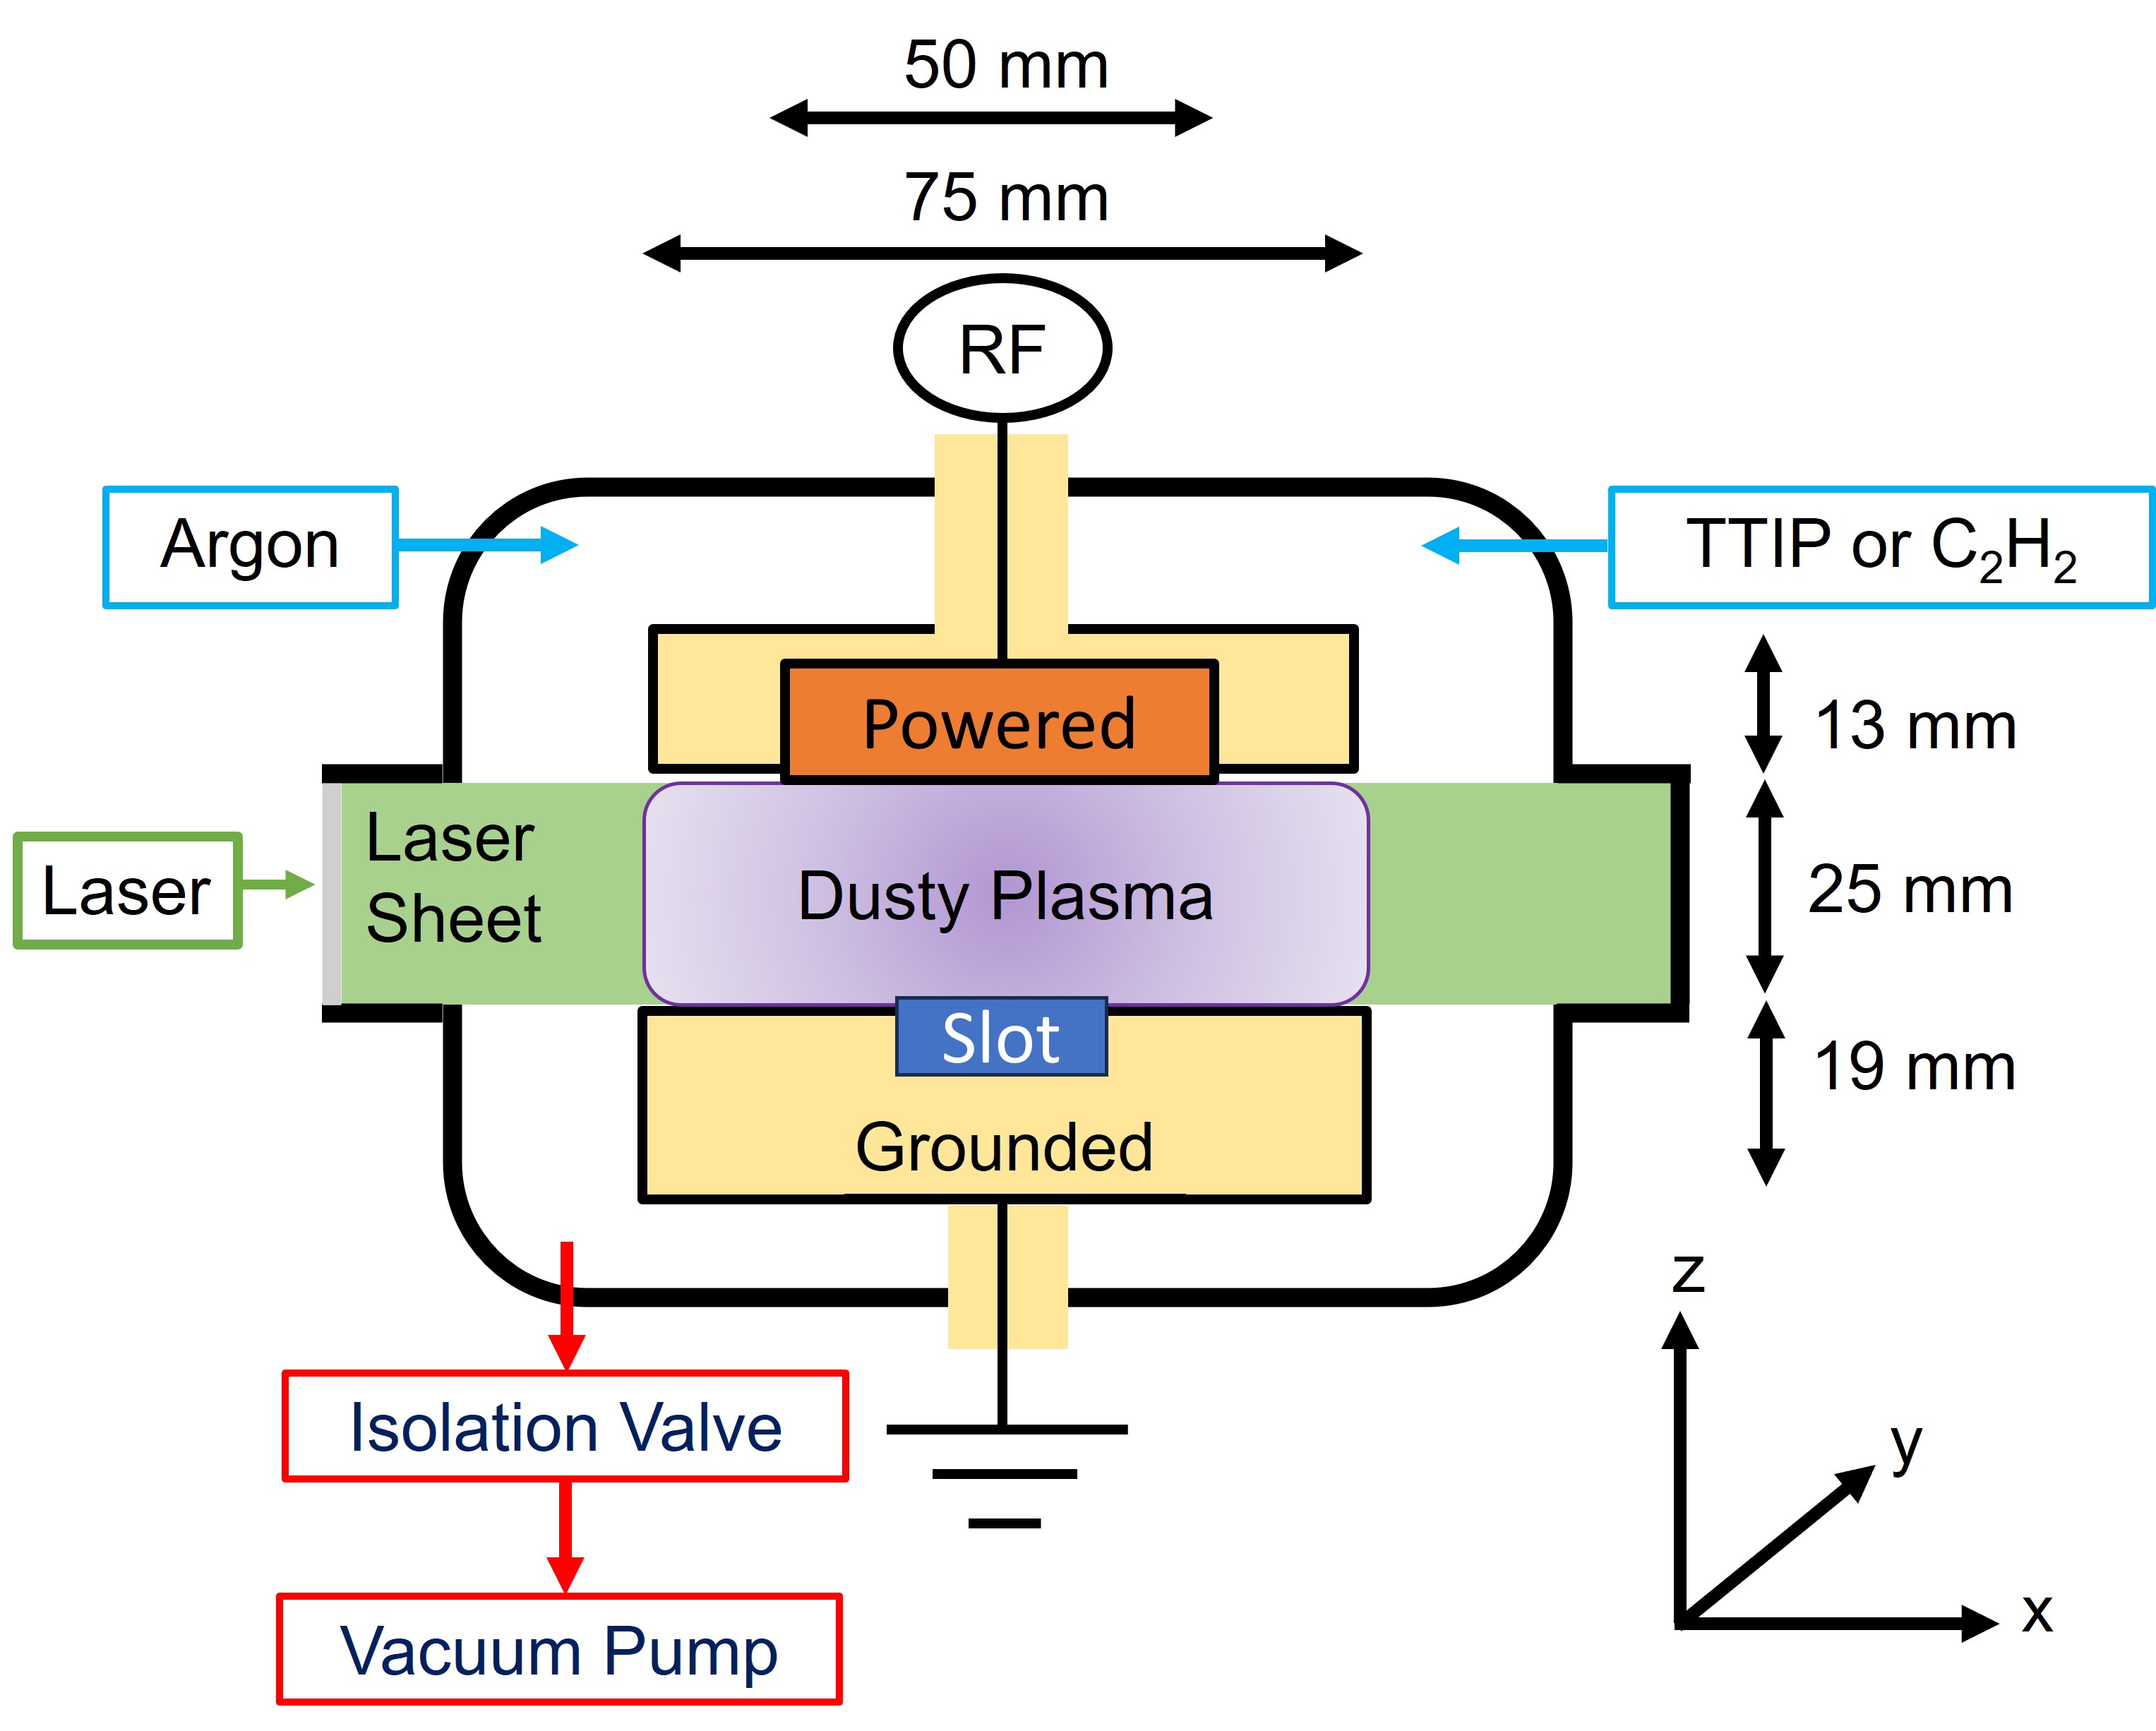
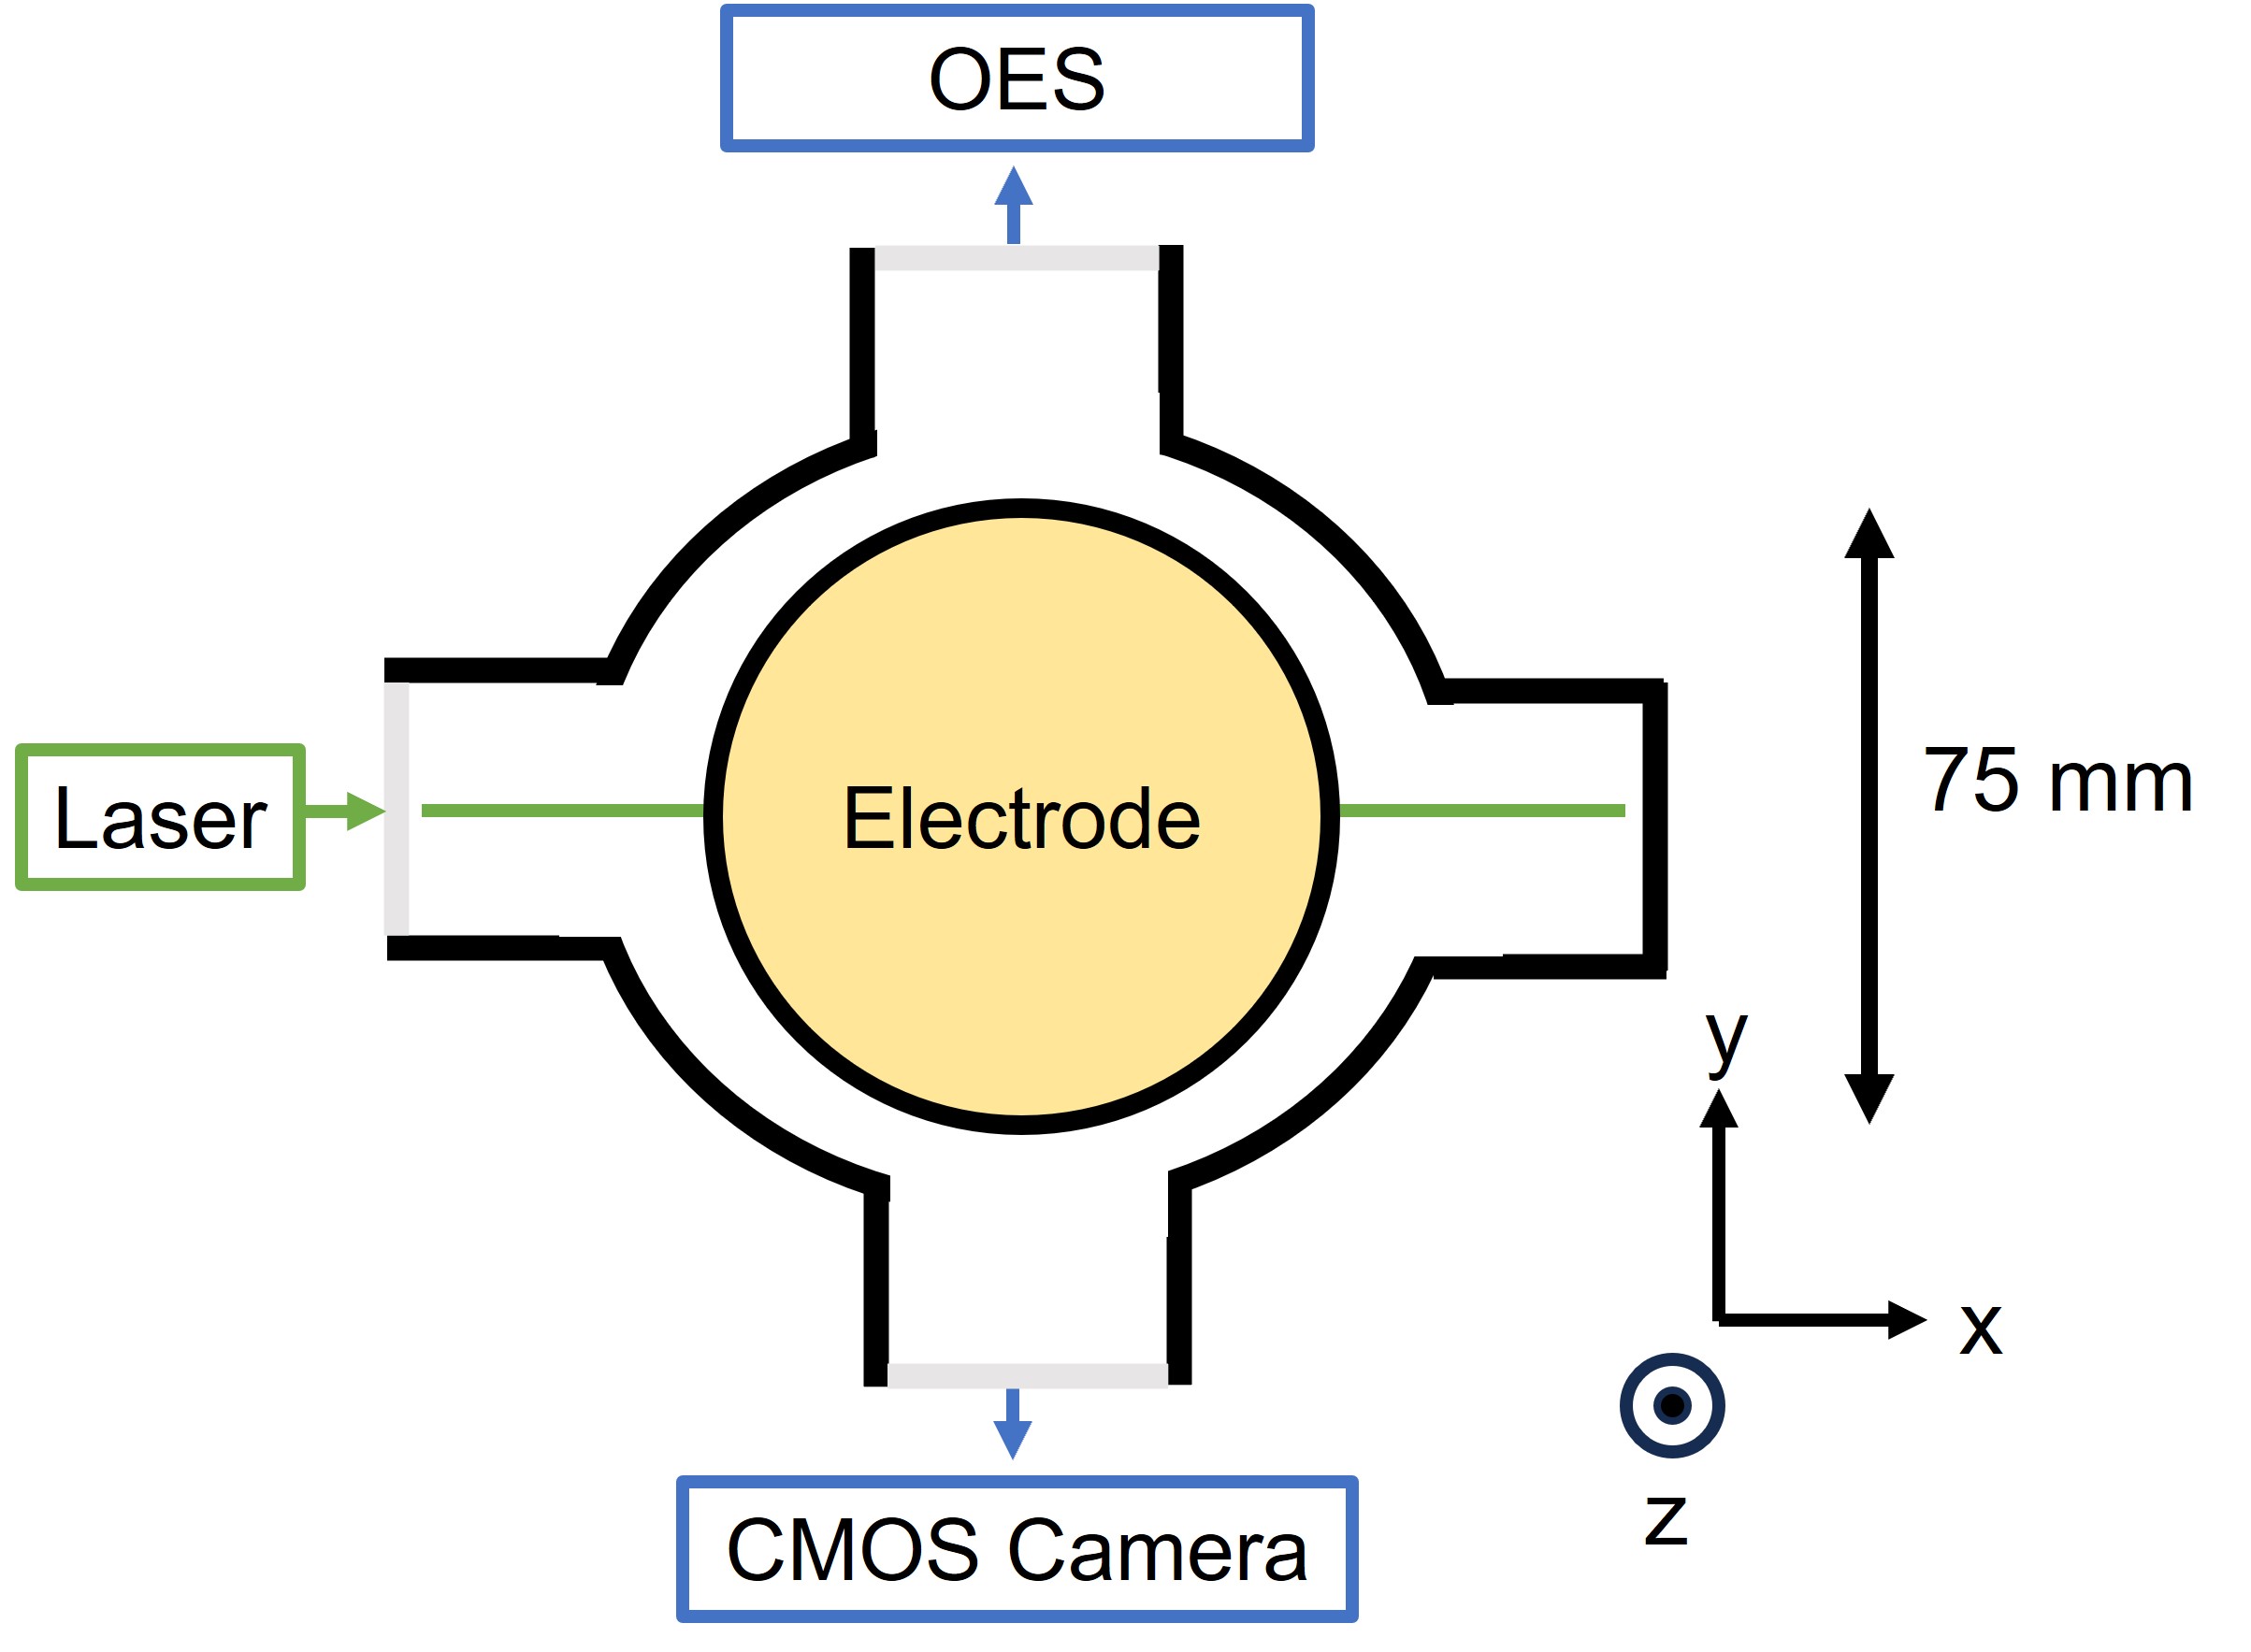

The particle growth experiments reported in this paper were performed using the experimental setup previously reported in literature [36, 58, 55]. A brief description of how this chamber is modified for this study is discussed below. A schematic drawing and photograph of the experiment are shown in Fig. 3. The experimental vacuum chamber was a 6-way, stainless, ISO-100 cross. Inside of the chamber, a pair of 75 mm aluminum electrodes, that have a 25 mm separation were used in a parallel plate configuration in order to produce a capacitively coupled RF generated plasma. The electrodes are configured with the upper one powered and connected to a 300 W, 13.56 MHz (RF VII, Inc RF-3-XIII) fixed frequency RF generator, through a (RF VII, Inc AIM-5/10) auto matching network. The central 50 mm of the top electrode was powered. This central region was surrounded by a grounded counter ring with an inner diameter of 50 mm and an outer diameter of 75 mm as shown in Figs. 3(a) and 3(c). The lower electrode, also 75 mm in diameter, was grounded. The top and bottom electrode were 13 mm and 19 mm thick respectively. The base pressure of the chamber prior to particle growth experiment was 3.0 0.3 milliTorr (mTorr). The TTIP cylinder and its line connected to the chamber were heated to 75.0 0.5 . A Swagelok VCR metering valve (SS-SVR4-VH) was opened to allow the TTIP pressure to be 35 3 mTorr in the chamber. When carbonaceous dust was grown, the TTIP line was replaced by a line, which was controlled by a mass flow controller (MFC). The flow of as set to 1 standard cubic centimeters per minute (sccm). This also brought the chamber pressure to 35 1 mTorr. After the reactive gas started flowing, a different MFC was used to flow Ar into the chamber at 7 sccm. This brought the total chamber pressure to 45 3 mTorr. The total experimental pressure was then brought up to 300 1 mTorr by adjusting an isolation valve (Edwards SP Speedivalve) between the chamber and vacuum pump. The plasma was then ignited at 60 W for the first 10 s, and then brought down to 30 W for the remainder of the experiment. Fig. 4 is a flowchart which summarizes the experimental procedures.
The chamber had 3 quartz viewing ports. A green (532 nm) laser sheet was used to illuminate the dust cloud in two dimension from one viewing port. A complementary metal-oxide semiconductor (CMOS) camera (xiQ MQ042MG-CM) was used to capture the evolution of the dust cloud during particle growth experiment up to atmost 50 frames per second (FPS) from the second viewing port. OES was used to monitor line intensities between 680 nm and 860 nm from the third viewing port. These are shown in Fig. 3(b). A broadband spectrometer was used (Avantes ULS4096CL). The OES resolution was 0.59 nm, the slit size was 25 m, grating was 600 lines/mm, the integration time was 100 ms, and 5 data points were averaged.
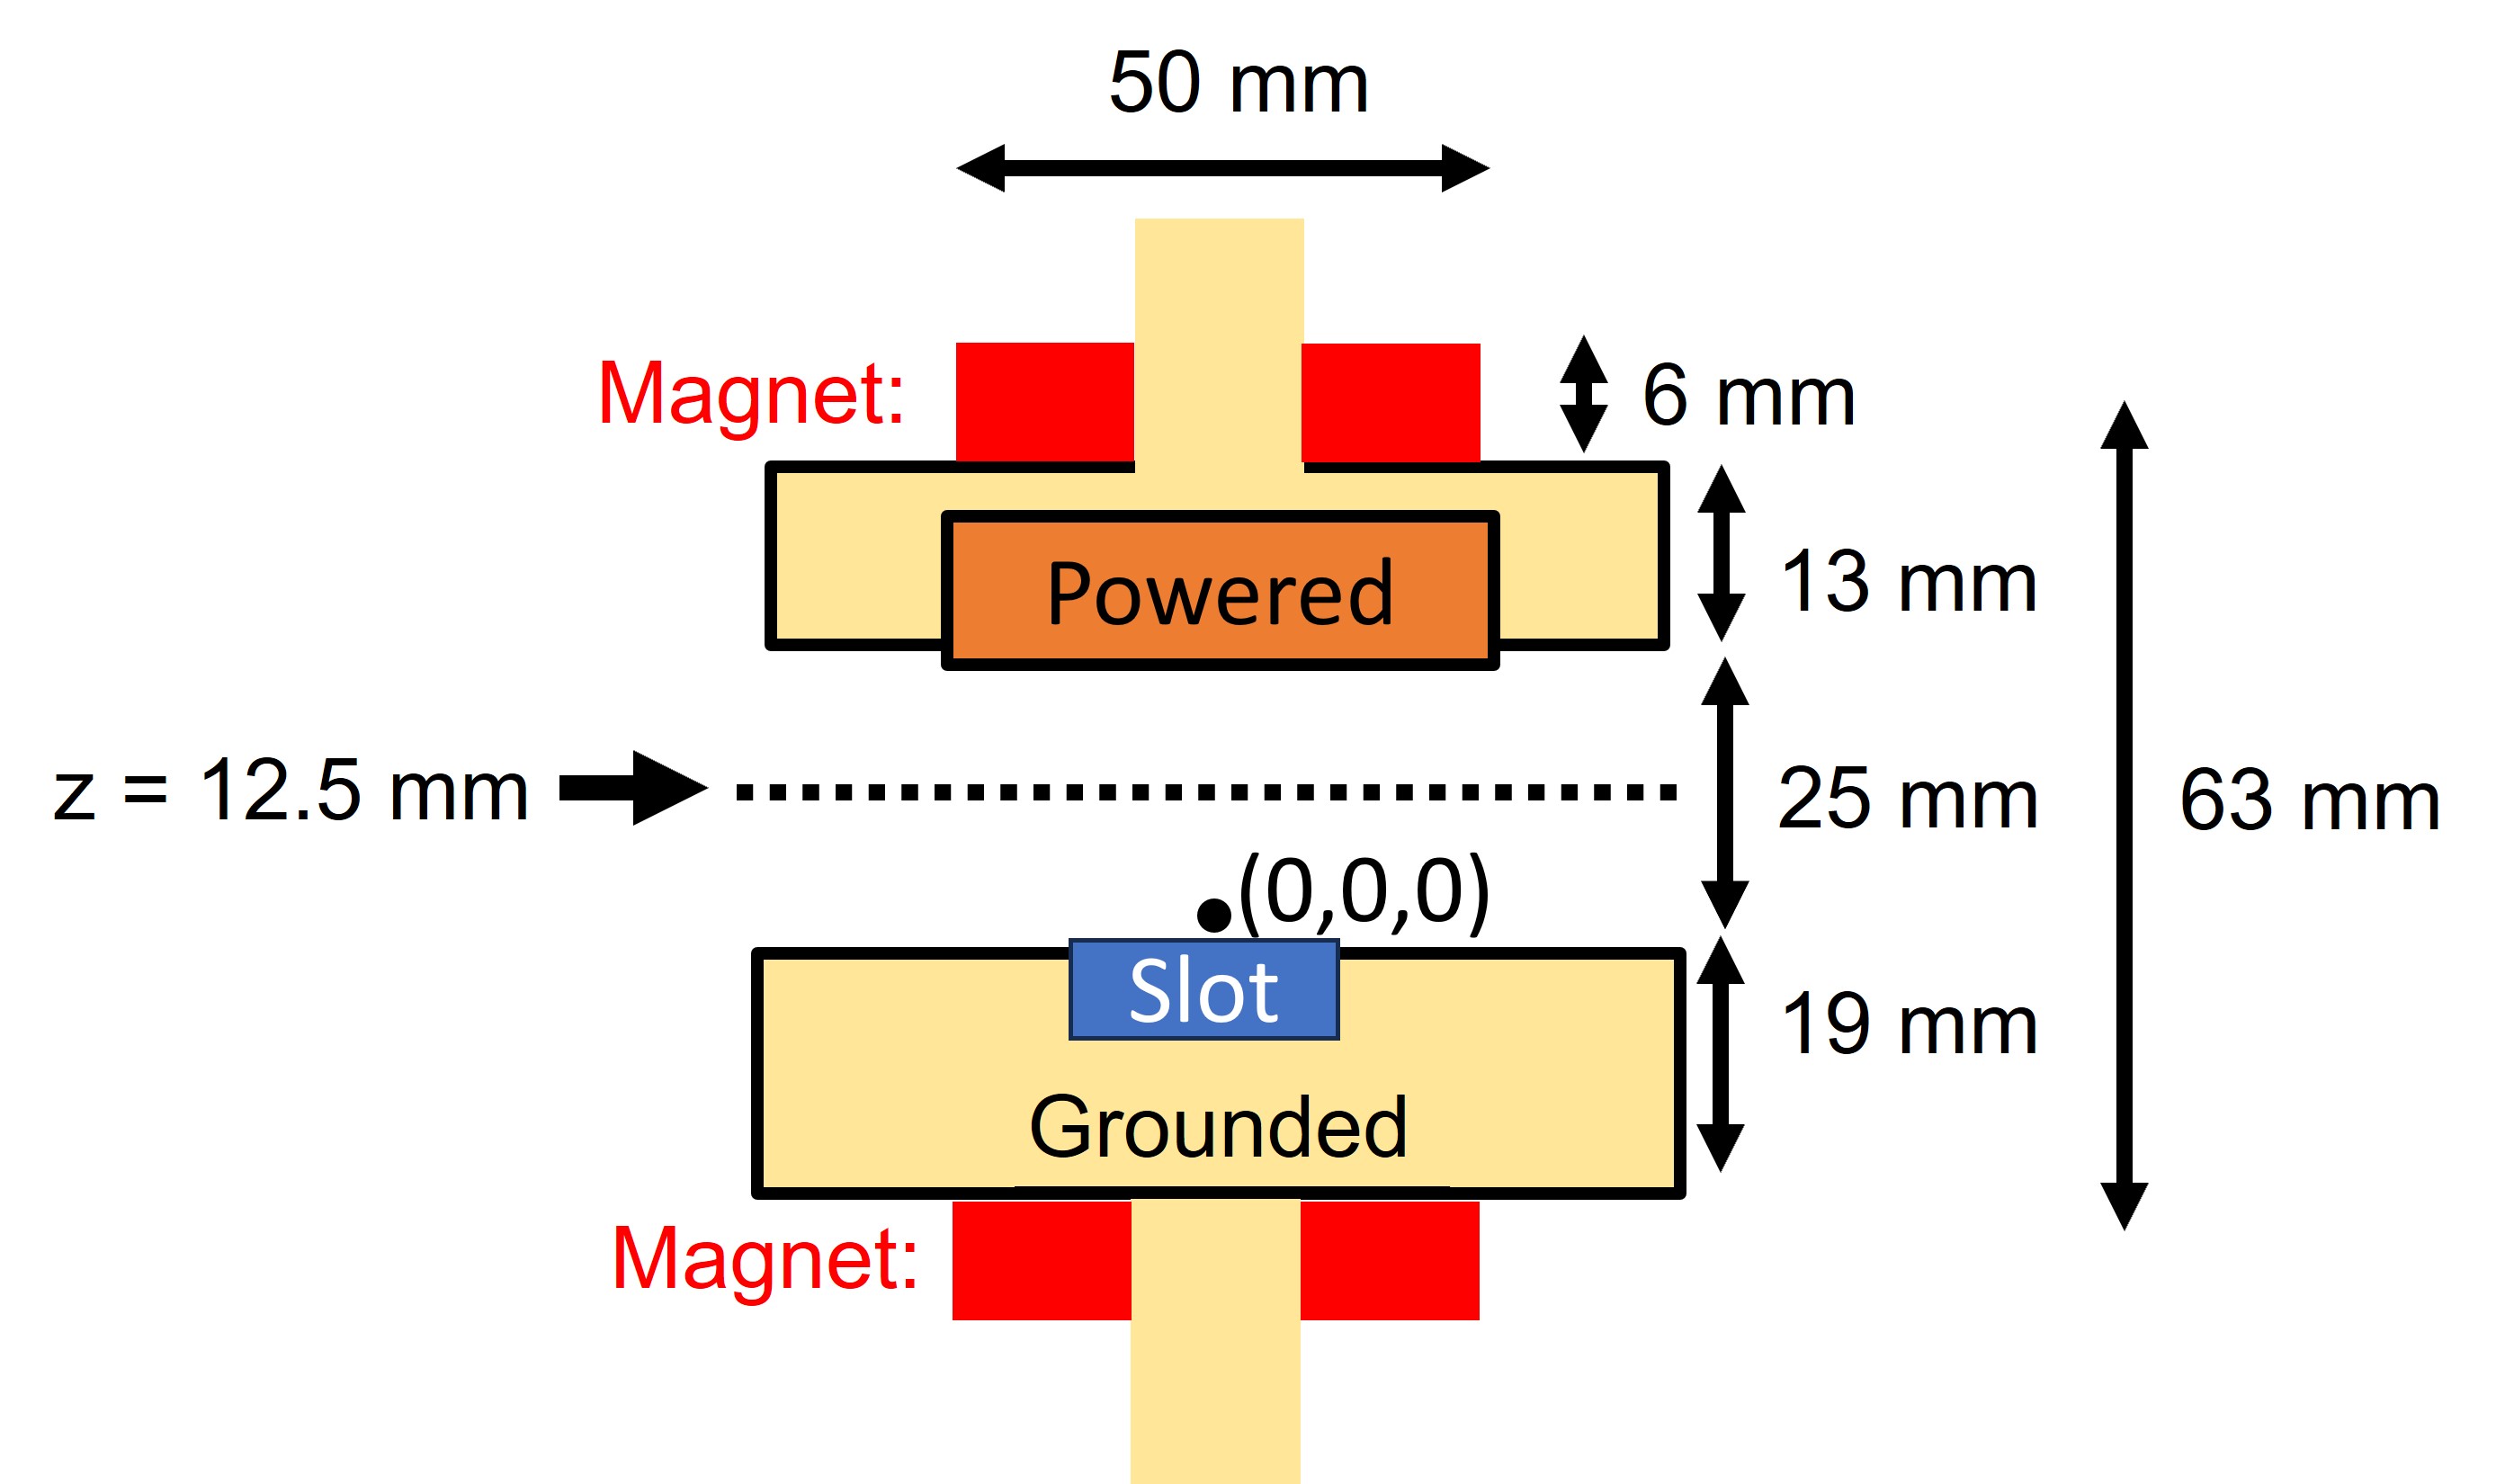
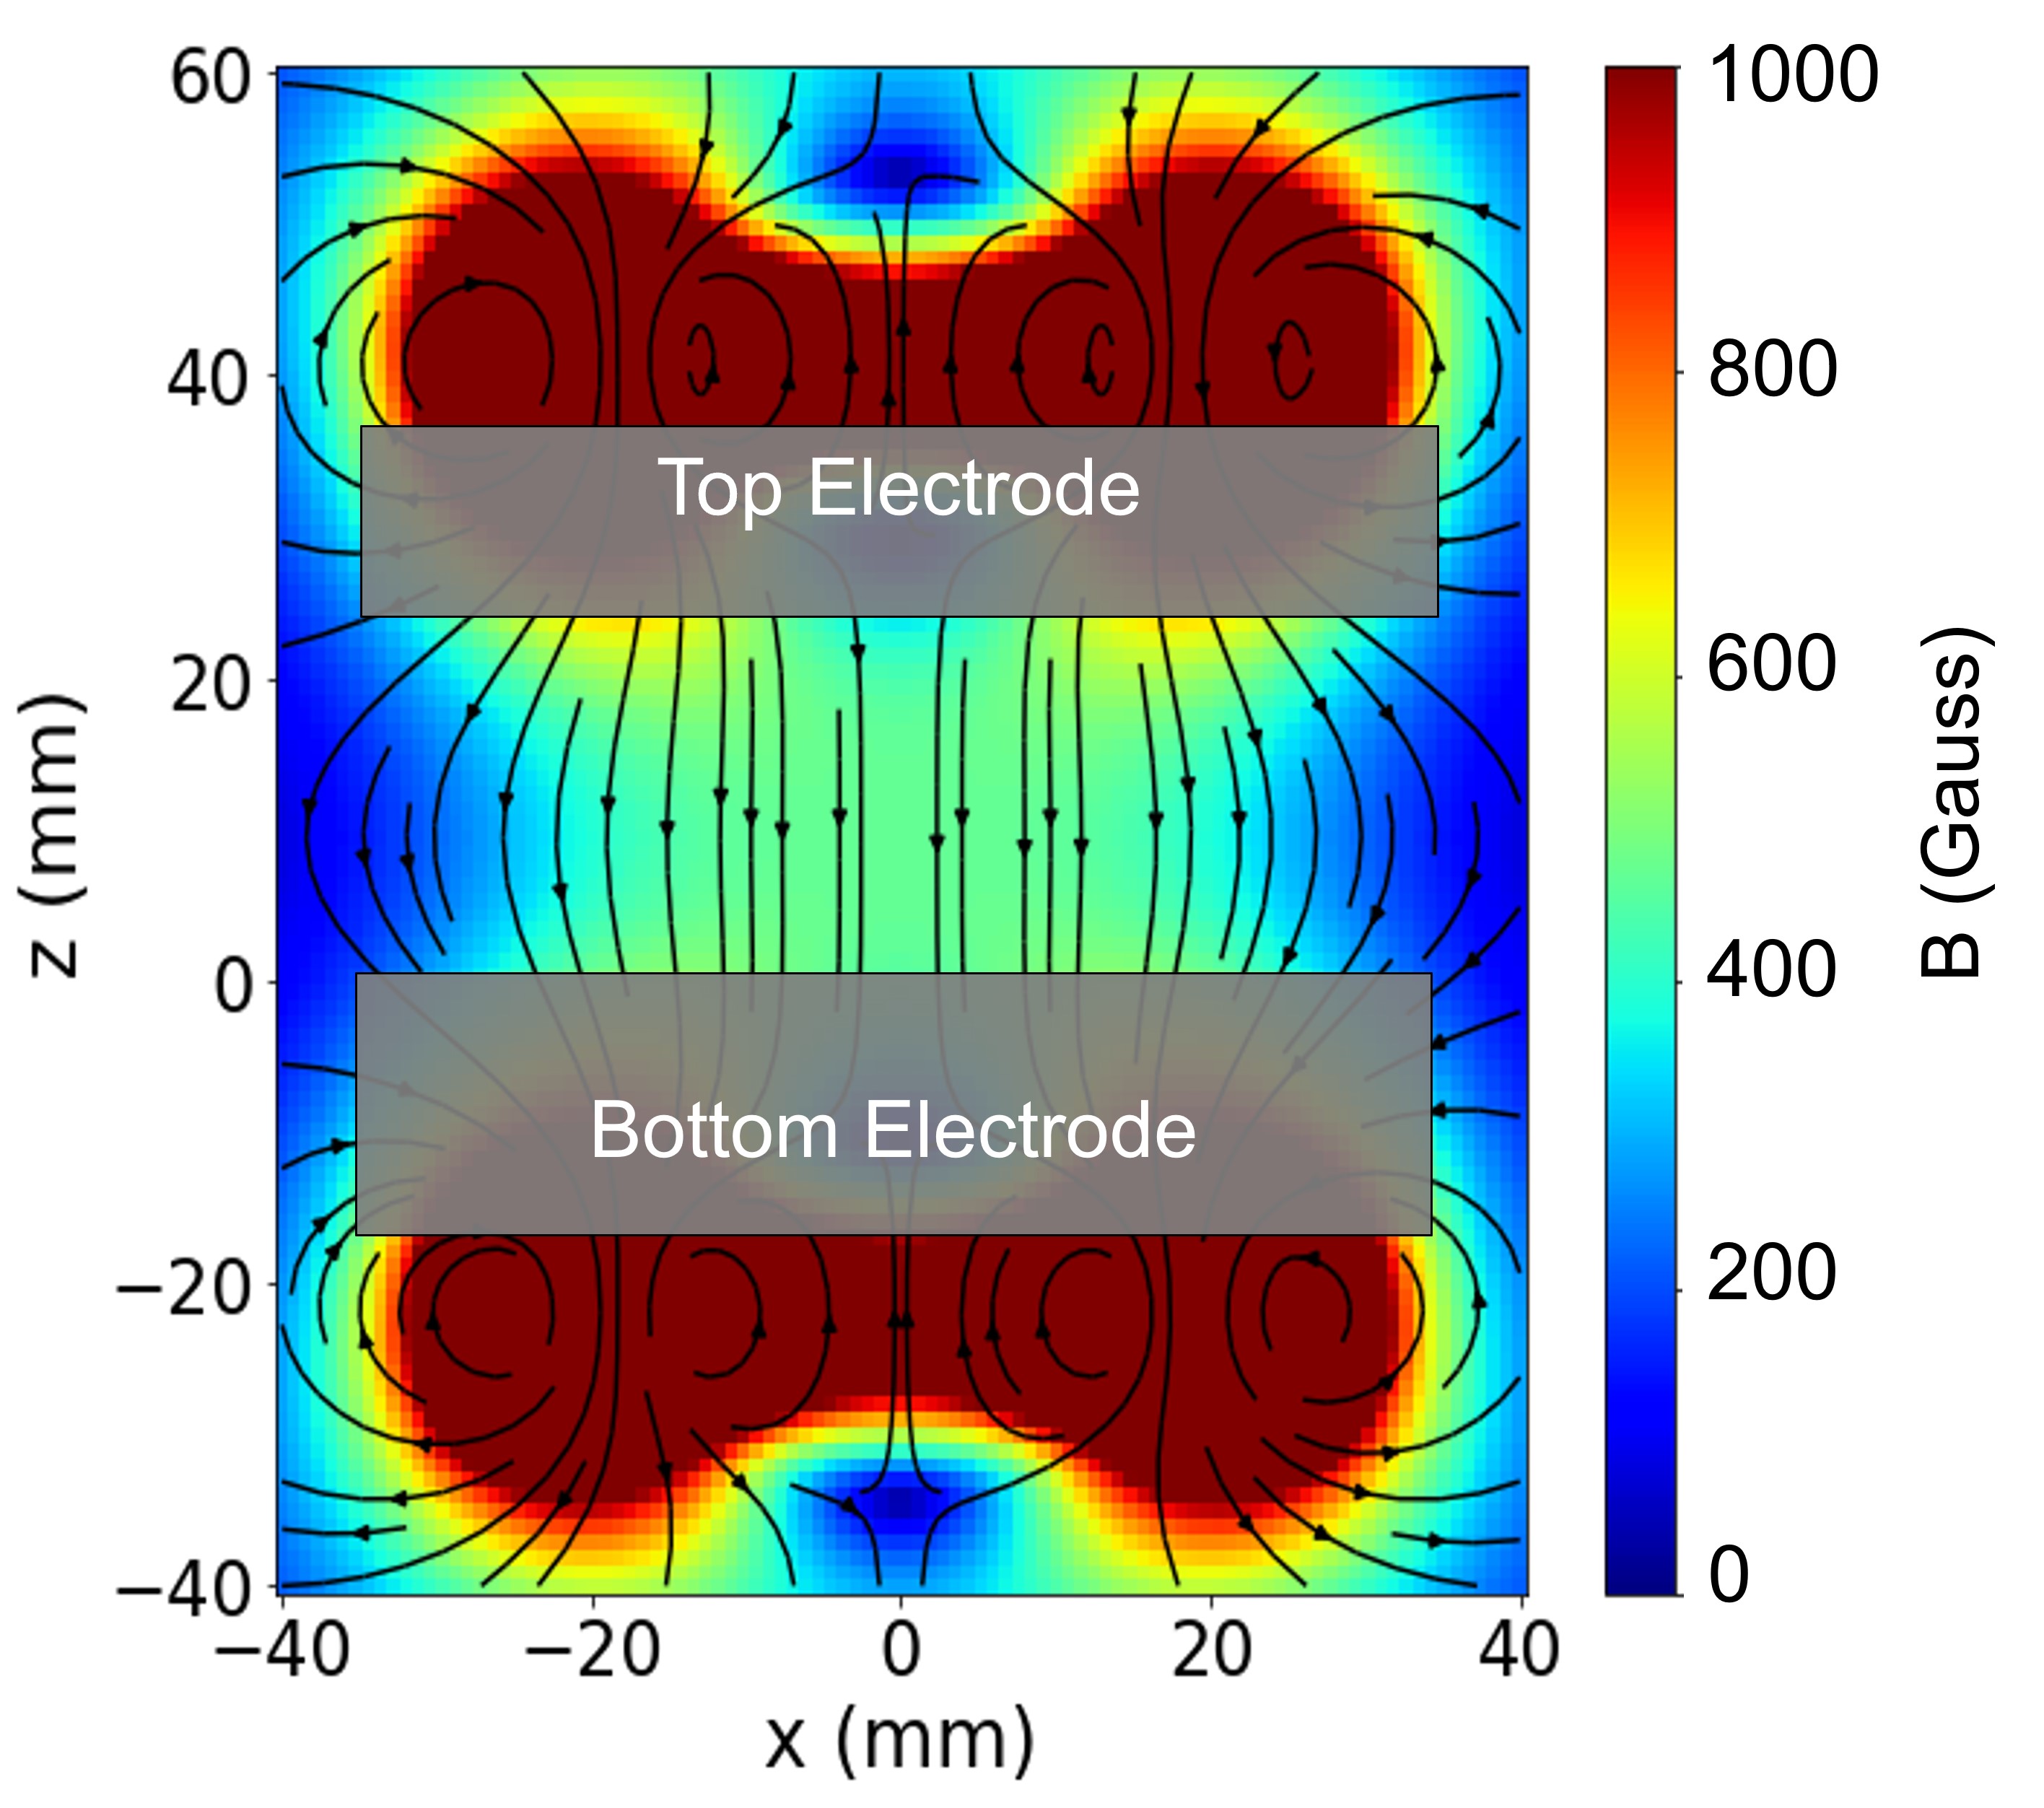
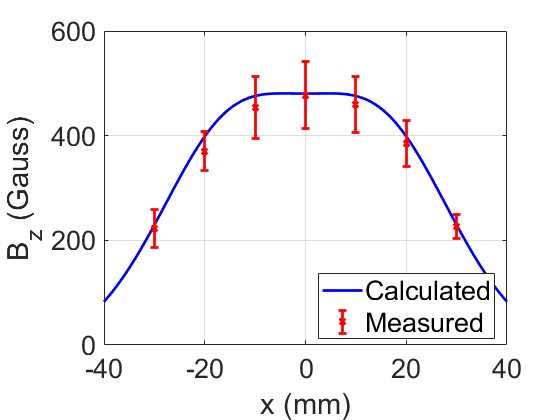
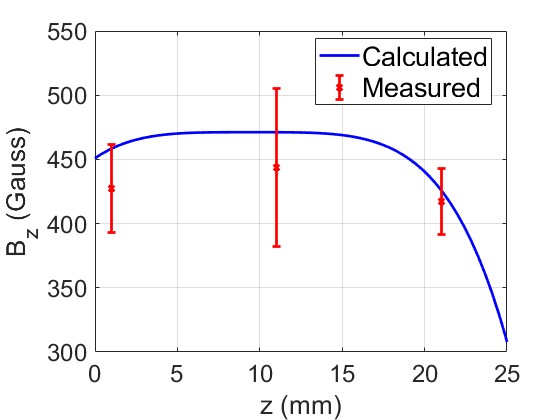
When experiments were performed using magnetic field, a pair of axially magnetized permanent magnet rings were used. Each hollow cylindrical magnet was made from neodymium-iron-boron (NdFeB), grade 42 with a 51 mm outer diameter, 25 mm inner diameter, and 6 mm thickness. The magnets were placed above and below the plasma electrodes as shown in Fig. 3(c) and produced a nominal magnetic field at the mid-point between the electrodes of Gauss. The magnetic field lines distribution in a two dimensional sheet at the center of the electrode is shown in Fig. 5(a). The coordinate origin (0,0,0) is at the center of the surface of bottom electrode. The field lines were calculated using magpylib library in Python [63, 64]. Moreover, Fig. 5(b) shows the radial profile of at the middle of the two electrodes, i.e. z = 12.5 mm, and Fig. 5(c) shows the profile of as a function of z at x = 0 mm. The red values are measured using F.W. Bell Gauss/Teslameter Model 5080 and blue lines are calculated using magpylib.
3 Results
In these particle growth experiments, our goal was to characterize the cyclical formation of titania nanoparticles in the presence and absence of a magnetic field and to compare with the formation of carbonaceous nanoparticles. The growth cycles were assessed through three distinct methods: firstly, by measuring the line intensity of Ar I at 760.5 nm via OES; secondly, by capturing images of laser light scattered from the dust cloud using a CMOS camera; and thirdly, by analyzing the dust size distribution for particles grown at different length of time. Each of these processes is described below as they are applied to this study.
3.1 Optical Emission Spectroscopy
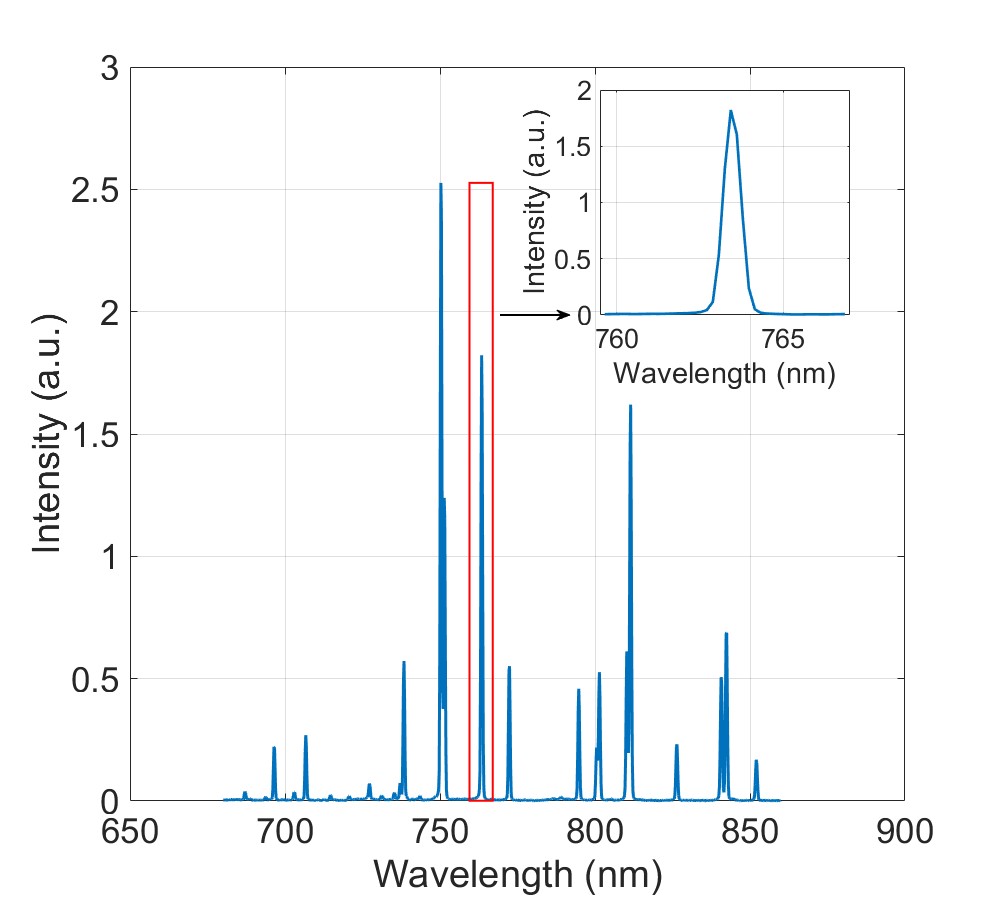
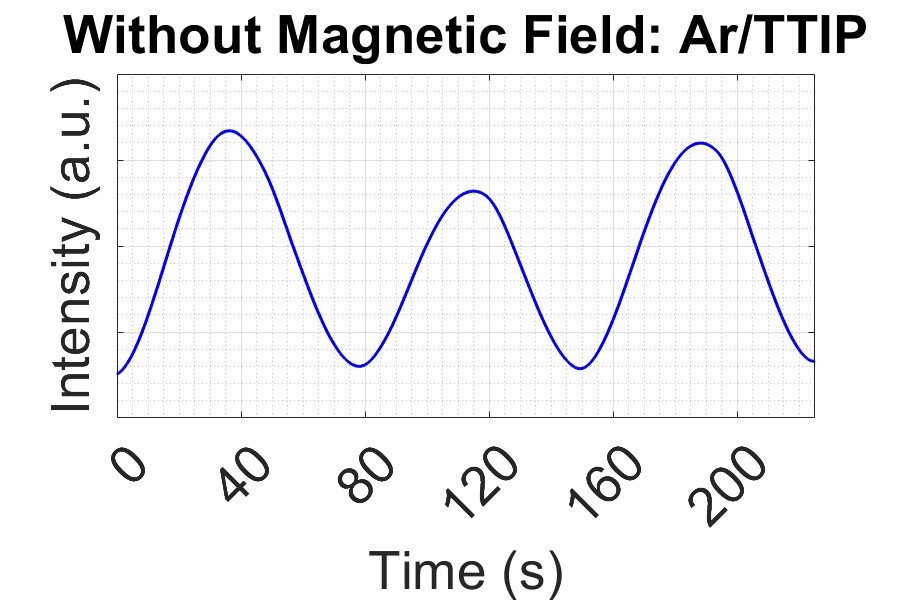
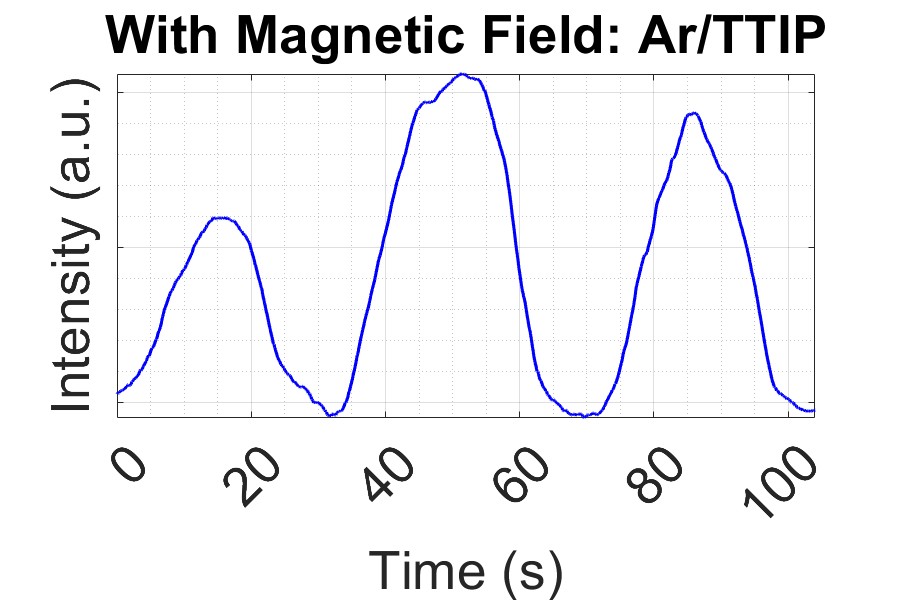
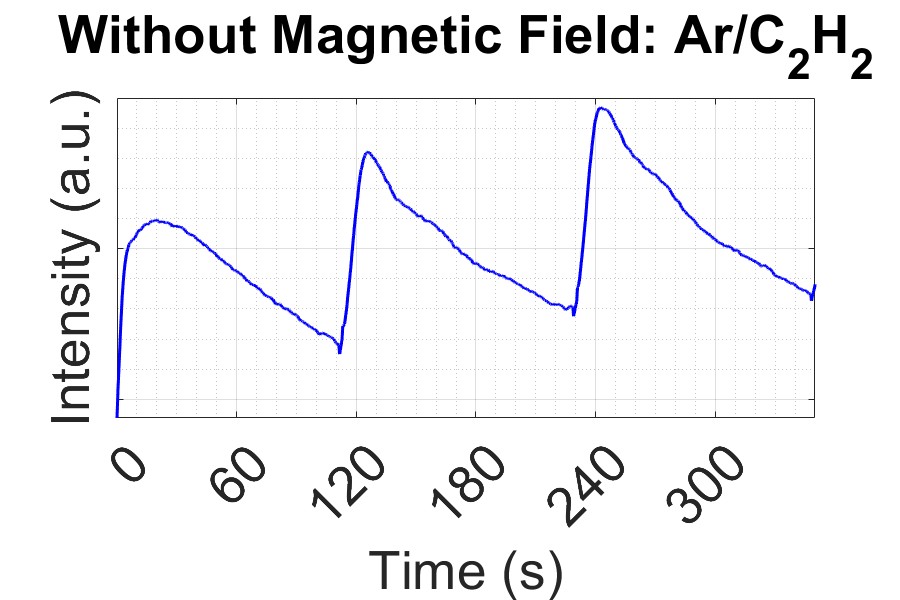
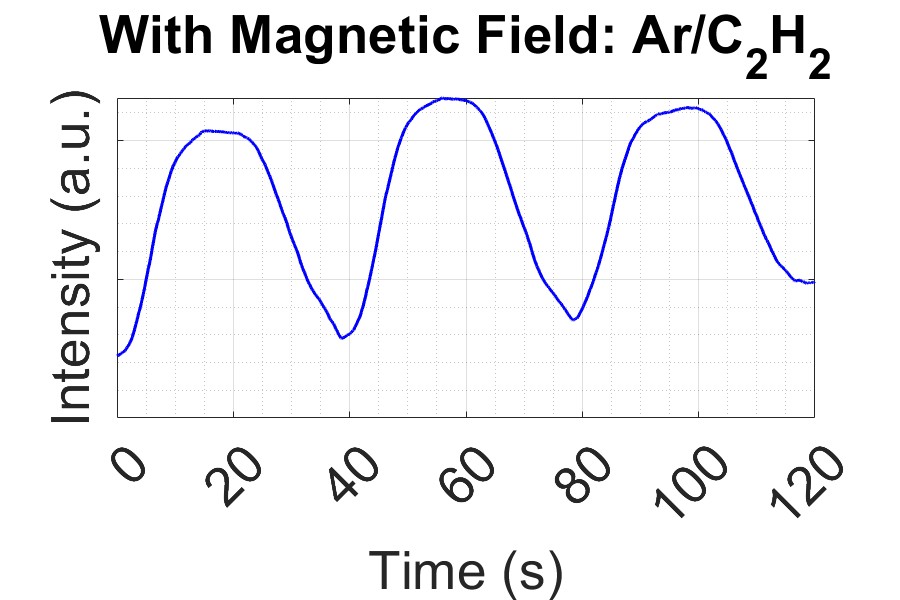
The first characterization technique is OES. In spite of the low resolution of the spectrometer, 0.59 nm, we obtained good, time-resolved spectra as shown in Fig. 6(a) whereby several Ar peaks are identified. However, no new lines were seen during to the presence of the reactive gases. This might either be due to the relatively low resolution of the broadband spectrometer or due to the higher flow rate of Ar when compared to reactive gas in the plasma. In particular, while it is observed that all of the emission lines vary as a function of time during the growth process, an examination of the (NIST) database reveals that the argon neutral (Ar I) line at 763.5 nm is a promising candidate for OES analysis. As seen in the inset in Fig. 6(a) - and confirmed by NIST database - this line, which was the electric dipole transition of Ar I from to was a relatively isolated line [65, 66, 67]. Moreover, this line was chosen because it was the highest intensity line according to the survey scan without any other line blending. The cyclic variation of the line was chosen to monitor the growth process of the dusty plasmas. The timeframe of the OES was set from the integration time and number of data averaged. Data was collected roughly every 600 ms. The time when the plasma was turned on was set to zero. For the Ar/TTIP dusty plasma, without the presence of the magnetic field, the cycle time was 77 4 s, and with the presence of the magnetic field, the cycle time was 32 3 s, as shown in Fig. 6(b) and 6(c) respectively. For the Ar/ dusty plasma, without the presence of the magnetic field, the cycle time was 115 5 s, and with the presence of the magnetic field, the cycle time was 39 1 s, as shown in Fig. 6(d) and 6(e) respectively.
3.2 Laser light scattering
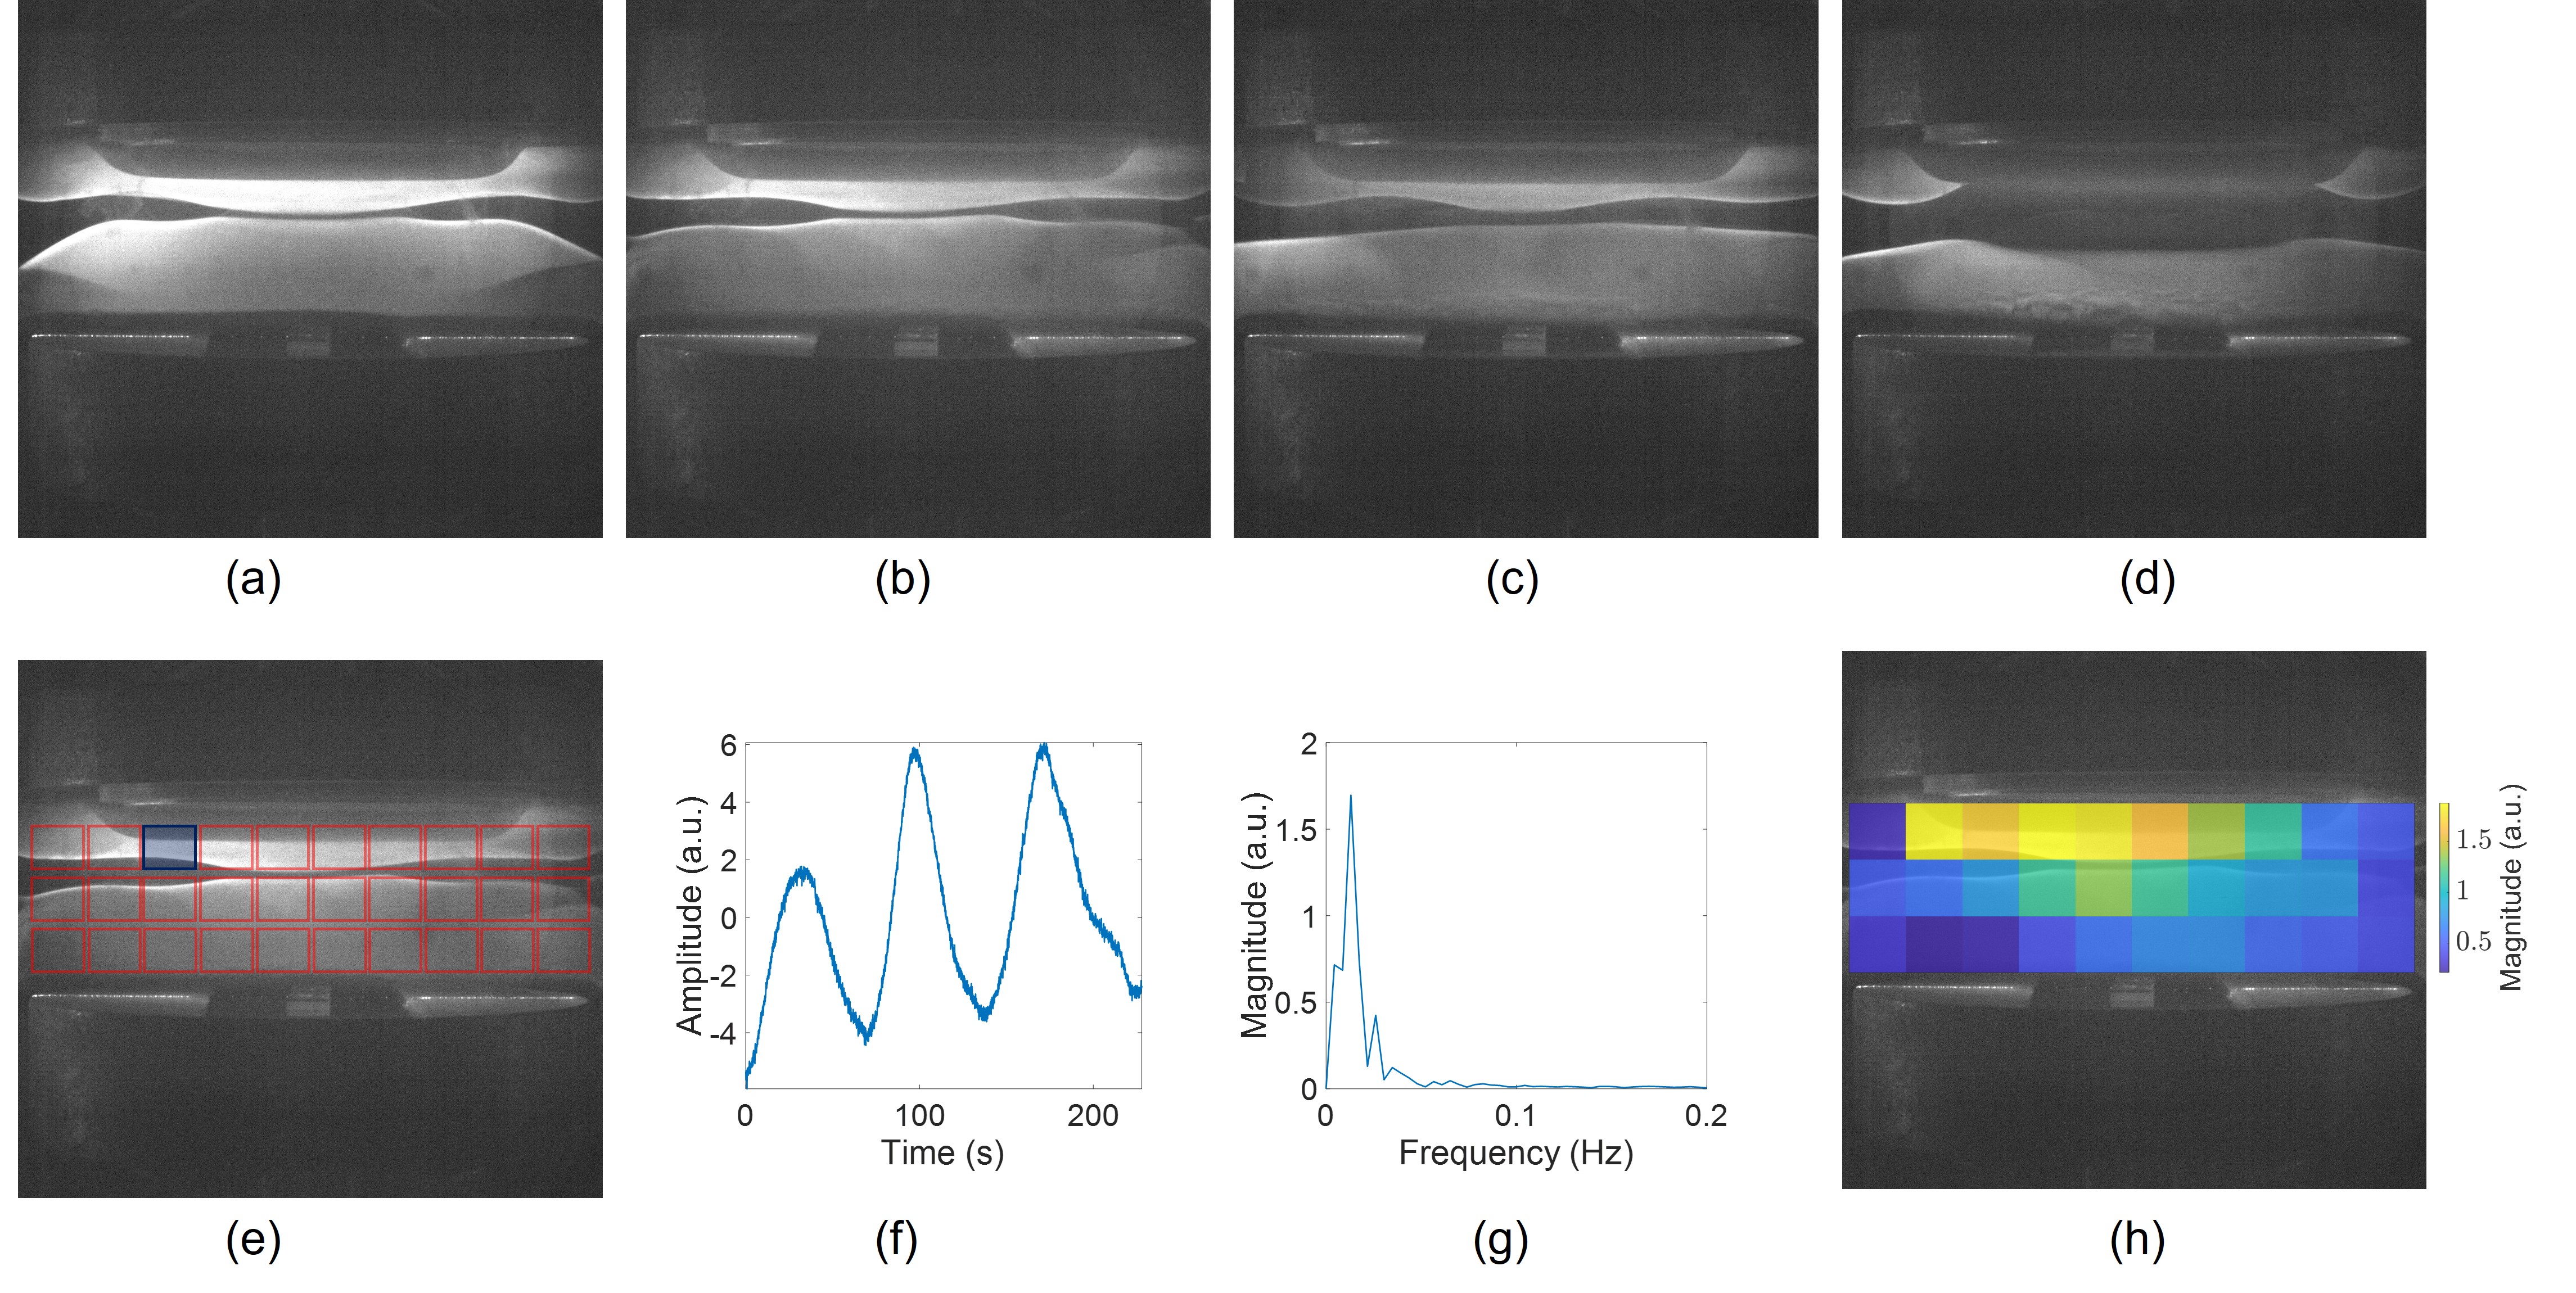
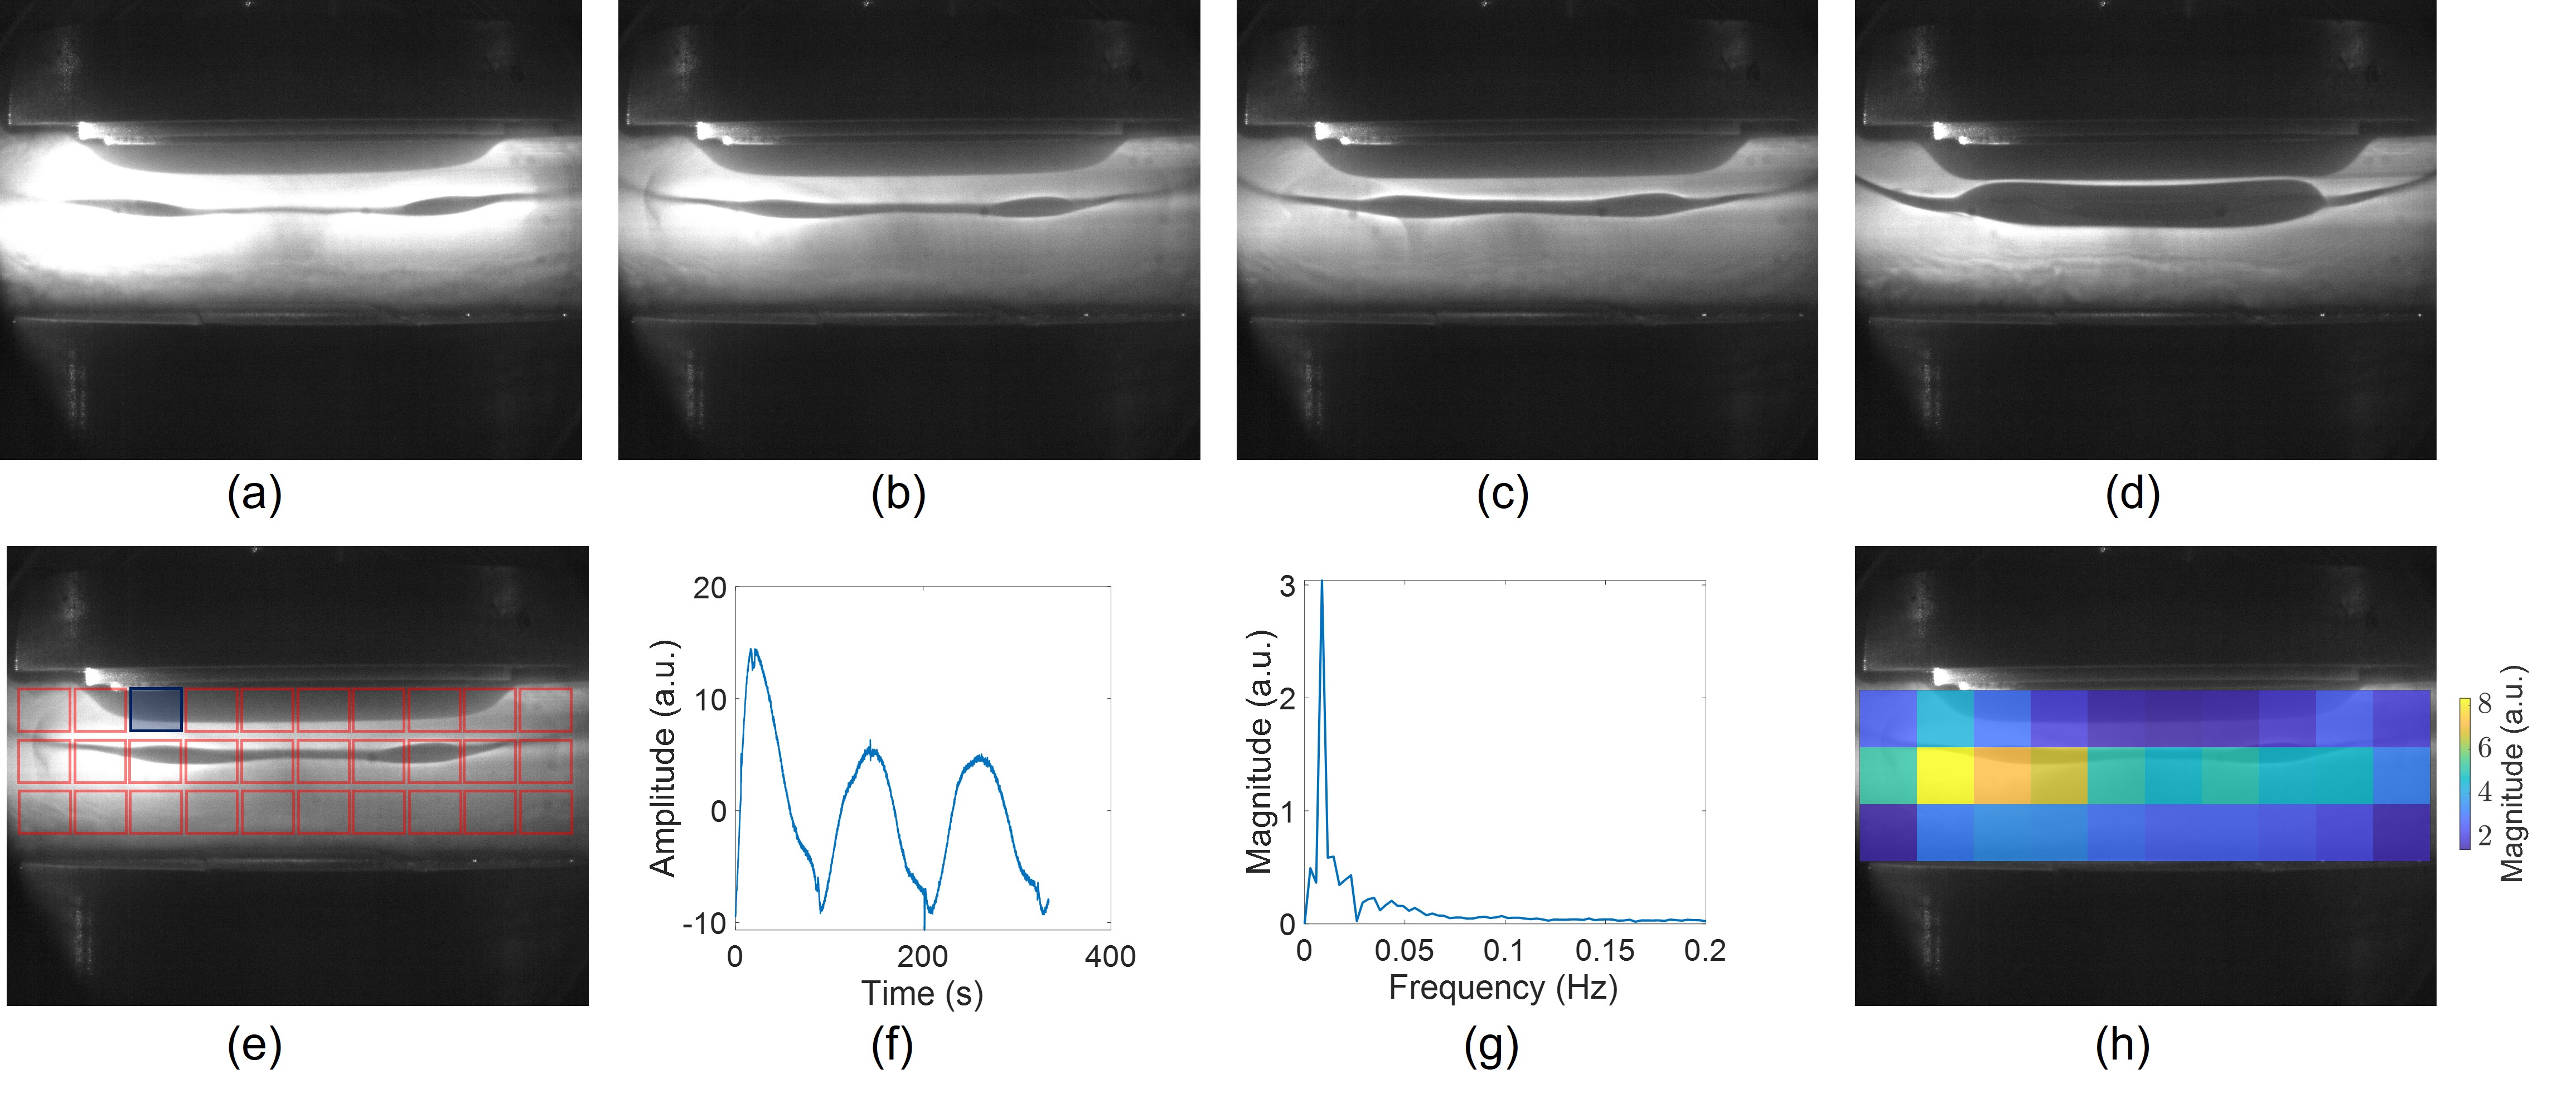
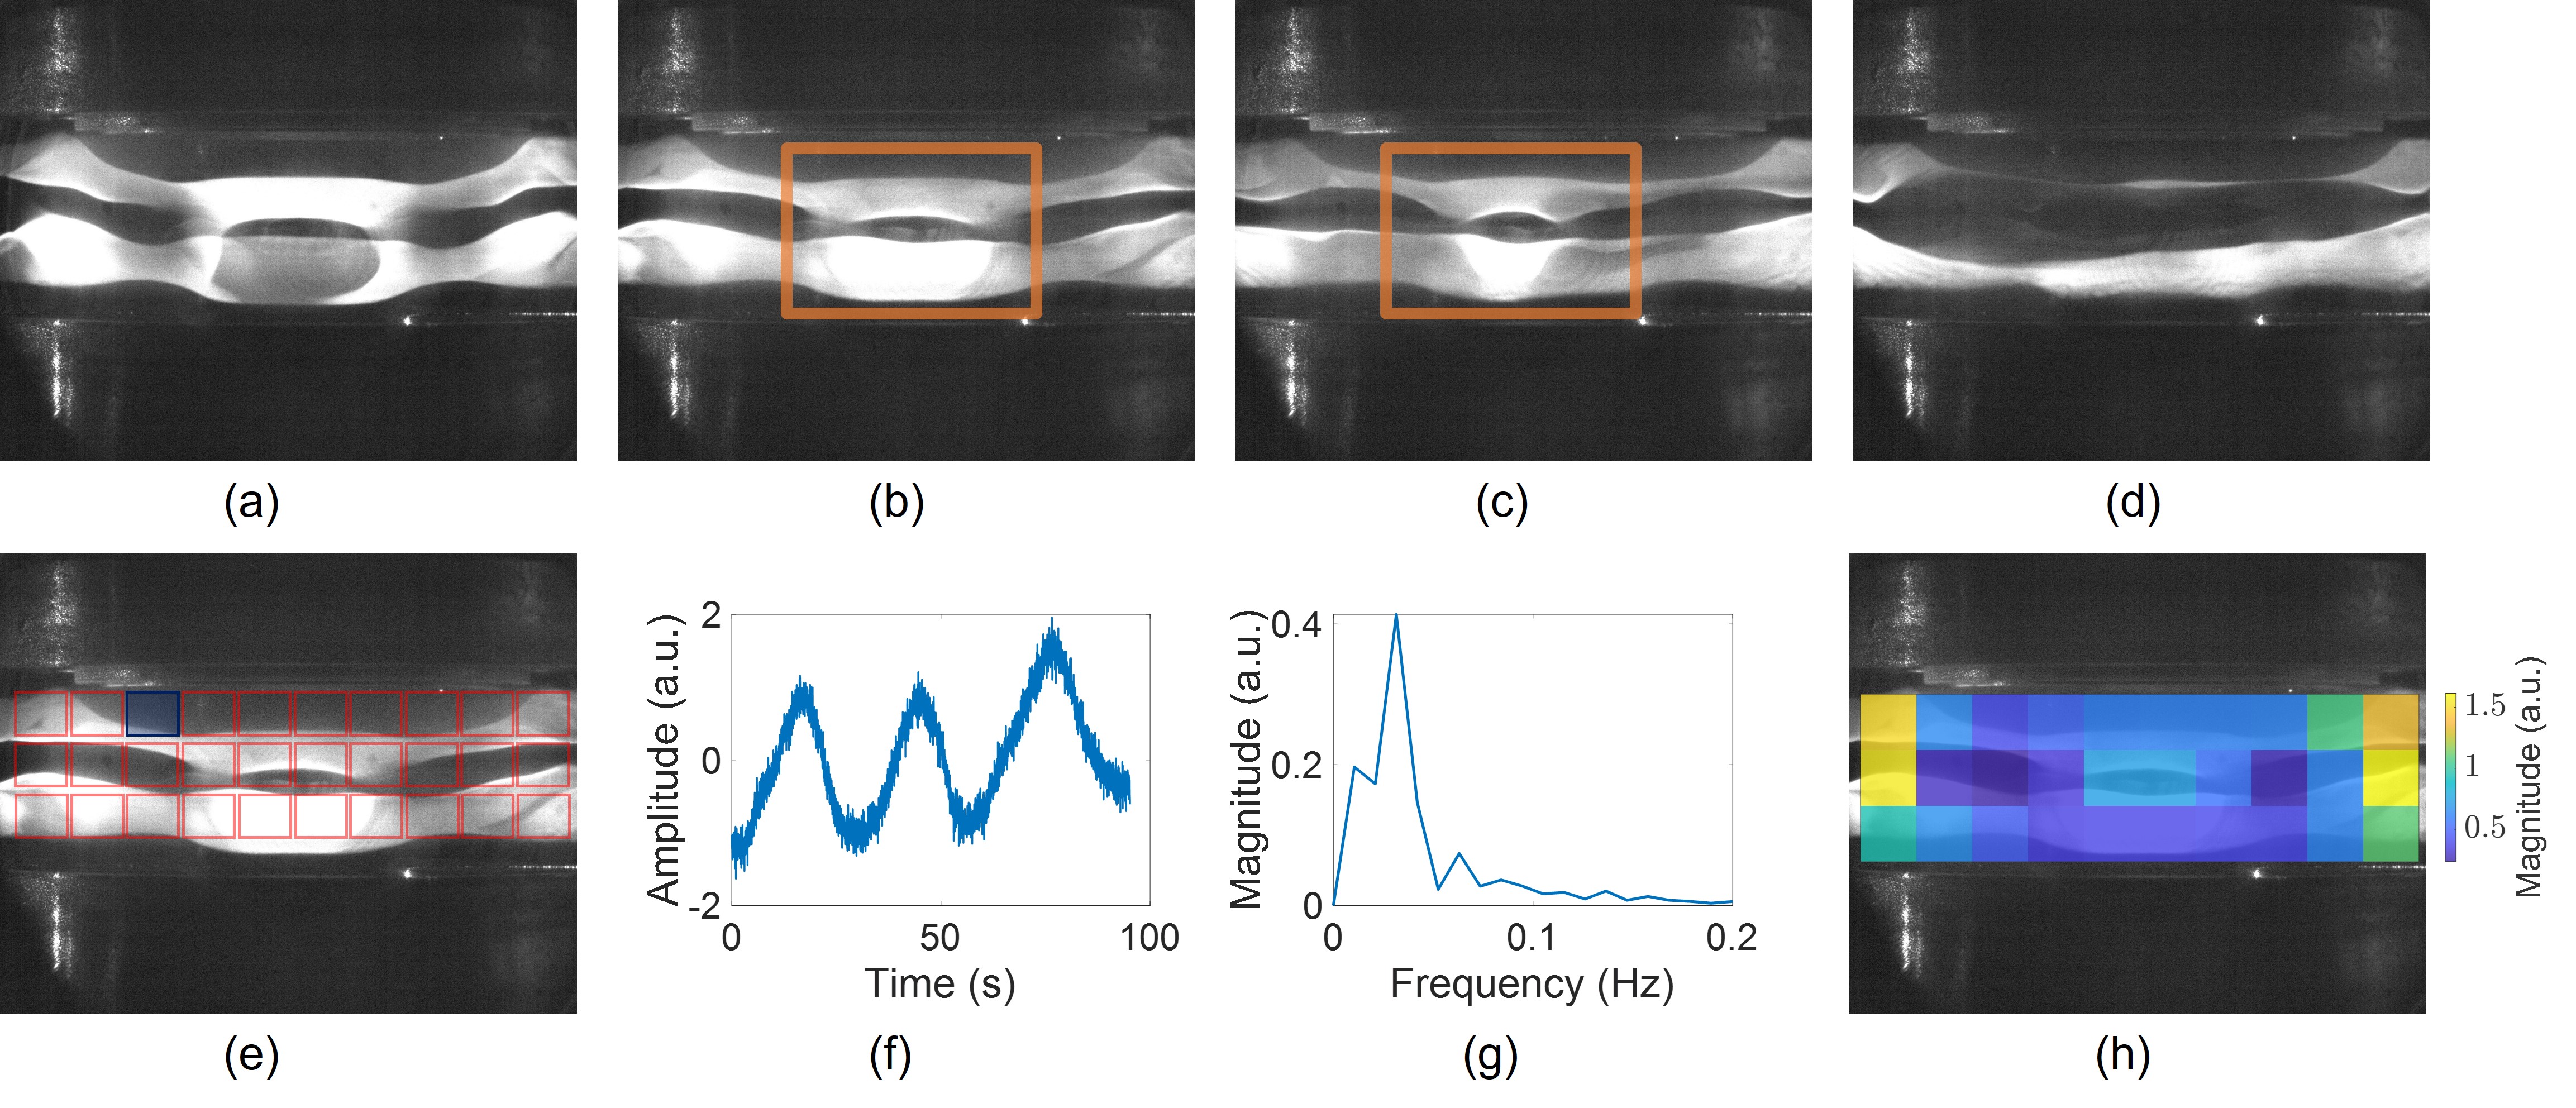
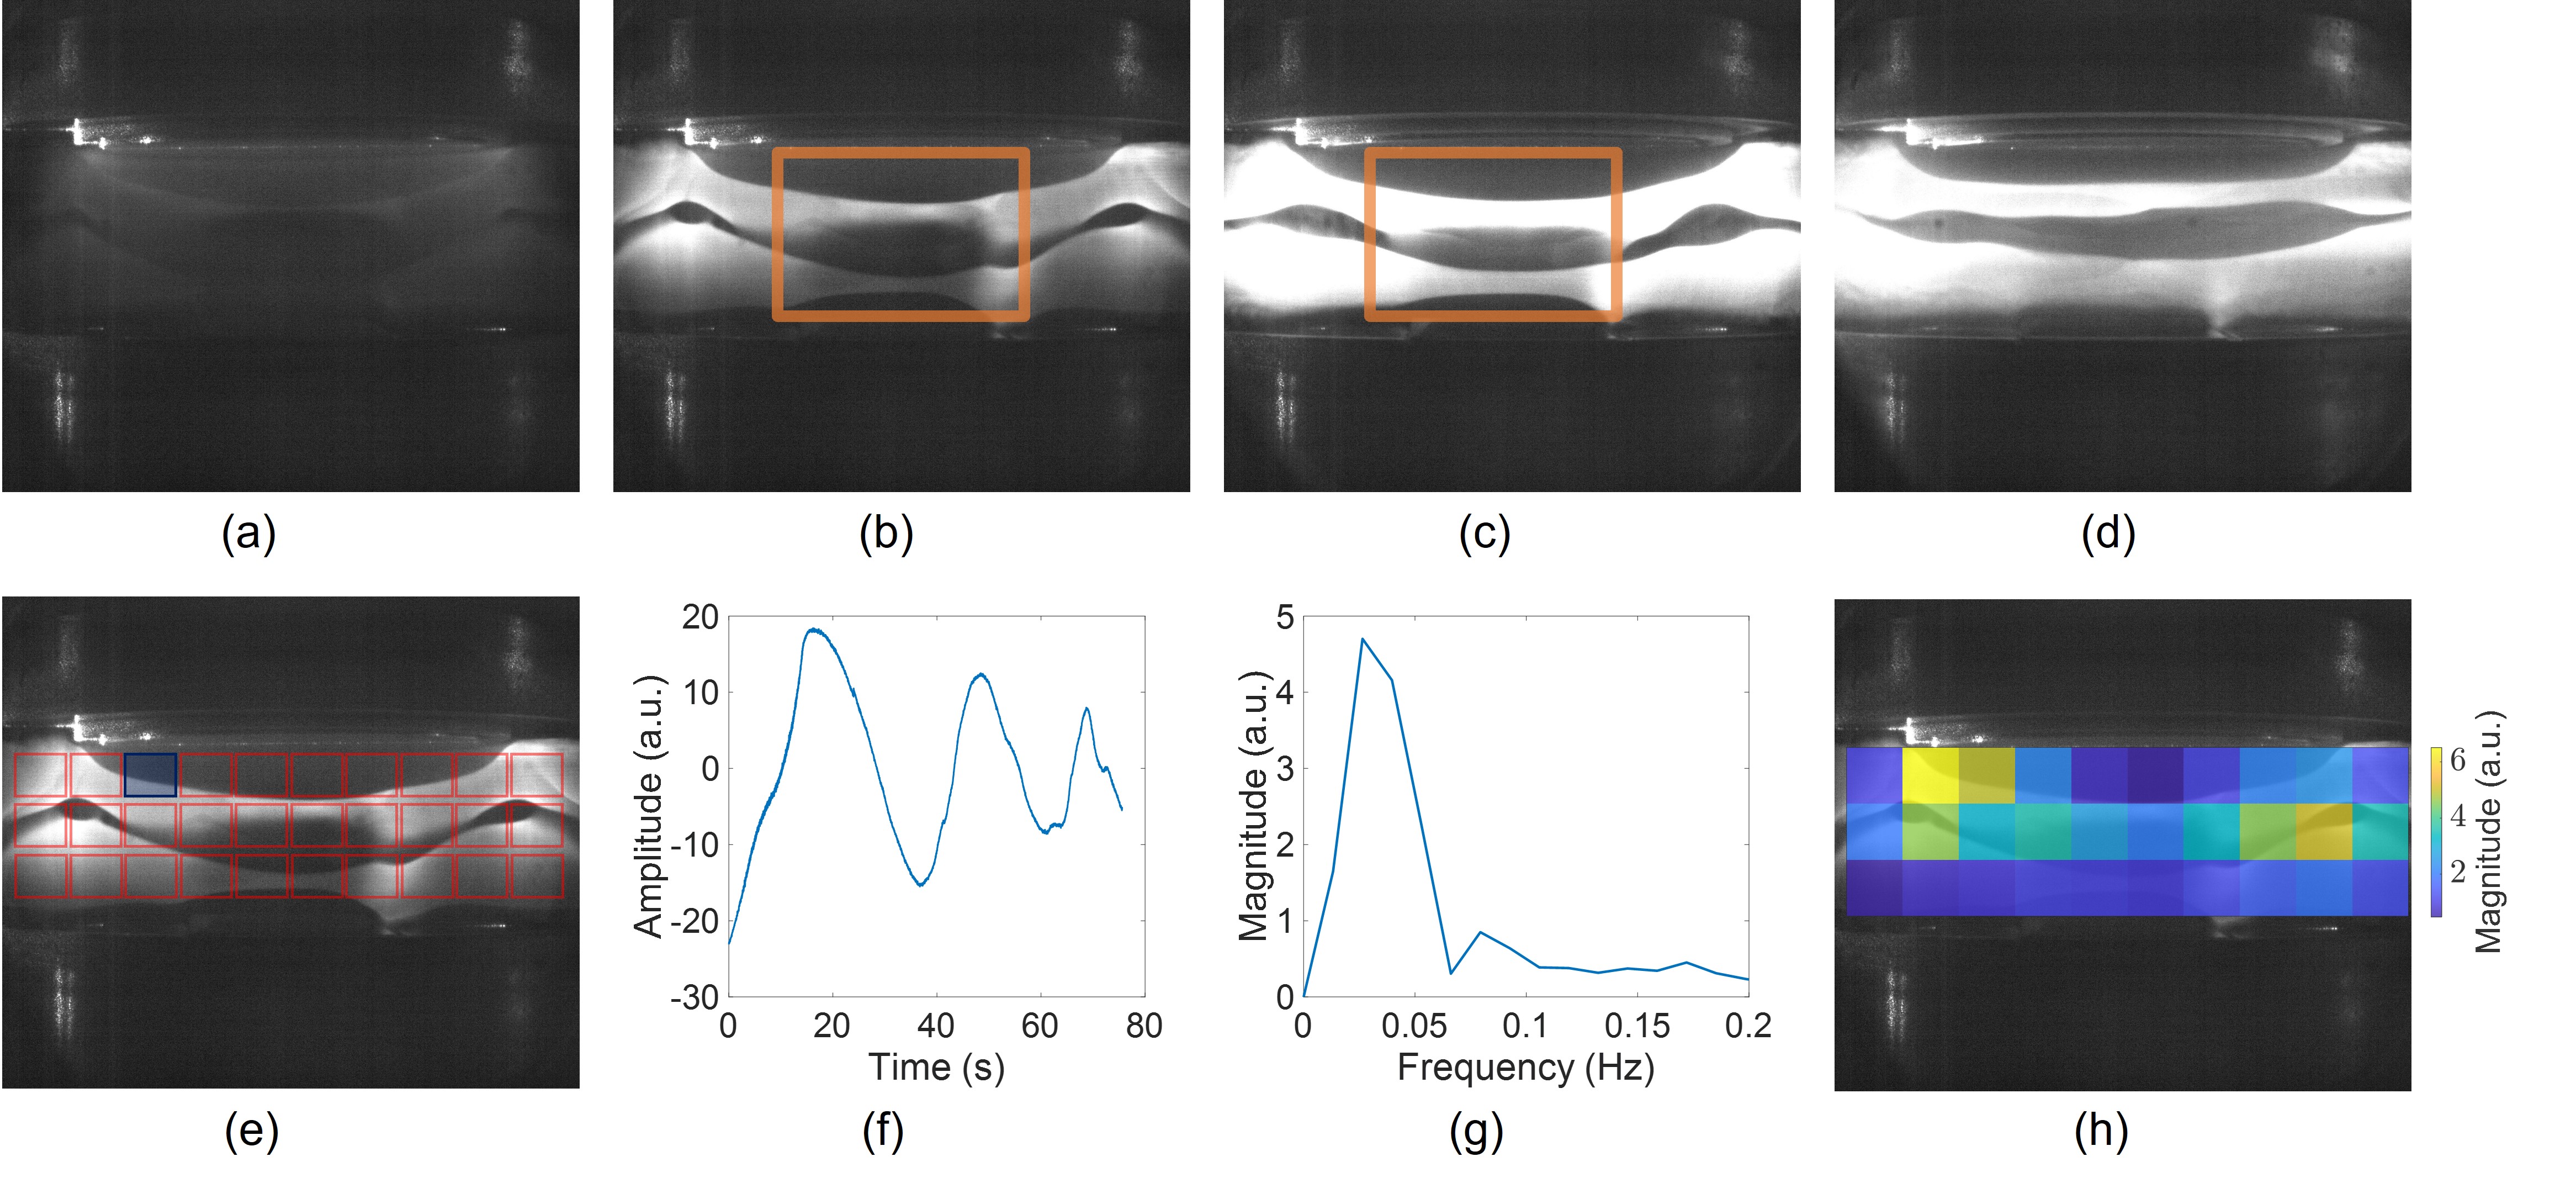
The laser light that was scattered from the dust cloud was recorded using a CMOS camera. The time frame of the CMOS camera was set from the frame rate, whereby a frame was recorded every 20 ms, i.e 50 FPS. The first frame with plasma on was set to t = 0. In order to compare the dust cloud to each other at the same time during their cycles, 4 images are chosen and shown. They show the region the region of the dust cloud between the electrodes at , , , and , where was the cycle time according to the OES. These are shown in Fig. 7 - 10 (a), (b), (c), and (d). Figs. 7 and 8 present the evolution of the Ar/TTIP and Ar/ dust clouds in the absence of a magnetic field, while Figs. 9 and 10 present their evolution with a magnetic field, respectively.
30 boxes, 100 100 pixels each, were drawn on the dust cloud, 10 in 3 different rows. The boxes were drawn in order to cover the entire region of the cloud between the electrodes where light scattering from dust particles is observed. Within each analysis box, the average light intensity was calculated from all of the pixels in that region. A time series, spanning over three growth cycles, was then created by recording the light intensity as a function of time for each box. A numerical Fourier transform (NFT) of the time series was performed for each box to identify the dominant frequencies. The most occuring dominant frequency, i.e. mode frequency, measured from the 30 NFT was chosen to represent and calculate the growth cycles. In Fig. 7 - 10, the 30 boxes are shown in (e), examples of the cyclic variation of the light emission intensity are shown in (f), and examples of the mode frequency are shown in (g). The X-axis of (f) indicates the time calculated from the camera frames. Moreover, (h) shows the magnitude of the mode frequency in the 30 boxes superimposed on the dust cloud at . For the Ar/TTIP dusty plasma, without the presence of the magnetic field, the mode frequency and cycle time were 0.0130 Hz and 77 s respectively, and with the presence of the magnetic field, the mode frequency and cycle time were 0.0315 Hz and 32 s respectively. For the Ar/ dusty plasma, without the presence of the magnetic field, the mode frequency and cycle time were 0.0087 Hz and 115 s respectively, and with the presence of the magnetic field, the mode frequency and cycle time were 0.0264 Hz and 38 s respectively.
3.3 Size Distribution
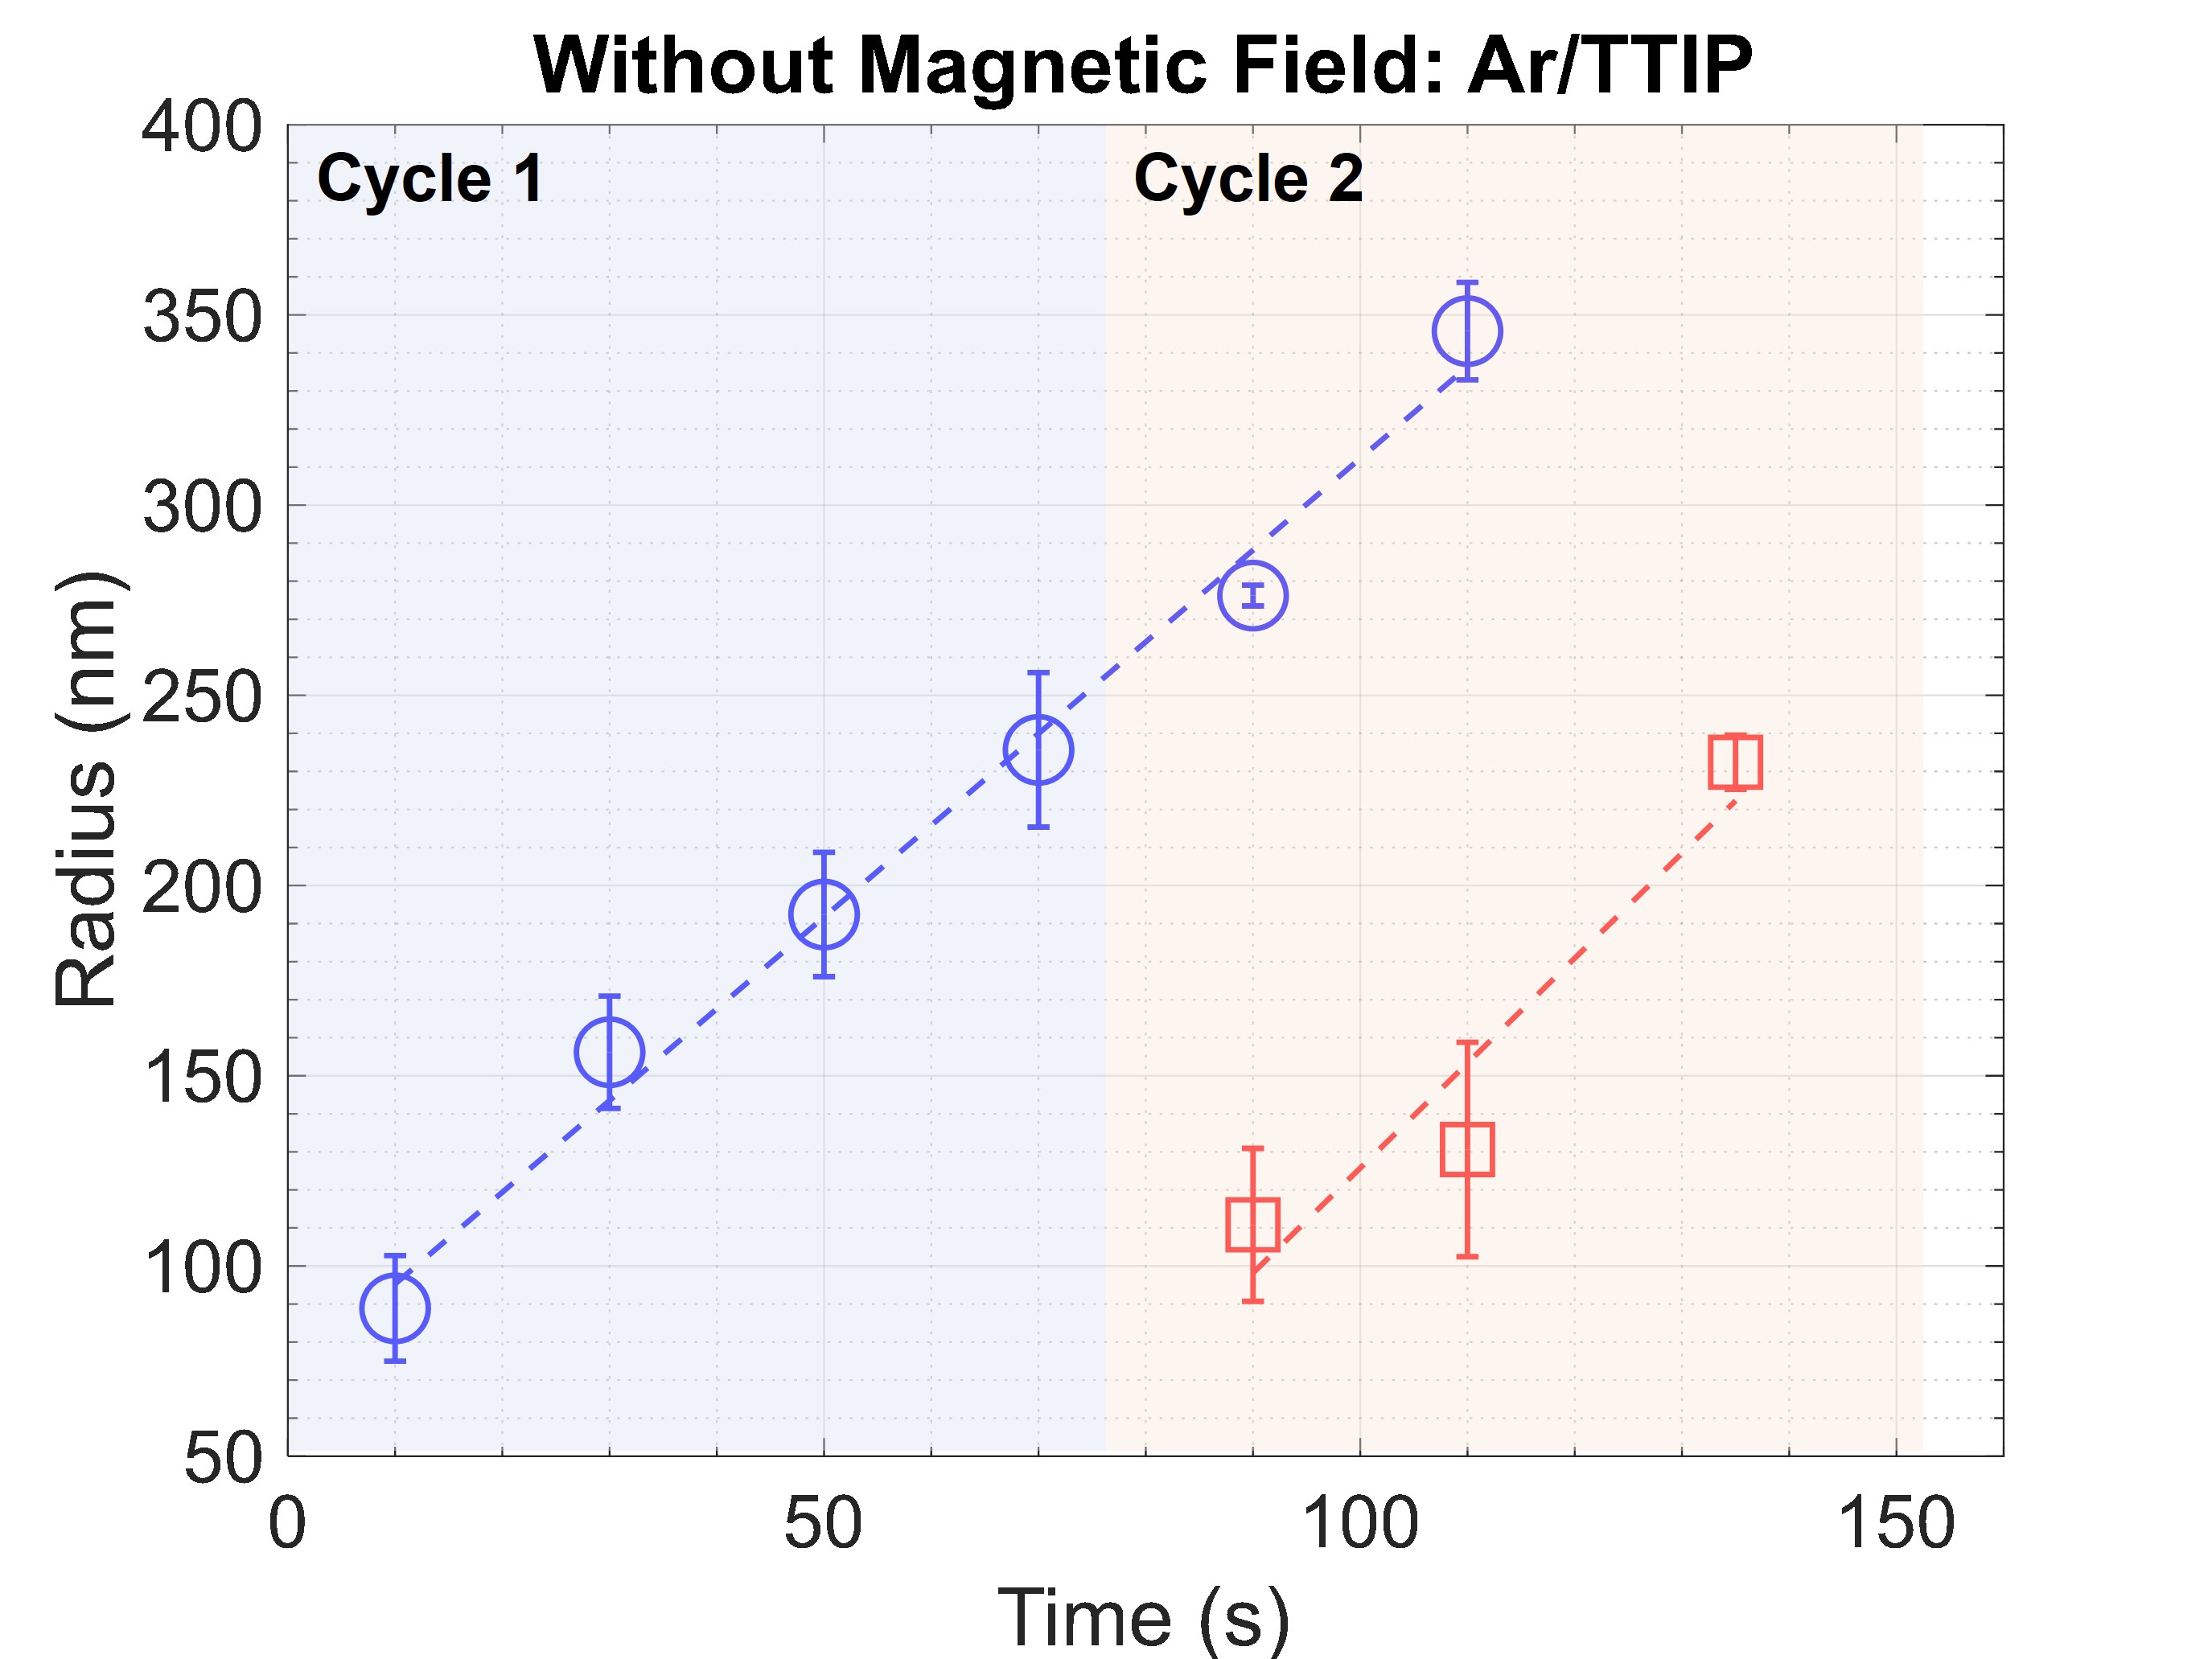
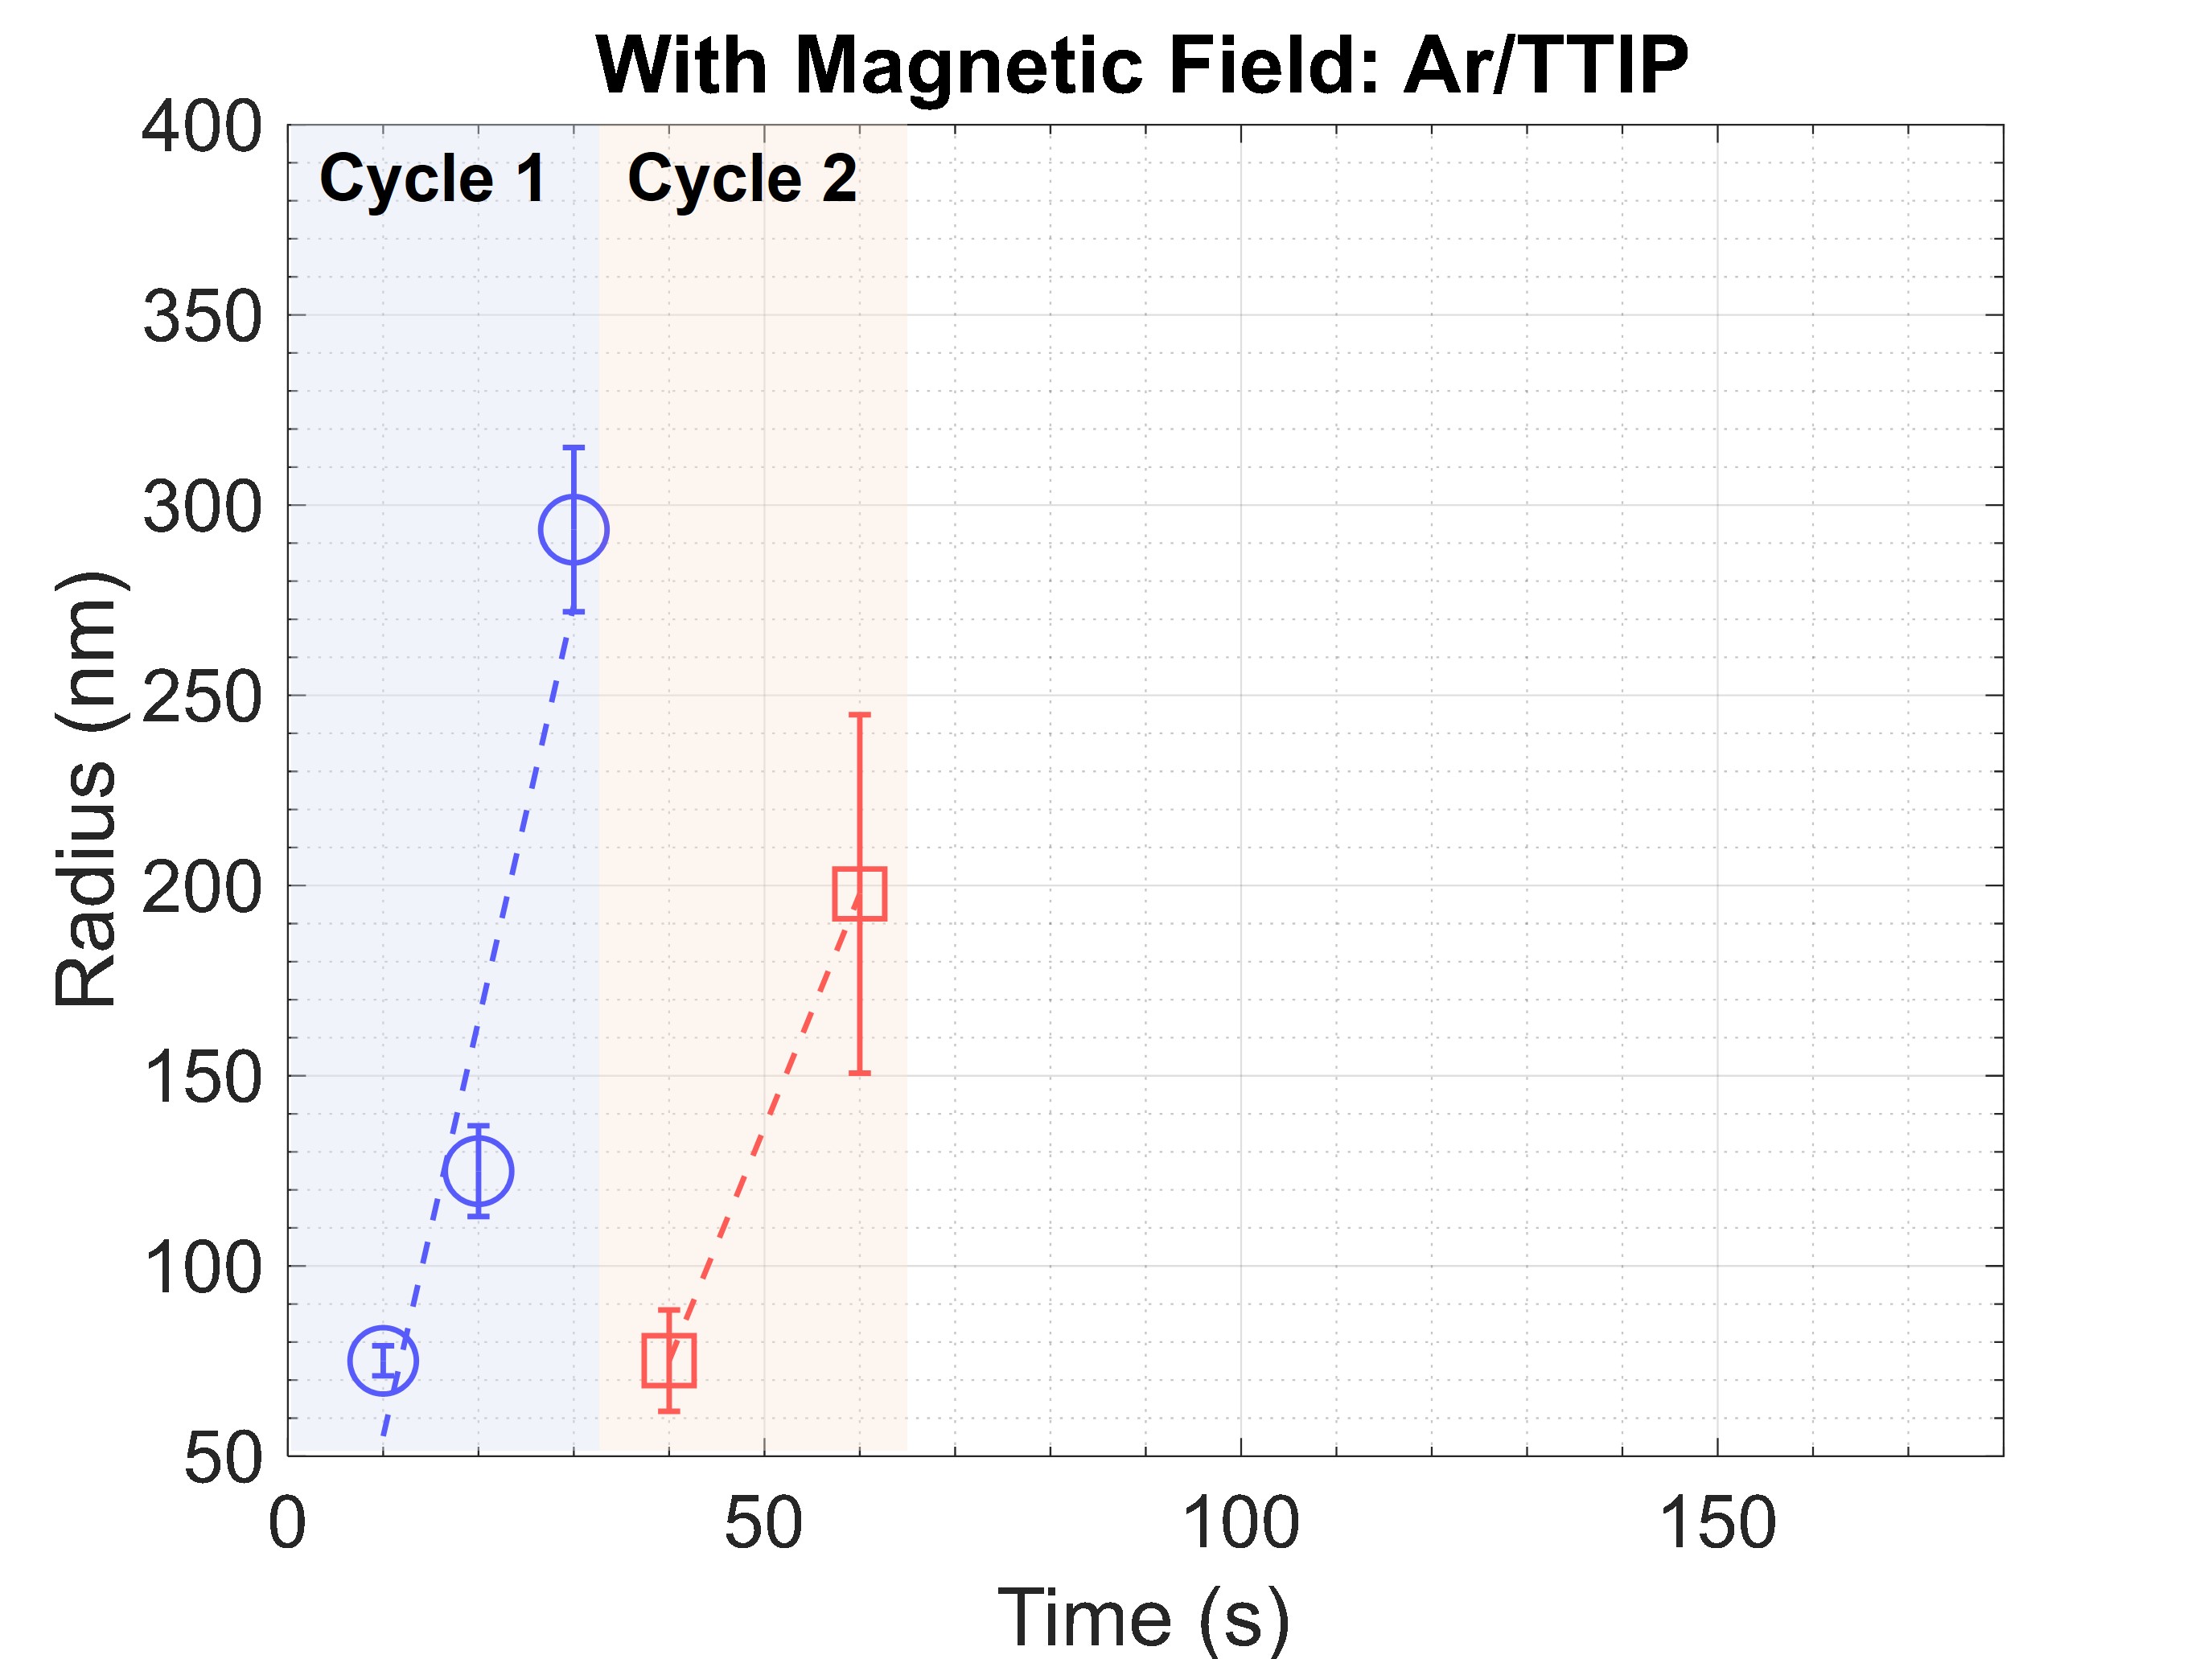
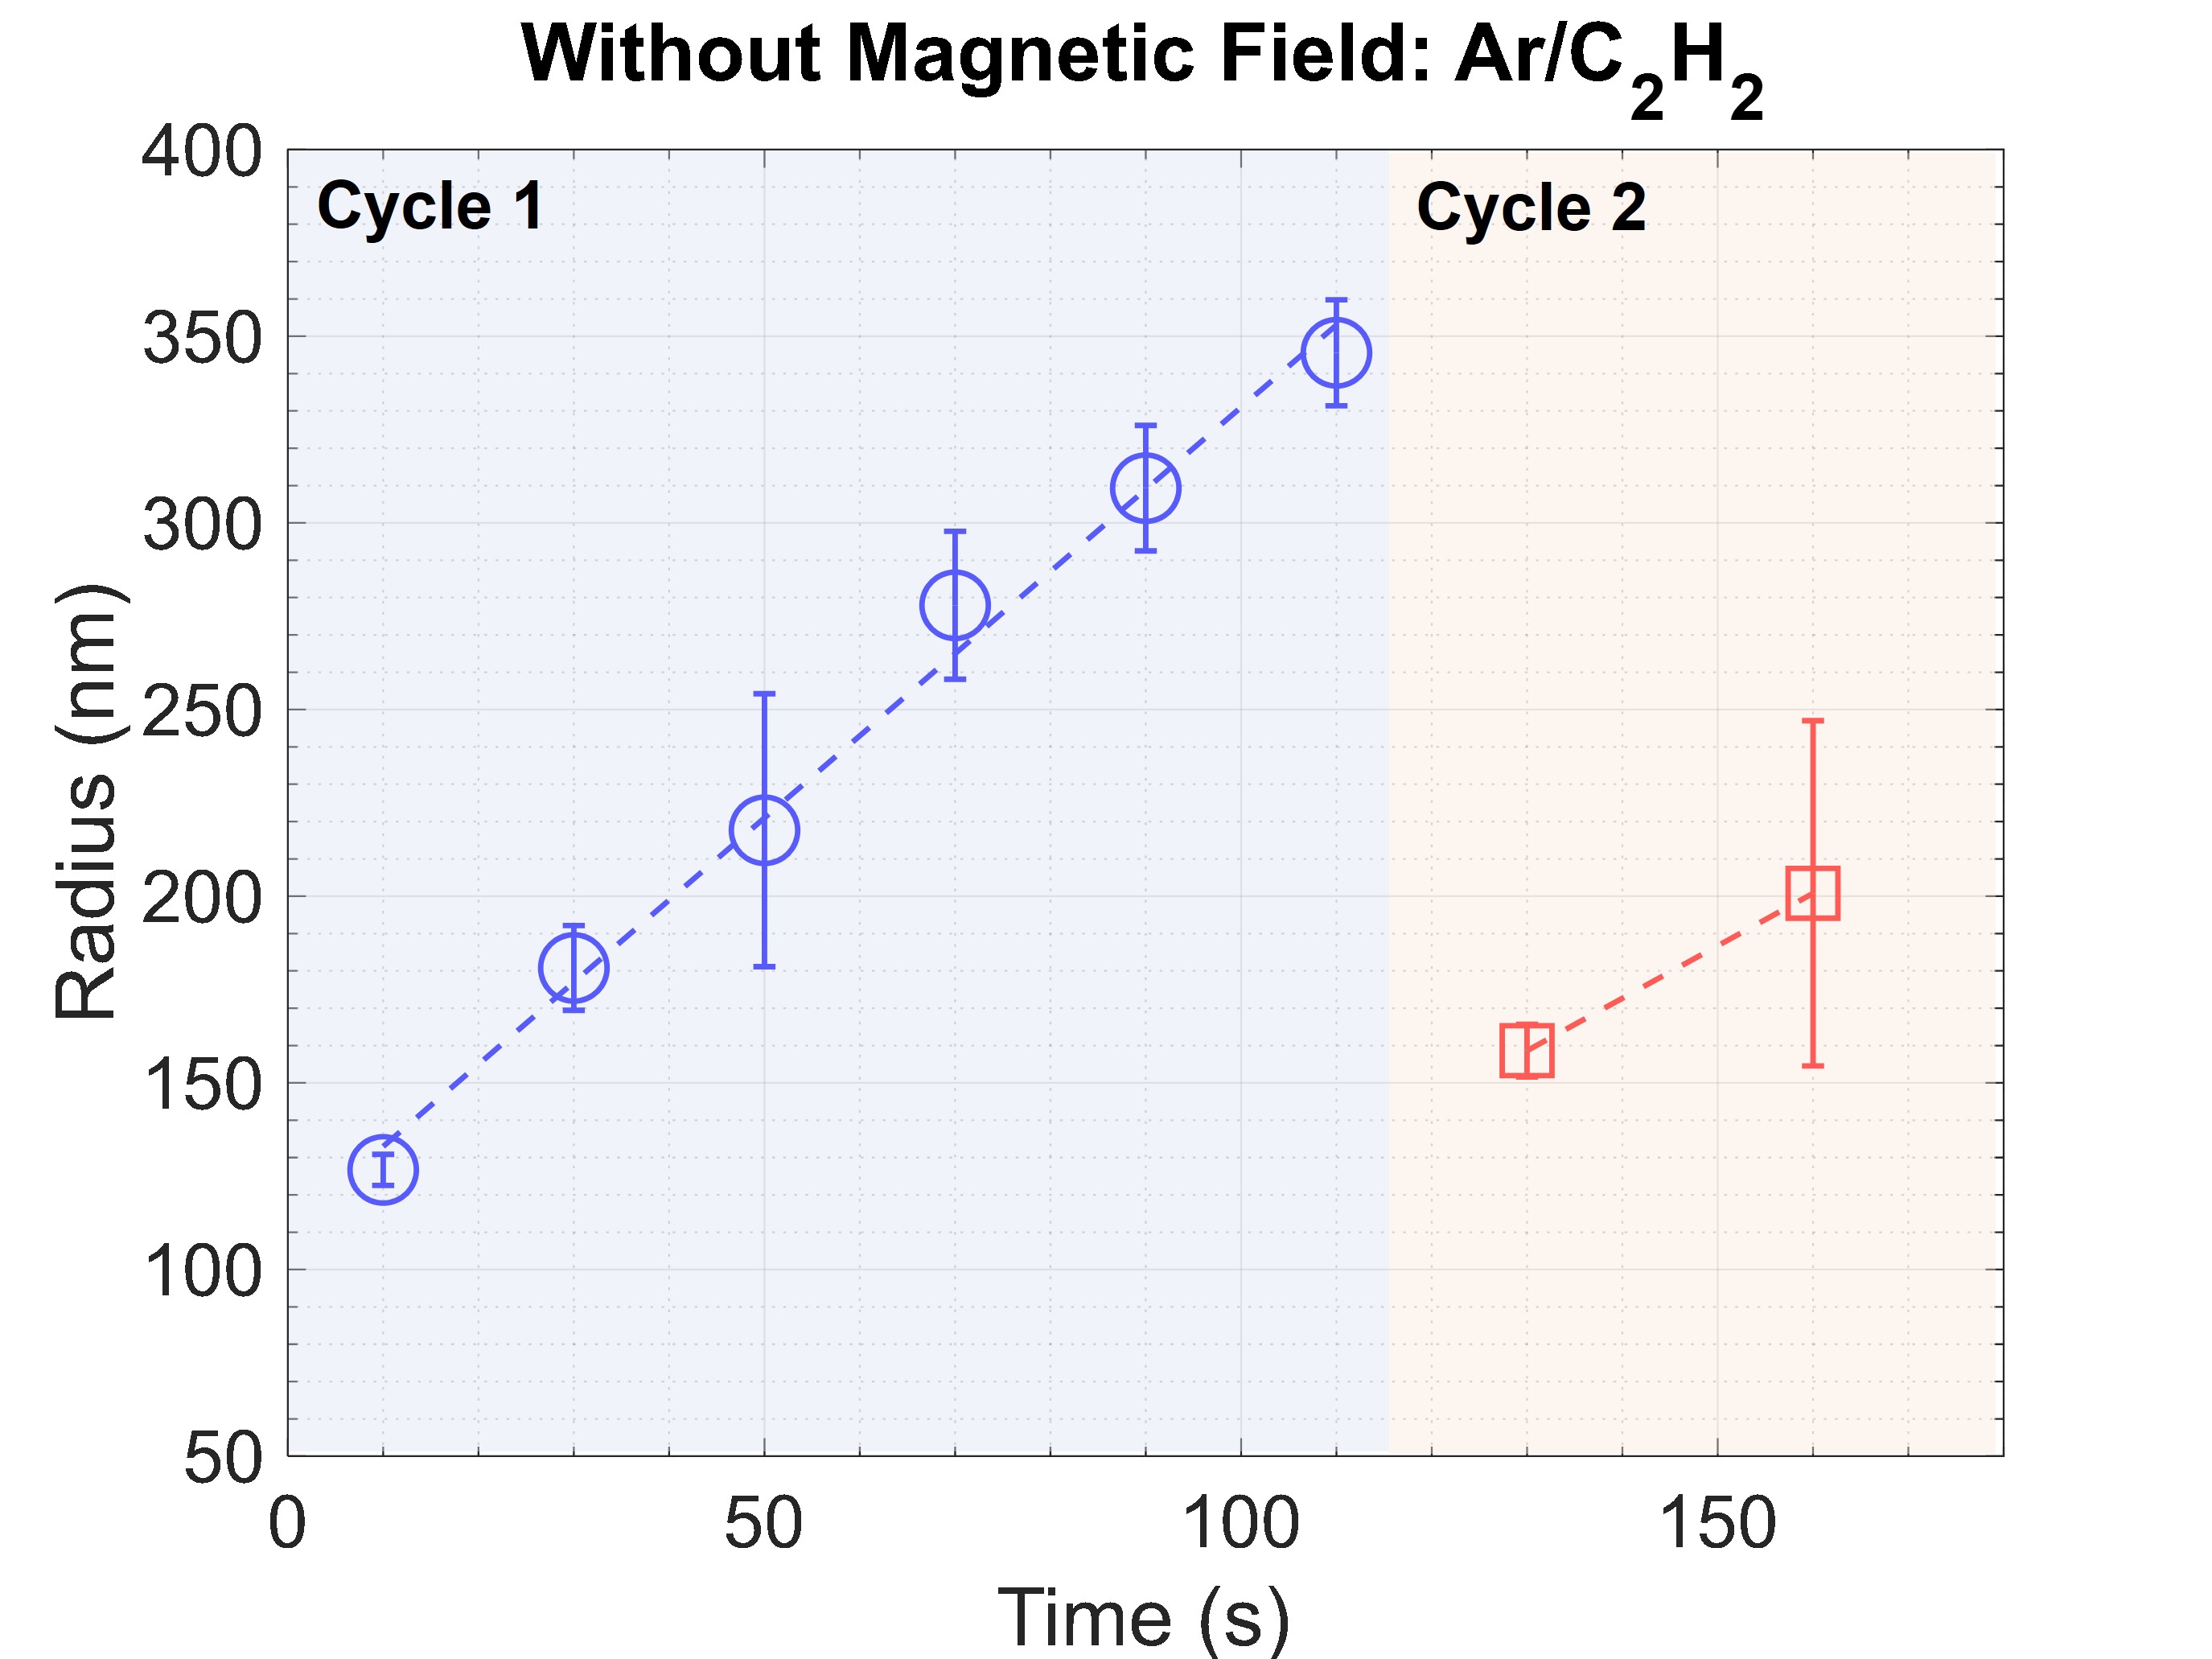
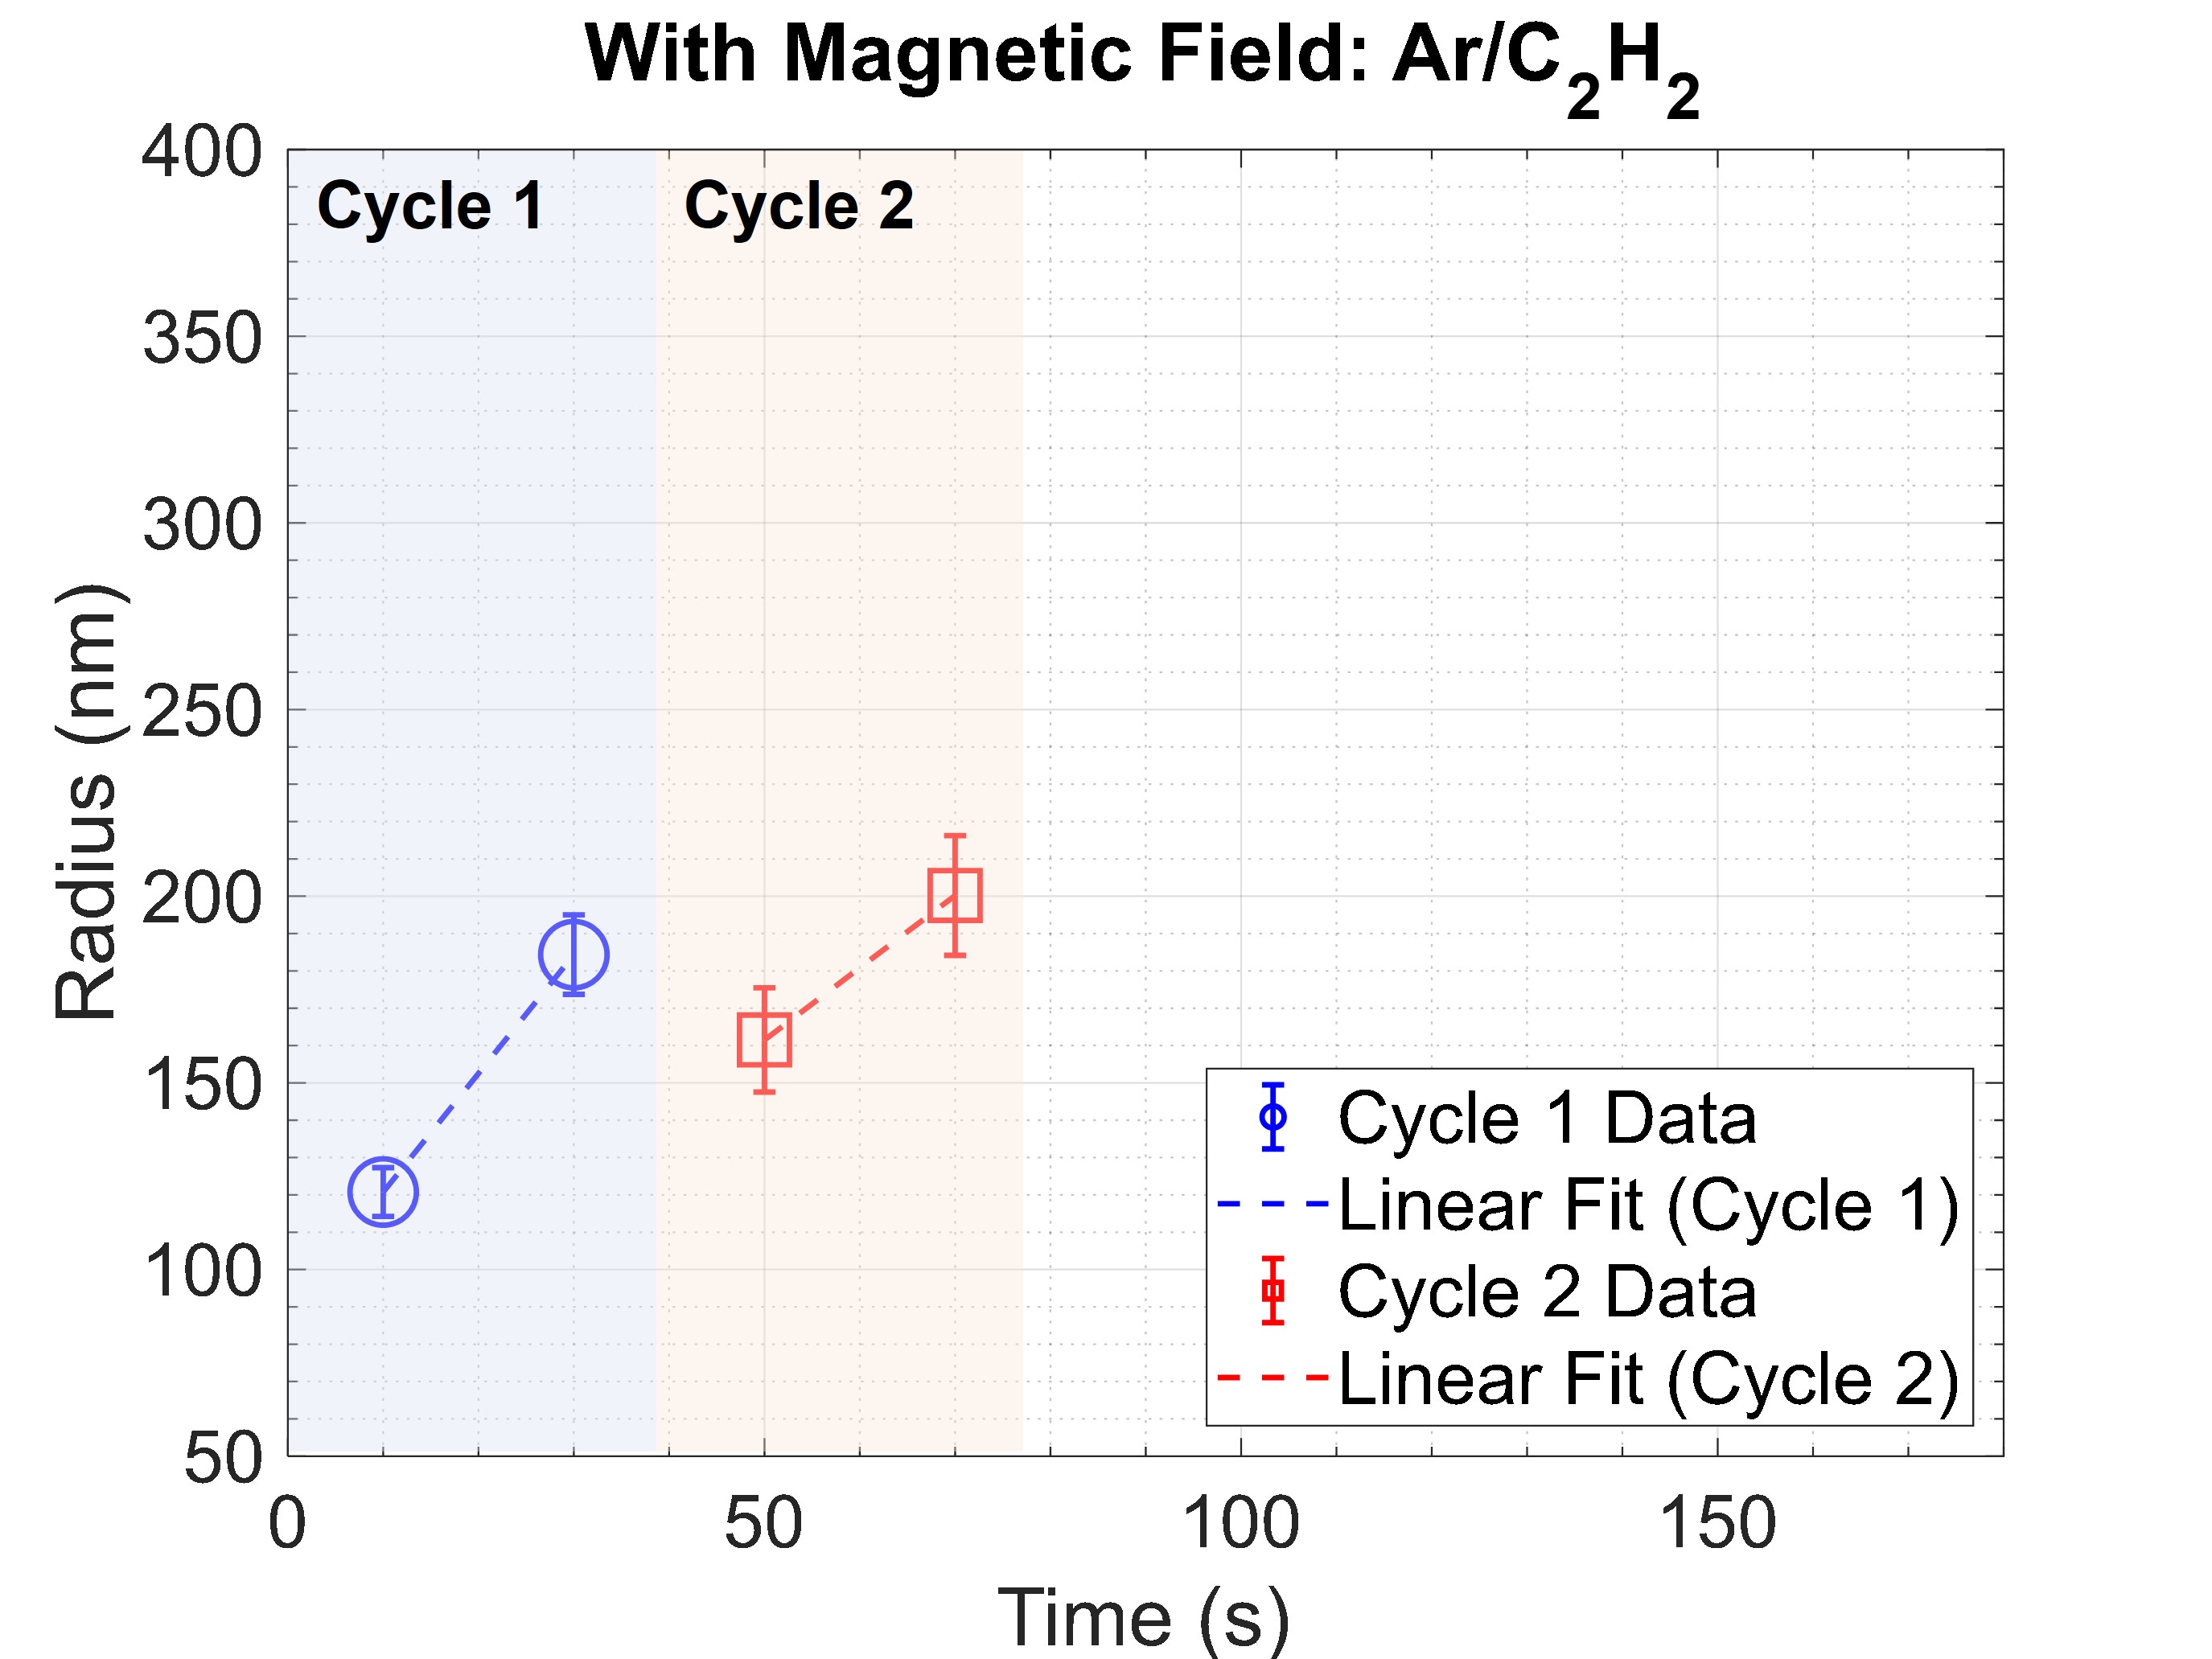
The particles reached their maximum size by the end of each cycle. When a new cycle started, new particles initiated their growth. This growth exhibited a consistent linear progression in size throughout two cycle, as depicted in Figure 11. The time frame for the size distribution analysis was determined by referring to the frames from CMOS camera images. Each particle growth experiment was meticulously recorded and timed according to the number of frames, spanning from the activation of plasma to its deactivation. Even though the titania growth cycle without the presence of the magnetic field ended after approximately 77 s, some dust from the previous cycle still remained in the plasma until about 110 s. The presence of the two cycles are shown in Fig. 2(c). However, this situation with the presence of two growth cycles is only observed in the Ar/TTIP dusty plasma without magnetic field. The maximum radius of the particles after 77 s were 235 20 nm, however, the particles’ radii up grew to 355 12 nm at 110 s, as shown in Fig. 11(a). The carbonaceous particles reached their maximum radius of 346 14 after 110 s, shortly after which the new cycle started, as shown in Fig. 11(c). The maximum radii of titania and carbonaceous dust particles grown during the presence of magnetic field were 294 22 nm and 200 16 nm, respectively, as shown in Figs. 11(b) and 11(d).
4 Discussion
In prior investigations of dusty plasma particle growth, it was determined that a magnetic field of 1 Tesla reduced the length of time of the growth cycle [58]. Our findings are consistent with these earlier observations, even with a lower magnetic field, for both types of dust particles, as summarized in Table 1. Literature has shown that a weak magnetic field as low as 50 Gauss can affect the plasma potential, and hence the electric field in capacitively coupled Ar plasmas [68]. The smaller radii of nanoparticles grown during the presence of magnetic field suggest that there might be a reduction in the electric field. This is consistent with preliminary measurement of our electric field, however a full description the effect of magnetic field on the electric field is requires a separate study. Since the force balance levitating the dust cloud prior to the end of the cycle depends primarily on electric and gravitational forces, the reduced electric field allows the particles to move out of the plasma quicker, and hence leading to the faster growth cycle.
| Dust | Without magnetic field | With magnetic field | ||||
| Max Radius (nm) | Cycle Time (s) | Max Radius (nm) | Cycle Time (s) | |||
| OES | NFT | OES | NFT | |||
| Titania | 355 12 | 77 4 | 77 | 294 22 | 32 3 | 32 |
| Carbonaceous | 346 14 | 115 5 | 115 | 200 16 | 39 1 | 38 |
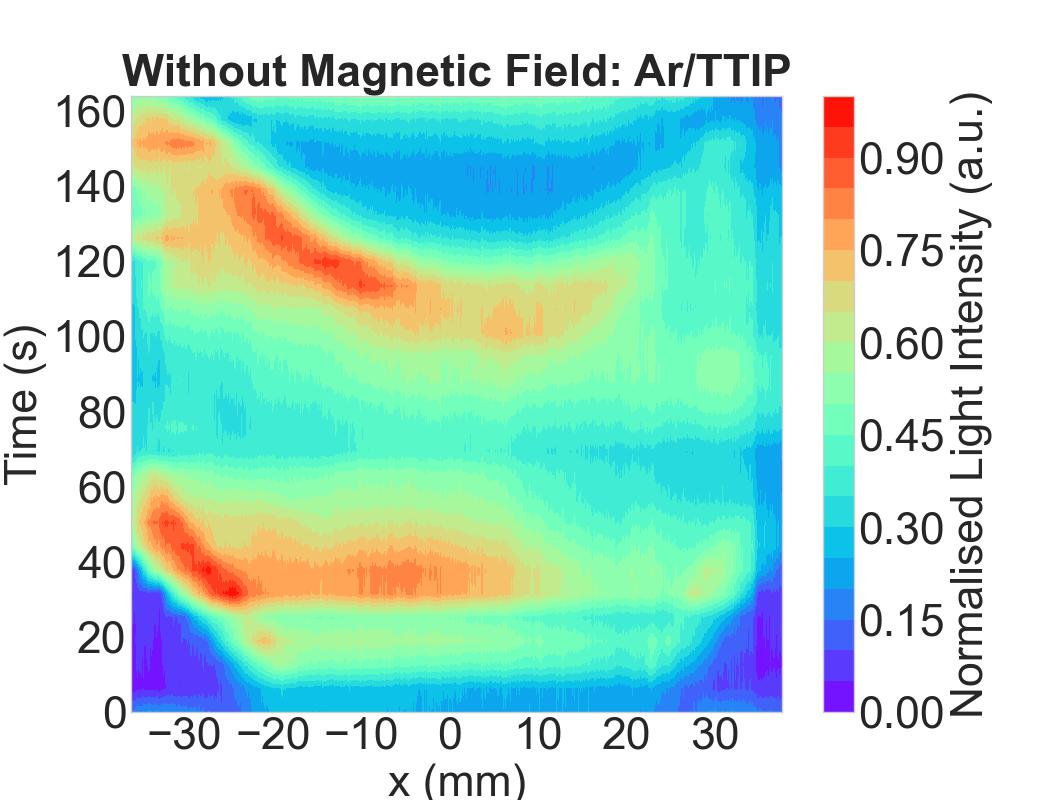
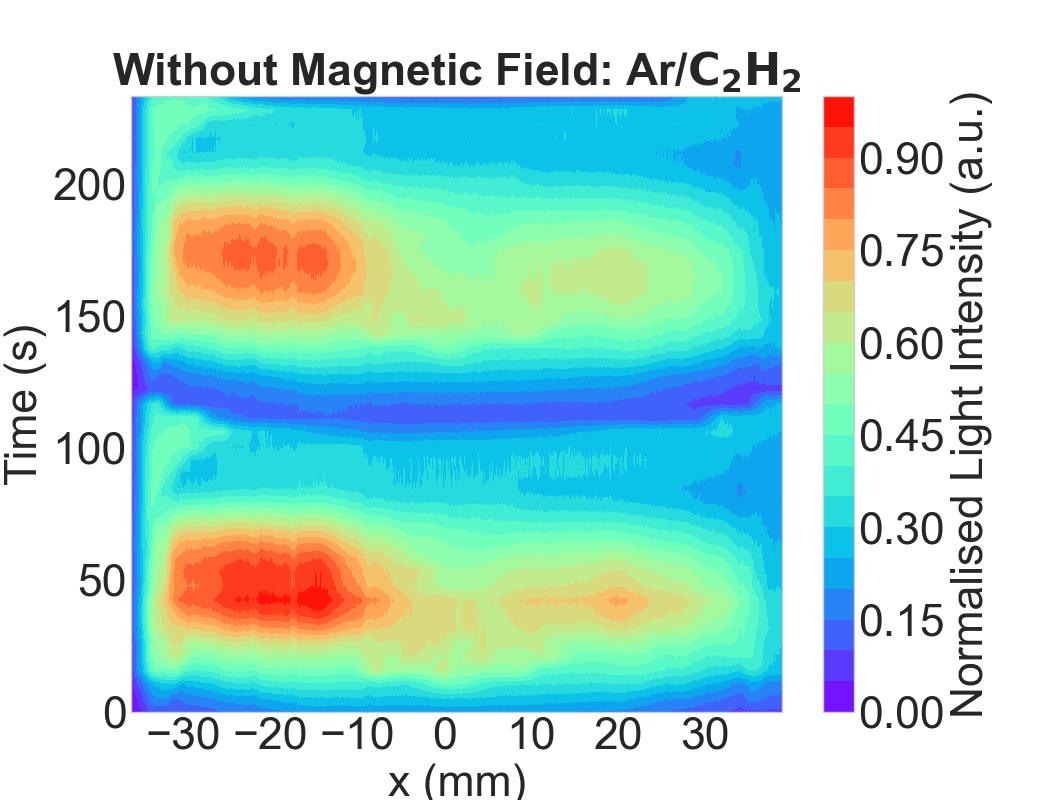
In addition to the faster growth cycles when the magnetic field is present, there is also a noticeable impact within the spatial distribution of the dust cloud in both dusty plasma during the presence of the magnetic field. Specifically, the presence of the magnetic field resulted in a larger void, for the growth of carbonaceous particles as compared to the growth of the titania particles. Boxes are drawn in the central region of the plasma to show the void in Fig. 9 (b) and (c) for titania, and 10 (b) and (c) for carbon. To visualize this effect better, a line profile of the emitted light intensity versus x (mm) was examined in the four dusty plasmas over two growth cycles. The analysis covered the electrode’s diameter, specifically within the range of x (mm) , positioned at the midplane between the two electrodes at z = 12.5 mm, as shown in Fig. 3(c). The variation in intensity along the line, 50 pixels thick, represents the variation in spatial dust cloud distribution. The intensity obtained were stacked vertically to show the temporal evolution of the dust cloud. Fig. 12(a) and 12(b) illustrate this for Ar/TTIP and Ar/ dusty plasmas without a magnetic field, while Fig. 12(d) and 12(d) show the same for Ar/TTIP and Ar/ dusty plasmas with a magnetic field, respectively. The intensity for each dusty was normalized to its highest number to enable a more direct comparison to be made between the particle growth of the two dust particle types. The temporal intensity profile appears to be similar for both kinds of dusty plasma without magnetic field and dissimilar during the presence of the magnetic field.
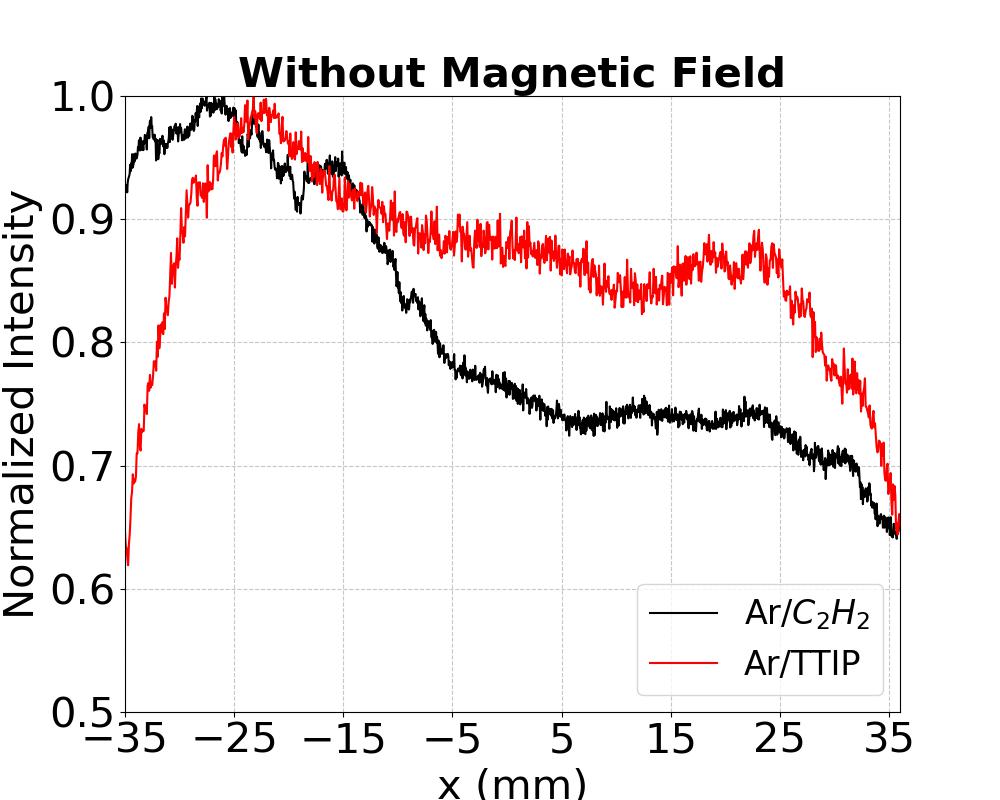
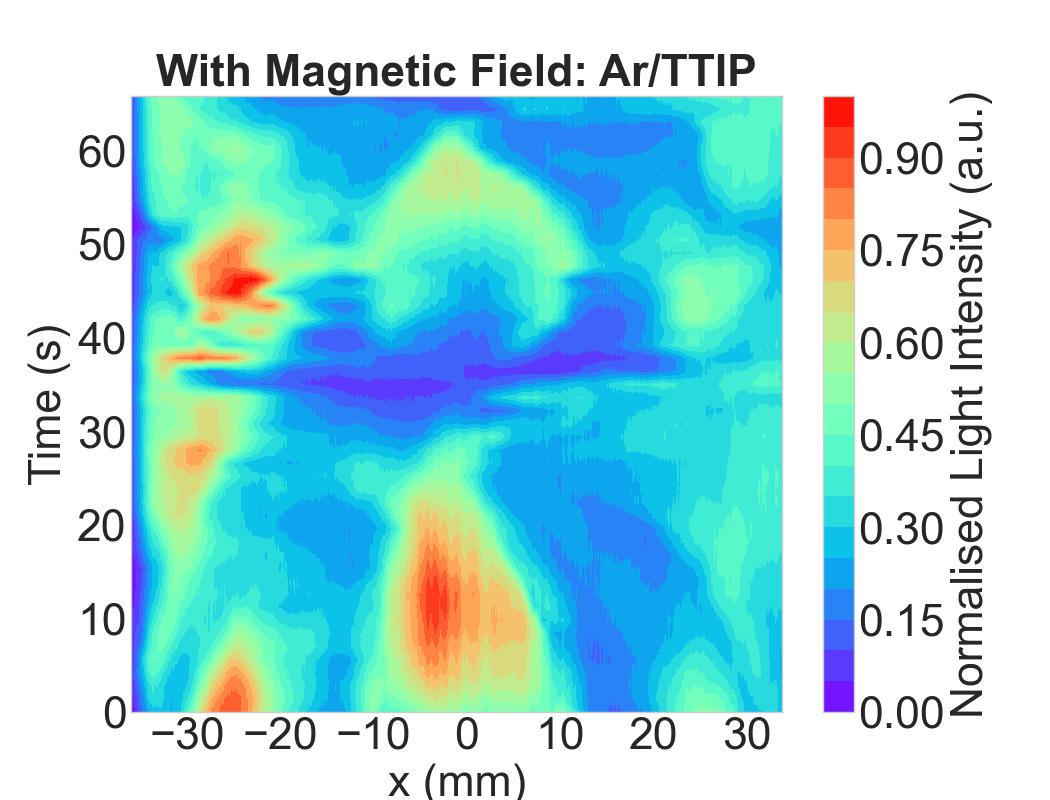
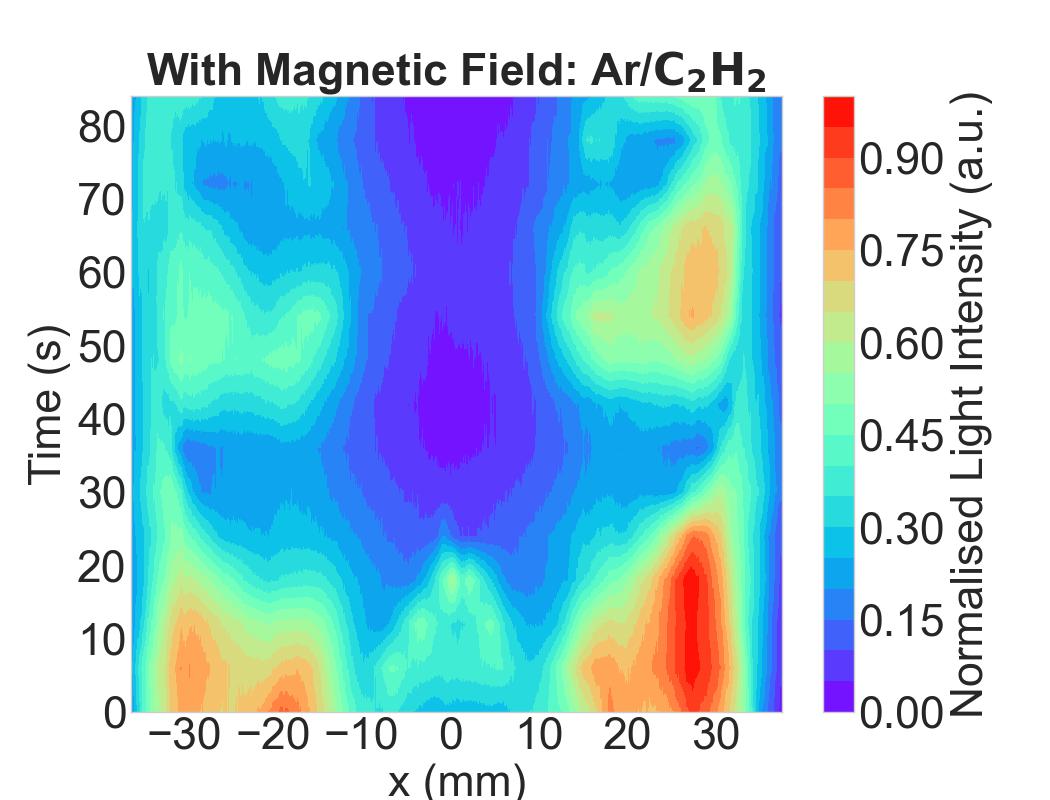
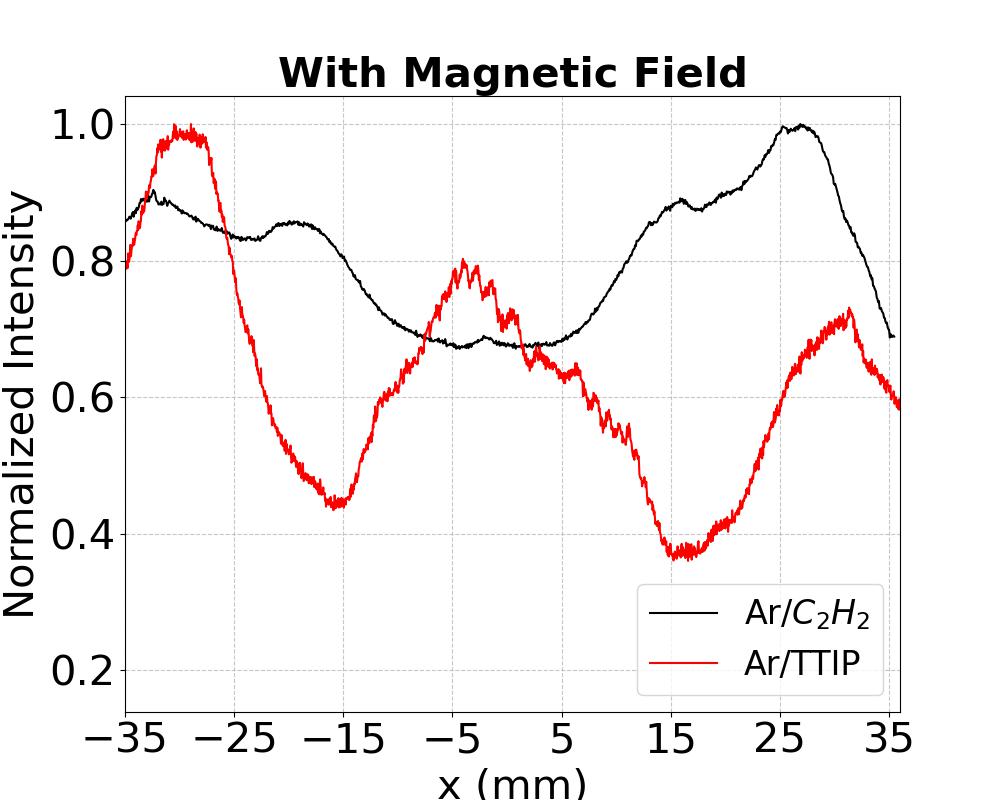
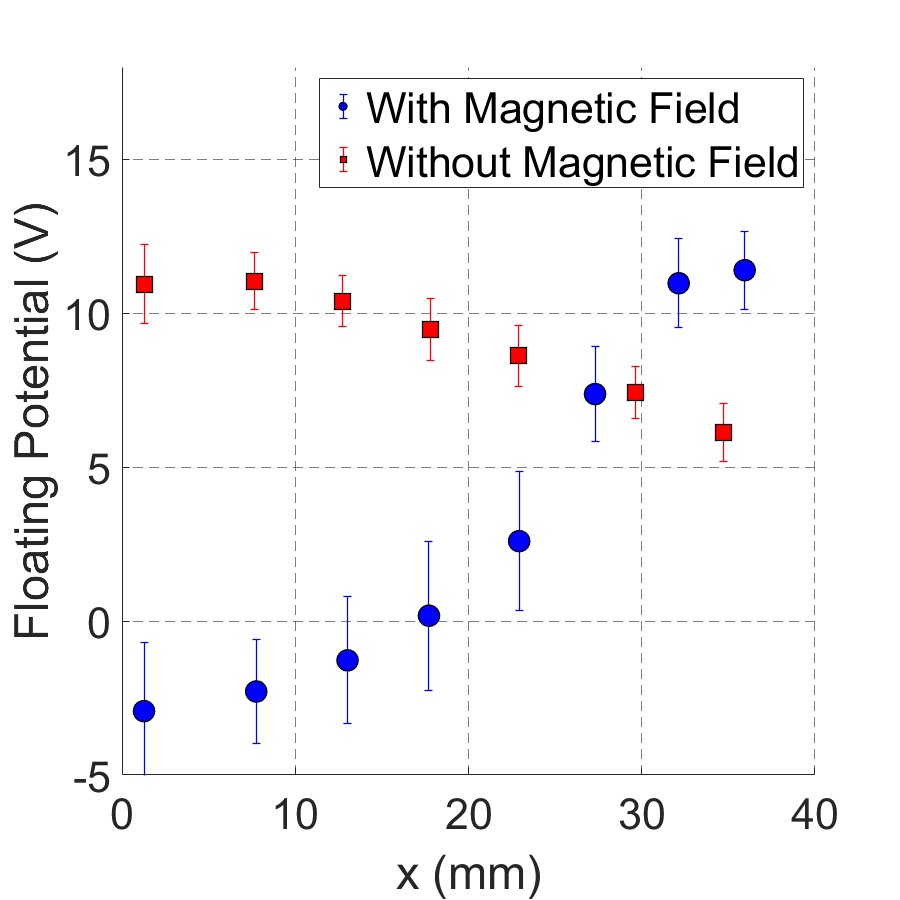
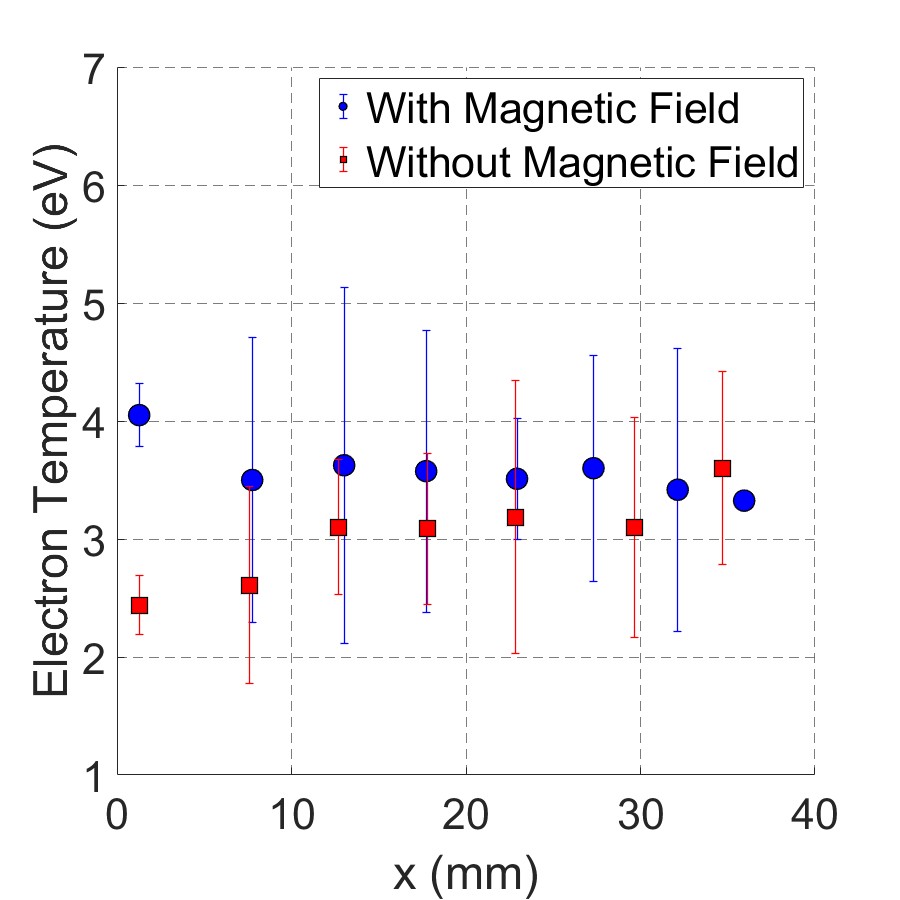
To represent the overall radial distribution of the dust particles, the light intensity from Figs. 9 (b) and (c) and 10 (b) and (c) was summed over all frames for each horizontal positions, x. This is then used to create two line plots shown in Figs. 12(c) and 12(f) which indicates the overall spatial distribution of the grown dust particles over two growth cycles without and with the magnetic field. These plots serve as a quantitative comparison of the two dust clouds to reveal any similarities and differences. In the absence of a magnetic field, the radial intensity variation of the two dusty plasmas exhibits similarities. However, with a magnetic field present, the Ar/TTIP dusty plasma shows peaks at the center and edges of the electrode, whereas the Ar/ dusty plasma exhibits a peak only at the edges and a reduced intensity, due to a void, in the middle of the plasma. This is consistent with the visual observation that there was more titiania dust in the middle of the plasma than there was carbonaceous dust, i.e there was a difference between the spatial distribution of the two dust clouds. To understand why the dust cloud reacts differently to the presence of a magnetic field, it is important to explore changes in plasma conditions resulting from the presence of the magnets. Therefore, our investigation focuses on how the magnetic field has influenced plasma conditions, which can ultimately affect the spatial distribution of the dust cloud. Using a Langmuir probe in an Ar plasma, we measured the plasma parameters of floating potential and electron temperature . The results of the measurements are shown in Fig. 13. There is a radial variation in floating potential as shown in Fig. 13(a). However, there does not seem to be a radial variation of electron temperature.
Let us consider how this measurement of the background plasma parameter may be used to gain insights into the dynamics of the dust particle for the four cases discussed in this paper. Without a magnetic field, as indicated in Fig. 12 (a) - (c), the apparent growth of both the carbonaceous and titania particles appear to fill the plasma volume in a very similar manner. Although there is a left-right asymmetry (i.e., mm vs. mm) in the normalized light intensity, it is similar for both grown dust particle types without a magnetic field. By contrast, when evaluating the case with a magnetic field, as shown in Fig. 12 (d) - (f), there is a difference in the spatial distribution of the grown dust of the two particle types in the presence of a magnetic field. Under the assumption that both the carbonaceous and titania particles have the same negative charge, the change in the direction of the confining, radial electric field may contribute to the difference in the spatial distribution of the dust particles between the magnetized and unmagnetized cases. However, the change in the direction of the electric field is insufficient to describe how a difference could arise the two particle types.
We now consider the effects of the magnetic field on the dust. In this experiment, only the electrons were magnetised during the presence of the magnetic field, according to the Hall parameter, a commonly employed metric for calculating the degree magnetization of species in a dusty plasma due to their charge accumulation [69, 70]. Ions and dust particles are not magnetized. Therefore, there is no magnetization due to charge accumulation on the dust that can explain the differences in spatial dust distribution of titania and carbonaceous nanoparticles. According to Fig. 5(b), the magnetic field, is constant in the region - 15 x(mm) 15. However, there is a change in with respect to x outside that range until the edge of the electrodes. It is plausible that a gradient in the magnetic field is contributing to the differences seen between the spatial distribution of the two dusty plasma. Therefore, we hypothesize that the particles may be expressing alternative magnetic characteristics based on their material properties that might potentially account for variations in the spatial dust distribution and the subsequent dynamics of the dust clouds under the influence of the magnetic field. For example, numerous studies have shown that carbonaceous particles generated in the Ar/ plasma possess aromatic carbon bonds [58, 71, 72]. This is a property which is known to induce diamagnetism in carbonaceous materials [73, 74, 75]. It is possible that the diamagnetic property of the carbonaceous dust is repelling them away from the center of the plasma towards the edge, hence explaining the peak at the edge and a drop in intensity in the middle of the Ar/ dusty plasma. Additionally, it has been shown that the titania particles grown in Ar/TTIP plasma are amorphous [36]. Research have also shown that amorphous titania nanomaterials exhibit paramagnetic behaviors which originate from oxygen vacancies, surface adsorbents, and/or the disordered structure inherent in amorphous materials [76]. If the titania nanoparticles are exhibiting similar paramagnetic properties as in these studies, it is possible that they are being retained towards the middle of the plasma, hence contributing to the peak in intensity. However, in these low temperature plasmas, TTIP not only decomposes into , but also into propene and isopropanol , through a chemical pathway given by Eq. 1 [77].
| (1) |
It is possible that some diamagnetic carbonaceous dust are grown from and . This may explain how the formation of dust might lead to a peak being seen at the edge of the Ar/TTIP dusty plasma, similar to the Ar/ dusty plasma. Future studies will explore the material properties of these dust particles and their correlation with magnetic field strength.
5 Conclusion
This paper compared the growth of titania and carbonaceous nanoparticles as dusty plasmas, in the presence and absence of a weak magnetic field. The growth in both dusty plasmas displays cyclic behavior, with a quicker cycle time when the magnetic field was present. The growth cycles were measured from OES of the plasma and NFT analysis of light emission intensity across the dust cloud. The particles reached their maximum size at the end of the cycle. The spatial distribution of the dust cloud looked similar for both kinds of dusty plasma without magnetic field. However, during the presence of the magnetic field, the two dust cloud responded differently. Measurement of background plasma parameters reveals changes in floating potential during the presence of the magnetic field. However, these measurements are not enough to explain the differences between the two dust cloud during the presence of the magnetic field. Although the dust are not magnetized according to the Hall parameter, carbonaceous dust and titania dust exhibited distinct responses to the applied magnetic field. Coincidentally, the magnetic field was relatively stronger at the middle of the plasma than at the edges, hence there was a gradient in the field. Therefore, these variations in the spatial distribution of the dust cloud may potentially be attributed to different magnetic properties of the dust to the gradient, such as paramagnetism in titania and diamagnetism in carbonaceous dust.
Acknowledgement
This work was supported with funding from the NSF EPSCoR program (OIA-2148653), and the U.S. Department of Energy – Plasma Science Facility (SC-0019176). The authors express gratitude for the technical assistance provided by Mr. Cameron Royer, Ms. Tamara Issac-Smith, Dr. Sarit Dhar, and Mr. Jeffrey Estep in facilitating the implementation of this research project.
Declaration of competing interest
None.
Data Availability
The data that support the findings of this study are available from the corresponding author upon reasonable request.
References
References
- [1] Shukla P 2001 Phys. Plasma 8 1791–1803
- [2] Das A, Dharodi V, Tiwari S 2014 J. Plasma Physics 80 855–861
- [3] Vladimirov S V and Ostrikov K 2004 Phys. Rep. 393 175–380
- [4] Tsytovich V N et al. 2015 Phys. Usp. 58 150–166
- [5] Song Y, Huang F, Chen Z, Liu Y and Yu M 2016 Phys. Lett. A 380 886–895
- [6] Boltnev R, Vasiliev M, Kononov E and Petrov O 2018 J. Exp. Theor. Phys. 126 561–565
- [7] Juan W T, Huang Z H, Hsu J W, Lai Y J and Lin I 1998 Phys. Rev. E 58 R6947
- [8] Ratynskaia S, Knapek C, Rypdal K, Khrapak S and Morfill G 2005 Phys. Plasmas 12
- [9] Schella A, Miksch T, Melzer A, Schablinski J, Block D, Piel A, Thomsen H, Ludwig P and Bonitz M 2011 Phys. Rev. E 84 056402
- [10] Dharodi V, Kostadinova E 2023 Phys. Rev. E 107 055208
- [11] Nunomura S, Samsonov D and Goree J 2000 Phys. Rev. Lett. 84 5141
- [12] Shukla P K and Mamun A 2001 IEEE Trans. Plasma Sci. 29 221–225
- [13] Nakamura Y and Sarma A 2001 Phys. Plasmas 8 3921–3926
- [14] Thomas E, Fisher R and Merlino R L 2007 Phys. Plasmas 14
- [15] Kumar K, Bandyopadhyay P, Singh S, Dharodi V S and Sen A 2023 Sci. Rep. 13 3979
- [16] Mendis D A and Rosenberg M 1994 Annu. Rev. Astron. Astrophys. 32 419–463
- [17] Horanyi M, Hartquist T, Havnes O, Mendis D and Morfill G 2004 Rev. Geophys. 42
- [18] Wahlund J E, Andre M, Eriksson A, Lundberg M, Morooka M, Shafiq M, Averkamp T, Gurnett D, Hospodarsky G, Kurth W et al. 2009 Planet. Space Sci. 57 1795–1806
- [19] Morooka M W, Wahlund J E, Eriksson A I, Farrell W, Gurnett D, Kurth W, Persoon A, Shafiq M, Andre M and Holmberg M K 2011 J. Geophys. Res.: Space Phys. 116
- [20] Popel S, Kopnin S, Golub’ A, Dol’nikov G, Zakharov A, Zelenyi L and Izvekova Y N 2013 Sol. Syst. Res. 47 419–429
- [21] Ma J and Liu J 1997 Phys. Plasmas 4 253–255
- [22] Thomas Jr E and Watson M 1999 Phys. Plasmas 6 4111–4117
- [23] Ignatov A 2005 Plasma Phys. Rep. 31 46–56
- [24] Shukla P K and Eliasson B 2009 Rev. Mod. Phys. 81 25
- [25] Kovacevic E, Stefanovic I, Berndt J, Pendleton Y and Winter J 2005 The Astrophysical Journal 623 242
- [26] Boufendi L, Jouanny M C, Kovacevic E, Berndt J and Mikikian M 2011 J. Phys. D: Appl. Phys. 44 1–6
- [27] Barabash S and Lundin R 1994 IEEE Trans. Plasma Sci. 22 173–178
- [28] Boufendi L and Bouchoule A 1994 Plasma Sources Sci. Technol. 3 252–267
- [29] Kovacevic E, Berndt J, Strunskus T and Boufendi L 2012 J. Appl. Phys. 112 013303–1–5
- [30] Kovacevic E, Berndt J, Stefanovic I, Becke H W, Godd C, Strunsku T, Winte J and Boufendi L 2009 J. Appl. Phys. 105 104910–1–8
- [31] Pattyn C, Kovacevic E, Hussain S, Dias A, T Leca s and Berndt J 2018 Appl. Phys. Lett. 112 013102–1–5
- [32] Garofano V, Berard R, Boivin S, Joblin C, Makasheva K and Stafford L 2019 Plasma Sources Sci. Technol. 28 055019
- [33] Shirafuji T, Miyazaki Y, Nakagami Y, Hayashi Y and Nishino S 1999 Jpn. J. Appl. Phys. 38 4520–4526
- [34] Shioya Y, Shimoda H, Maeda K, Ohdaira T, Suzuki R and Seino Y 2005 Jpn. J. Appl. Phys. 44 3879–3884
- [35] Cameron T J, Klause B, Andaraarachchi H P, Xiong Z, Reed C, Thapa D, Wu C C and Kortshagen U R 2023 Nanotechnology
- [36] Ramkorun B, Jain S, Taba A, Mahjouri-Samani M, Miller M E, Thakur S C, Thomas Jr E and Comes R B 2023 arXiv preprint arXiv:2310.17521
- [37] EJM Rietmeijer I and Mackinnon 1990 Titanium oxide magneli phases in four chondritic porous interplanetary dust particles Lunar and Planetary Science Conference, 20th, Houston, TX, Mar. 13-17, 1989, Proceedings (A90-33456 14-91). Houston, TX, Lunar and Planetary Institute, 1990, p. 323-333. vol 20 pp 323–333
- [38] Posch T, Kerschbaum F, Fabian D, Mutschke H, Dorschner J, Tamanai A and Henning T 2003 The Astrophysical Journal Supplement Series 149 437
- [39] Simon J, Jordan M, Tappa M, Schauble E, Kohl I and Young E 2017 Earth Planet. Sci. Lett. 472 277–288
- [40] Stoner B, Ma G H M, Wolter S D and Glass J 1992 Phys. Rev. B 45 11 067–11 084
- [41] Lee W, Woo S I, Kim J, Choi S and Oh K 1994 Thin Solid Films 237 105–111
- [42] Kuhr M, Reinke S and Kulisch W 1995 Diamond Relat. Mater. 4 375–380
- [43] Yang W and Wolden C 2006 Thin Solid Films 515 1708–1713
- [44] Nguyen H, Kim D, Park D and Kim K 2013 J. Energy Chem. 22 375–381
- [45] Ramkorun B, Chakrabarty K and Catledge S 2021 Mater. Res. Express 8 1–12
- [46] Ravi L and Girshick S 2009 Phys. Rev. E 79 026408
- [47] Groth S, Greiner F, Tadsen B and Piel A 2015 J. Phys. D: Appl. Phys. 48 465203
- [48] Fridman A, Boufendi L, Hbid T, Potapkin B and Bouchoule A 1996 J. Appl. Phys. 79 1303–1314
- [49] Stefanovic I, Kovacevic E, JBerndt and Winter J 2003 New J. Phys. 5 39
- [50] Donders T, Staps T and Beckers J 2022 J. Phys. D: Appl. Phys. 55 1–15
- [51] Merlino R 2006 Dusty plasmas and applications in space and industry vol 81 (Transworld Research Network Kerala, India)
- [52] Beckers J 2011 Dust particle(s) (as) diagnostics in plasmas Ph.D. thesis Eindhoven University of Technology
- [53] de Wetering F V, Brooimans R, Nijdam S, Beckers J and Kroesen G 2015 J. Phys. D: Appl. Phys. 48 035204
- [54] Feng H, Mao-Fu Y, Long W and Nan J 2004 Chin. Phys. Lett. 21 121
- [55] Jaiswal S, Menati M, Couedel L, Holloman V, Rangari V and Thomas E 2020 Jpn. J. Appl. Phys. 59 SHHC07
- [56] Hundt M, Sadler P, Levchenko I, Wolter M, Kersten H and Ostrikov K 2011 J. Appl. Phys. 109
- [57] Kovacevic E, Stefanovic I, Berndt J and Winter J 2003 J. Appl. Phys. 93 2924–2930
- [58] Couëdel L, Artis D, Khanal M, Pardanaud C, Coussan S, LeBlanc S, Hall T, Jr E T, Konopka U, Park M and Arnas C 2019 Plasma Res. Express 1 1–18
- [59] Winter J, Berndt J, Hong S, Kovacevic E, Stefanovic I and Stepanovic O 2009 Plasma Sources Sci. Technol. 18 034010
- [60] Despax B, Gaboriau F, Caquineau H and Makasheva K 2016 AIP Adv. 6
- [61] Despax B, Makasheva K and Caquineau H 2012 J. Appl. Phys. 112
- [62] Garofano V, Stafford L, Despax B, Clergereaux R and Makasheva K 2015 Appl. Phys. Lett. 107
- [63] Ortner M and Bandeira L 2020 SoftwareX 11 100466
- [64] Pizzey D 2021 Rev. Sci. Instrum. 92
- [65] Norlen G 1973 Phys. Scr. 8 249
- [66] Wiese W, Brault J, Danzmann K, Helbig V and Kock M 1989 Phys. Rev. A 39 2461
- [67] Kramida A, Yu Ralchenko, Reader J and and NIST ASD Team 2022 NIST Atomic Spectra Database (ver. 5.10), [Online]. Available: https://physics.nist.gov/asd [2023, September 12]. National Institute of Standards and Technology, Gaithersburg, MD.
- [68] Kushner M J 2003 J. Appl. Phys. 94 1436–1447
- [69] Thomas E, Konopka U, Artis D, Lynch B, Leblanc S, Adams S, Merlino R and M Rosenberg M 2015 J. Plasma Phys. 81 345810206
- [70] Williams S, Thakur S, Menati M and Thomas E 2022 Phys. Plasma 29
- [71] Berndt J, Hong S, Kovacevic E, Stefanovic I and Winter J 2003 Vacuum 71 377–390
- [72] Janalizadeh S, Foroutan G and Foroutan V 2023 . Phys. Chem. A 127 6999–7011
- [73] Pauling L 1936 J. Chem. Phys 4 673–677
- [74] McWeeny R 1951 Proc. Phys. Soc. London, Sect. A 64 261
- [75] Ferguson A and Pople J 1965 J. Chem. Phys 42 1560–1563
- [76] Alivov Y, Grant T, Capan C, Iwamoto W, Pagliuso P and Molloi S 2013 Nanotechnology 24 275704
- [77] Fictorie C P, Evans J F and Gladfelter W L 1994 J. Vac. Sci. Technol. A 12 1108–1113