Diverse Explanations from Data-driven and Domain-driven
Perspectives for Machine Learning Models
Abstract
Explanations of machine learning models are important, especially in scientific areas such as chemistry, biology, and physics, where they guide future laboratory experiments and resource requirements. These explanations can be derived from well-trained machine learning models (data-driven perspective) or specific domain knowledge (domain-driven perspective). However, there exist inconsistencies between these perspectives due to accurate yet misleading machine learning models and various stakeholders with specific needs, wants, or aims. This paper calls attention to these inconsistencies and suggests a way to find an accurate model with expected explanations that reinforce physical laws and meet stakeholders’ requirements from a set of equally-good models, also known as Rashomon sets. Our goal is to foster a comprehensive understanding of these inconsistencies and ultimately contribute to the integration of eXplainable Artificial Intelligence (XAI) into scientific domains.
1 Introduction
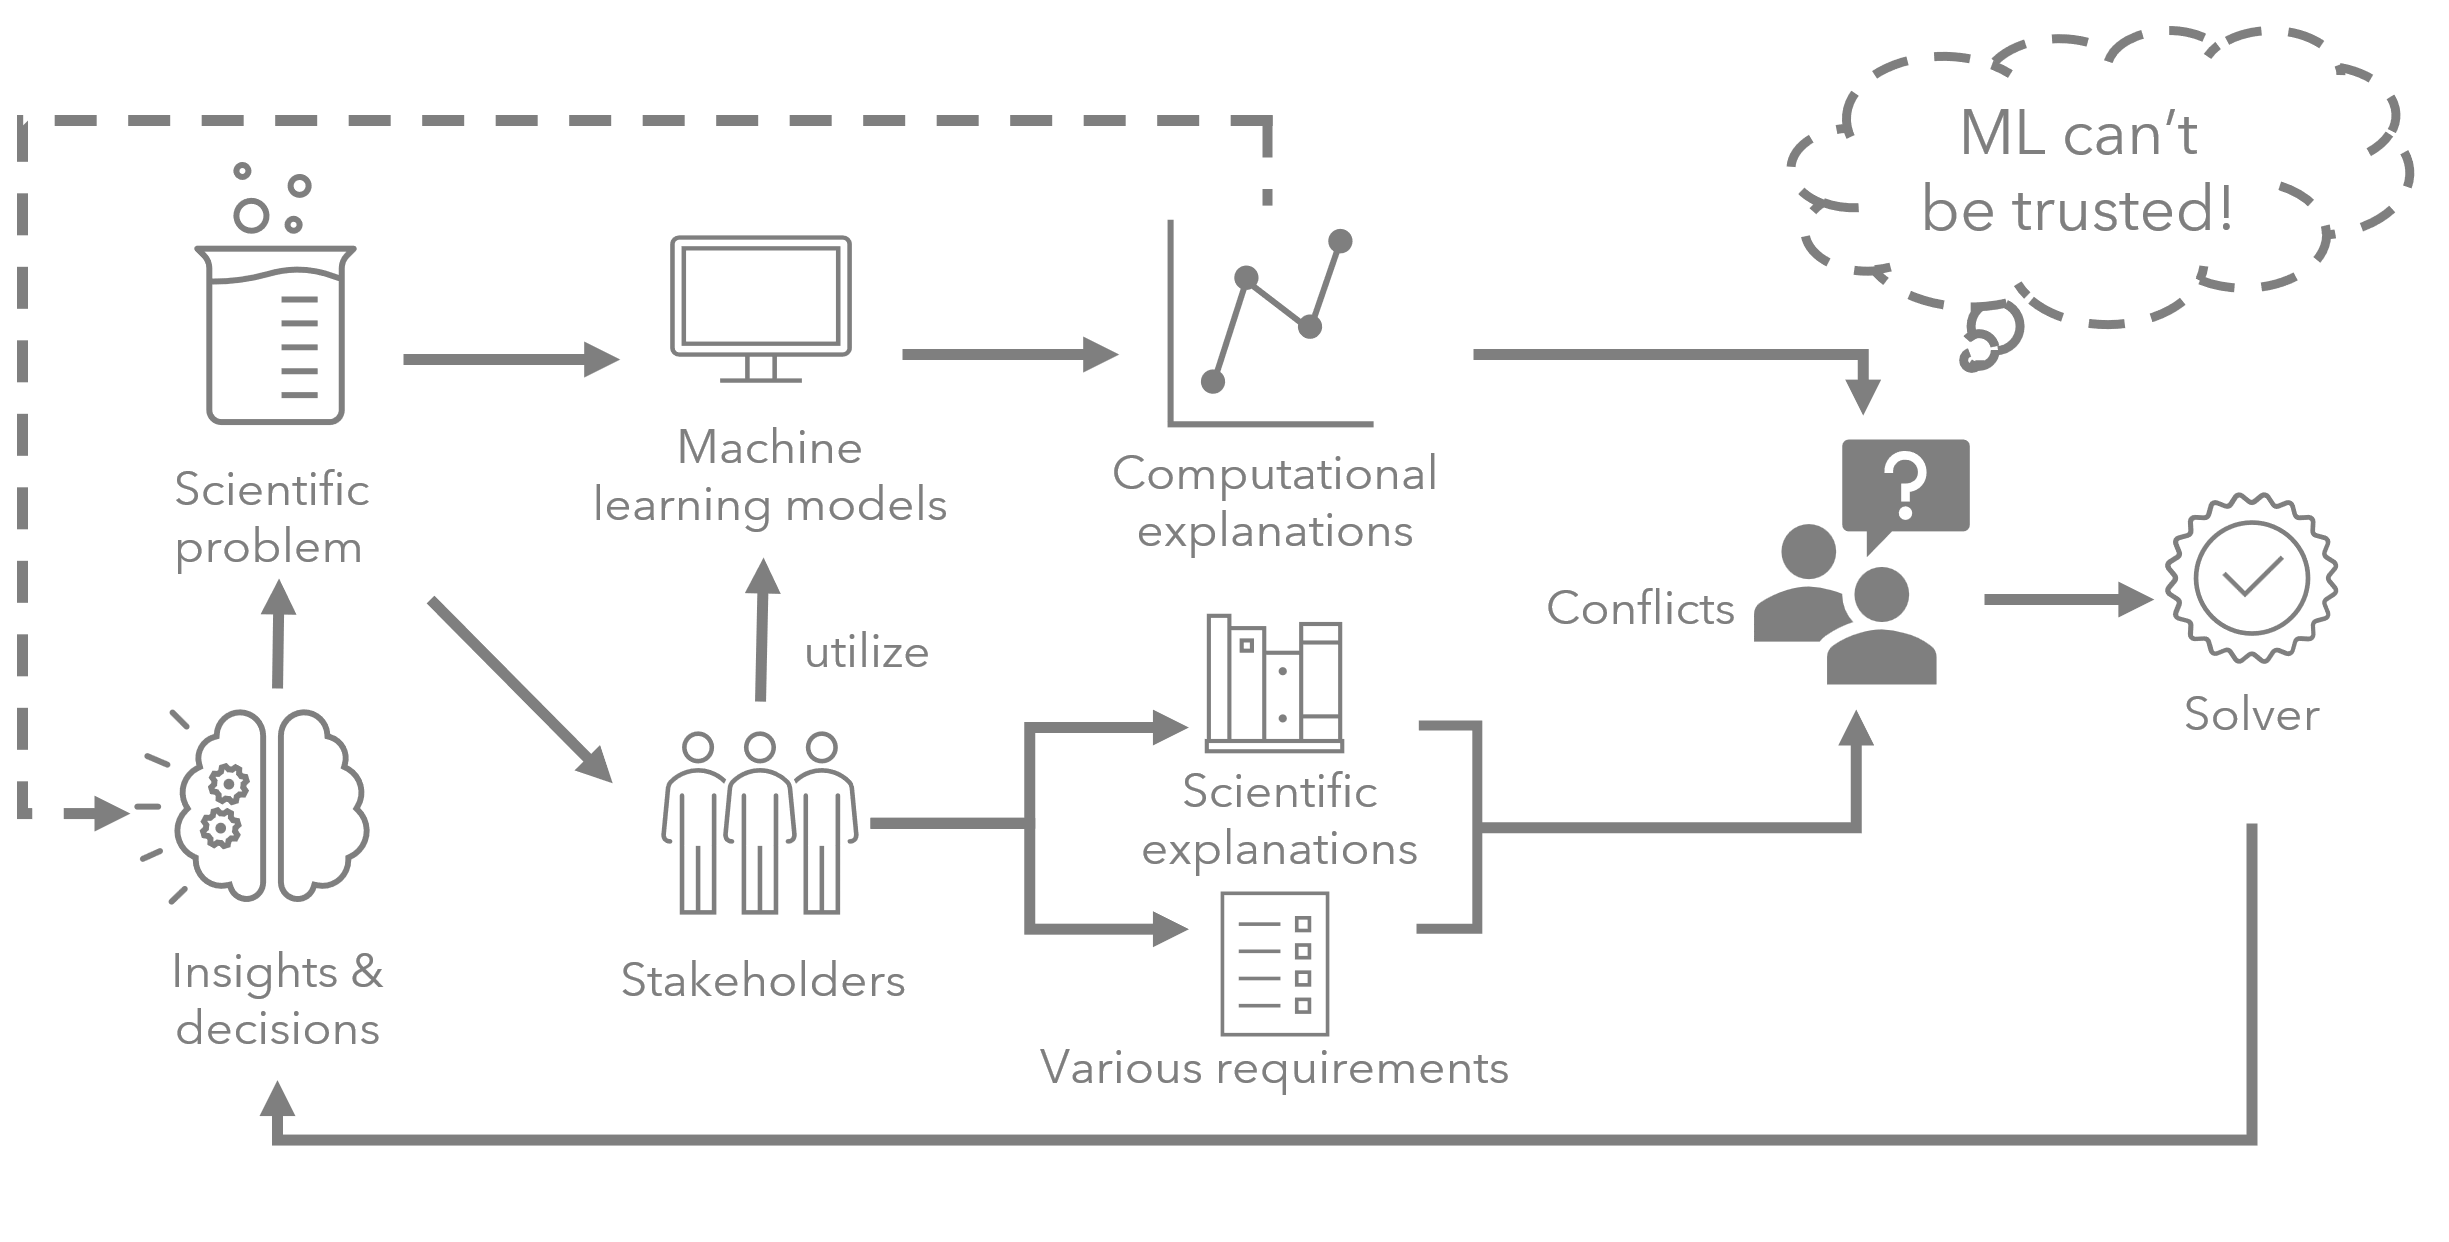
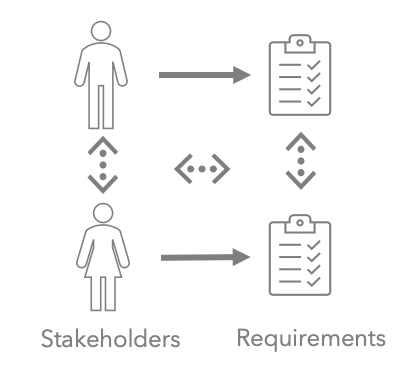
The success in obtaining accurate model predictions without requiring extensive domain knowledge has driven rapid adoption of machine learning (ML) in scientific areas, such as molecular biology, material discovery and healthcare (Kailkhura et al., 2019; Wiens & Shenoy, 2018; Carvalho et al., 2022). These domains follow a data-driven approach by analyzing a large volume of data to obtain data-driven insights and predictions that are not possible using conventional methods, shown in Fig. 1. However, the predictive ability of ML typically comes at the price of explainability, prompting the development of explainable artificial intelligence (XAI). Since many black-box ML models are not interpretable, understanding why a model predicts a particular outcome becomes critical. For example, consider a scenario where a patient’s diagnosis is predicted by a classifier; without insights into how biomedical data is used in the prediction clinicians may know the outcome but struggle to develop a treatment plan. Ensuring that humans retain control over predictions and their explanations from ML methods is crucial for making decisions and acting on them with full confidence (Miller, 2023).
Recent studies have demonstrated that many different ML models can perform similarly on the same dataset, even with different functional forms (e.g., random forests, neural networks, support vector machines) (Rudin, 2019; Li & Barnard, 2023a; Fisher et al., 2019). As a result, ML models with comparable effectiveness can offer diverse explanations for the same dataset. An intuitive question easily arises: which model should we trust? Many researchers seek to identify which samples or features are important in describing the model effects (Li et al., 2023; Hsu & Calmon, 2022). However, when faced with the existence of multiple equally-good models, training and explaining a dataset with a single model becomes problematic, and results in inconsistencies between interpretability and established scientific principles (Reichstein et al., 2019; Roscher et al., 2020b).
Combined with the inherent difficulty in finding the right ML model for complex real-world data, the lack of explainability of ML methods has hindered their potential impact in many domains (Varshney & Alemzadeh, 2017). Methods of explainability/interpretability for ML models are intensively studied and there is an increasing demand for applying XAI to ML predictions in science (Jiménez-Luna et al., 2020; Huang et al., 2023; Zhong et al., 2022; Barnard & Fox, 2023; Barnard, 2022). While all explanations include human perspectives, a recent survey of XAI for scientific insights and discoveries (Roscher et al., 2020b) identified two main types of explanations for scientific outcomes: explaining output results and explaining models. The former involves learning an ML model (often a black-box model) from known input-output relations, and interpreting its predictions through another model. This is referred to as post-hoc explanations. The latter involves designing a logical model or task-specific model to be inherently interpretable based on domain knowledge. Domain knowledge is based on experience, but not necessarily on the observations captured in the data. Similarly, predictions driven entirely by patterns in the data may not reflect the breadth of human experience.
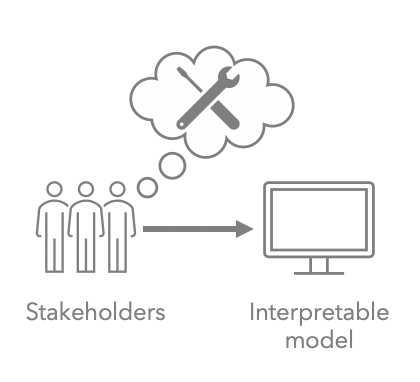
For this reason, many scientists find black-box ML models difficult to trust. Rudin (Rudin, 2019) proposed a well-accepted perspective, suggesting a shift from explaining black-box models to using interpretable models instead, but constructing interpretable models poses challenges for some stakeholders. It is unrealistic for end users to construct an interpretable model before they ask for reasons behind their predicted results, particularly when there may be a trade-off between model accuracy and model explainability (Adadi & Berrada, 2018). In some cases, the use of black-box models might be unavoidable, especially with their superior performance, and establishing trust risks hindering the decision-making process.
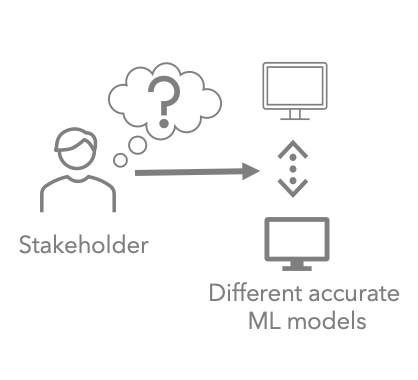
In science, the presence of multiple stakeholder groups, including (but not limited to) model developers in the data-driven groups, laboratory researchers in the experimental groups, and end users, adds another layer of complexity. These groups differ in their knowledge, expertise, experience and goals, leading to diverse and specific needs for explanation of the same model. For instance, in the previous example, patients and clinicians may be more interested in understanding the reasons behind the diagnosis and how to improve the outcomes, rather than knowing the most important features for the ML system which is more useful to model developers. In essence, stakeholders seek a ready-to-use framework that provides trustworthy explanations, to some extent regardless of implementation details.
In this position paper we argue that, even though there are a large number of XAI studies in scientific domains, trust has yet to be established. We identify and explore inconsistencies between data-driven and domain-driven explanations in well-trained ML models from different perspectives by conducting experiments, and suggest a solution. The paper is organized as follows: In Sec. 2, we identified the main sources of inconsistency from existing literature. Section 3 introduces a foundational taxonomy, establishing a connection between data-driven and domain-driven explanations from a high-level human perspective. In Sec. 4, We provide two study cases to explicitly illustrate the data-driven and domain-driven inconsistency. In Sec. 5, we suggested a potential Rashonmon set-based solver for addressing inconsistencies to guide the decision-making process.
2 Potential Causes of Inconsistency
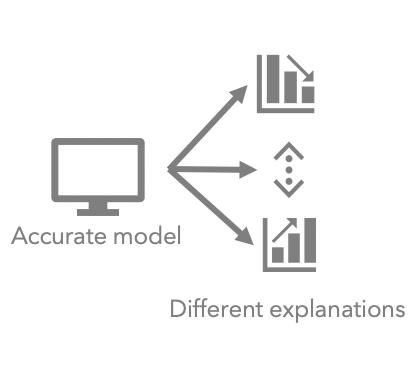
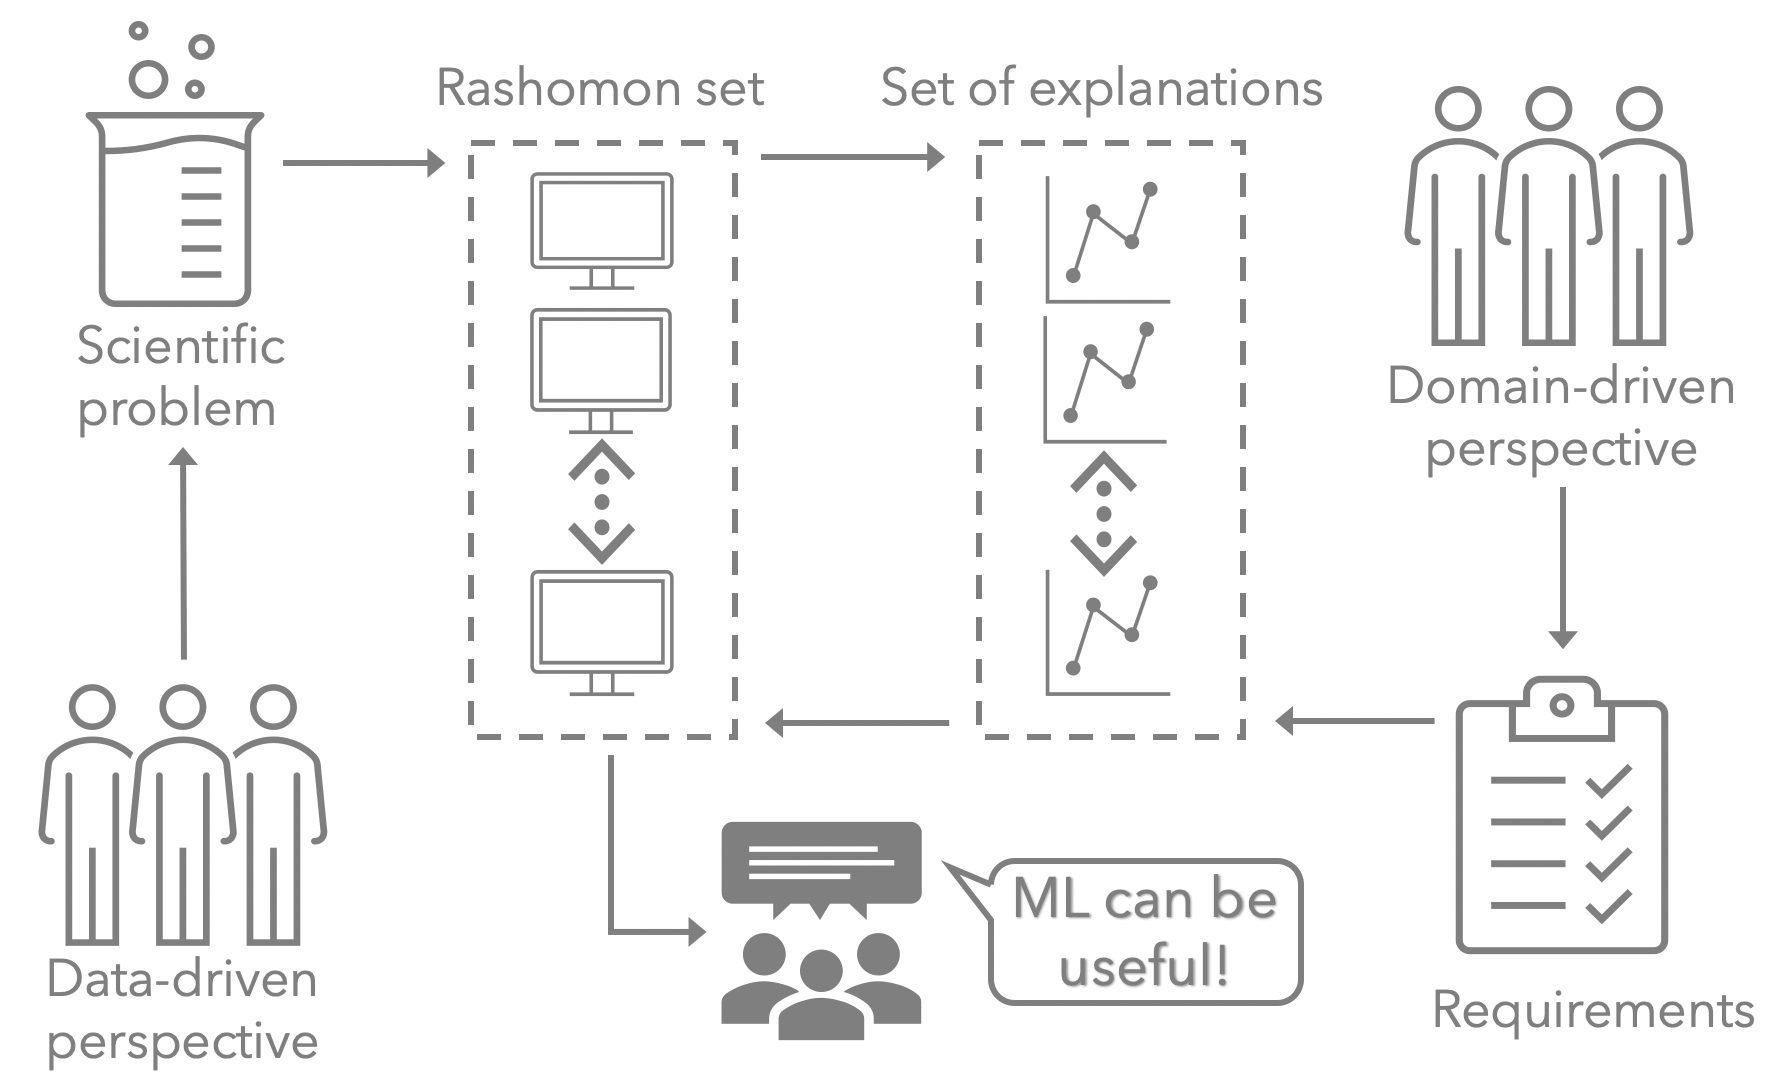
Scientific consistency (Karpatne et al., 2017) was introduced as an essential component for model learning in 2017, among the fundamental requirements for producing trustworthy outcomes in scientific applications (Reichstein et al., 2019). This means that the results obtained from ML models must be consistent with established scientific principles (Roscher et al., 2020b). Here we extend this definition to include data-driven vs domain-driven consistency, which is the extent to which the selection and formulation of domain knowledge align with explanations derived from ML models. We refer to this as Data-Domain Consistency (DDC). In this section, we outline four challenges that impede DDC, illustrated in Fig. 2, from a data-driven perspective and domain-driven perspective.
2.1 Data-driven inconsistency
To consider whether data-driven explanation methods are consistent we begin by considering explainability and interpretability in ML. These two concepts are very closely related and are hard to rigorously define (Linardatos et al., 2020; Lipton, 2018; Kim et al., 2016; Miller, 2019; Li & Barnard, 2023a; Imrie et al., 2023; Adadi & Berrada, 2018). Here we use two terms explainability/interpretability interchangeably to describe the ability of a human to understand a prediction (Doshi-Velez & Kim, 2017). Summarising all the XAI-related methods is impractical the 40-year history and evolving terminology (Freitas, 2014; Rudin, 2019), but recent surveys categorize explanation methods as local/global explanations and intrinsic/extrinsic interpretations, which are all referred to as data-driven explanations in this paper. (Gilpin et al., 2018; Guidotti et al., 2018; Adadi & Berrada, 2018; Linardatos et al., 2020; Zhong et al., 2022; Roscher et al., 2020b; Imrie et al., 2023).
Let us then consider the scenario of explaining a well-trained multilayer perceptron (MLP) in a real-world application, in terms of performance metrics such as classification accuracy or mean squared error (MSE) for regression. For the purpose of this discussion, we overlook the training process and focus on understanding the importance of features. An intuitive explanation of the MLP is by directly analyzing the gradients, as the model learns by optimizing its parameters with respect to the training data. One widely recognized method for this interpretation is Integrated Gradients (IG) (Sundararajan et al., 2017). As some explanation methods are model-agnostic, such as Shapley additive explanations (SHAP) (Lundberg & Lee, 2017) and permutation feature importance (PI) (Breiman, 2001), we can also use them to interpret the MLP. Applying these methods quickly reveals that the feature rankings are inconsistent, as demonstrated in a case study in Sec. 4.
Accurate yet misleading models
In practical scientific problems, choosing an ML algorithm is complicated, and influenced by many factors including the type of data, the type of the problem, and the overall performance required (Thiyagalingam et al., 2022). A common belief is that the model should, at least, attain an acceptable level of accuracy/performance on the given dataset, while allowing humans to understand and trust the prediction (Ribeiro et al., 2016a; Gunning, 2017). If the model’s performance is unsatisfactory, its predictions can not be trusted, and the need for explanations diminishes. Satisfactory performance/accuracy of a model is a prerequisite for explanations. However, if multiple accurate ML models can exist for a specific task, as demonstrated by the study of Rashomon sets (Fisher et al., 2019), there will be multiple (potentially contradictory) explanations. In most scientific studies, there is usually one explanation required, so logically most models are misleading. Accuracy is not enough to ensure an explanation.
An accurate model can be interpreted either directly if the algorithm is inherently interpretable, or indirectly using post-hoc explanation methods. This can be achieved by applying interpretation tools, but given many explanation methods available inherently interpretable models are always preferable (Adadi & Berrada, 2018; Rudin, 2019). Rudin assumed the existence of accurate interpretable models for specific domains, based in part on the victory of a globally interpretable model (Chen et al., 2018) in the 2018 FICO Explainable ML Challenge, where participants were directed to create a black box. It is therefore plausible that there exist multiple accurate interpretable models for a specific task, which raises the question: Are explanations consistent across different interpretable models? As our demonstration in Sec. 4 will show, explanations can vary for a particular task making method selection even more challenging.

2.2 Domain-driven inconsistency
Despite the existence of multiple accurate models and well-established explanation methods, the integration of domain knowledge is necessary to ensure scientifically plausible and consistent results. A paradigm known as theory-guided data science (TGDS) aims to integrate scientific knowledge to enhance the effectiveness of data science models in facilitating scientific discovery (Karpatne et al., 2017). A recently comprehensive review considers more knowledge sources, including world knowledge, scientific knowledge, and expert knowledge (Von Rueden et al., 2021). Overall, knowledge integration approaches can be broadly classified into two categories (Roscher et al., 2020b):
-
•
a priori integration at the model design stage, such as generating a training set, designing the model architecture, and guiding a learning algorithm.
-
•
a posteriori integration by analyzing the output of a model, with the potential removal of invalid outcomes.
A priori integration involves constructing a task-specific based on domain knowledge, which is incorporated into the design process to ensures that interpretability aligns with human expectations (Karpatne et al., 2017). However, in practice, solving a set of application-specific constraints on the model, such as specific initializations, or (loss) regularizations, is data-drivenly difficult for some stakeholders. A study assessing the impact of a priori intervention recently showed that manual feature selection based on domain knowledge resulted in inferior model performance (Li et al., 2022). Thus, finding an accepted solution to a constrained optimization problem, at present, still requires the collaborative effort of deep-learning experts, chemoinformatics and data scientists, chemists, biologists, and other domain experts (Jiménez-Luna et al., 2020). A posteriori integration is often preferable, since it is much easier to use black-box ML methods than it is to troubleshoot and solve data-drivenly hard problems (Rudin, 2019; Jiménez-Luna et al., 2020), but the results should not be accepted blindly. The explanation must withstand biological, chemical, and physical scrutiny.(Li et al., 2016; Jiménez-Luna et al., 2020; Loveland et al., 2021). For example, a clinician can tell if patients are misclassified by a given ML model based on their diagnoses, making the ML model untrustworthy and less useful for their purposes.
The value of human involvement
Assessing the quality of an explanation is important in practice, and the evaluation metrics should be in line with the specific goals (Doshi-Velez & Kim, 2017). However, one open problem in applying XAI to scientific tasks is the lack of clear ground truth (Zhong et al., 2022). Despite the increasing body of research producing interpretable ML methods, there has been limited focus on evaluating these methods, likely due to the subjective nature of explainability (Adadi & Berrada, 2018; Rudin, 2019). The taxonomy of evaluations can be grounded in applications, human perspectives, and functionality, or in distinguished by processing, representation, and explanation generation, and more approaches may emerge in the future (Doshi-Velez & Kim, 2017; Gilpin et al., 2018). A determining factor of the overall explainability of a model, from different viewpoints in the literature, is human (Adadi & Berrada, 2018; Gilpin et al., 2018; Ehsan et al., 2021), which introduces bias and a third level of complexity to the evaluation (Adadi & Berrada, 2018; Miller, 2019).
A recent study (Imrie et al., 2023) demonstrates the critical importance of understanding models from the perspective of multiple stakeholders, by showing how different types of explanation are used in healthcare. Stakeholders interpret model explanations based on their values. Drawing again on our previous example, the patient primarily concerned with an accurate diagnosis has zero tolerance for misclassification, while the model developer might find a model with a 95% accuracy rate convincing. In this scenario, a clinician needs explanations for the classification to resolve the dilemma. This is a straightforward example indicative of problems in medicine, philosophy, psychology and cognitive science (Miller, 2023). Achieving a consistent explanation for all stakeholders across multiple domains is an unobtainable goal.
3 Two Fundamental Data-Domain Consistency (DDC) Explanations
The goal of enabling explainability in ML is to ensure that data and algorithmic decisions can be explained to stakeholders in an understandable way (Adadi & Berrada, 2018; Kim et al., 2016). As discussed earlier, data-driven explanations are evolving rapidly, as evidenced by the increasing number of surveys in the literature, and domain-driven explanations have conflicts. For this reason most reviews focus on data-driven explanations and suggest that the approach and metric should be determined by the purpose and completeness of the targeted explanation (Gilpin et al., 2018; Doshi-Velez & Kim, 2017). To provide a potential solution for explanation inconsistency, it is necessary to specify a taxonomy for explanations that encompasses DDC explanations, even at a conceptual level.
3.1 Common taxonomies for data-driven explanations
Data-driven explanations depend on the pre-processing of data and the choice of learning algorithms, which are guided by human understanding (Roscher et al., 2020a). One way to classify XAI methods is by the type of data, whether it is tabular, text, image, audio or video (Gohel et al., 2021). Regardless of data type, a dataset is a collection of instances (e.g. a row of tabular data, a single image, or a sentence), each exhibiting specific patterns (e.g. columns, pixels or characters).
The explanation of an instance is local, while feature explanations are global (Molnar, 2022; Adadi & Berrada, 2018; Doshi-Velez & Kim, 2017). We acknowledge that there are many ways to classify and generate explanations, but we argue that all understandable terms are ultimately based on either samples or features. For instance, some researchers have proposed concept-based explanations as a high-level way for humans to understand (Ghorbani et al., 2019; Crabbé & van der Schaar, 2022), since this representation can be viewed as feature interactions or a group of sample effects. Here we will use these two fundamental groups: feature-driven explanations and example-driven explanations, viewed from a domain-driven perspective111We use feature-driven explanations and example-driven explanations to differentiate from feature-based explanations and example-based explanations in the literature..
3.2 General requirements for human understanding
Domain-driven explanations are crafted by humans with specific requirements and objectives, which suggests there are three points that must be considered to build a useful XAI (Miller, 2019). Feature-driven explanations and example-driven explanations both meet the following requirements.
-
1.
Explanations must be contrastive: Humans do not ask why a particular feature is important, but they ask why the feature is more important than others, where a feature might be a global feature (feature-driven) or a local feature (example-driven).
-
2.
Explanations must be selective: When making decisions, humans tend to focus on one or two most important features that lead to the specific decision (example-driven) or general patterns (feature-driven).
-
3.
Explanations must be interactive: Humans want to use the information to transfer knowledge about the data and the prediction. For instance, a clinician may inform the patient (example-driven) about what features (feature-driven) contribute to the outcome.
3.3 Specific requirements for stakeholder needs
Stakeholders, in turn, may be interested in either specific features, which can be defined based on tasks and requirements, such as a biomarker in disease studies or chemical composition in material science, or individual samples, such as a patient or customer. Imrie recently highlighted (Imrie et al., 2023) the different types of information that address the explanation needs of multiple stakeholders, and discussed five key stakeholders in healthcare with unique perspectives. Listing all possible stakeholders for different domains is beyond the scope of this paper, but some key stakeholder groups are: Developers, who create models and seek to improve performance; Scientists, with expertise, focusing on scientific discovery; Professionals, who develop products or implement services; and End-users, who are the intended consumers of a product or service.
These categories can serve as a foundation, since domain-specific tasks in science often require the involvement of more types of stakeholders, but each key stakeholder’s requirements will involve either example-driven explanations or feature-driven explanations. We illustrate a case of the connection between domain-driven explanations and data-driven explanations in Fig.3, where data-driven explanations222LIME, local interpretable model-agnostic explanations (Ribeiro et al., 2016b); SHAP, Shapley additive explanations (Lundberg & Lee, 2017); CAR, concept activation regions (Crabbé & van der Schaar, 2022); SimplEx (Crabbé et al., 2021); STI, Shapley Taylor Interaction Index (Janizek et al., 2021) are classified into five groups (Imrie et al., 2023).
4 Case Studies
In this section we put this framework to the test, and illustrate how accurate models and well-established methods can mislead different stakeholders.
4.1 Example-driven explanation inconsistency
| Feature-driven sets | Representatives | Stakeholders | Representative questions |
Representative
expectations |
|---|---|---|---|---|
| Important |
Computer
scientist |
Developers | Which features should be included in the model and achieve the best performance? | I believe that feature importance is should depend soley on the model and data. |
| Controllable |
Experimental
materials scientist |
Scientists | Which features are controllable and important in the lab? | I anticipate that controllable features are related to physical properties. |
| Structural |
Computational
materials scientist |
Scientists | Which features are related to the structure and can be measured using microanalysis methods in the lab? | I expect structural features to be essential contributors. |
| Processing |
Materials
engineer |
Scientists | Which features are related to the synthesis conditions and are inputs for experiments in the lab? | I believe that controlling certain processing features will be helpful. |
| Experimental | Manufacturer | Professionals | Which controllable features are related to the synthesis conditions and structural attributes that are inputs for industrial processes? | I believe focusing on experimental features will save me money. |
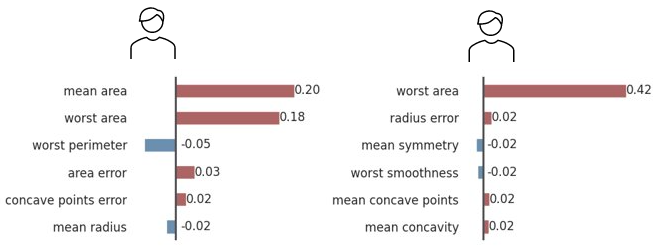
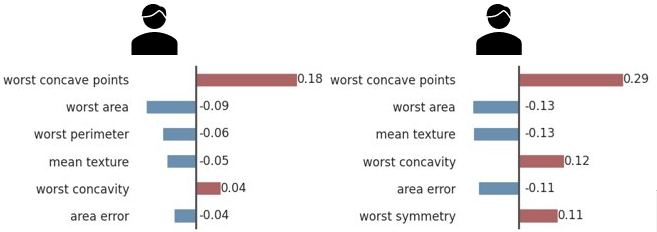
We consider a common task of predicting whether the cancer is benign or malignant using the Breast Cancer Wisconsin (Diagnostic) Dataset (Wolberg et al., 1995). We trained four models on the dataset with promising accuracy, which included both interpretable and uninterpretable models: MLP, Random Forest (RF), Support Vector Machine (SVM) , and eXtreme Gradient Boosting (XGBoost).
Conflicts between stakeholders
When these four models are employed to classify the same patient in the test set, RF and XGBoost misclassify the patient, as indicated by the black color in Fig. 4. The incorrect prediction would be absolutely unacceptable for the patient (End-user), even though the overall model performance is satisfactory for the ML model Developer.
In this case we explained the four models with LIME, focusing on the models that provide the correct classification, colored by white in Fig. 4, as the clinician (Professional) has to trust the prediction before they understand what features are driving the prediction for the specific patient. Patients primarily wish to understand the reasons for their diagnosis, while the LIME local explanations offer diverse interpretability of the model prediction.
4.2 Feature-driven explanation inconsistency
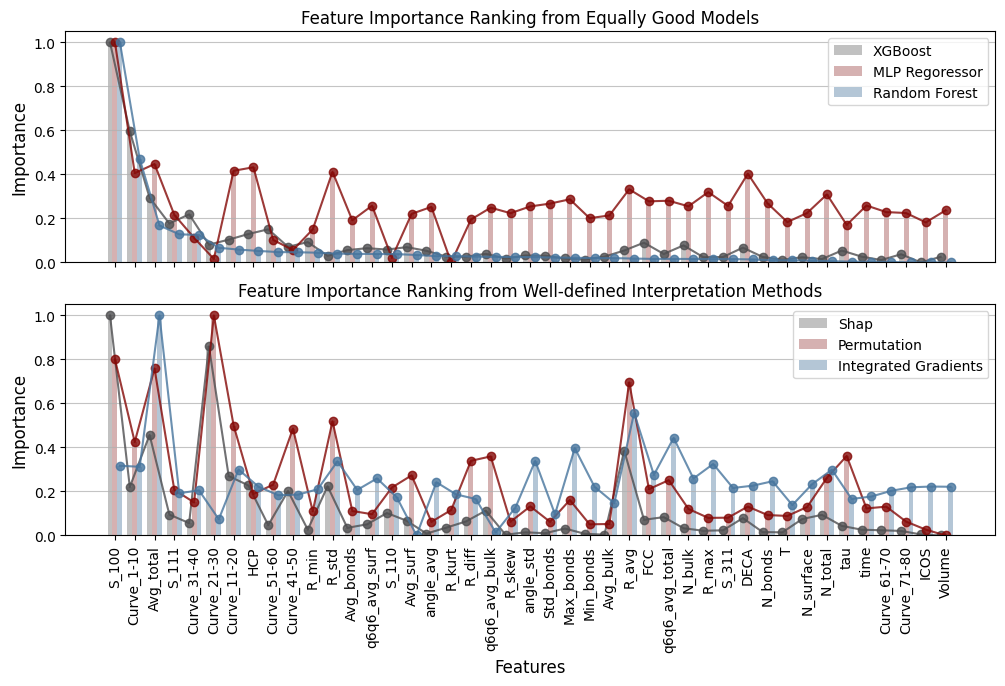
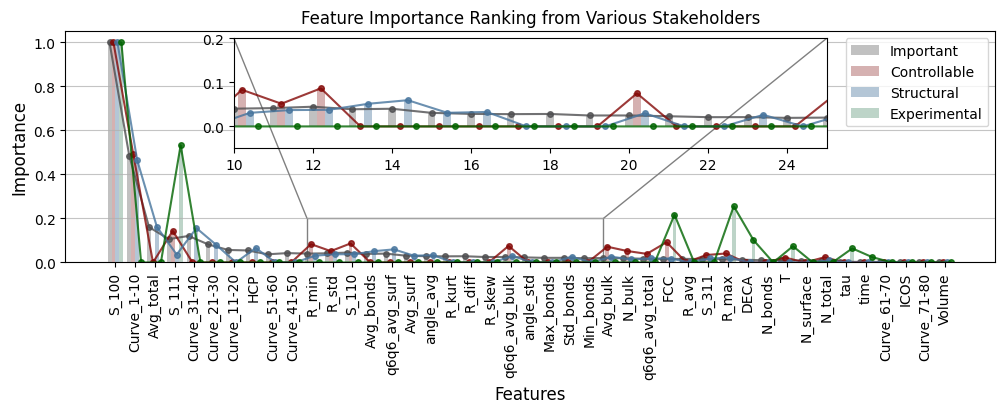
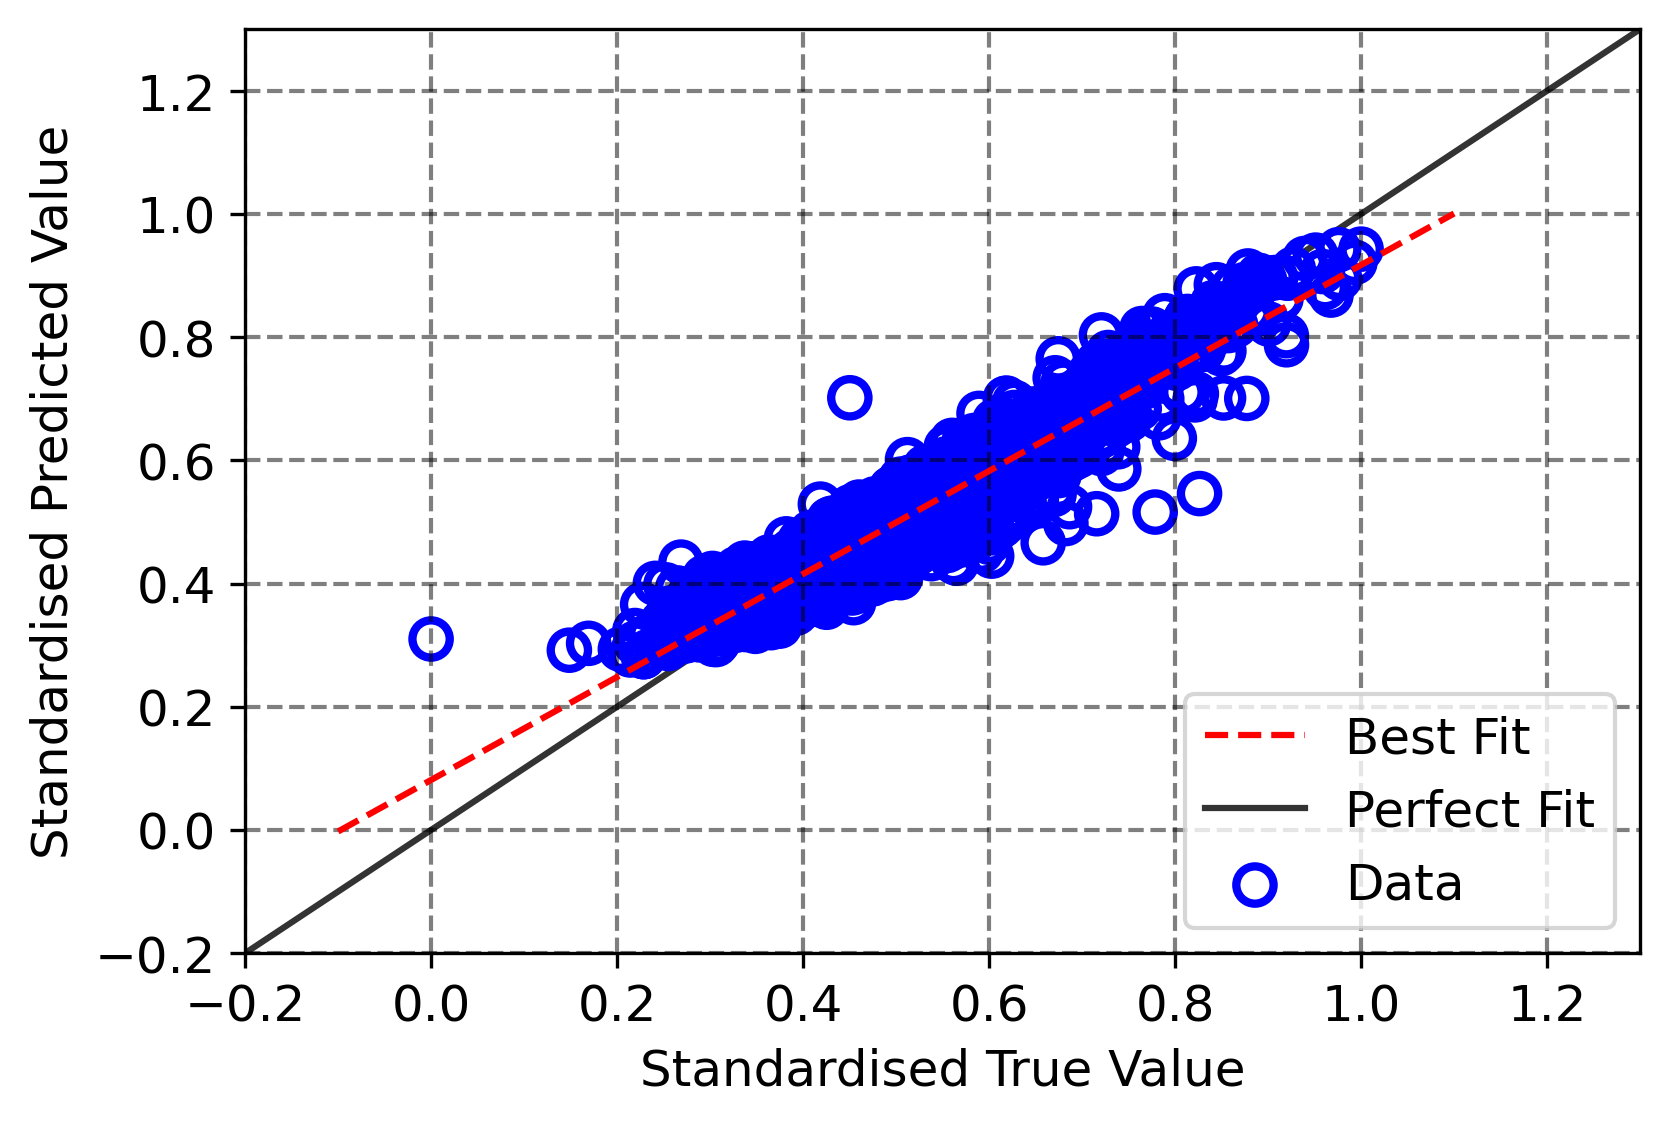
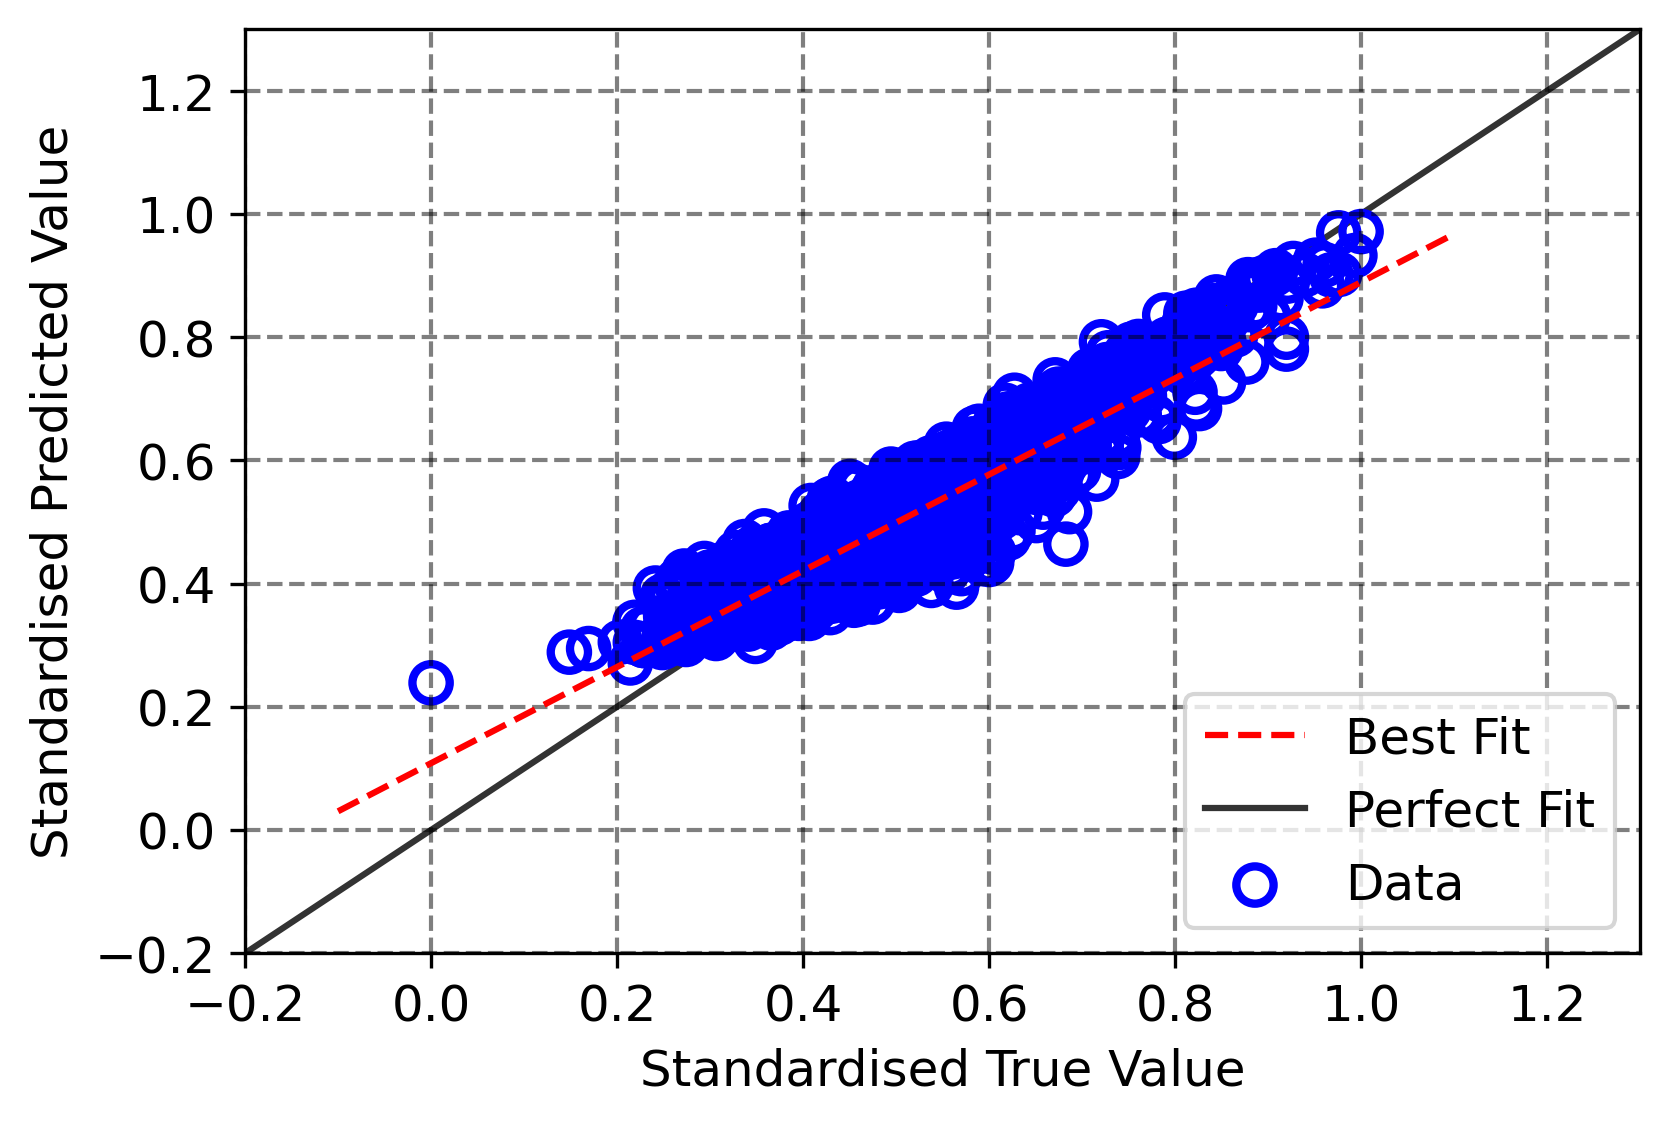
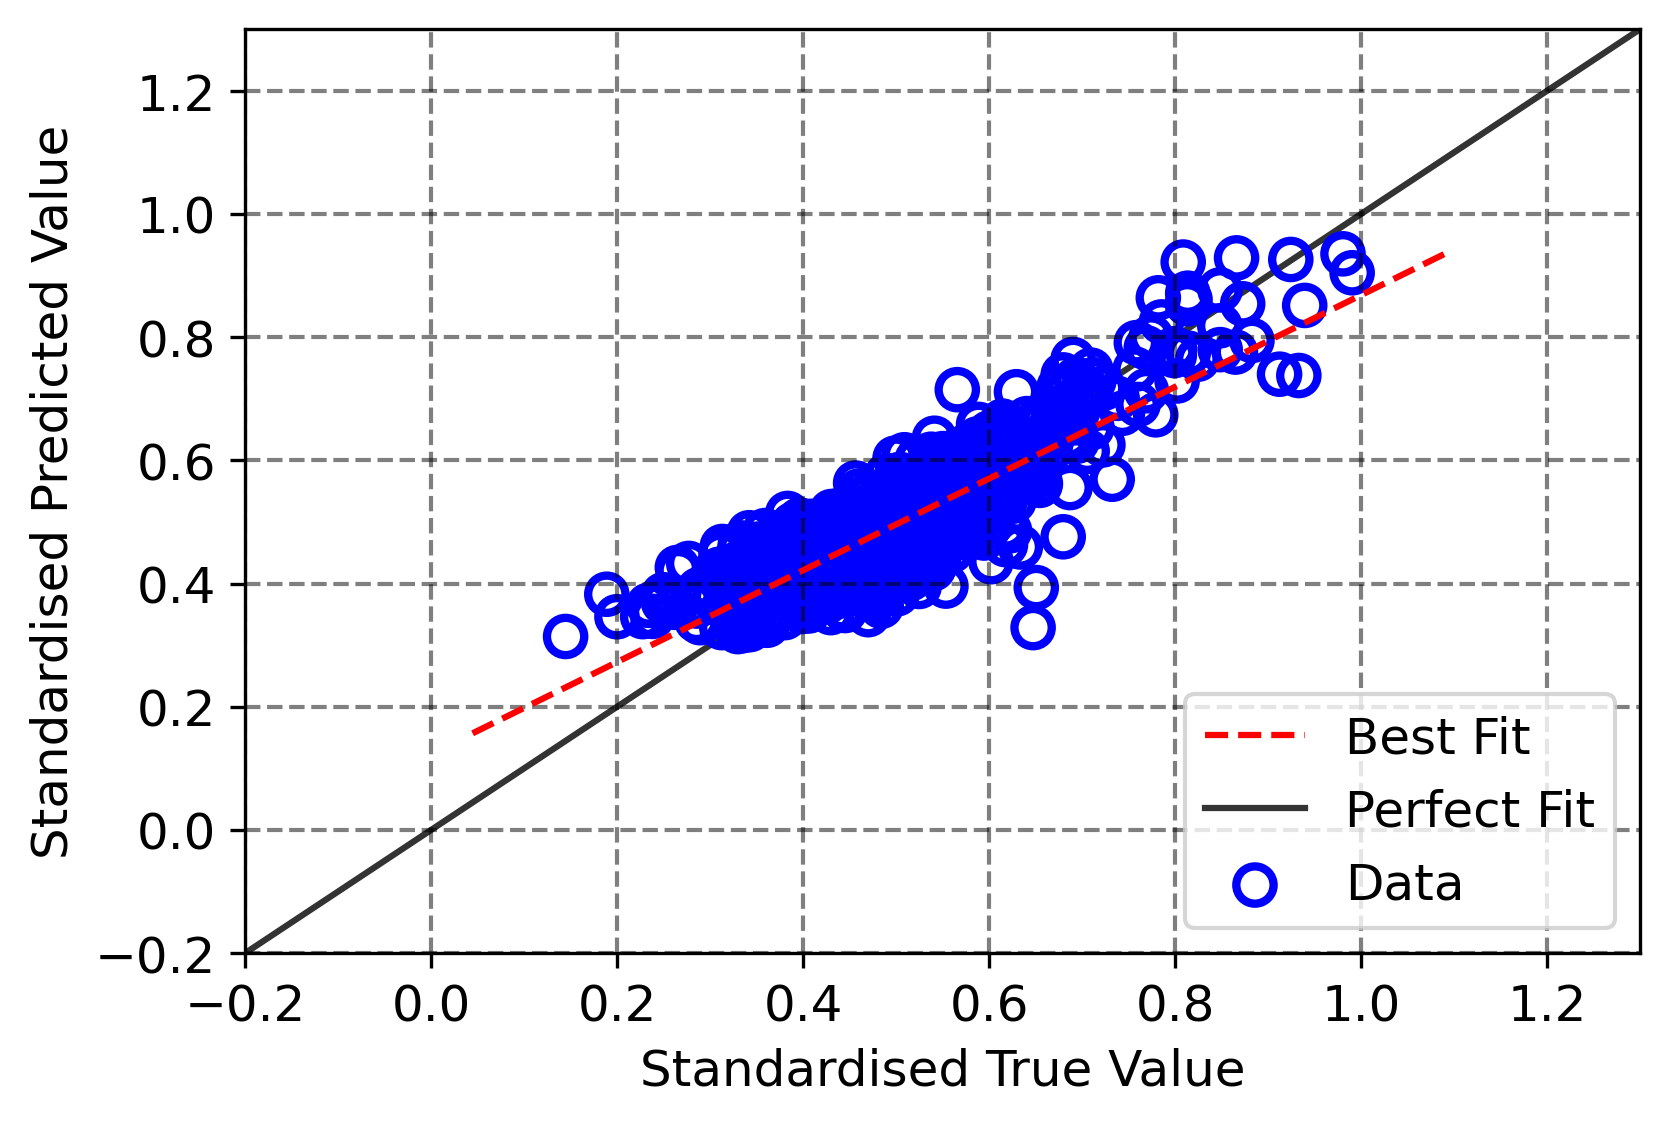
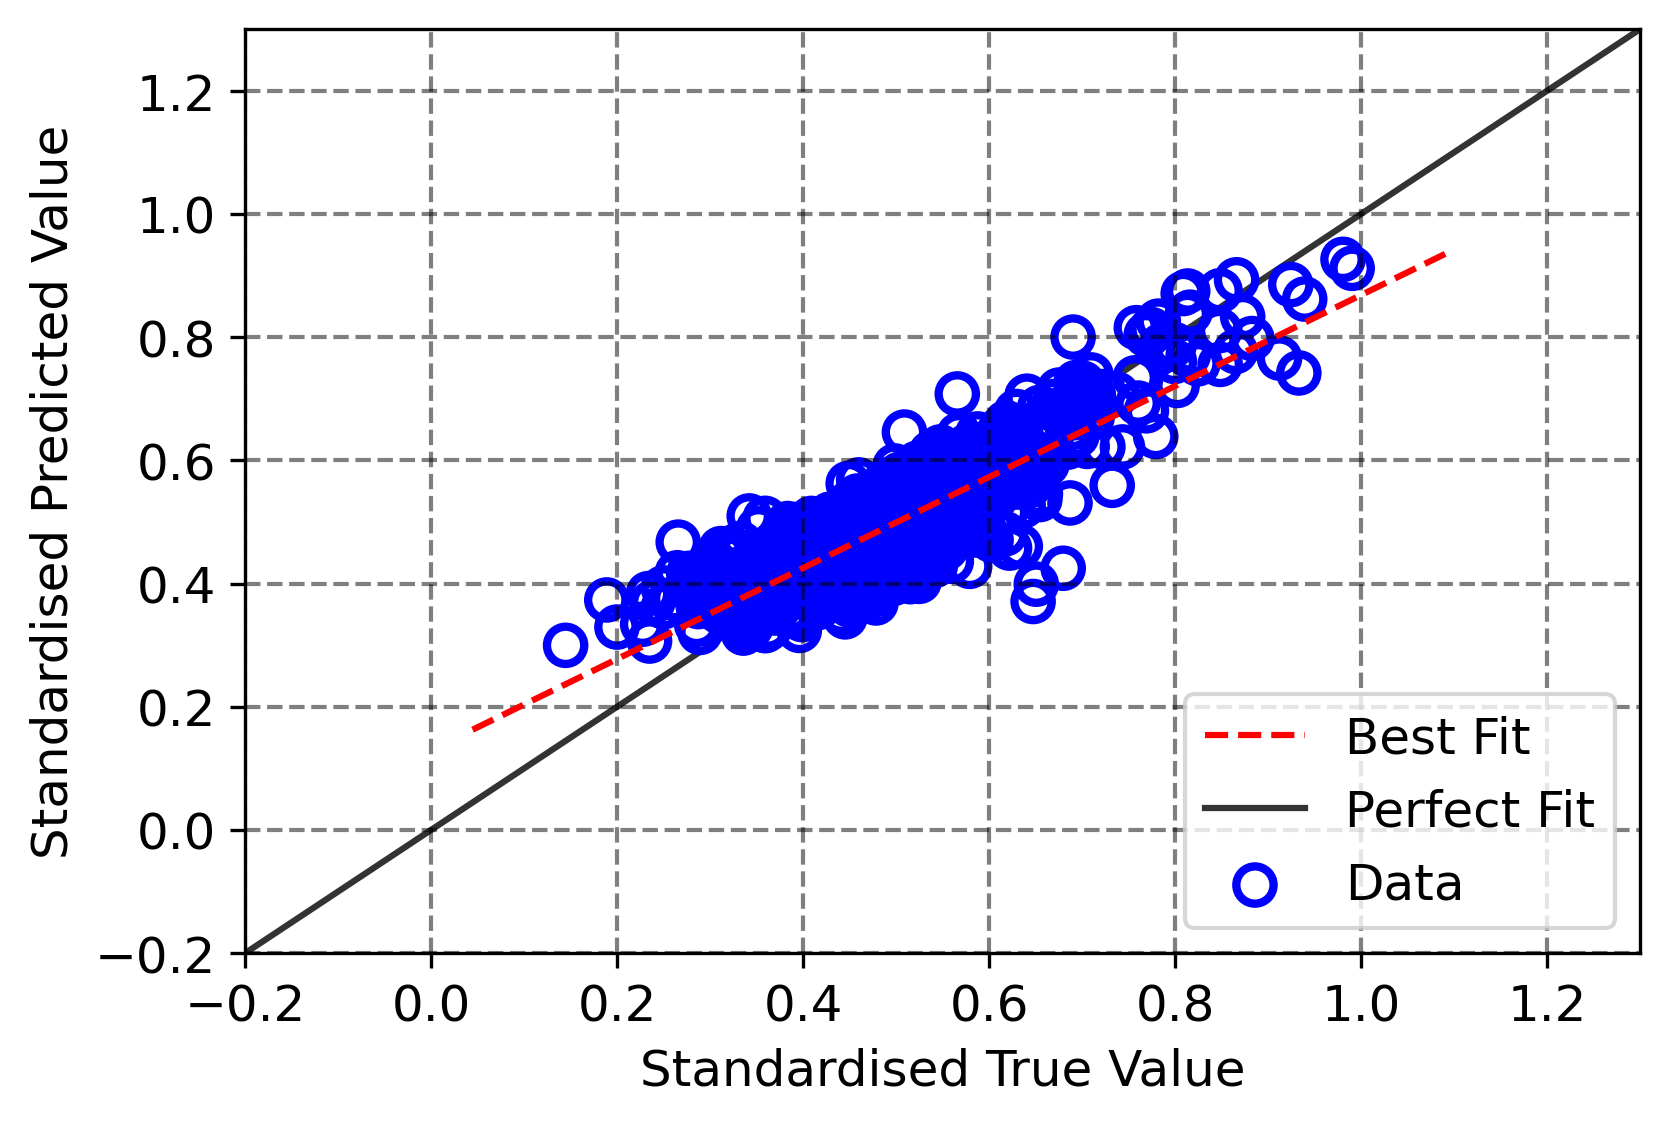
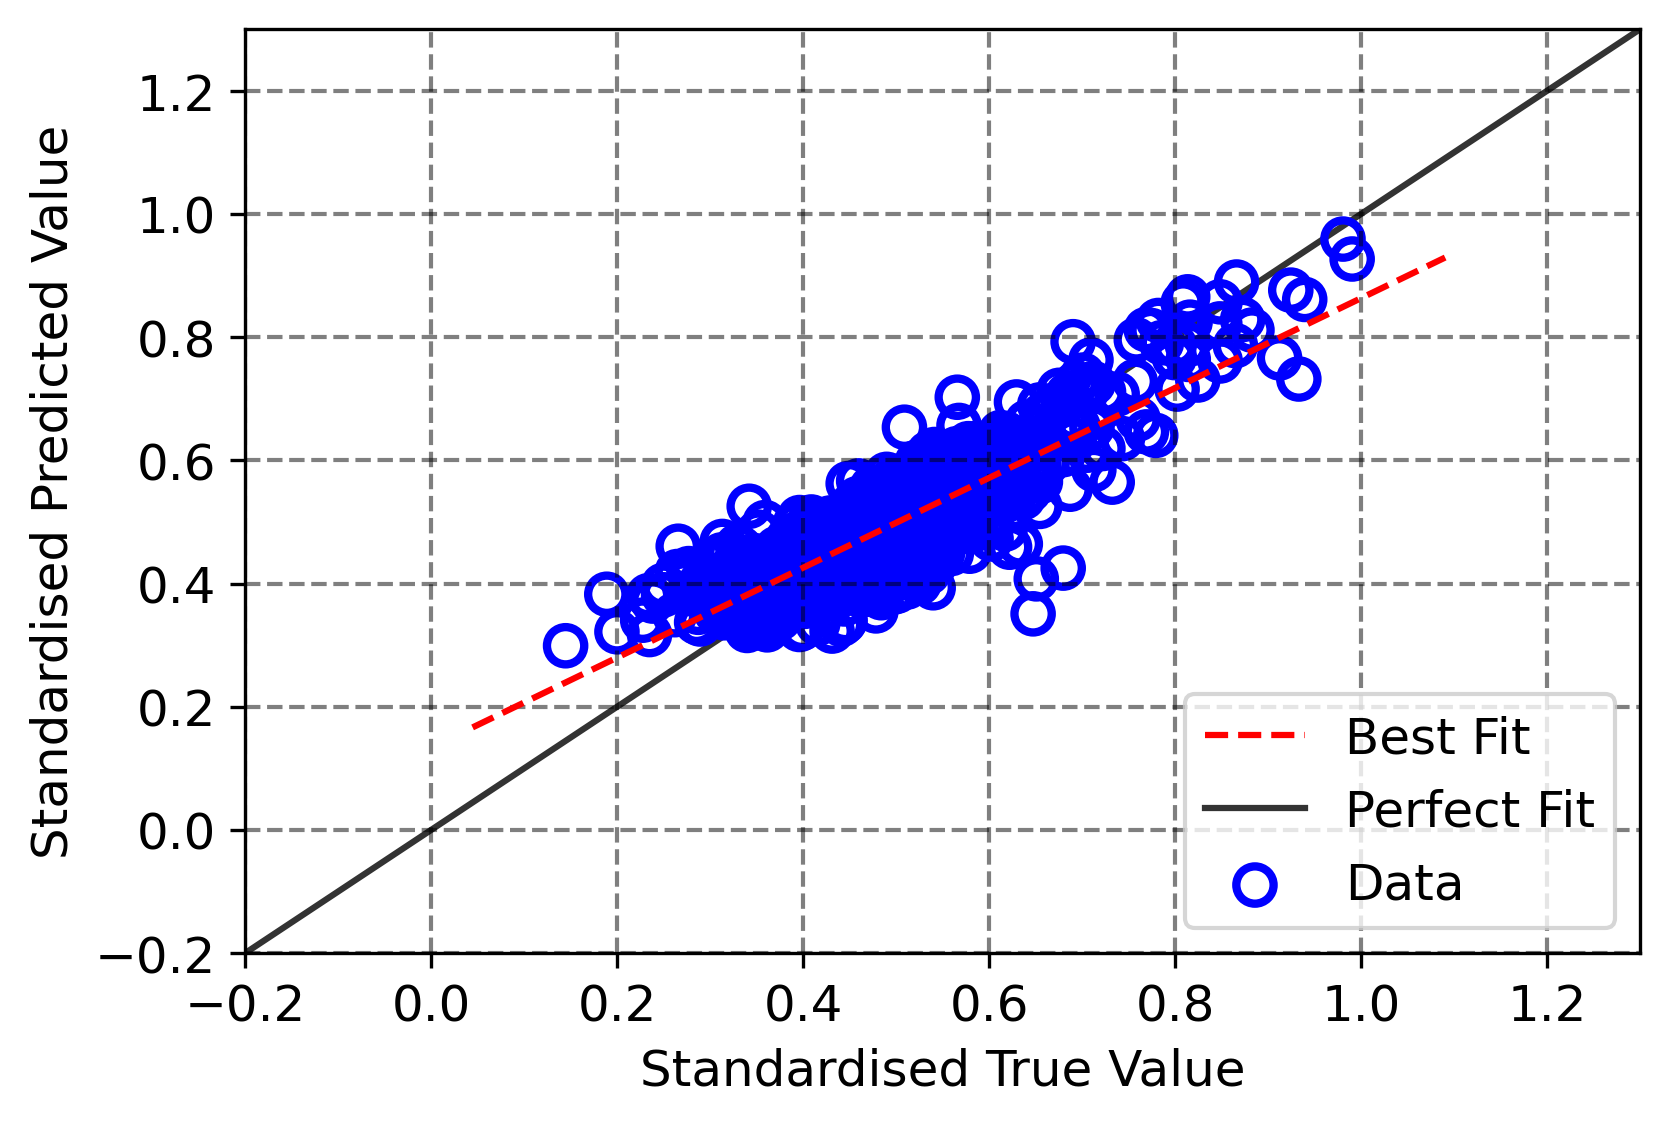
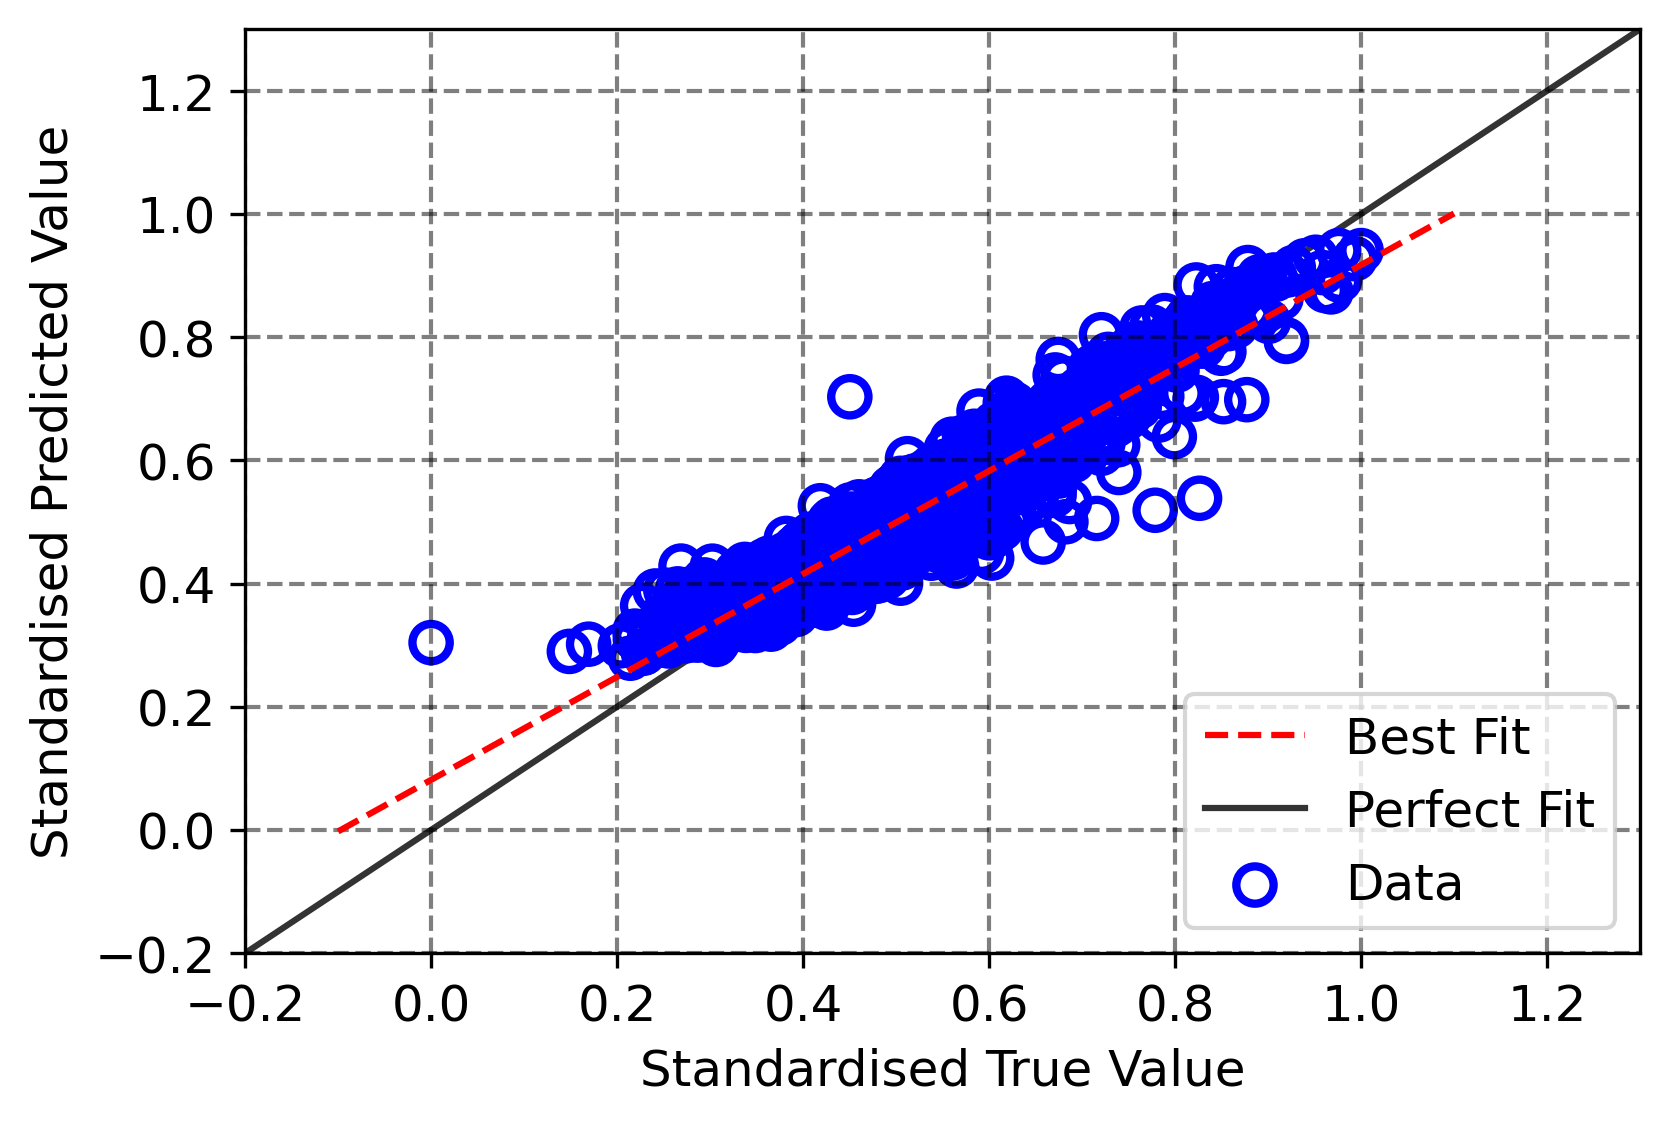
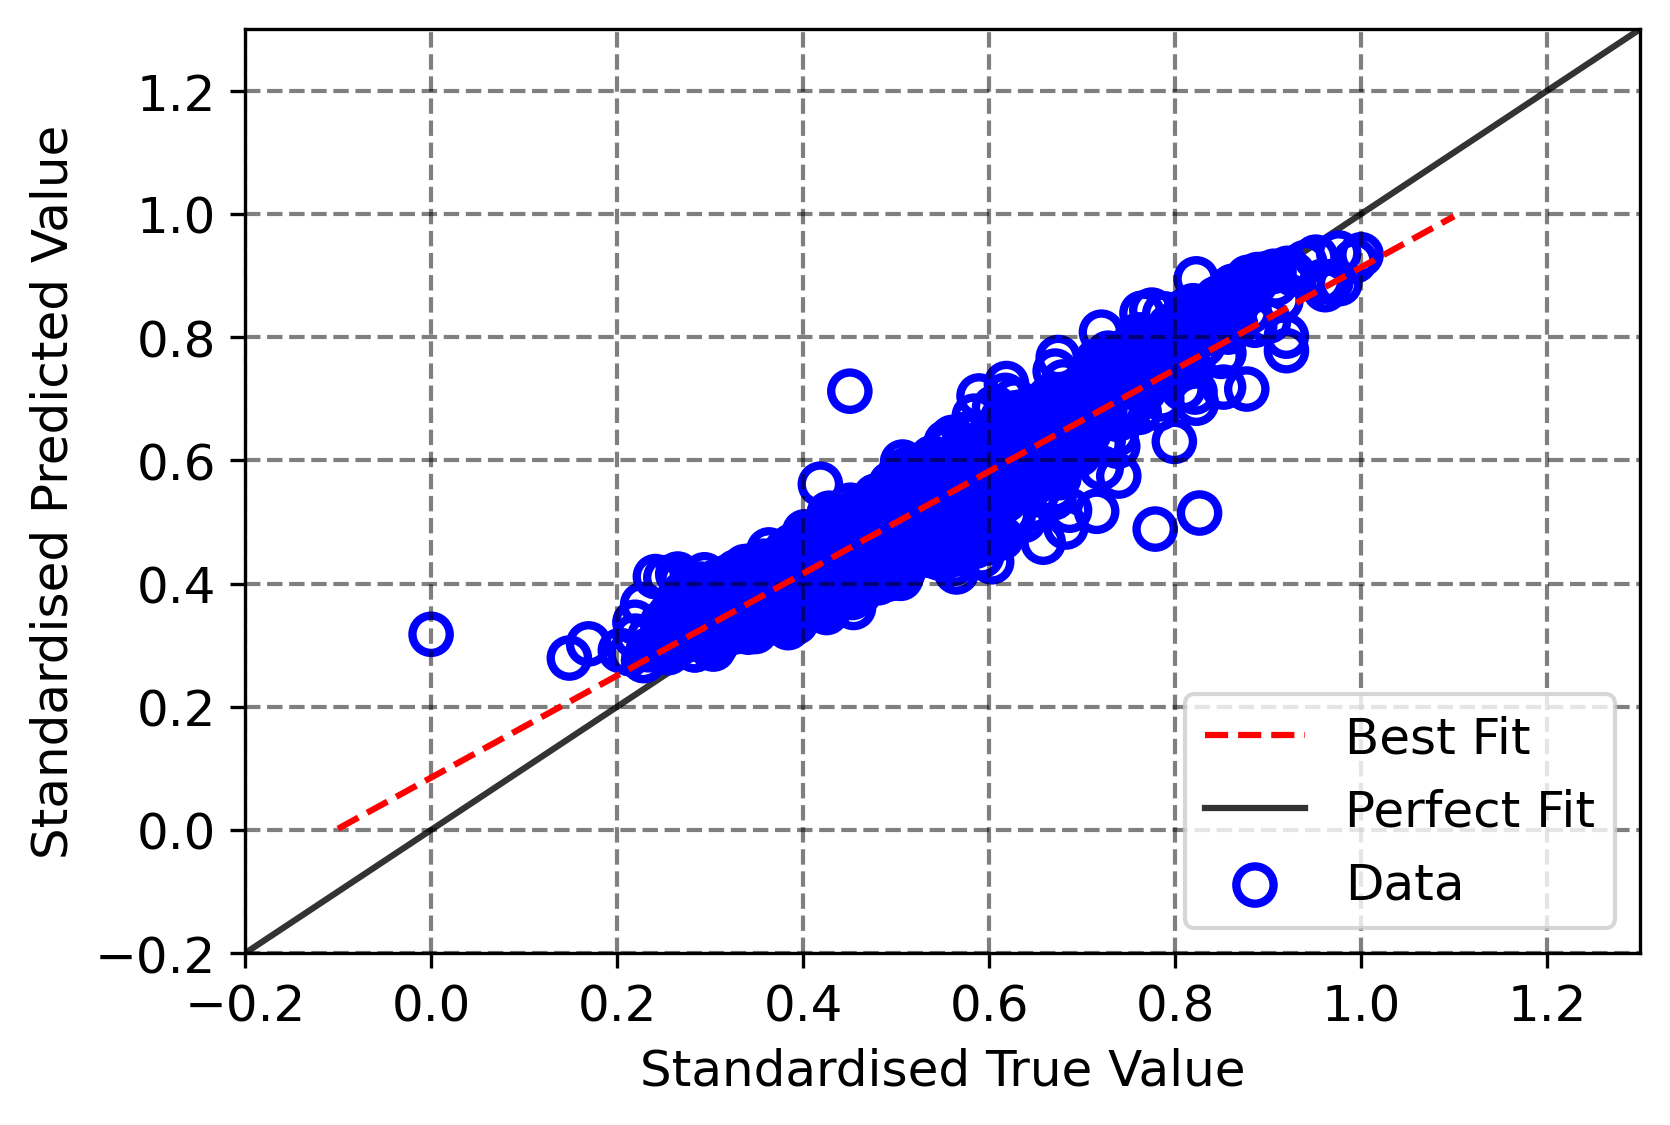
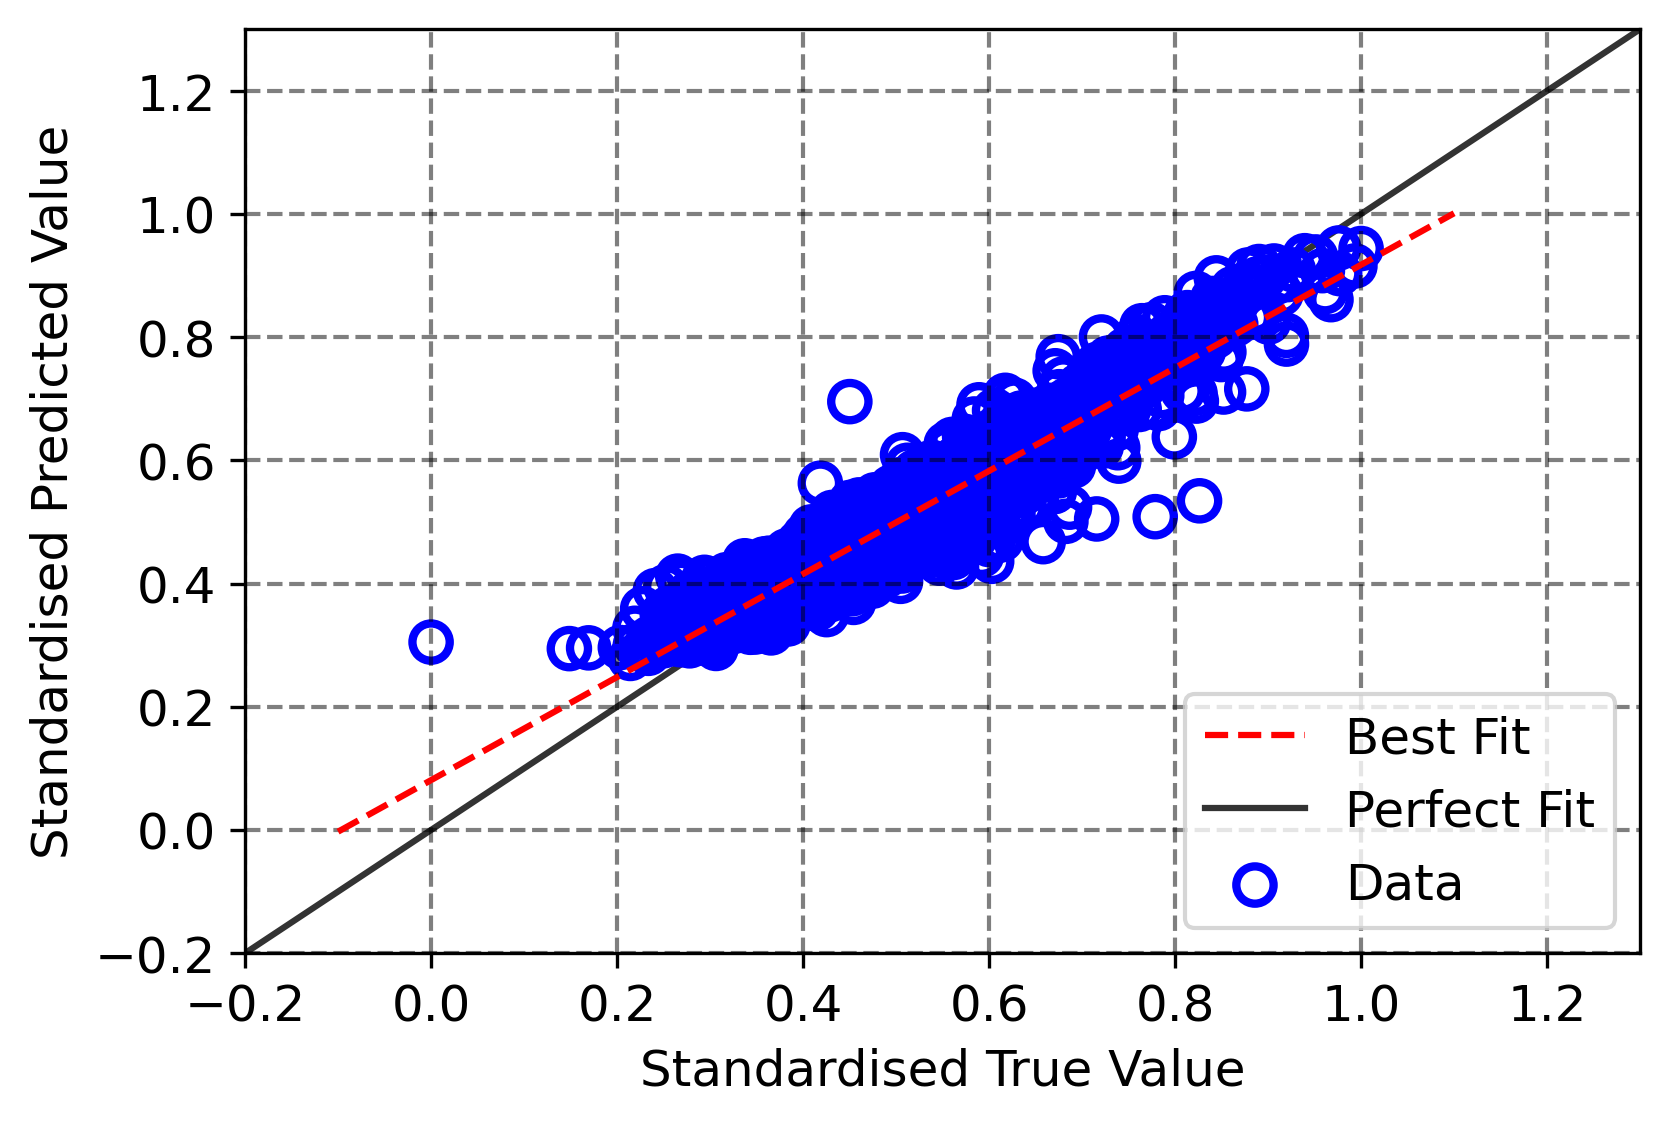
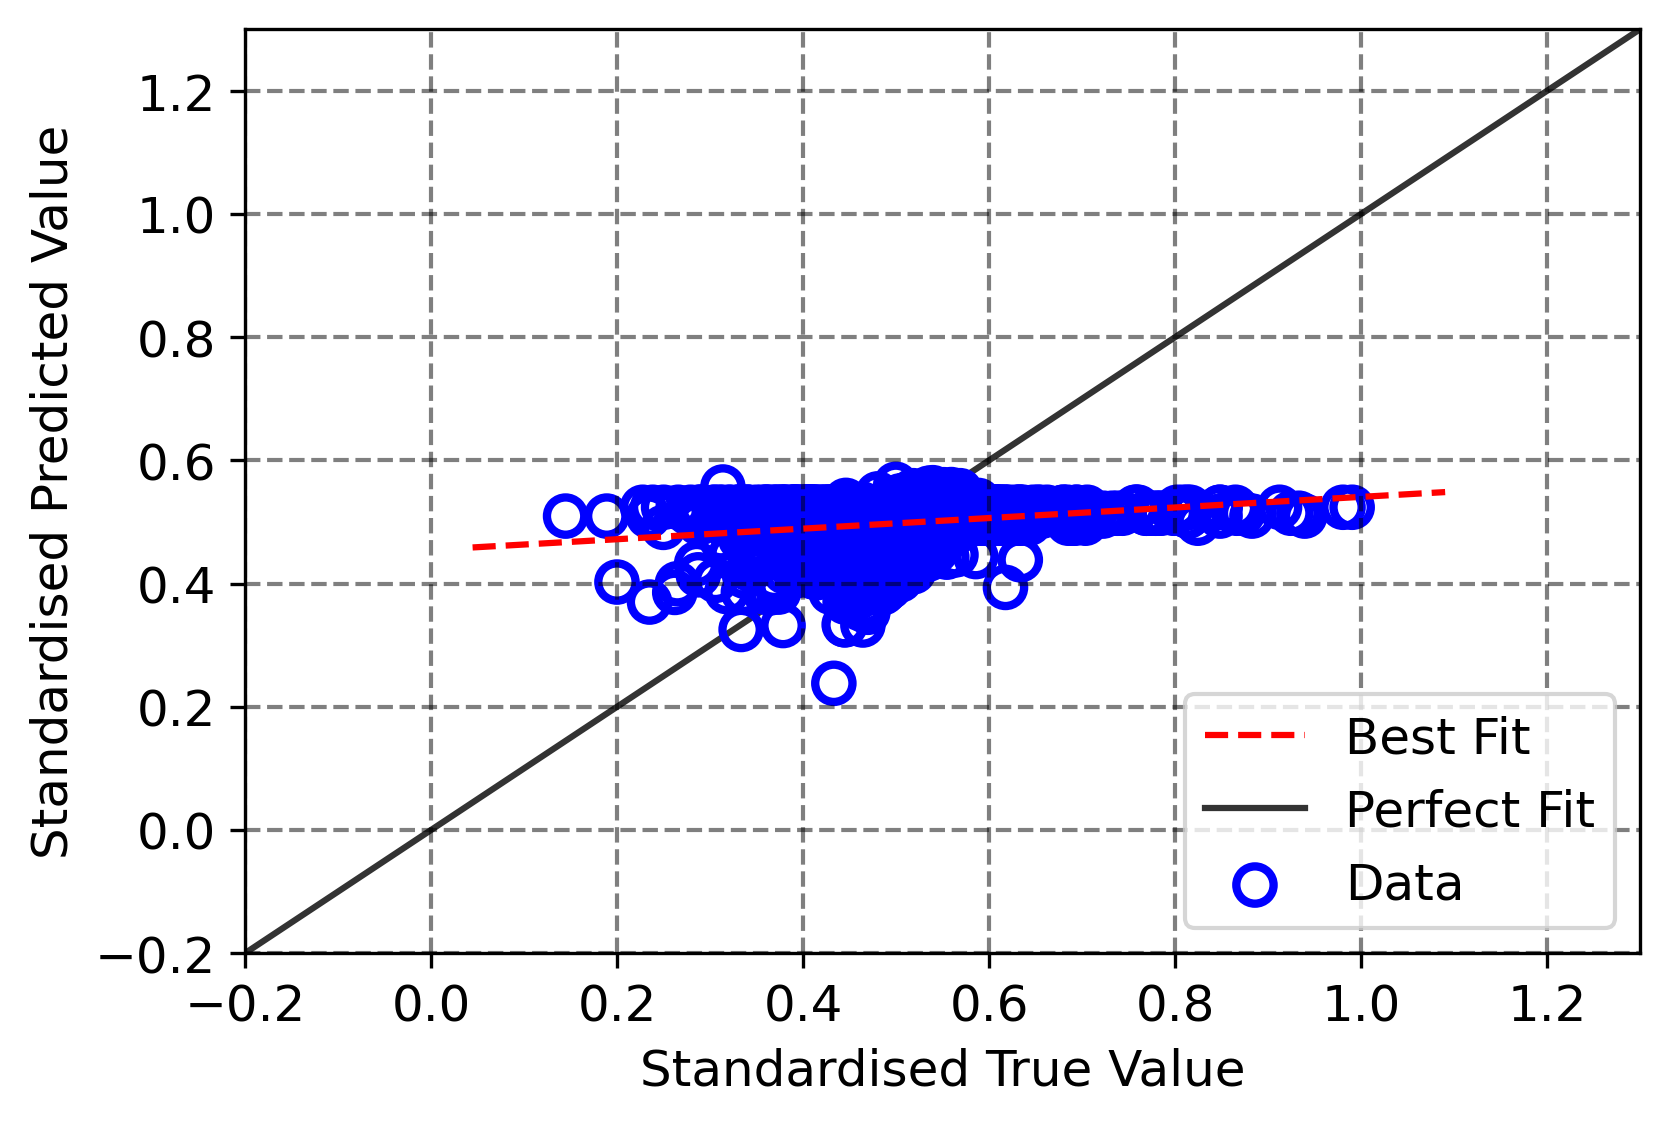
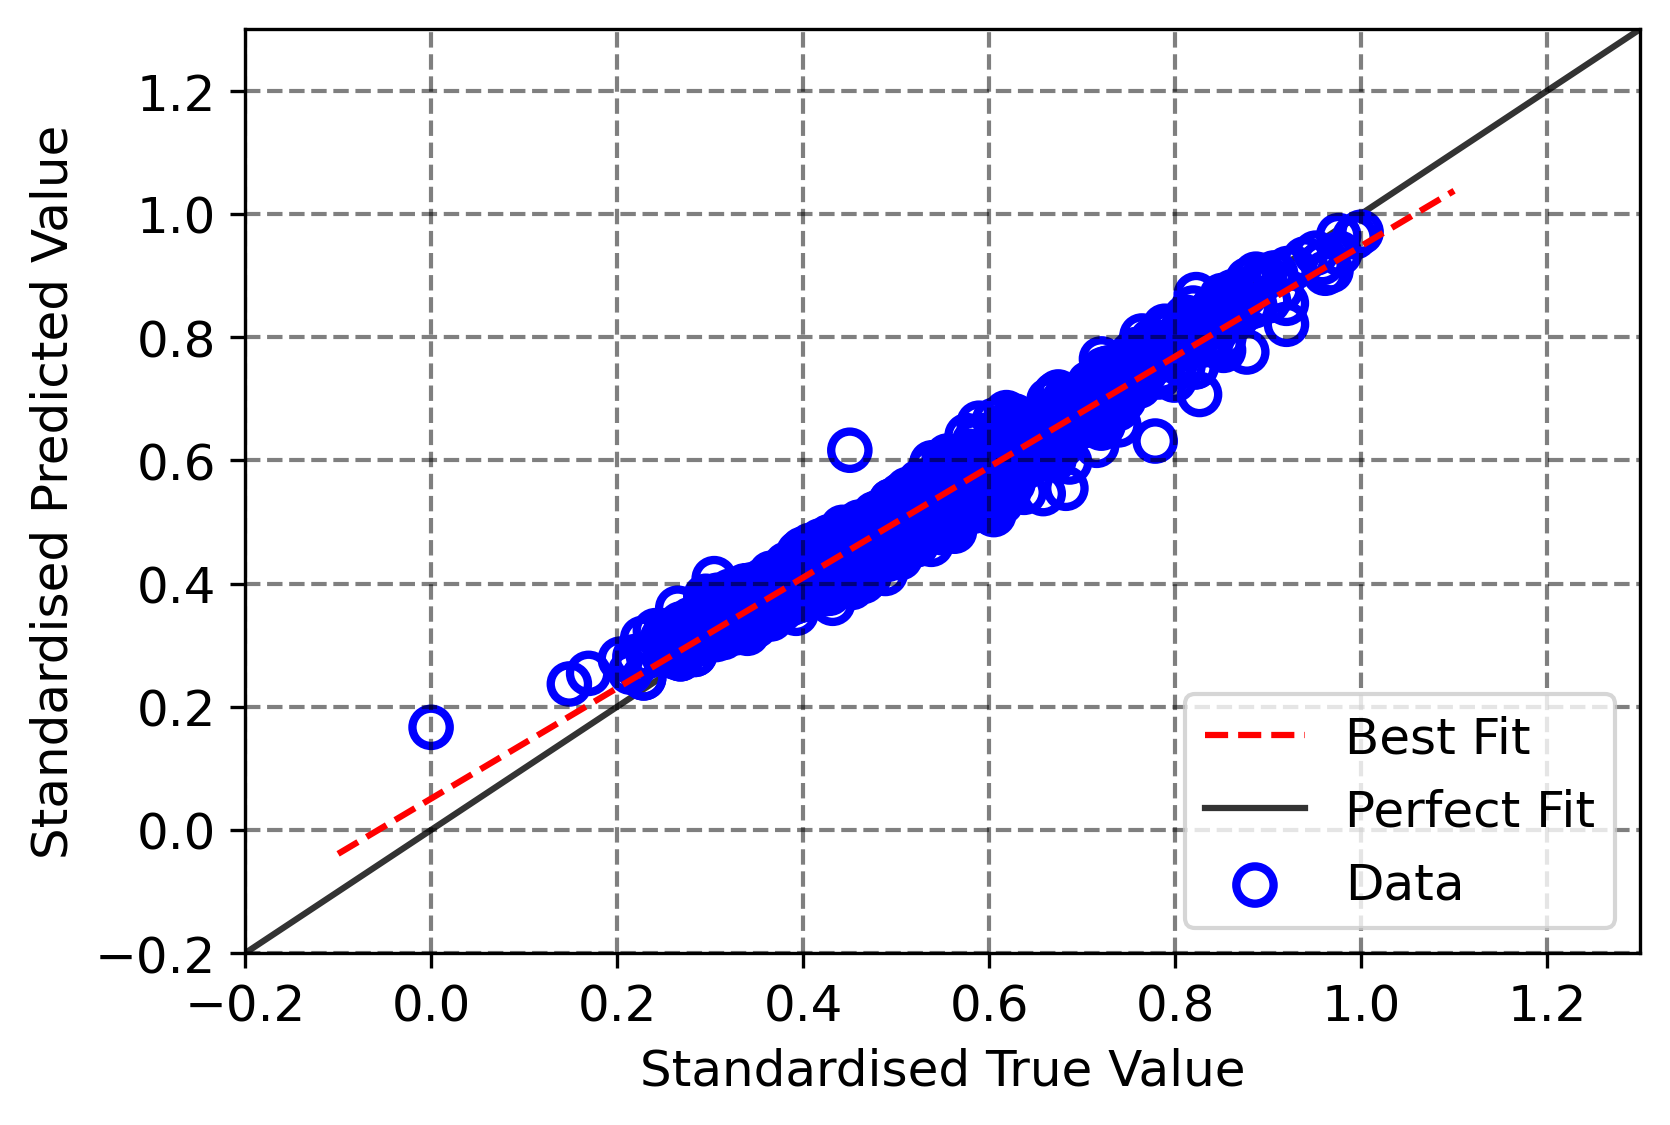
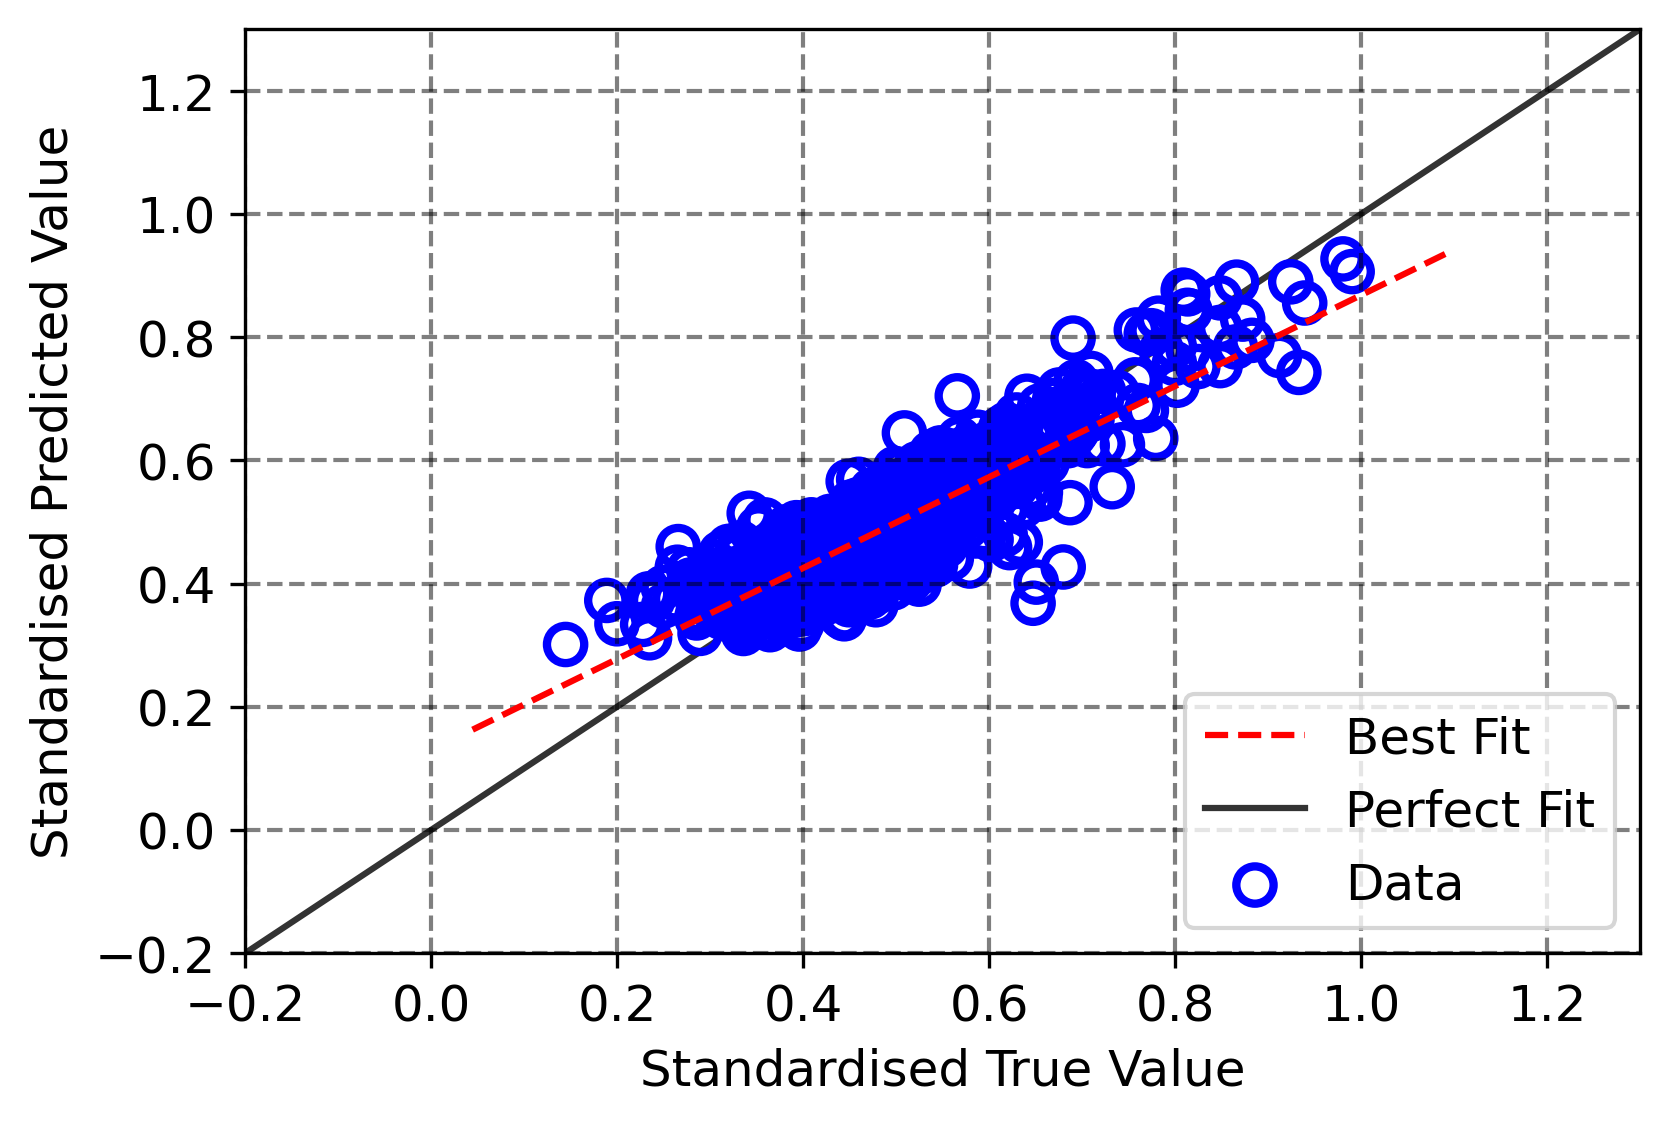
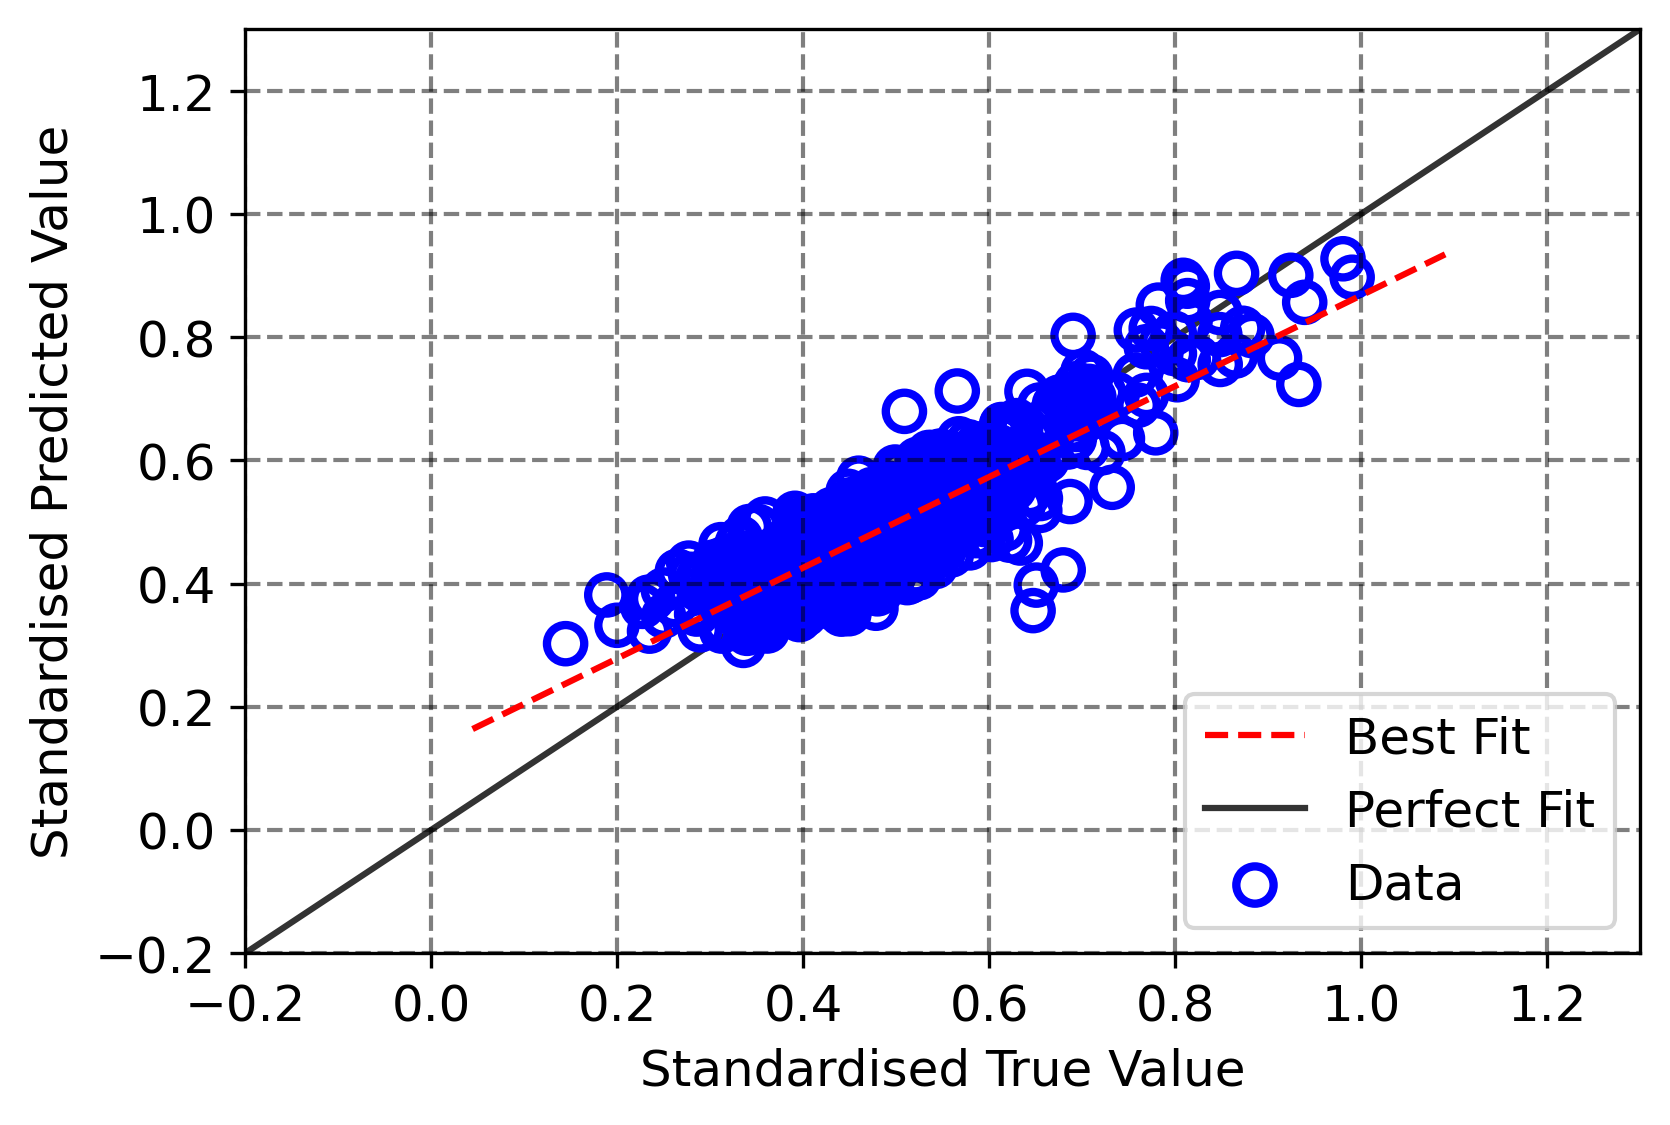
In the following example, we focus on feature-driven explanations, since feature importance is the most common explanation type (Nauta et al., 2023; Zhong et al., 2022; Gola et al., 2018; Pankajakshan et al., 2017; Roscher et al., 2020a). This case study is based on the characteristics of metallic nanoparticles generated using molecular dynamics simulations of the sintering and coarsening of palladium (Pd), gold (Au) and platinum (Pt) nanoparticles under different temperatures and atomic deposition rates(Li et al., 2022). Five feature sets were originally proposed based on domain knowledge, which can represent five different Scientist stakeholders with different as research goals, as summarized in Table 1. Using these feature sets we trained three ML models, including XGBoost, MLP, and RF, achieving similarly high performance (Chicco et al., 2021), as shown in the 45-degree plots in the Appendix (Li et al., 2022). More details can be found in the Appendix.
We extracted feature importance values from each ML models and normalized them to the same range. RF inherently provides feature importance; XGBoost calculates the averaged gain over all targets; and we compute connection weights from the trained MLP (Beck, 2018; Olden et al., 2004). We also applied SHAP, PI, and IG to the trained MLP and obtained their feature importance values. The rankings of features are shown in Fig. 5, where our emphasis lies on their rankings rather than their absolute values.
Conflicts from domain-driven perspective
In this case the domain-driven scenarios are referred to as Important, Controllable, Structural, Processing, and Experimental, refer described in (Li et al., 2022). Each scenario corresponds to a potential stakeholder, with different requirements in Table 1. For instance, an experimental materials scientist may be concerned with all features that can be controlled in the lab, while a material engineer care more about features specifically related to synthesis conditions. Each stakeholder prioritizes features based on their domain knowledge and requirements. To meet their expectations, one approach is to train an accurate model that takes into account only the features relevant to their specific requirements. We employed five feature-driven sets as inputs and trained the ML models separately to predict the formation energy. Four of them are fitted well using RFs, except for the experimental feature-driven set (where three features exist in the set), and the rankings of features are displayed in Fig. 6.
5 In Search of Consistency
Given all the ML and explanation methods, it is not obvious which type of explanation is preferable, and researchers generally select methods based on the purpose and completeness of the final explanation (Gilpin et al., 2018). We support this, but emphasize two fundamental aspects from a domain-driven perspective. While stakeholders are focused on either feature-driven or example-driven explanations (or both) depending on their specific requirements, we recommend exploring a set of equally good models, known as Rashomon sets, before extracting knowledge from explanations (Fisher et al., 2019; Rudin, 2019). A Rashomon set defines a collection of models that achieve similar performance (within a user-defined performance bound) on a given task, indicating a potential performance drop. Nonetheless, a certain level of opaqueness is acceptable (London, 2019).
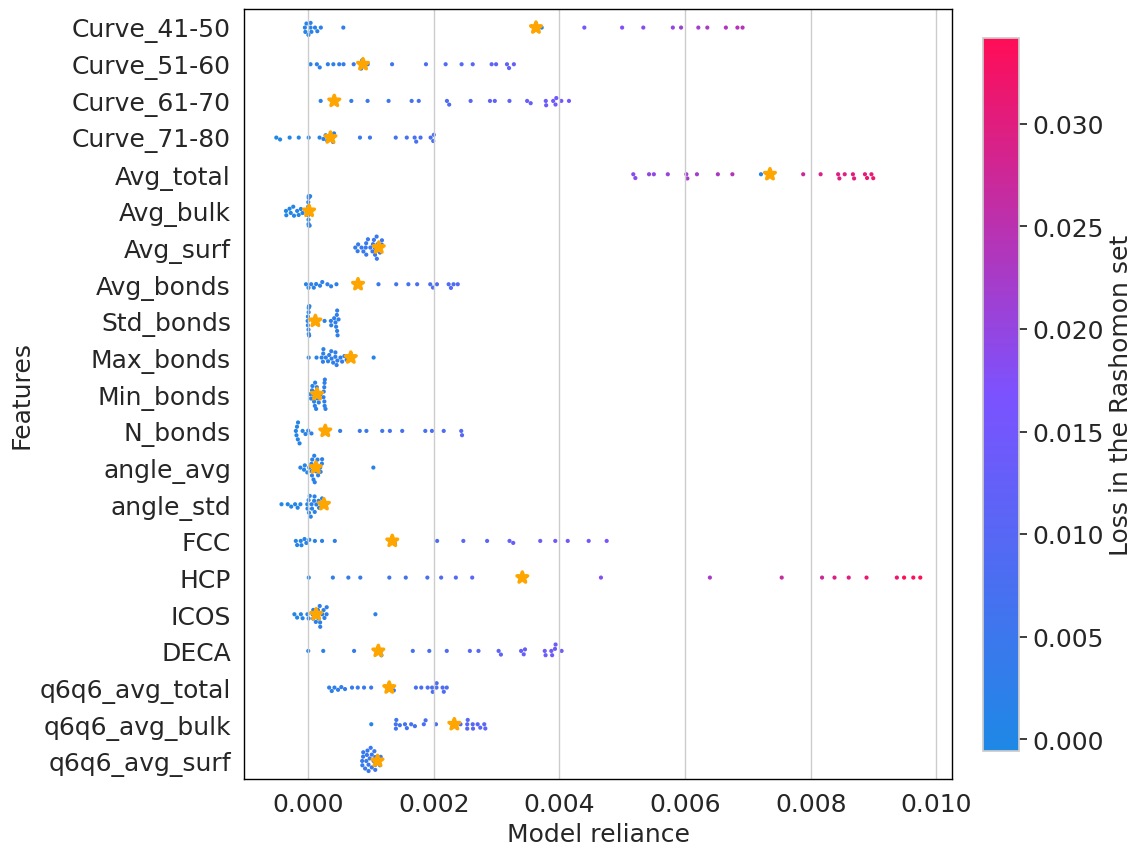
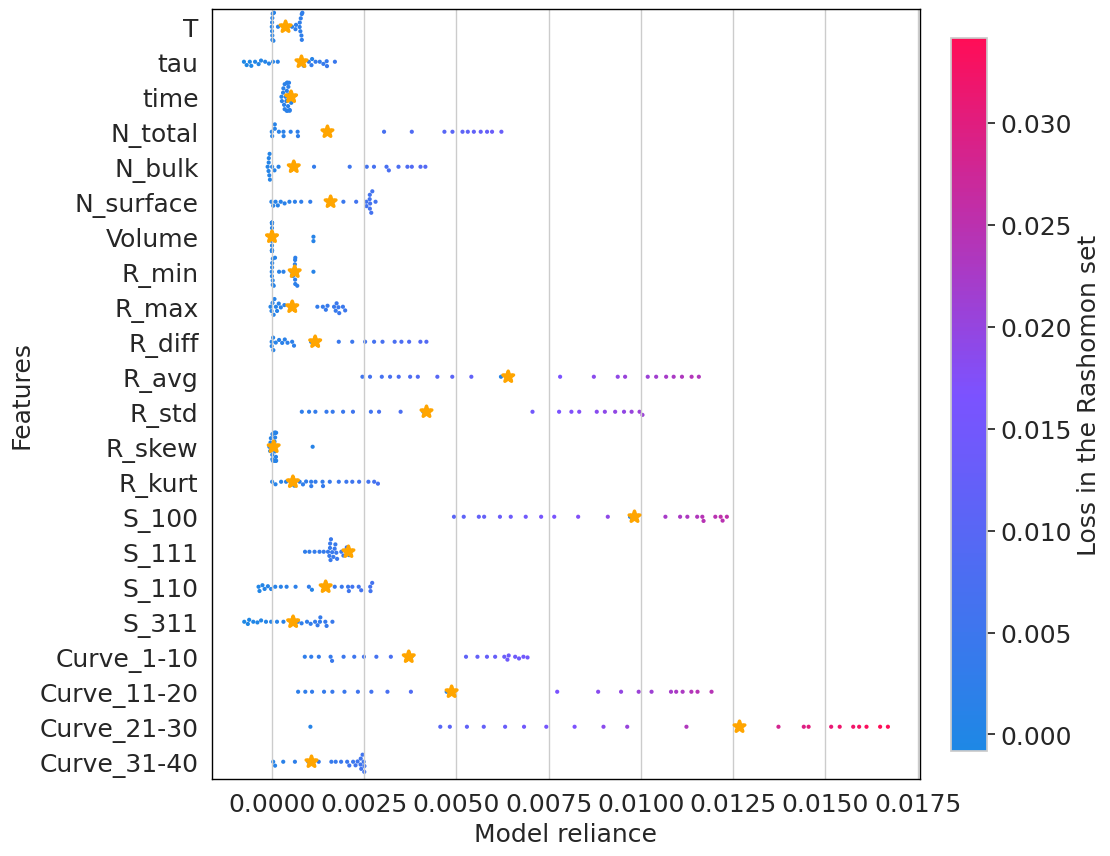
As a consequence, a set of models provides a feature importance range instead of a single value, offering stakeholders a greater chance to identify an accurate model with targeted explanations that match domain knowledge. Hsu (Hsu & Calmon, 2022) attempted to solve predictive multiplicity using this concept, potentially solving conflicts from an example-driven perspective, and most Rashomon-related discussions are from feature-driven explanations (Li et al., 2023; Xin et al., 2022; Dong & Rudin, 2020). Recent applications of this concept include predicting survival among hemophagocytic lymphohistiocytosis (HLH) patients in healthcare and predicting the energy storage potentials of early transition metal carbides with two-dimensional (2D) structures in materials science (Li & Barnard, 2023b; Kobylińska et al., 2023). In the task discussed in Sec. 4.2, we explored a set of models using the approach proposed in (Li et al., 2023). The results are partially presented in Fig. 8, where potential stakeholders can easily identify a model that relies more on the feature HCP (indicating twinned nanoparticles that are mechanically harder).
6 Conclusion
In this position paper, we identified the main reasons for inconsistency from data-driven and domain-driven perspectives, which hinder the potential impact of ML in many areas of science. Rather than relying on a single model, we advocate for the exploration of a set of well-performing models to gain a more comprehensive understanding of a specific task before decision-making. A Rashomon set can provide a space of explanations, with more opportunity to find combinations that are consistent with domain knowledge and more useful to scientists. It is important to note that a rigorous evaluation of a Rashomon set is still under development and further research is needed to study and understand their utility to the field of XAI.
Impact Statements
This position paper presents a perspective for advancing the application of XAI in scientific domains. The issues raised and framework proposed increase the understanding of domain scientists as to the reasons for inconsistencies between their domain knowledge and intuition, and the outcomes of machine learning; and increased the understanding of machine learning experts as to the motivations and constraints imposed by different science applications. Better two-way understanding will improve communication and lead to more effective machine learning models to solve important science challenges. Our position paper therefore supports more effective collaboration as well has highlighting opportunities for future research.
References
- Adadi & Berrada (2018) Adadi, A. and Berrada, M. Peeking Inside the Black-Box: A Survey on Explainable Artificial Intelligence (XAI). IEEE Access, 6:52138–52160, 2018. doi: 10.1109/ACCESS.2018.2870052.
- Barnard & Opletal (2019) Barnard, A. and Opletal, G. Gold Nanoparticle Data Set. v1. CSIRO. Data Collection., 2019. doi: 10.25919/5d395ef9a4291.
- Barnard & Opletal (2023) Barnard, A. and Opletal, G. Palladium Nanoparticle Data Set. v2. CSIRO. Data Collection., 2023. doi: 10.25919/epxd-8p61.
- Barnard et al. (2018) Barnard, A., Sun, B., and Opletal, G. Platinum Nanoparticle Data Set. v2. CSIRO. Data Collection., 2018. doi: 10.25919/5d3958d9bf5f7.
- Barnard (2022) Barnard, A. S. Explainable prediction of N-V-related defects in nanodiamond using neural networks and Shapley values. Cell Reports Physical Science, 3(1):100696, 2022. ISSN 2666-3864. doi: 10.1016/j.xcrp.2021.100696.
- Barnard & Fox (2023) Barnard, A. S. and Fox, B. L. Importance of Structural Features and the Influence of Individual Structures of Graphene Oxide Using Shapley Value Analysis. Chemistry of Materials, 35(21):8840–8856, 2023. doi: 10.1021/acs.chemmater.3c00715.
- Beck (2018) Beck, M. W. NeuralNetTools: Visualization and analysis tools for neural networks. Journal of statistical software, 85(11):1, 2018. doi: 10.18637/jss.v085.i11.
- Breiman (2001) Breiman, L. Random forests. Machine learning, 45:5–32, 2001. doi: 10.1023/A:1010933404324.
- Carvalho et al. (2022) Carvalho, R. P., Marchiori, C. F., Brandell, D., and Araujo, C. M. Artificial intelligence driven in-silico discovery of novel organic lithium-ion battery cathodes. Energy storage materials, 44:313–325, 2022. doi: 10.1016/j.ensm.2021.10.029.
- Chen et al. (2018) Chen, C., Lin, K., Rudin, C., Shaposhnik, Y., Wang, S., and Wang, T. An interpretable model with globally consistent explanations for credit risk. arXiv preprint arXiv:1811.12615, 2018.
- Chicco et al. (2021) Chicco, D., Warrens, M. J., and Jurman, G. The coefficient of determination R-squared is more informative than SMAPE, MAE, MAPE, MSE and RMSE in regression analysis evaluation. PeerJ Computer Science, 7:e623, 2021. doi: 10.7717/peerj-cs.623.
- Crabbé & van der Schaar (2022) Crabbé, J. and van der Schaar, M. Concept activation regions: A generalized framework for concept-based explanations. Advances in Neural Information Processing Systems, 35:2590–2607, 2022.
- Crabbé et al. (2021) Crabbé, J., Qian, Z., Imrie, F., and van der Schaar, M. Explaining latent representations with a corpus of examples. Advances in Neural Information Processing Systems, 34:12154–12166, 2021.
- Dong & Rudin (2020) Dong, J. and Rudin, C. Exploring the cloud of variable importance for the set of all good models. Nature Machine Intelligence, 2(12):810–824, 2020.
- Doshi-Velez & Kim (2017) Doshi-Velez, F. and Kim, B. Towards a rigorous science of interpretable machine learning. arXiv preprint arXiv:1702.08608, 2017.
- Ehsan et al. (2021) Ehsan, U., Liao, Q. V., Muller, M., Riedl, M. O., and Weisz, J. D. Expanding explainability: Towards Social Transparency in AI Systems. In Proceedings of the 2021 CHI Conference on Human Factors in Computing Systems, pp. 1–19, 2021.
- Fisher et al. (2019) Fisher, A., Rudin, C., and Dominici, F. All models are wrong, but many are useful: Learning a variable’s importance by studying an entire class of prediction models simultaneously. J. Mach. Learn. Res., 20(177):1–81, 2019.
- Freitas (2014) Freitas, A. A. Comprehensible classification models: a position paper. ACM SIGKDD explorations newsletter, 15(1):1–10, 2014. doi: 10.1145/2594473.2594475.
- Ghorbani et al. (2019) Ghorbani, A., Wexler, J., Zou, J. Y., and Kim, B. Towards automatic concept-based explanations. Advances in neural information processing systems, 32, 2019.
- Gilpin et al. (2018) Gilpin, L. H., Bau, D., Yuan, B. Z., Bajwa, A., Specter, M., and Kagal, L. Explaining explanations: An overview of interpretability of machine learning. In 2018 IEEE 5th International Conference on data science and advanced analytics (DSAA), pp. 80–89. IEEE, 2018.
- Gohel et al. (2021) Gohel, P., Singh, P., and Mohanty, M. Explainable AI: current status and future directions. arXiv preprint arXiv:2107.07045, 2021.
- Gola et al. (2018) Gola, J., Britz, D., Staudt, T., Winter, M., Schneider, A. S., Ludovici, M., and Mücklich, F. Advanced microstructure classification by data mining methods. Computational Materials Science, 148:324–335, 2018. doi: 10.1016/j.commatsci.2018.03.004.
- Guidotti et al. (2018) Guidotti, R., Monreale, A., Ruggieri, S., Turini, F., Giannotti, F., and Pedreschi, D. A survey of methods for explaining black box models. ACM computing surveys (CSUR), 51(5):1–42, 2018.
- Gunning (2017) Gunning, D. Explainable artificial intelligence (xai). Defense advanced research projects agency (DARPA), nd Web, 2(2):1, 2017.
- Hsu & Calmon (2022) Hsu, H. and Calmon, F. Rashomon Capacity: A Metric for Predictive Multiplicity in Classification. Advances in Neural Information Processing Systems, 35:28988–29000, 2022.
- Huang et al. (2023) Huang, W., Suominen, H., Liu, T., Rice, G., Salomon, C., and Barnard, A. S. Explainable discovery of disease biomarkers: The case of ovarian cancer to illustrate the best practice in machine learning and Shapley analysis. Journal of Biomedical Informatics, 141:104365, 2023.
- Imrie et al. (2023) Imrie, F., Davis, R., and van der Schaar, M. Multiple stakeholders drive diverse interpretability requirements for machine learning in healthcare. Nature Machine Intelligence, 5(8):824–829, 2023.
- Janizek et al. (2021) Janizek, J. D., Sturmfels, P., and Lee, S.-I. Explaining explanations: Axiomatic feature interactions for deep networks. The Journal of Machine Learning Research, 22(1):4687–4740, 2021.
- Jiménez-Luna et al. (2020) Jiménez-Luna, J., Grisoni, F., and Schneider, G. Drug discovery with explainable artificial intelligence. Nature Machine Intelligence, 2(10):573–584, 2020.
- Kailkhura et al. (2019) Kailkhura, B., Gallagher, B., Kim, S., Hiszpanski, A., and Han, T. Y.-J. Reliable and explainable machine-learning methods for accelerated material discovery. npj Computational Materials, 5(1):108, 2019. doi: 10.1038/s41524-019-0248-2.
- Karpatne et al. (2017) Karpatne, A., Atluri, G., Faghmous, J. H., Steinbach, M., Banerjee, A., Ganguly, A., Shekhar, S., Samatova, N., and Kumar, V. Theory-guided data science: A new paradigm for scientific discovery from data. IEEE Transactions on knowledge and data engineering, 29(10):2318–2331, 2017.
- Kim et al. (2016) Kim, B., Khanna, R., and Koyejo, O. O. Examples are not enough, learn to criticize! criticism for interpretability. Advances in neural information processing systems, 29, 2016.
- Kobylińska et al. (2023) Kobylińska, K., Krzyziński, M., Machowicz, R., Adamek, M., and Biecek, P. Exploration of the Rashomon Set Assists Trustworthy Explanations for Medical Data. arXiv e-prints, pp. arXiv–2308, 2023.
- Li et al. (2016) Li, L., Snyder, J. C., Pelaschier, I. M., Huang, J., Niranjan, U.-N., Duncan, P., Rupp, M., Müller, K.-R., and Burke, K. Understanding machine-learned density functionals. International Journal of Quantum Chemistry, 116(11):819–833, 2016.
- Li & Barnard (2023a) Li, S. and Barnard, A. Variance Tolerance Factors For Interpreting All Neural Networks. In 2023 International Joint Conference on Neural Networks (IJCNN), pp. 1–9, 2023a. doi: 10.1109/IJCNN54540.2023.10191646.
- Li & Barnard (2023b) Li, S. and Barnard, A. S. Multi-target neural network predictions of MXenes as high-capacity energy storage materials in a Rashomon set. Cell Reports Physical Science, 4(11), 2023b.
- Li et al. (2022) Li, S., Ting, J. Y., and Barnard, A. S. The impact of domain-driven and data-driven feature selection on the inverse design of nanoparticle catalysts. Journal of Computational Science, 65:101896, 2022.
- Li et al. (2023) Li, S., Wang, R., Deng, Q., and Barnard, A. Exploring the cloud of feature interaction scores in a Rashomon set. arXiv preprint arXiv:2305.10181, 2023.
- Linardatos et al. (2020) Linardatos, P., Papastefanopoulos, V., and Kotsiantis, S. Explainable ai: A review of machine learning interpretability methods. Entropy, 23(1):18, 2020.
- Lipton (2018) Lipton, Z. C. The mythos of model interpretability: In machine learning, the concept of interpretability is both important and slippery. Queue, 16(3):31–57, 2018.
- London (2019) London, A. J. Artificial intelligence and black-box medical decisions: accuracy versus explainability. Hastings Center Report, 49(1):15–21, 2019.
- Loveland et al. (2021) Loveland, D., Liu, S., Kailkhura, B., Hiszpanski, A., and Han, Y. Reliable graph neural network explanations through adversarial training. arXiv preprint arXiv:2106.13427, 2021. doi: 10.48550/arXiv.2106.13427.
- Lundberg & Lee (2017) Lundberg, S. M. and Lee, S.-I. A unified approach to interpreting model predictions. Advances in neural information processing systems, 30, 2017.
- Miller (2019) Miller, T. Explanation in artificial intelligence: Insights from the social sciences. Artificial intelligence, 267:1–38, 2019. doi: 10.1016/j.artint.2018.07.007.
- Miller (2023) Miller, T. Explainable AI is Dead, Long Live Explainable AI! Hypothesis-driven Decision Support using Evaluative AI. In Proceedings of the 2023 ACM Conference on Fairness, Accountability, and Transparency, pp. 333–342, 2023.
- Molnar (2022) Molnar, C. Interpretable Machine Learning. 2 edition, 2022. URL https://christophm.github.io/interpretable-ml-book.
- Nauta et al. (2023) Nauta, M., Trienes, J., Pathak, S., Nguyen, E., Peters, M., Schmitt, Y., Schlötterer, J., van Keulen, M., and Seifert, C. From Anecdotal Evidence to Quantitative Evaluation Methods: A Systematic Review on Evaluating Explainable AI. ACM Computing Surveys, 55(13s):1–42, 2023. doi: 10.1145/3583558.
- Olden et al. (2004) Olden, J. D., Joy, M. K., and Death, R. G. An accurate comparison of methods for quantifying variable importance in artificial neural networks using simulated data. Ecological modelling, 178(3-4):389–397, 2004. doi: 10.1016/j.ecolmodel.2004.03.013.
- Pankajakshan et al. (2017) Pankajakshan, P., Sanyal, S., de Noord, O. E., Bhattacharya, I., Bhattacharyya, A., and Waghmare, U. Machine learning and statistical analysis for materials science: stability and transferability of fingerprint descriptors and chemical insights. Chemistry of Materials, 29(10):4190–4201, 2017. doi: 10.1021/acs.chemmater.6b04229.
- Pedregosa et al. (2011) Pedregosa, F., Varoquaux, G., Gramfort, A., Michel, V., Thirion, B., Grisel, O., Blondel, M., Prettenhofer, P., Weiss, R., Dubourg, V., Vanderplas, J., Passos, A., Cournapeau, D., Brucher, M., Perrot, M., and Duchesnay, E. Scikit-learn: Machine learning in Python. Journal of Machine Learning Research, 12:2825–2830, 2011.
- Reichstein et al. (2019) Reichstein, M., Camps-Valls, G., Stevens, B., Jung, M., Denzler, J., Carvalhais, N., and Prabhat, f. Deep learning and process understanding for data-driven Earth system science. Nature, 566(7743):195–204, 2019.
- Ribeiro et al. (2016a) Ribeiro, M. T., Singh, S., and Guestrin, C. Model-agnostic interpretability of machine learning. arXiv preprint arXiv:1606.05386, 2016a.
- Ribeiro et al. (2016b) Ribeiro, M. T., Singh, S., and Guestrin, C. ” why should i trust you?” Explaining the predictions of any classifier. In Proceedings of the 22nd ACM SIGKDD international conference on knowledge discovery and data mining, pp. 1135–1144, 2016b.
- Roscher et al. (2020a) Roscher, R., Bohn, B., Duarte, M. F., and Garcke, J. Explainable Machine Learning for Scientific Insights and Discoveries. IEEE Access, 8:42200–42216, 2020a. doi: 10.1109/ACCESS.2020.2976199.
- Roscher et al. (2020b) Roscher, R., Bohn, B., Duarte, M. F., and Garcke, J. Explainable machine learning for scientific insights and discoveries. Ieee Access, 8:42200–42216, 2020b.
- Rudin (2019) Rudin, C. Stop explaining black box machine learning models for high stakes decisions and use interpretable models instead. Nature machine intelligence, 1(5):206–215, 2019. doi: 10.1038/s42256-019-0048-x.
- Sundararajan et al. (2017) Sundararajan, M., Taly, A., and Yan, Q. Axiomatic Attribution for Deep Networks. In Precup, D. and Teh, Y. W. (eds.), Proceedings of the 34th International Conference on Machine Learning, volume 70 of Proceedings of Machine Learning Research, pp. 3319–3328. PMLR, 06–11 Aug 2017. URL https://proceedings.mlr.press/v70/sundararajan17a.html.
- Thiyagalingam et al. (2022) Thiyagalingam, J., Shankar, M., Fox, G., and Hey, T. Scientific machine learning benchmarks. Nature Reviews Physics, 4(6):413–420, 2022.
- Ting et al. (2024) Ting, J. Y. C., Wood, A. T. A., and Barnard, A. S. Sphractal: Estimating the Fractal Dimension of Surfaces Computed from Precise Atomic Coordinates via Box-Counting Algorithm, 2024.
- Varshney & Alemzadeh (2017) Varshney, K. R. and Alemzadeh, H. On the safety of machine learning: Cyber-physical systems, decision sciences, and data products. Big data, 5(3):246–255, 2017.
- Von Rueden et al. (2021) Von Rueden, L., Mayer, S., Beckh, K., Georgiev, B., Giesselbach, S., Heese, R., Kirsch, B., Pfrommer, J., Pick, A., Ramamurthy, R., et al. Informed machine learning–a taxonomy and survey of integrating prior knowledge into learning systems. IEEE Transactions on Knowledge and Data Engineering, 35(1):614–633, 2021.
- Wiens & Shenoy (2018) Wiens, J. and Shenoy, E. S. Machine learning for healthcare: on the verge of a major shift in healthcare epidemiology. Clinical infectious diseases, 66(1):149–153, 2018.
- Wolberg et al. (1995) Wolberg, William, Mangasarian, Olvi, Street, Nick, and W., S. Breast Cancer Wisconsin (Diagnostic). UCI Machine Learning Repository, 1995. DOI: https://doi.org/10.24432/C5DW2B.
- Xin et al. (2022) Xin, R., Zhong, C., Chen, Z., Takagi, T., Seltzer, M., and Rudin, C. Exploring the whole rashomon set of sparse decision trees. In Koyejo, S., Mohamed, S., Agarwal, A., Belgrave, D., Cho, K., and Oh, A. (eds.), Advances in Neural Information Processing Systems, volume 35, pp. 14071–14084. Curran Associates, Inc., 2022. doi: 10.48550/arXiv.2209.08040.
- Zhong et al. (2022) Zhong, X., Gallagher, B., Liu, S., Kailkhura, B., Hiszpanski, A., and Han, T. Y.-J. Explainable machine learning in materials science. npj Computational Materials, 8(1):204, 2022. doi: 10.1038/s41524-022-00884-7.
Appendix A Metallic nanoparticles
A.1 Dataset
The data used in this work was generated using molecular dynamics simulations of the sintering and coarsening of Palladium (Pd), gold (Au) and platinum (Pt) nanoparticles (Barnard et al., 2018; Barnard & Opletal, 2019, 2023) under different temperatures and atomic deposition rates, which exist in the form of three-dimensional spatial coordinates(Li et al., 2022).
The dataset in their study (Li et al., 2022) is labeled by the proportion of surface atoms with particular ranges of interatomic coordination numbers, known as surface coordination numbers (SCN), however, such labels only provide limited information about the object roughness or shape complexity. Instead, we used the fractal dimension of a surface as a label that quantifies the complexity of an object by measuring the ratio of detail change to scale change. Labels can be calculated by a box-counting algorithm (Ting et al., 2024). The box-counting dimensions of the metal nanoparticles are generated using a Python package Sphractal, which provides functionalities to estimate the fractal dimension of surfaces composed of precise atomic coordinates (assuming that each atom is a sphere) via a box-counting approach. The relevant parameters used are:
-
•
radType=atomic, radMult=1.2, calcBL=False, findSurfAlg=alphaShape, alphaMult=2.0, bulkCN=12, trimLen=True, confLvl=95, rmInSurf=True, minSample=5, voxelSurf=False, minLenMult=0.15, maxLenMult=2.00, numBoxLen=10, bufferDist=5.0
A.2 Experiment
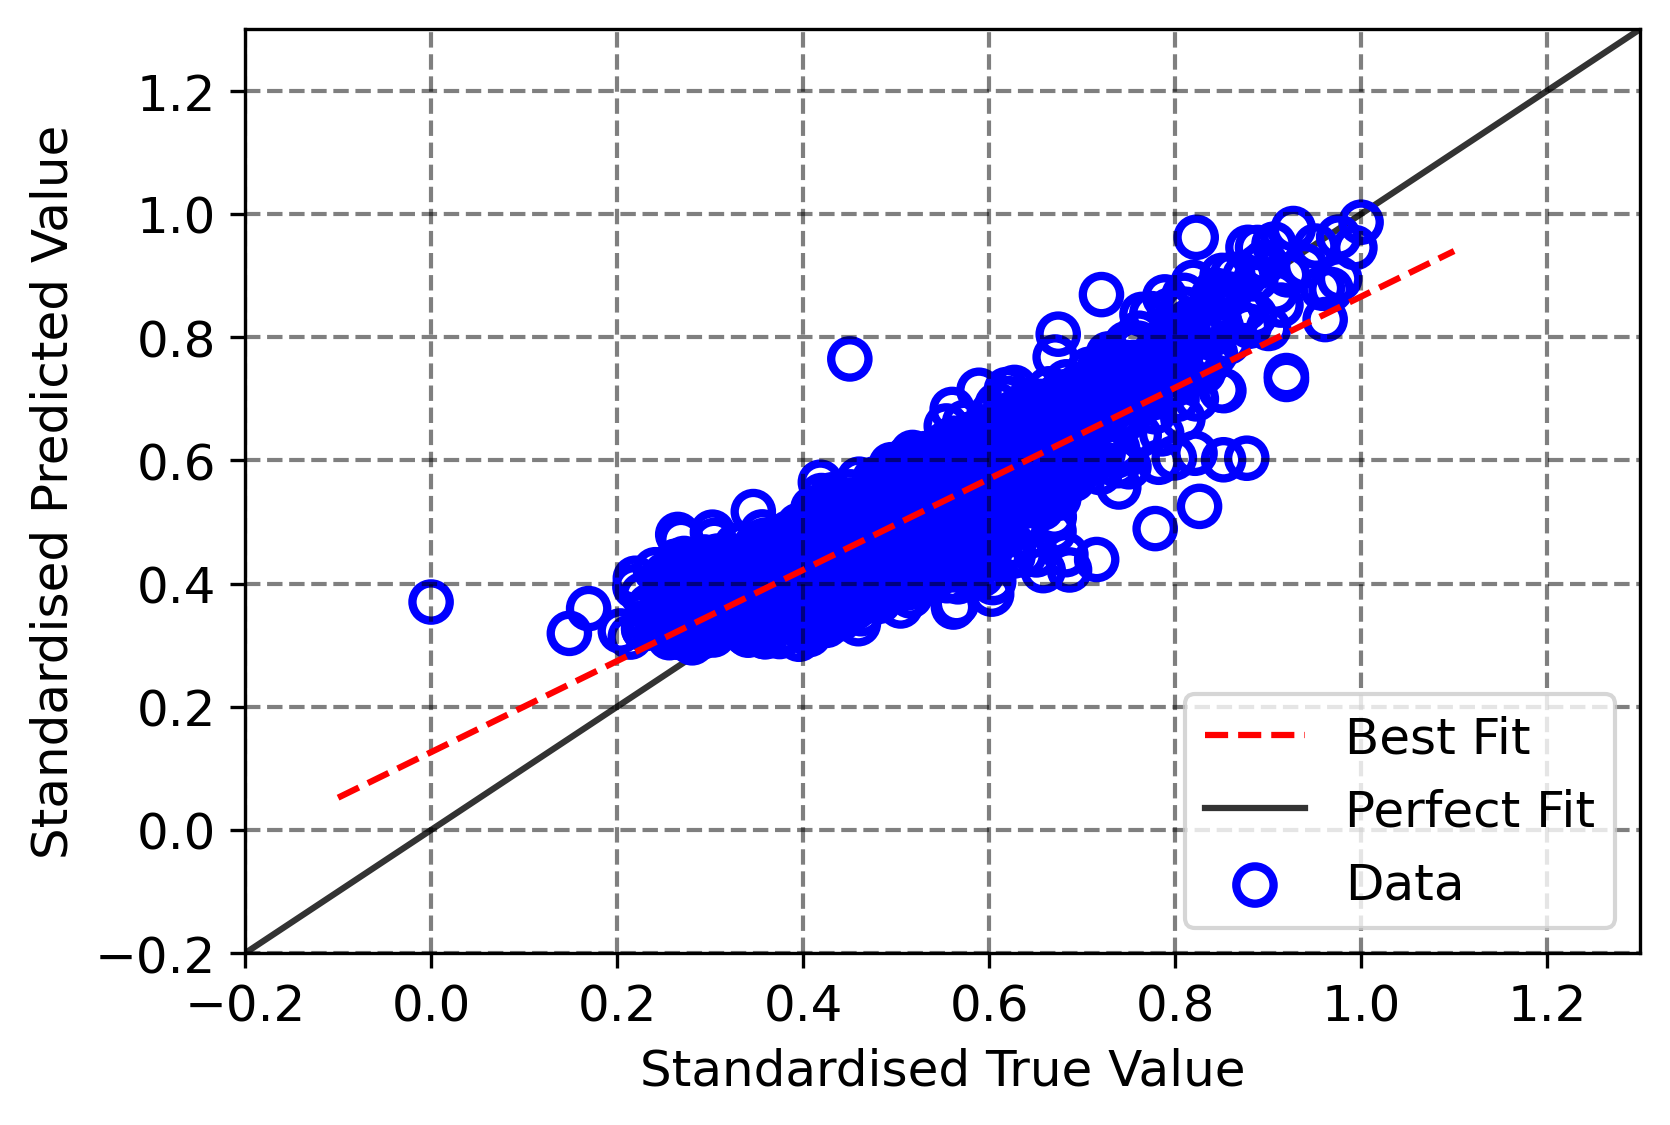
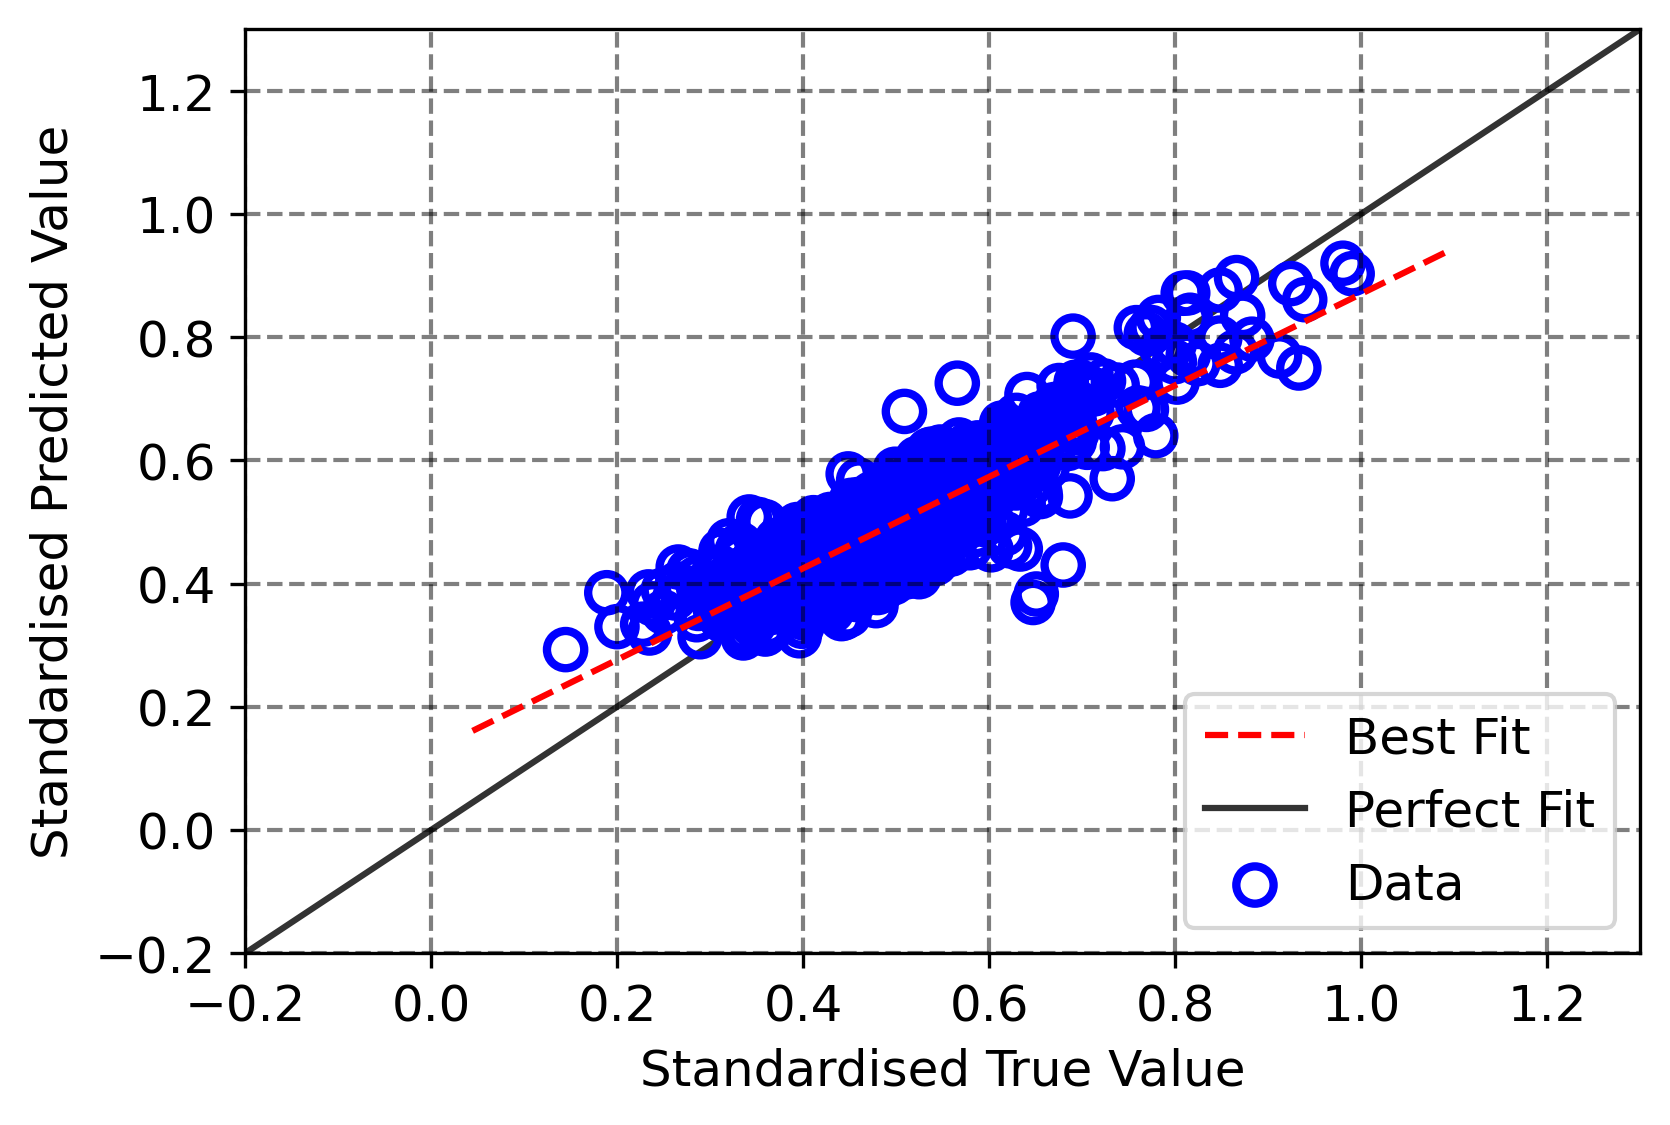
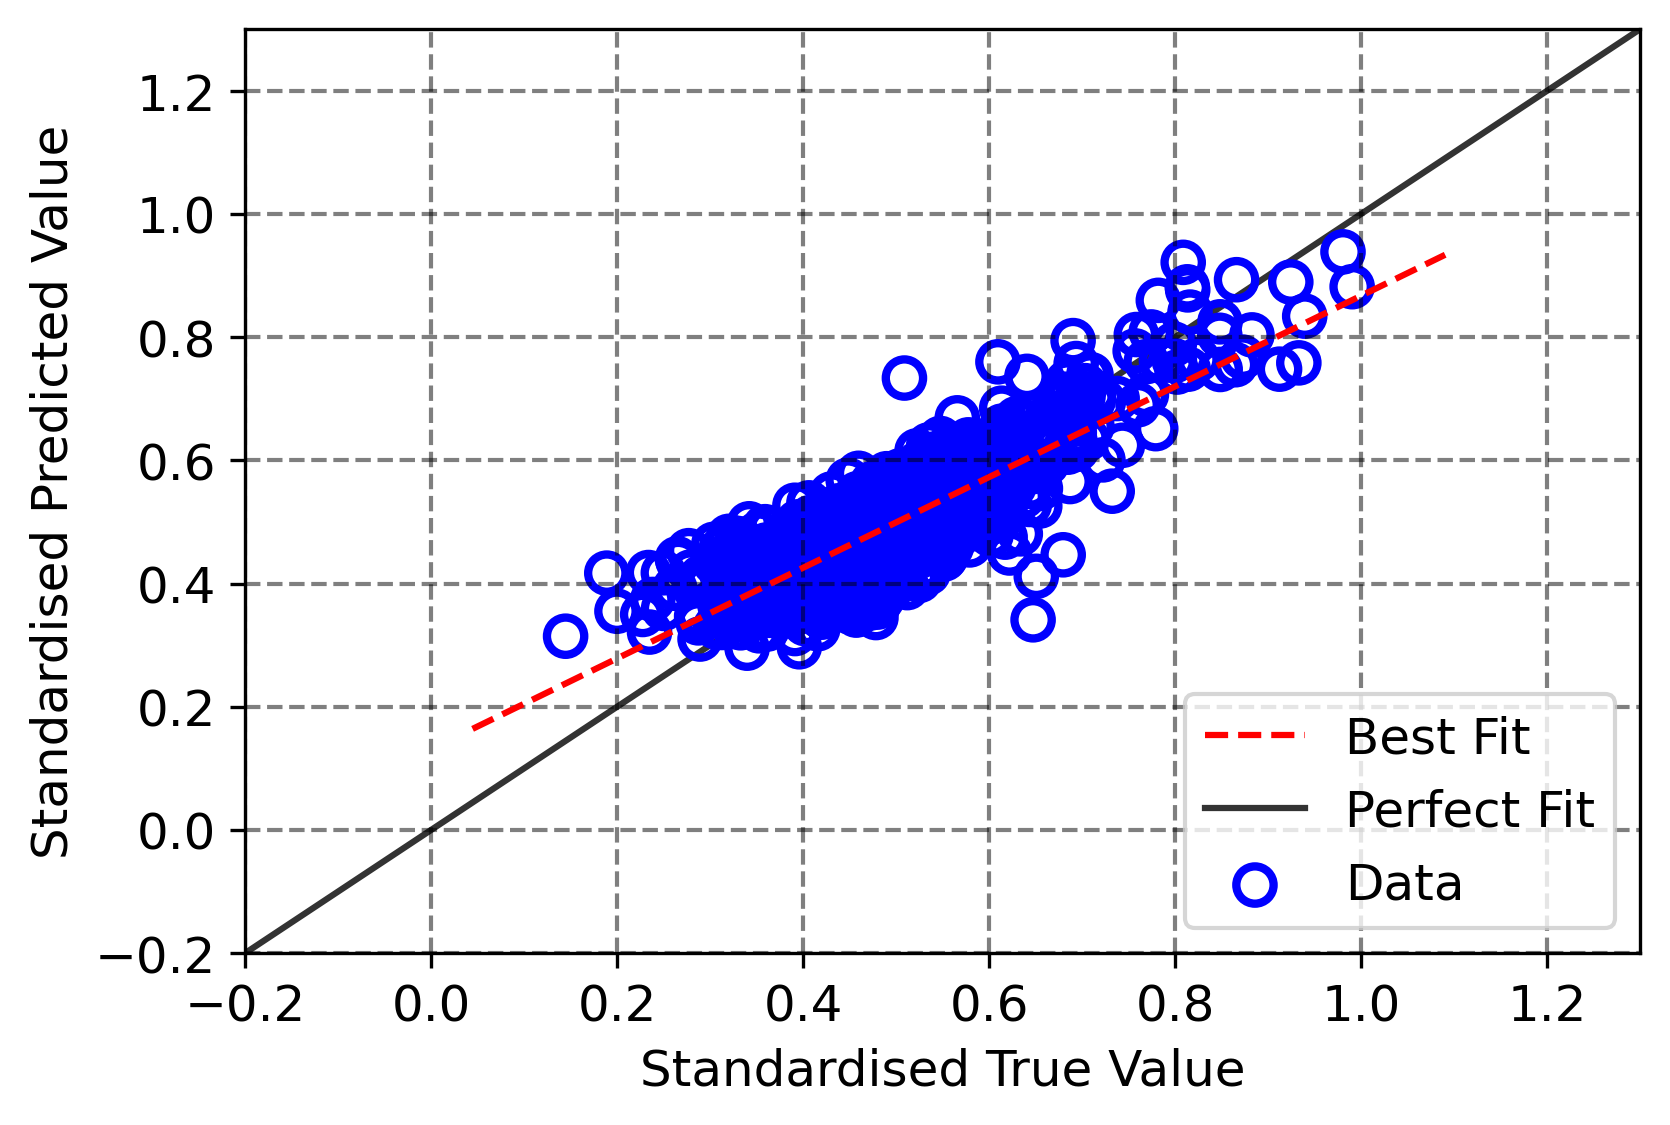
All data were split into 80/20 training/testing sets with random state 42 and were standardized and normalized. Hyper-parameter optimization of all models is also essential and was undertaken here using a random grid search with 5-fold cross-validation to find the best combination of parameters, which is evaluated using the mean square error (MSE), the mean absolute error (MAE), and coefficient of determination (). 45-degree plots are provided for equally good models predicting single target property in Fig. 9.
-
•
RF: max_depth=30, max_features=30, min_samples_leaf=5, min_samples_split=5, n_estimators=350
-
•
XGBoost: objective=reg:squarederror, random_state=42, learning_rate=0.02, max_depth=5, n_estimators=350, gamma=0, colsample_bytree=0.8
-
•
MLP: hidden_layer_sizes=(64, 64, 64, 64), max_iter=1000, activation=relu, learning_rate_init=0.005, random_state=42, early_stopping=True, solver=adam, alpha=0.0001, learning_rate=’constant’
Five domain-driven scenarios are referred to as Important, Controllable, Structural, Processing, and Experimental, and their feature of interests are listed. The 45-degree plots of results for models predicting single target property, trained by feature-driven sets, are shown in Fig. 10.
The Rashomon set is searched based on the previously trained MLP, with MAE=0.03, by setting , which means all models in the Rashomon set have a MAE less than 0.0315, illustrated in Fig. 11.
-
•
Important: S_100, Curve_1-10, Avg_total, Curve_31-40, S_111, Curve_21-30, Curve_11-20, HCP, Curve_41-50, R_std, R_min, q6q6_avg_surf, S_110, Avg_bonds, Curve_51-60, Avg_surf, R_kurt, angle_avg, R_diff, R_skew, angle_std, q6q6_avg_bulk, Std_bonds, Max_bonds, Avg_bulk, Min_bonds, q6q6_avg_total, R_avg, FCC, S_311, N_bulk, R_max, DECA, N_bonds, T, N_surface, N_total, ’tau, Curve_61-70, time, ICOS, Curve_71-80
-
•
Controllable: N_total, N_bulk, Curve_1-10, R_min, R_max, S_111, FCC, T, Avg_bulk,R_std,q6q6_avg_bulk,S_110, S_10, S_311, q6q6_avg_total
-
•
Structural: N_total, N_bulk, Curve_1-10, Avg_total, R_min, R_max, Curve_61-70, S_111, Avg_bonds, FCC, HCP, Avg_bulk, Avg_surf, R_std, Std_bonds, Curve_21-30, Curve_31-40, q6q6_avg_bulk, S_110, S_100, angle_avg, q6q6_avg_surf, S_311, q6q6_avg_total
-
•
Processing: T, time, tau
-
•
Experimental: R_max, FCC, DECA, T, tau, time, S_100, S_111


Appendix B Breast Cancer Wisconsin (Diagnostic)
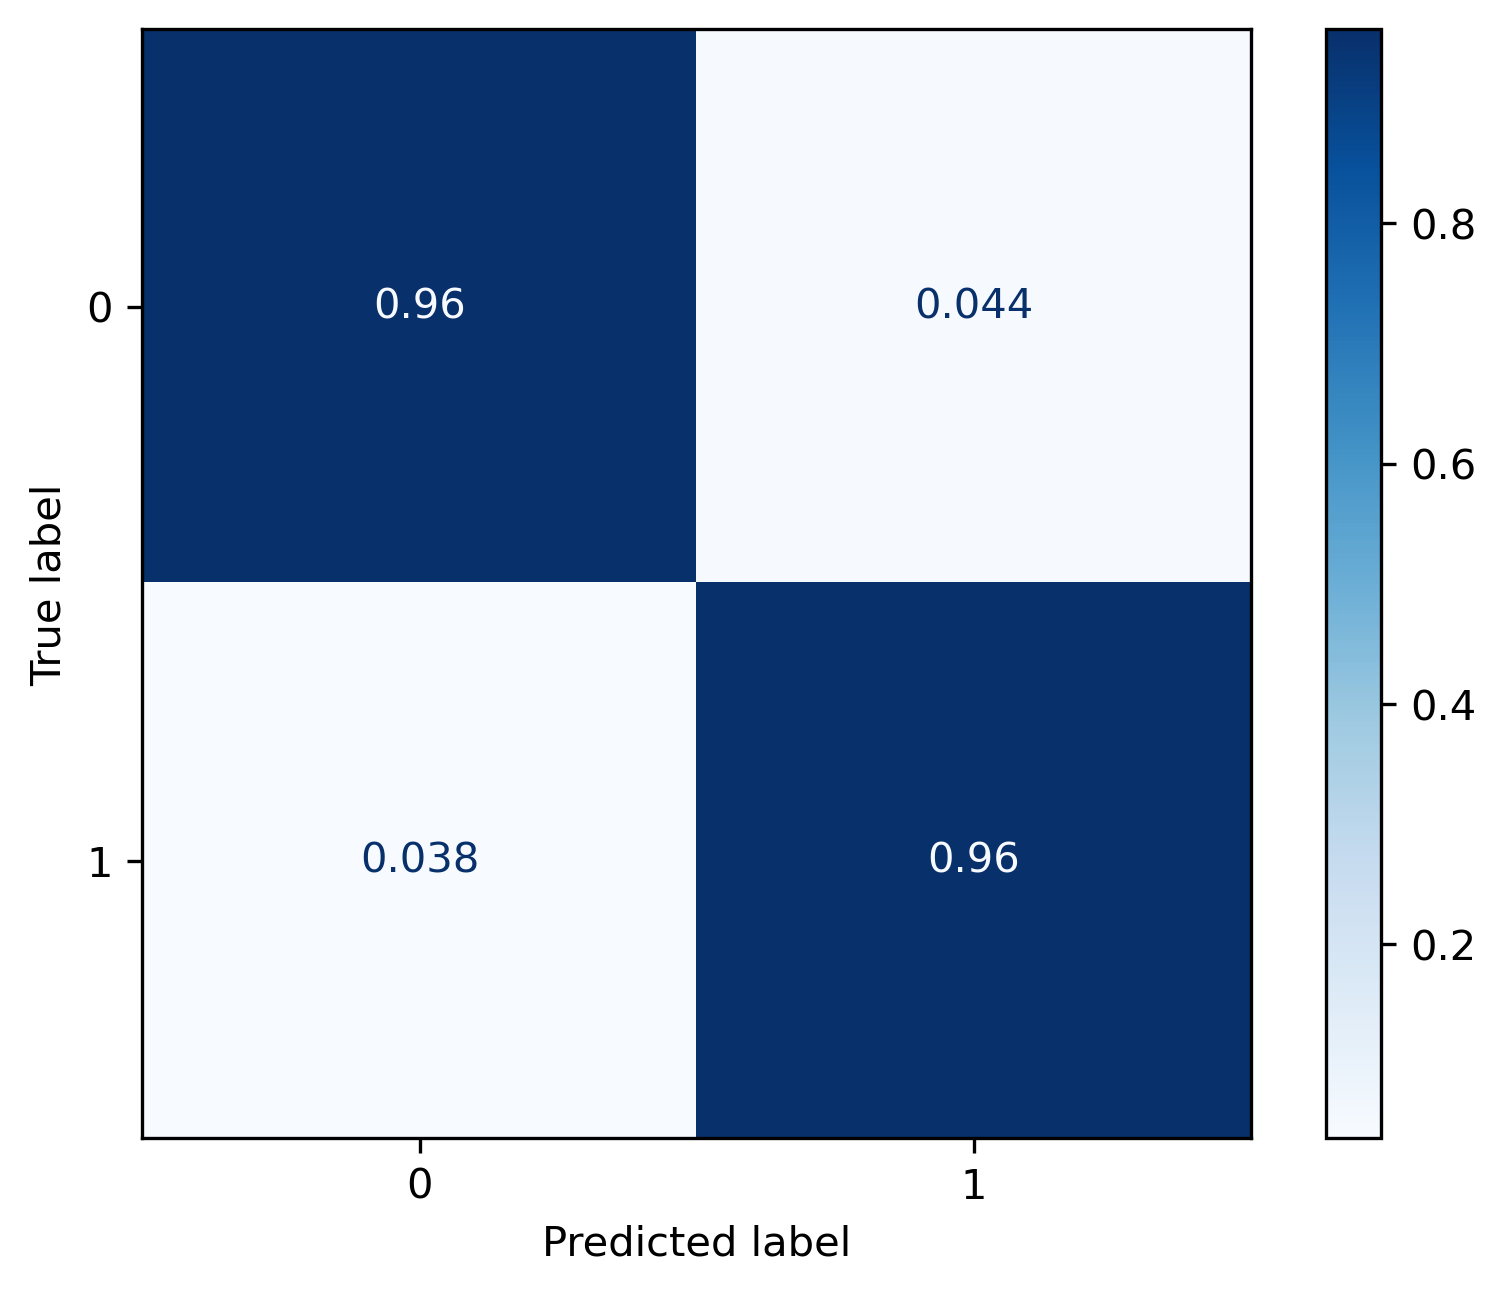
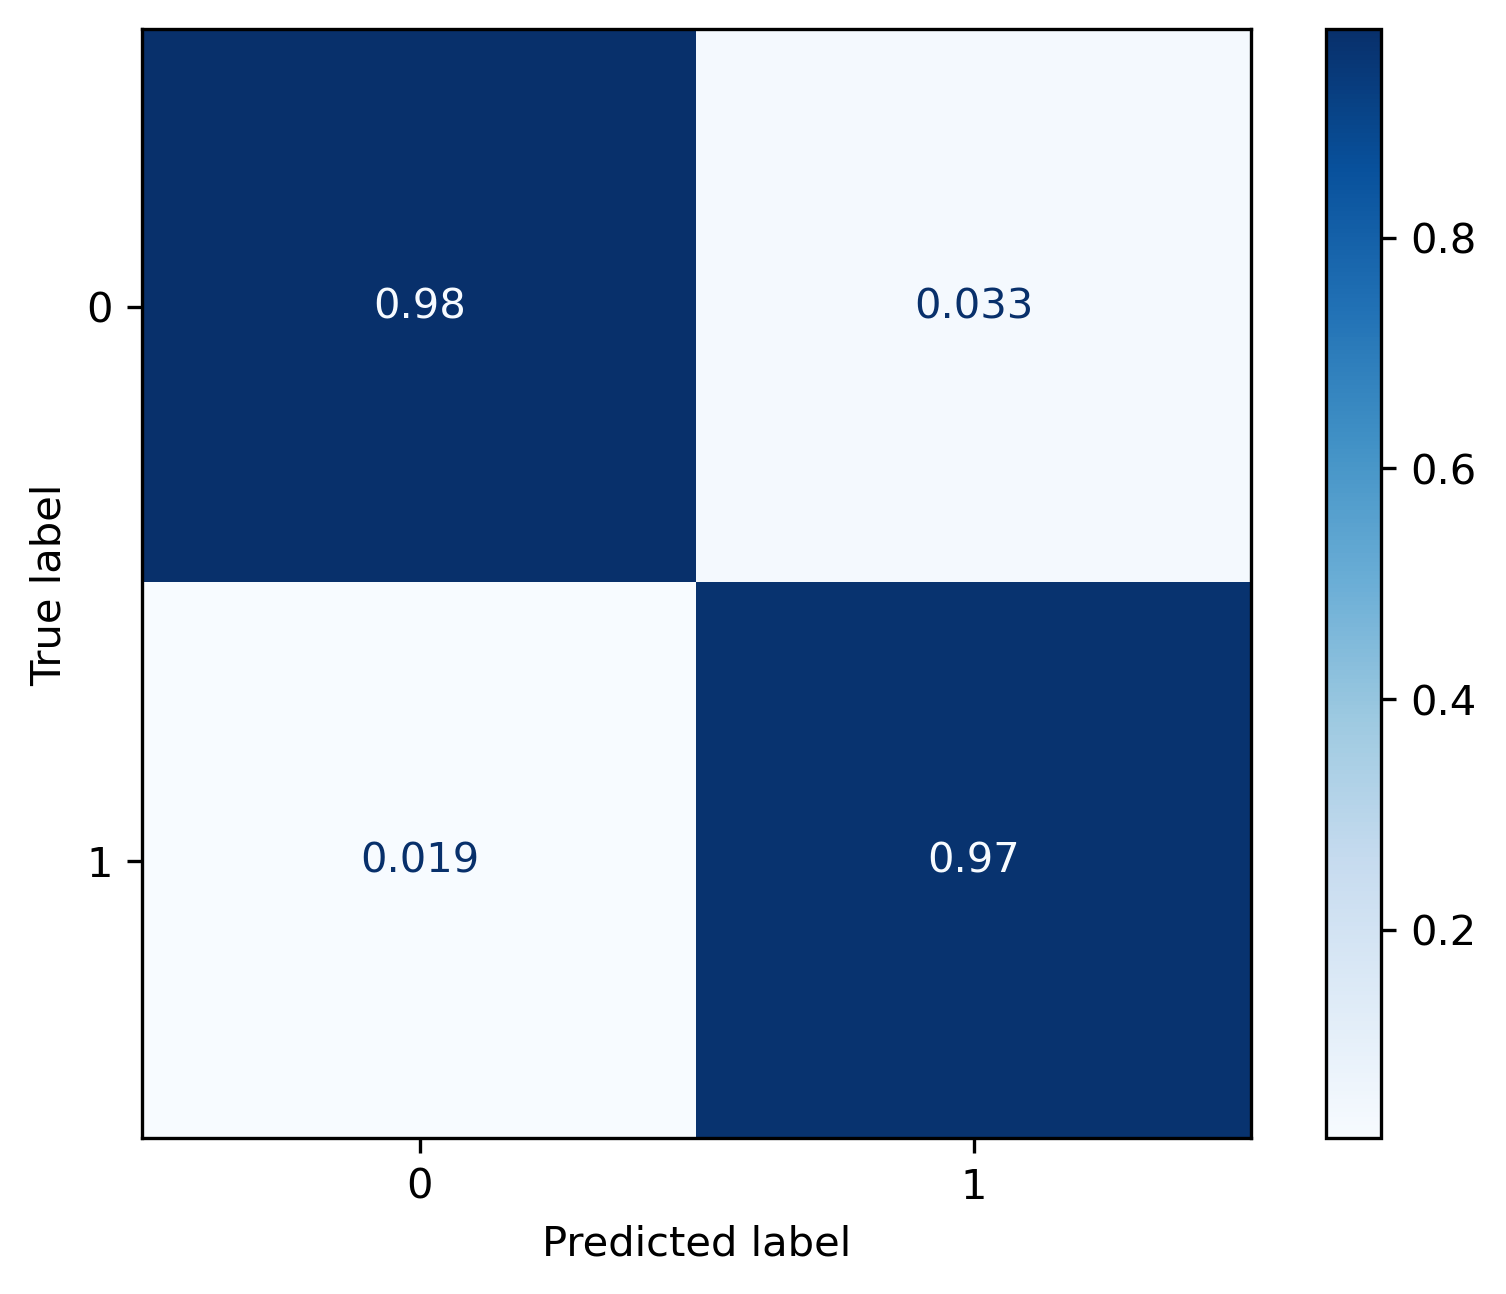
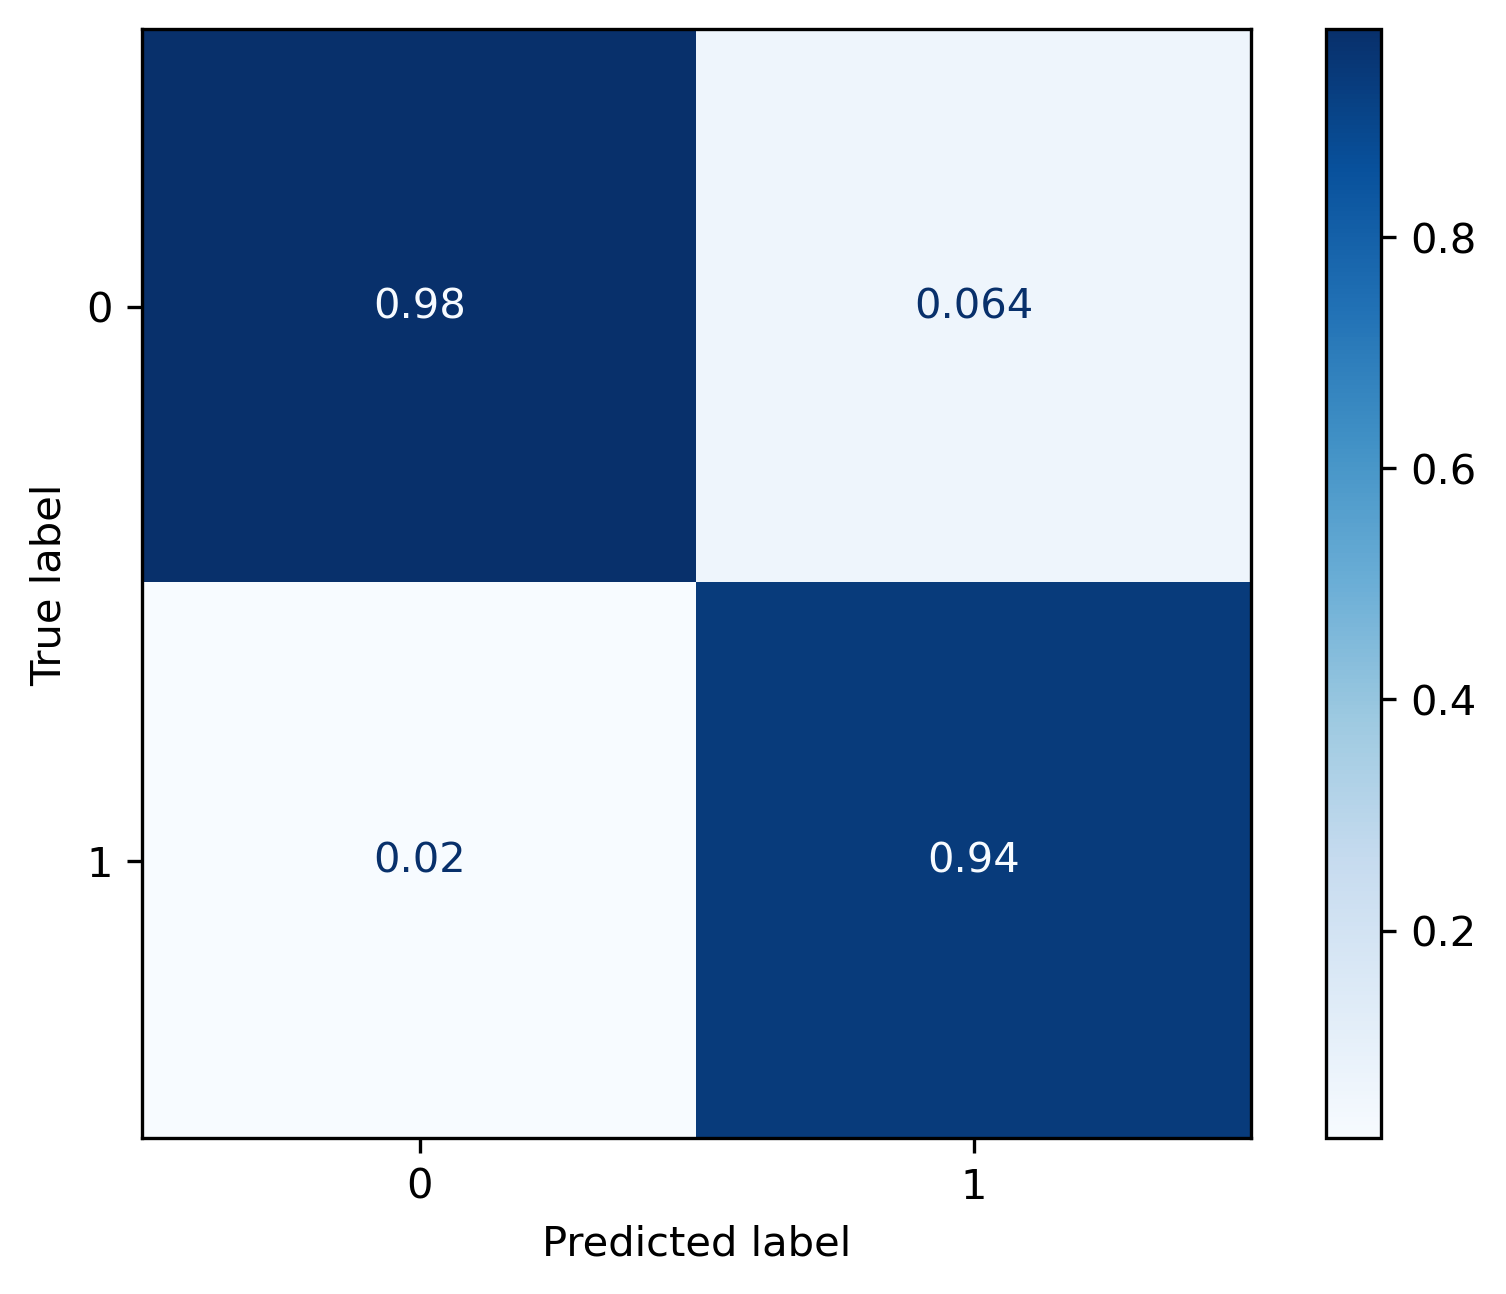
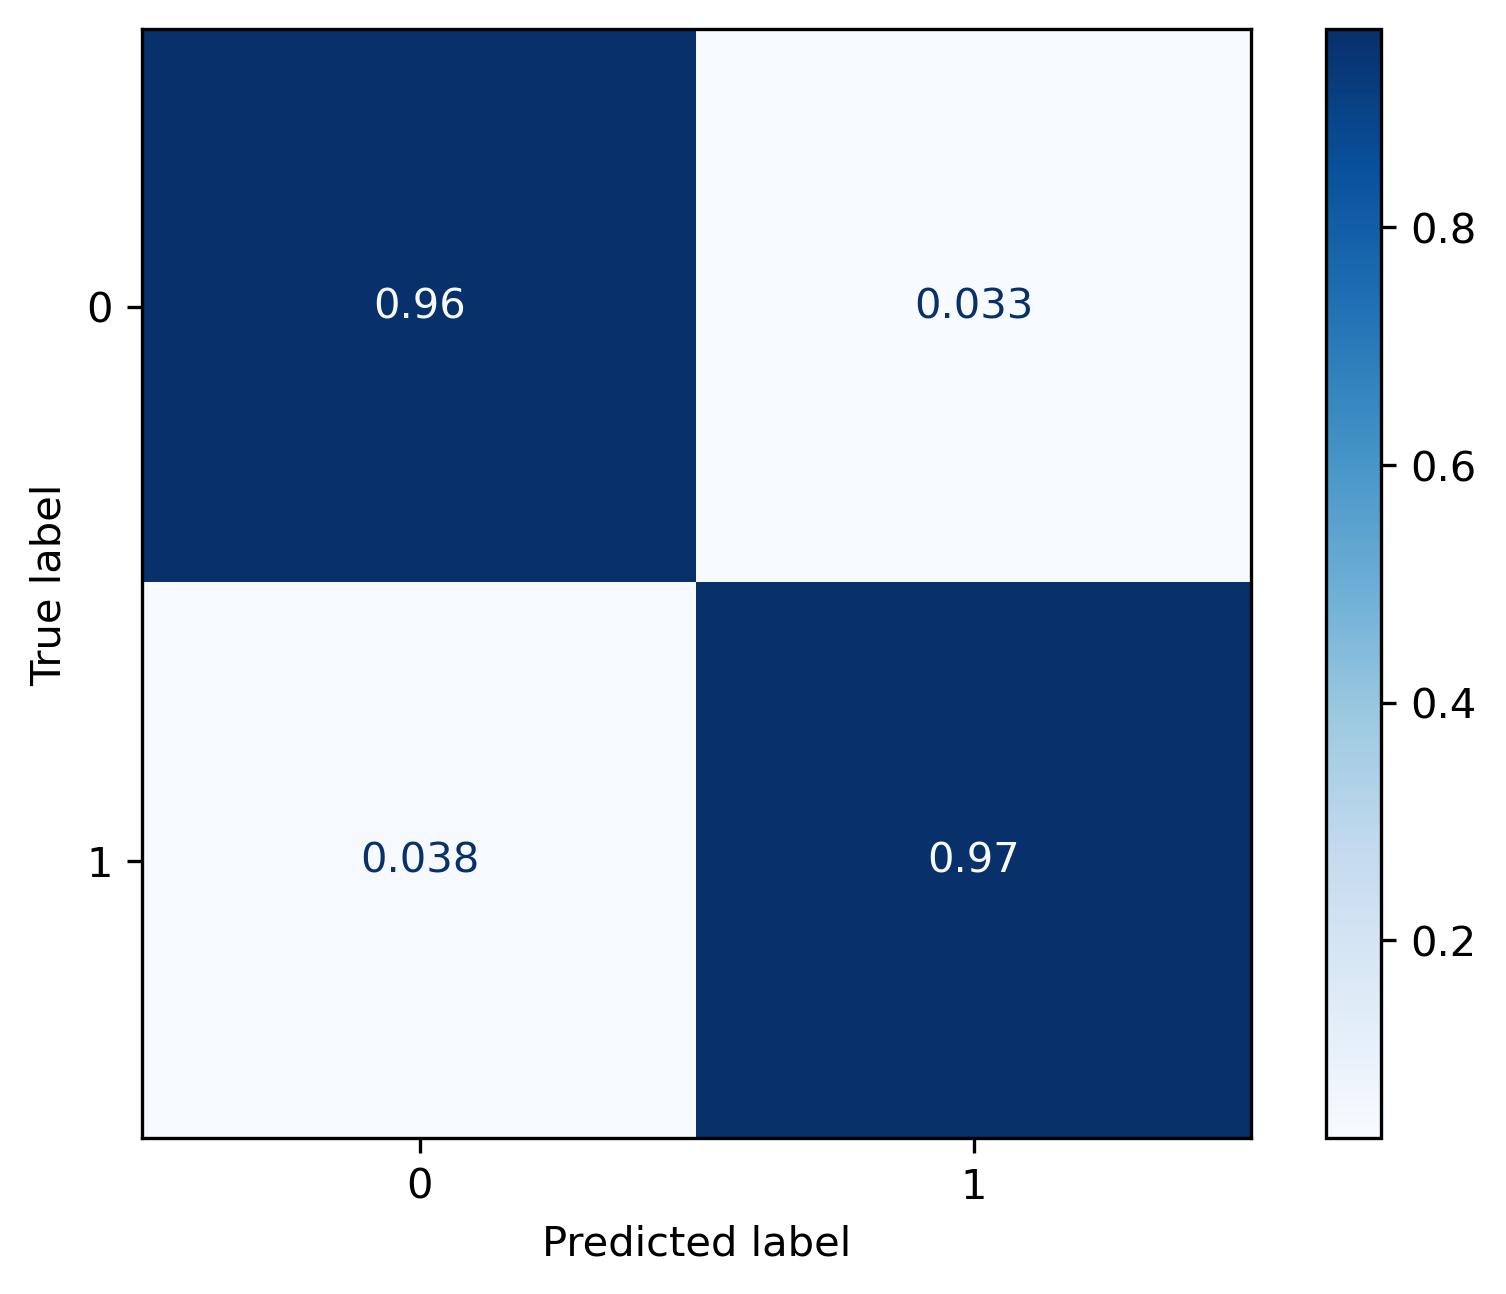
The dataset used in the case study in Sec. 4 is sourced from the Sklearn package (Pedregosa et al., 2011). Four models were trained on the dataset with the same data split, and the confusion matrices of the four classifiers are provided in Fig. 12. The parameters of the four models are listed as follows:
-
•
MLP: hidden_layer_sizes=(32,32,32), alpha=0.01, early_stopping=True, max_iter=1000, random_state=42, learning_rate_init=0.0005, solver=adam, learning_rate=constant
-
•
RF: random_state=42, n_estimators =100, criterion=entropy
-
•
SVM: kernel=rbf, degree=3, gamma=scale, shrinking=True, tol=1e-3, max_iter=-1, decision_function_shape =ovr
-
•
XGBoost: max_depth=3, learning_rate=0.1, n_estimators=100, objective=binary:logistic, booster=gbtree, importance_type=gain
