Capacity Constraint Analysis Using Object Detection for Smart Manufacturing
††thanks: 1 Corresponding author: ahmad54@uwindsor.ca
This study is supported by IFIVEO CANADA INC., Mitacs through IT16094, Natural Sciences and Engineering Research Council of Canada (NSERC)through ALLRP 560406-20, Ontario Center of Excellence (OCE)through OCI# 34166, and the University of Windsor, Canada.
Abstract
The increasing popularity of Deep Learning (DL)based Object Detection (OD)methods and their real-world applications have opened new venues in smart manufacturing. Traditional industries struck by capacity constraints after Coronavirus Disease (COVID-19)require non-invasive methods for in-depth operations’ analysis to optimize and increase their revenue. In this study, we have initially developed a Convolutional Neural Network (CNN)based OD model to tackle this issue. This model is trained to accurately identify the presence of chairs and individuals on the production floor. The identified objects are then passed to the CNN based tracker, which tracks them throughout their life cycle in the workstation. The extracted meta-data is further processed through a novel framework for the capacity constraint analysis. We identified that the Station C is only 70.6% productive through 6 months. Additionally, the time spent at each station is recorded and aggregated for each object. This data proves helpful in conducting annual audits and effectively managing labor and material over time.
Index Terms:
Convolutional Neural Network, You Only Look Once, Deep Learning, Smart ManufacturingI Introduction
The manufacturing sector has long been a cornerstone of economic development, driving innovation and providing employment opportunities. However, the outbreak of the COVID-19 pandemic has exacerbated existing challenges in the manufacturing landscape, notably the critical issue of labor shortage and supply chain collectively referred to as capacity constraint. Industries have difficulty finding skilled labor for tasks requiring precise human effort. According to Causa et al.[1], 75% of employers have a hard time filling open positions, and manufacturing is among the most hit. Additionally, as per the Analysis on labor challenges in Canada, second quarter of 2023 by Statistics Canada in June 2023 [2], 59.3% of manufacturing industries consider rising inflation to be an obstacle over the next three months. Nearly 9 out of 10 organizations surveyed responded that they are having a hard time filling open positions, which are mostly comprised of entry-level to mid-level positions, with manufacturing being the most hit as 93% struggled to find entry-level employees. The Canadian Federation of Independent Business also reported [3] that as of November 2021, 55% of small businesses in Canada experienced labor shortage and difficulty in hiring, retaining or getting staff to work the needed hours. Overall, this shortage is exponentially increasing the existing global supply chain issues.
This confluence of data from various sources underscores a consistent and pressing issue of capacity constraint that requires innovative solutions. Researchers and engineers trying to solve this unique challenge have started consulting to use innovative methods to increase labor productivity and decrease the bottlenecks in the production pipeline to reduce the effect of the supply chain [4, 5, 6, 7]. Based on an earlier study by Ahmad and Rahimi [8], OD applications in smart manufacturing play a pivotal role in enhancing quality control, cycle-time studies, safety compliance, and surveillance. Puttemans et al., [9] and Wang et al.[10] employed deep learning based OD model [11] for detecting packages in warehouse environments, highlighting its utility in real-time applications for product packaging. Farahnakian et al.[12] along with Li et al.[13] applied OD models for damage detection and pallet rack identification in industrial warehouse settings.
While much of the existing research has concentrated on automating manufacturing processes, the field of manual production, particularly where the productivity of skilled labor is paramount, remains relatively unexplored. In response to the complex challenges faced by various sectors within the manufacturing industry, this paper introduces a collaborative research initiative involving a computer vision company, IFIVEO CANADA INC., and its client (hereafter referred to as the client in this article), which specializes in the production of assistive medical wheelchairs. The manual assembly of power-assist wheelchairs, a niche yet crucial manufacturing segment, presents unique challenges. These wheelchairs, custom-built based on medical prescriptions, require meticulous precision and expertise.
This article delves into the innovative use of CNN s to identify bottlenecks in the production pipeline, a pervasive issue worsened by labor shortages and faulty parts. Our approach begins with developing and training a CNN based OD model meticulously designed to identify power-assist wheelchairs, referred to as chairs henceforth, and workers on the production floor. Subsequently, a CNN based tracking system is employed to keep track of their lifecycle. The extracted meta-data is then processed to provide insights about productivity in their manufacturing facility. The overall approach provides real-time metrics of the production capacity and can be further utilized for capacity constraint analysis.
Our key contribution within this study can be summarized as a non-invasive state-of-the-art framework for analyzing the capacity of the manufacturing facility using OD methods which categorize the station into different states. This can be specially used in industries struck by capacity constraints and help them optimize the processes by removing the bottlenecks and increasing overall production and revenues in general.
The following sections delve into the state-of-the-art OD methods and their applications in smart manufacturing in Section II. We propose a theoretical framework in Section III while the technical intricacies of our proposed solution are supported by comprehensive analysis and empirical evidence in Section IV. Insights from the manufacturing facility are discussed in Section V and finally Section VI offers concluding remarks.
II Related Work
CNN based OD methods and their applications in real-world value-added services are an active area of research as these models are pivotal in the localization and classification of the objects within a given frame.
Historically, traditional approaches relied on carefully engineered hand-crafted features, leading to time-consuming and less accurate results. However, the advent of CNN based deep learning models, empowered by increased computational capacity through a Graphical Processing Unit (GPU), has revolutionized computer vision.
Two primary categories of OD methods have emerged: region proposal and regression based methods. Region Proposal Convolutional Neural Network (R-CNN)s [14] propose regions that are subsequently classified into predefined categories [15, 16]. While these models demonstrated high localization accuracy, they were computationally complex, often falling short of real-time performance due to the proposal of thousands of regions per image. To address this limitation, one-stage detectors were introduced [17] including the groundbreaking You Only Look Once (YOLO)by Redmon et al.[18], which provided real-time performance across various benchmarks.
II-A You Only Look Once
YOLO [18] represents a revolutionary approach to OD and localization, treating the problem as a regression task. In essence, YOLO directly proposes bounding box coordinates and associated class probabilities from the image pixels, presenting a unified and end-to-end trainable model. This monolithic architecture learns directly from the input images during training, eliminating the need for complex multi-stage pipelines.
The history of YOLO models in OD is marked by significant technical advancements [19]. YOLO v1 [18] (2016) introduced a single end-to-end architecture that simultaneously predicted multiple bounding boxes and class probabilities for those boxes, which significantly improved the speed compared to previous region proposal based methods [14]. The authors achieved this by dividing the input image into a grid, with each grid cell responsible for detecting objects within it. Each cell can predict multiple bounding boxes and confidence scores for those boxes. The network used a combination of 24 convolutional layers and 2 fully connected layers, with a final output tensor providing class probabilities and bounding box coordinates. YOLO v2 [11] (2017), and YOLO v3 [20] (2018) brought improvements in both speed and accuracy by introducing the anchor boxes to predict offsets rather than the full bounding box and refining the feature extractor resulting in improved accuracy. The authors also propose Darknet-19 and Darknet-53 consisting of 19 and 53 layered networks, respectively, while incorporating multi-scale predictions using a Feature Pyramid Network (FPN)[21] for improved detection of small objects.
YOLO v4 [22] (2020) proposed the integration of Cross-Stage Partial Connections (CSPNet)[23], Path Aggregation Network (PANet)[24] and modified Spatial Attention Module (SAM)[25] along with the use of the Mish [26] activation function and Complete Intersection Over Union (CIoU)loss [27] for enhancing feature extraction and bounding box accuracy. YOLO v5 [28] (2020) introduced a more streamlined and simplified architecture along with model scalability enhancements to adjust the model size based on the available computational resources. The authors improved the performance using novel Mosaic augmentation combined with multiple other data augmentation methods for data pre-processing. This increased the variance in the data, hence improving the detection accuracy. They also used the Sigmoid-weighted Linear Unit (SiLU)activation function [29] instead of Mish [26] as employed by their predecessors. YOLO v6 [30] (2021) and YOLO v7 [31] (2022) focused on optimizing the balance between speed and accuracy for edge computing devices. They used the Efficient Long-Range Attention Network (ELAN)[32] strategy to increase its convergence speed and reduce the training time. The authors also proposed a Reparameterized Convolutional (RepConvN)block inspired from [33] that helped better feature extraction.
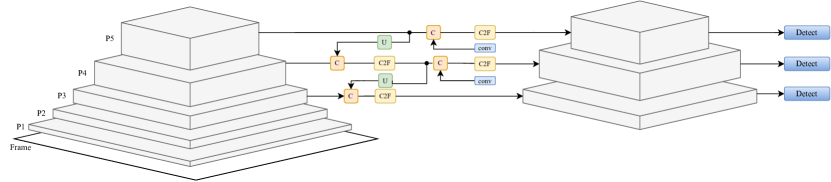
YOLO v8 [34] (2023), the latest in the series, represents the culmination of ongoing efforts to optimize OD for both performance and computational efficiency and advanced network architecture incorporating recent developments in neural network design. The authors used an anchor-free model inspired by [35] with a decoupled head to independently process objectness, classification, and regression tasks along with CIoU [27] and Distribution Focal Loss (DFL)[36] functions for bounding box loss and binary cross-entropy [37] for classification loss. Figure 1 illustrates the fully visualized YOLO v8 architecture, with different stages of the network shaded in distinct colors for clarity.
The YOLO series continues to be a prominent example of innovation in computer vision and deep learning. Each version has contributed to the rapid progression and adaptability of deep learning models to become more efficient and capable, making them suitable for various applications, from mobile and edge devices to high-end GPU s.
II-B Object Detection in Smart Manufacturing
The researchers have been actively identifying innovative ways to utilize the power of OD methods in smart manufacturing. Recently, Zendehdel et al.[39] used the YOLO v5 [28] model to identify and localize the tools on the manufacturing floor for worker safety. Liu et al.[40] proposed a novel Lighter and Faster YOLO (LF-YOLO)model for defect detection on the X-ray imagery of the welding where they also proposed Reinforced Multiscale Feature (RMF)module to extract more hierarchical information. Wang et al.[41] proposed a lightweight YOLO style object detector known as Attention YOLO (ATT-YOLO)for surface defect detection in electronics manufacturing. Zhao et al.[42] also modified YOLO v5 [28] for the steel surface defects where they modified the architecture to utilize low-level features for better detection. Puttemans et al.[9] and Vu et al.[43] employed YOLO v2 [11] and YOLO v5 [28] for detecting packages in warehouse environments, highlighting its utility in real-time applications for product packaging. Zhao et al.[44] proposed modified YOLO v5 for lightweight, real-time performance in detecting particleboard surface defects. This was achieved by replacing conventional convolutional layers with depth-wise convolution layers and integrating Squeeze and Excitation Network (SENet)[45] layers to optimize the model’s parameters. Rahimi et al.[46] proposed modifications to YOLO v3 for detecting large-scale objects, specifically in the automobile industry, enhancing the model by altering its architecture and activation function. Ahmad et al.[47] applied YOLO v3 for detecting and tracking cranes in steel manufacturing plants, showcasing the adaptability of these deep learning models for specific industrial surveillance tasks. Liu et al.[48] proposed YOLO for Industrial Manufacturing Field (YOLO-IMF), an improved YOLO v8 algorithm for surface defect detection in the industrial manufacturing field. Luo et al.[49] modified YOLO v8 towards edge computing by reducing the parameters and computational load by modifying the lightweight ShuffleNetV2 network [50] and using that as the feature extractor of YOLO.
Additionally, Krummenacher et al.[51] applied deep learning for wheel defect detection. O’Brien et al.[52] introduced a method for inspecting the quality of medical device production, addressing the need for high accuracy and low error tolerance in applications for medical equipment manufacturing. Farahnakian et al.[12] and Li et al.[13] used OD methods for damage detection and pallet rack identification in industrial warehouse settings. Wei et al.[53] and Luo et al.[54] demonstrated the effectiveness of deep learning in detecting humans and industrial tools from a distance, showcasing the versatility of these models in diverse industrial scenarios. Wang et al.[10] advanced product defect detection using a deep learning approach that synergies pre-processing techniques with deep learning, reducing computational load and excluding irrelevant background content.
With all these applications, it is evident that OD methods have been very effective and are gaining more popularity in the research and engineering community. Nevertheless, these are more focused on materials quality while the productivity of the labor handling such materials and workload is not studied and needs further and more thorough exploration. In the next section, we have defined an initial framework for this missing piece in the literature.
III Capacity Constraint Analysis
Capacity constraint in a manufacturing environment is defined as a situation where a business’s production capacity is insufficient to meet demand. This limitation can manifest in various forms, such as labor, materials, or equipment constraints. According to the Theory of Constraints [55, 56], every system has bottlenecks that dictate the pace of the entire production line, and addressing these bottlenecks can significantly increase overall output. The initial step in this process involves thoroughly analyzing the constraints to pinpoint the actual limiting factors. In this section, we propose a comprehensive framework to analyze workstations, particularly those operated by manual labor. This framework aims to identify the root causes of capacity limitations and develop strategic, long-term solutions to enhance manufacturing efficiency and output.
To effectively analyze workstations and identify bottlenecks in the manufacturing process, it is essential to consider productivity, which is fundamentally defined as the output per unit of input. Productivity is a critical metric for operational efficiency, especially in contexts with limited labor resources. While organizations may use various parameters for this analysis, our proposed framework incorporates a holistic set of definitions considering both workforce and material. This integrated approach ensures a more accurate identification of constraints and facilitates the development of targeted solutions to optimize manufacturing processes.
Definition 1 (Station Productivity).
We define station productivity as the output generated when a worker is actively engaged in working with materials.
This measure focuses on the station’s effectiveness in producing items rather than solely assessing the worker’s efficiency in the quantity of objects produced. It’s a nuanced measure of efficiency, highlighting how effectively a station utilizes its resources (both human and material) to generate output.
Definition 2 (Non-Productivity).
Non-productivity at a station occurs when no value is produced due to worker unavailability.
This typically happens when a worker is absent from their station. However, it’s important to differentiate between avoidable and unavoidable non-productive time. Breaks, for example, are a necessary aspect of work that, while non-productive, contribute to overall worker productivity and well-being by preventing fatigue and maintaining mental health.
Definition 3 (Downtime).
Downtime in this context refers to periods when a worker is present but lacks the necessary materials to continue production.
This situation can arise due to supply chain issues, scheduling errors, or unforeseen delays in material delivery. Downtime is a critical aspect of station productivity as it directly impacts the output despite the availability of workers.
Definition 4 (Idle Time).
Idle time is characterized by the absence of both workers and materials at a station.
This occurs during off-hours or designated break times. Understanding idle time is crucial for workforce planning and ensuring that staffing levels are appropriate to the demands of the production schedule.
Mathematically, all of the above definitions can be combined and represented as a simple lookup table shown in Table I to get the status of each frame.
| Material | Worker | |
|---|---|---|
| Productive | ✓ | ✓ |
| Un-productivity | ✓ | |
| Downtime | ✓ | |
| Idle-time |
III-A Cycle-time Study
We can get the station status for each frame; however, aggregating that status over time provides the real value for the life of an object in the scene, also known as cycle time study. We need to track when an object appears in and leaves the scene. This can be measured using several methods. Here, we discuss several of these methods with their advantages and disadvantages as follows,
-
Stop Watches
involves timing tasks manually. It’s common but limited by sample size and may not accurately represent normal working conditions.
-
Video Recording with Offline Analysis
allows for efficient analysis but suffers from delays in feedback.
-
Breaking Up Activity into Tasks and Subtasks
helps in understanding task performance and supports line balancing, but it can be time-consuming.
-
Working with Predetermined Standard Times
offers deep insights but may not align with real-world timings.
-
Sensor based Tracking
involves using data from workflow systems for real-time productivity analysis. While efficient, it lacks insights into the causes of productivity changes.
-
Visual Tracking
combines real-time, non-intrusive data collection with identifying improvement opportunities. It requires upfront investment but is increasingly cost-effective.
While most methods require manual calculation and human input, visual tracking is real-time and does not need human feedback once the development is complete and will yield accurate results. It can be implemented by OD based methods and can be used to accurately conduct this cycle time effectively. Within this proposed methodology, we will use the YOLO v8 model as the state-of-the-art OD model.
IV Methodology
The proposed methodology consists of a two-step approach. 1) We need data for training an OD model, and in the preceding section, we highlighted the state-of-the-art performance of YOLO v8 and decided to use that as our primary OD model in this study. 2) Testing that model in the manufacturing facility of choice to conduct the capacity constraint analysis.
IV-A Dataset Description
For the dataset employed in the training and evaluation of the OD model, manual annotation was carried out on videos sourced directly from the four production line stations within the clients’ facility over roughly two months. The facility runs only for one shift of 8.5 hours every day. A total of 33,956 individual frames were extracted from these recordings at a frequency of 0.3 frames per second (). As the scene in each station does not change, only the objects move; we needed manual stratified data splitting into train and validation to avoid data leakage as data from each day should only be in either split. The total images in train/validation ended up as 29,070/4,886. The dataset consisted of 2 classes, i.e., worker and chair. Each station has a different viewing angle, adding variation to the dataset.
IV-B Training
To train the YOLO v8 model as defined by [34], we employed a transfer learning approach to refine the pre-trained model, initially trained on the Microsoft Common Objects in Context (MS-COCO)dataset [57]. The open-source model implementation111we have used the open source implementation of YOLO v8 model available at https://github.com/ultralytics/ultralytics is available in 5 different sizes; nano (n), small (s), medium (m), large (l) and extra-large (x) depending on the number of parameters. Table II represents the number of parameters in each model. We trained nano, medium, and large as three separate models to compare accuracy and detection speed. The model’s output layer was reconfigured to identify two distinct object types. To enhance accuracy, non-maximum suppression [58] was utilized for output refinement. Moreover, the cosine annealing learning rate method [59] was implemented as a scheduler chosen for its demonstrated excellence in various benchmark tests.
To augment our dataset, we incorporated several methods, including random vertical flipping and a mosaic of 4 frames. These techniques expanded the dataset size and contributed to a more robust training process. The training was done using 2x NVIDIA Ray Tracing Texel eXtreme (RTX)TITAN GPU s with a batch size of 128 for nano and medium and 64 for large-size models due to GPU memory limitation.
IV-C Evaluation Metrics
Detection accuracy and inference speed are key metrics for evaluating the OD model. Accuracy is often evaluated using Precision (P)and Recall (R), which are derived from the counts of True Positive (TP), False Positive (FP), True Negative (TN), and False Negative (FN)while speed is measured in . The formulas for these metrics are as follows:
| (1) | |||
| (2) |
Furthermore, Mean Average Precision (mAP)assesses detection accuracy. This measure is calculated for each class based on P and R and then averaged to yield an overall score. For quantifying the accuracy of object localization, the Intersection over Union (IoU)metric is used and calculated between the labeled objects (ground truth) and the model’s predictions as follows:
| (3) |
where represents the ground truth bounding box, and denotes the bounding box predicted by the OD model. The IoU threshold functions as a boolean operator to eliminate FP bounding boxes that score below a certain IoU value. This threshold determines the necessary sensitivity for the localization to be classified as positive or negative (e.g., IoU threshold). Different models may employ varying threshold values, such as 0.25, 0.5, or 0.75, in their evaluations. Table II lists the evaluation results and inference speed of the different YOLO v8 models where operations are quantified by Floating-Point Operations Per Second (FLOPS).
| Model | mAP 0.50-0.95 | GPU (ms) | Parameters (M) |
|---|---|---|---|
| YOLO v8-n | 18.4 | 1.21 | 3.5 |
| YOLO v8-s | 27.7 | 1.40 | 11.4 |
| YOLO v8-m | 33.6 | 2.26 | 26.2 |
| YOLO v8-l | 34.9 | 2.43 | 44.1 |
| YOLO v8-x | 36.3 | 3.56 | 68.7 |
IV-D Post-Processing
While OD models are the perfect choice for detecting objects in the scene, they don’t provide any temporal information. Hence, to get that information and assign a tracking Identifier (ID)to each object, we have used state-of-the-art Deep Simple Object Tracking (DeepSort)[60] model, which uses Kalman Filtering (KF)[61] to maintain tracking continuity from the previous state and predict the location of the bounding box in the subsequent frame. This algorithm leverages deep CNN architecture in the prediction process, combining the strengths of KF with the representational power of CNN s. The object with the tracking ID can help distinguish between objects and provide the timestamps for the start and end of the object’s life cycle.
IV-E Results
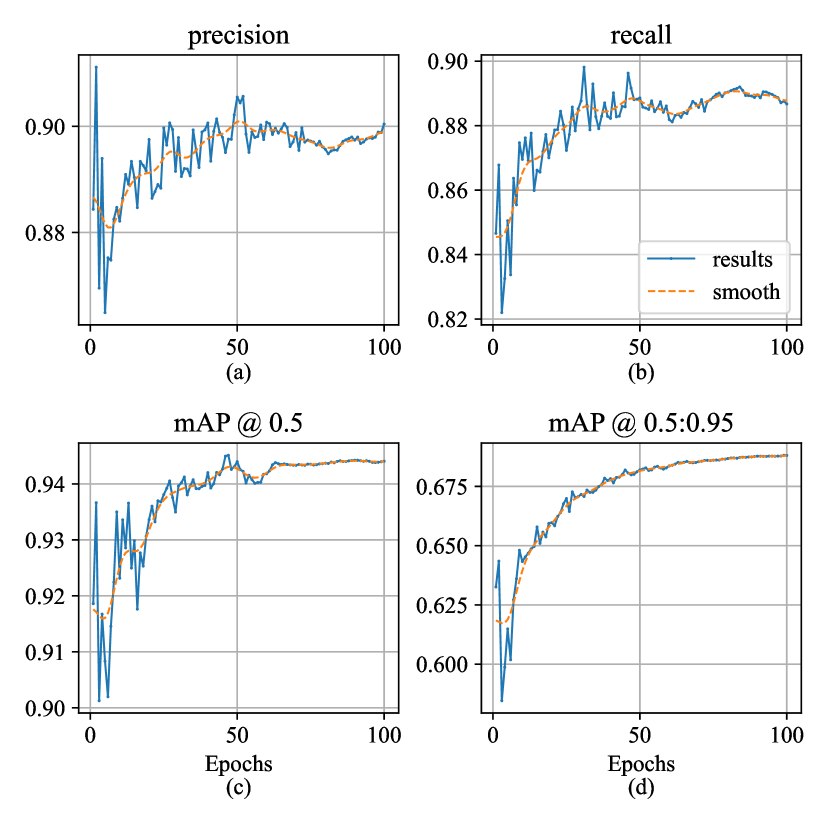
We evaluated the performance of three variants (nano, medium, large) of the YOLO v8 model on detecting worker and chair classes in an industrial test set. The medium model exhibited superior overall performance with 94.4% mAP@50, which is higher than both nano and large models with 1.8% and 0.6% respectively. Theoretically, the large model should have performed better due to more learnable parameters. However, as only two classes exist, more parameters can cause overfitting on the training set. Furthermore, a larger batch size helps better learning due to batch normalization as observed by [62, 63]. We present the evaluation results of different trained model types in Table III. In each column, items of the highest value are denoted in boldface. While the large model has a slightly better P and R on worker detection, it is compute-heavy. It takes 0.17 milliseconds (ms) more than the medium model on each frame, and it compounds up fairly when running in the real-time inference without adding significant value. Hence, we chose a medium model to conduct the analysis of the client’s manufacturing facility and get more insights into the productivity of each station. Figure 3 presents the training metrics of the medium model after each training epoch which represents mAP@50 is getting plateau after 65 epochs. P and R are always opposing metrics [64] and increasing P has affected the R as visible in the Figure 3 (a,b) so that’s why mAP provides a better measure to consider about the convergence of the model.
| Model Size | P (%) | R (%) | ||||
|---|---|---|---|---|---|---|
| All | Worker | Chair | All | Worker | Chair | |
| Nano | 89.2 | 84.4 | 93.9 | 87.1 | 86.0 | 88.2 |
| Medium | 89.9 | 85.4 | 94.4 | 88.8 | 89.5 | 88.0 |
| Large | 89.8 | 85.7 | 93.8 | 89.0 | 90.2 | 87.7 |
| Model Size | mAP50 (%) | mAP50-95 (%) | ||||
|---|---|---|---|---|---|---|
| All | Worker | Chair | All | Worker | Chair | |
| Nano | 92.6 | 91.7 | 93.5 | 64.7 | 64.8 | 64.6 |
| Medium | 94.4 | 93.8 | 95.0 | 68.8 | 69.7 | 68.0 |
| Large | 93.8 | 93.8 | 93.9 | 68.9 | 70.0 | 67.7 |
V Insights Into Manufacturing Facility
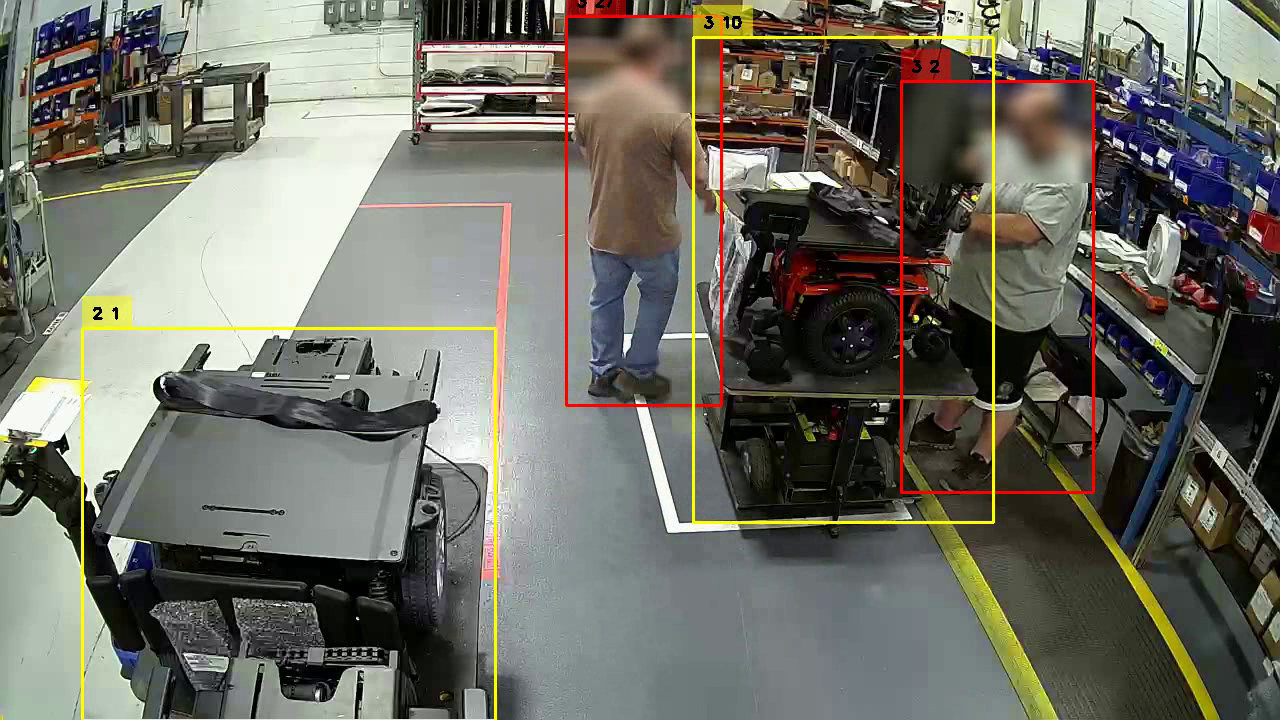
The synergistic combination of YOLO and our proposed framework aims to highlight the specific challenges faced by the client in manufacturing assistive medical wheelchairs based on OD, localization, and tracking throughout the production process. With permission from the existing workers in the clients’ facility, we strategically deployed cameras on the manufacturing floor to capture live video feeds for analysis. Figure 4 showcases the frame captured from an installed camera on-site with the view of a station where workers are assembling a chair.
V-A Challenges
The wheelchair manufacturing process commences with specifications from healthcare professionals tailored to individual patient needs. These specifications dictate the assembly at various stations, each manned by a dedicated worker. Despite a standard processing time at each station, delays are common due to labor shortages and workers having to move between stations. Communication gaps exacerbate these delays, especially with floor managers who may be unaware of inventory issues. Transition periods, notably during shift changes, create inefficiencies and bottlenecks, impeding the production timeline. The presence of faulty items in the production line necessitates additional quality control time, disrupting the manufacturing flow. The inability to promptly identify and address bottlenecks, as indicated by data from the Manufacturing Execution System (MES), further delays production. The MES data is often inaccurate, primarily reliant on manual worker input. Continuous manual time studies, while informative, are impractical and may lead to skewed productivity metrics.
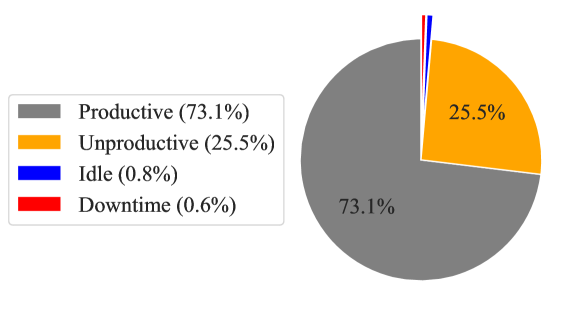
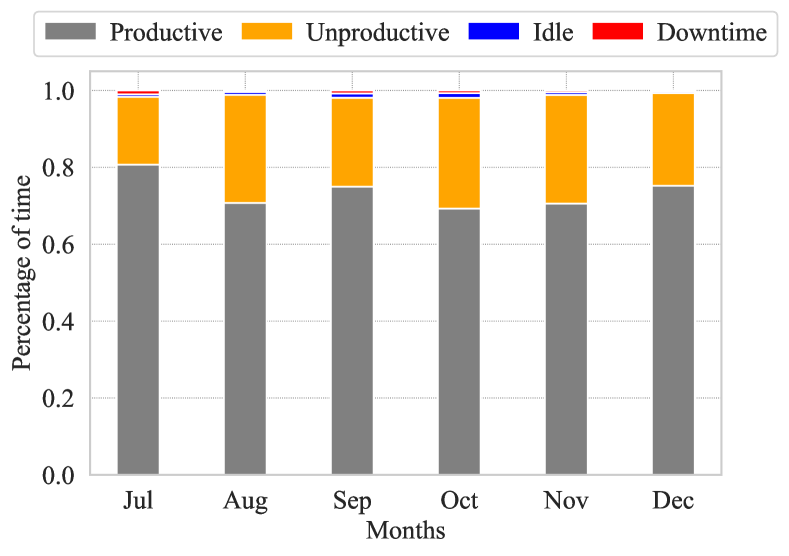
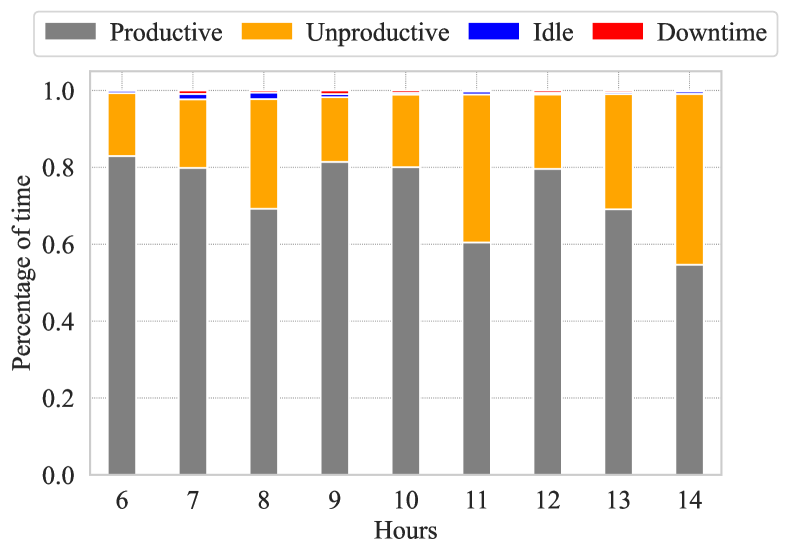
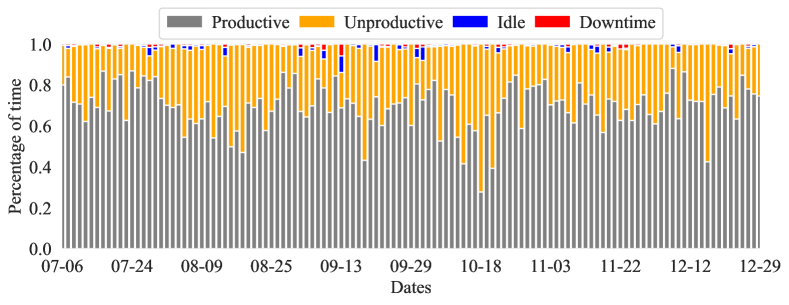
Given these challenges, we propose a non-invasive system for capacity constraint analysis. This system tracks the station and cycle time of chairs, allowing for effective labor and inventory planning. Over six months (July to December), we collected videos from four workstations (labeled Stations A, B, C, and D being the primary bottlenecks identified from MES data while Station C being the critical one), excluding three standard 25-minute break times. The facility works only for the morning shift, so data was collected for 8.5 hours daily. We detected workers and chairs using the trained YOLO v8 model, as outlined in Section III. Each frame’s status was aggregated to extract various metrics. Figure 7 shows that Station C is 27.9% unproductive, indicating a critical labor shortage with a high percentage. Figure 7 depicts normalized hourly productivity data. Notably, productivity is higher in the morning than in the afternoon. Figure 7 reveals a consistent trend in productivity over the months, contrary to the expected increase towards the year’s end due to high demand. This consistency points to a critical labor shortage. Figure 9 represents the daily insights into their capacity constraint. They are productive only for 60% to 65% of time during the 8.5 hours shift and the remaining time is mostly unproductive when a worker is not available at the station to work on the chair.
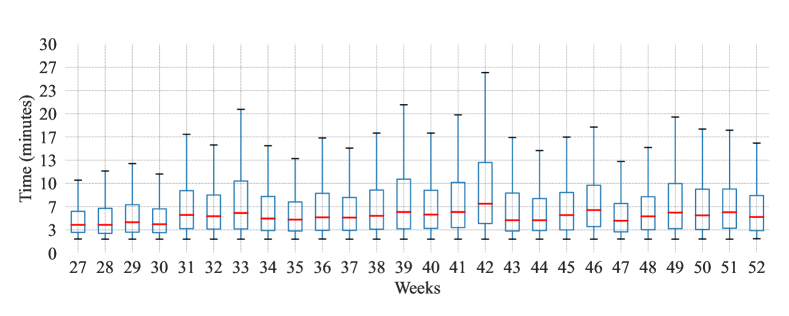
Further analysis of the life cycles of individual chairs is presented in Figure 9, where the box plot represents the five-number summary of the processing time of the chair each week. We have filtered out the processing time of less than two minutes due to the instances where a person is occluding the chair and the model is not able to detect it for a certain time. The tracker loses it and completes the life cycle and assigns a new id once the chair is visible assigning two distinct ID s for a same chair. It is evident that the median time (represented in red colored line) is reduced to 5 minutes on some days, while it also increases to 7.5 minutes (week 42), resulting in a 50% increase in processing time and a decrease in daily output. Upon manual verification of the video data, the worker in charge was on vacation on week 42 and another worker from a different station was taking care of the station. A similar trend is also visible during the days when a worker handles multiple stations or during a severe inventory (week 39).
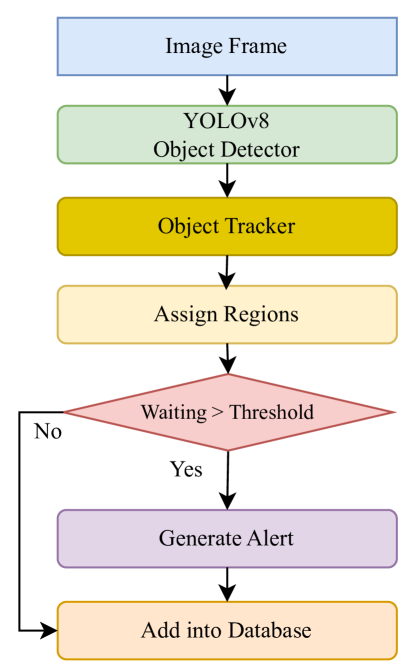
These insights are crucial for workflow optimization. They are most effective when applied in a production environment with real-time metrics and an alert system for increasing processing time, as mentioned in 2. This system would enable floor managers to promptly address issues, thereby improving efficiency and productivity. While promising and groundbreaking results, the application of OD in this context also presents limitations in terms of tracking, especially when there is an occlusion or overlapping objects in the frame in the form of a worker occluding the chair being worked on for a longer period of time making it not visible or a guest visiting the station to casually chat for an extended period inflates the results. The safeguards around this will be explored in future studies.
VI Conclusion
In this work, we implemented a non-invasive system for monitoring capacity constraints in manufacturing environments. Data was collected from four chair manufacturing assembly line stations over six months. After reviewing existing literature on OD, we propose a state-of-the-art end-to-end framework using YOLO v8 for object detection, providing insights into labor and inventory management, and revealing notable labor shortages and inefficiencies. The study underscores the importance of real-time metrics and alert systems in manufacturing environments to enhance efficiency and productivity. The overall productivity of Station C was calculated to be 70.6% only over the course of 6 months suggesting a significant potential for technological integration in optimizing manufacturing processes. For future studies, we plan to use the Large Multimodal Model (LMM)to provide predictive, transcriptive, and prescriptive insights from the collected data.
Acknowledgement
A special thanks to Dario Morle and Syeda Sitara Wishal Fatima from IFIVEO CANADA INC. for their helpful insights into the implemented methodology.
References
- [1] O. Causa, M. Abendschein, N. Luu, E. Soldani, and C. Soriolo, “The post-covid-19 rise in labour shortages,” OECD Economics Department Working Papers, no. 1721, 2022. [Online]. Available: https://www.oecd-ilibrary.org/content/paper/e60c2d1c-en
- [2] S. C. Government of Canada, “Analysis on labour challenges in canada, second quarter of 2023,” Jun. 2023, last Modified: 2023-06-22. [Online]. Available: https://www150.statcan.gc.ca/n1/pub/11-621-m/11-621-m2023009-eng.htm
- [3] L.-A. Bomal, “Labour shortage cfib.” [Online]. Available: https://www.cfib-fcei.ca/en/labour-shortage
- [4] R. Gervasi, F. Barravecchia, L. Mastrogiacomo, and F. Franceschini, “Applications of affective computing in human-robot interaction: State-of-art and challenges for manufacturing,” Proceedings of the Institution of Mechanical Engineers, Part B: Journal of Engineering Manufacture, vol. 237, no. 6-7, pp. 815–832, May 2023. [Online]. Available: http://journals.sagepub.com/doi/10.1177/09544054221121888
- [5] L. Poudel, S. Elagandula, W. Zhou, and Z. Sha, “Decentralized and centralized planning for multi-robot additive manufacturing,” Journal of Mechanical Design, vol. 145, no. 1, p. 012003, 2023, publisher: American Society of Mechanical Engineers. [Online]. Available: https://asmedigitalcollection.asme.org/mechanicaldesign/article-abstract/145/1/012003/1146431
- [6] L. Liu, Z. Zou, and R. L. Greene, “The effects of type and form of collaborative robots in manufacturing on trustworthiness, risk perceived, and acceptance,” International Journal of Human–Computer Interaction, pp. 1–14, Feb. 2023. [Online]. Available: https://www.tandfonline.com/doi/full/10.1080/10447318.2023.2169527
- [7] R. Pansara, “From fields to factories a technological odyssey in agtech and manufacturing,” International Journal of Managment Education for Sustainable Development, vol. 6, no. 6, pp. 1–12, 2023. [Online]. Available: https://ijsdcs.com/index.php/IJMESD/article/view/346
- [8] H. M. Ahmad and A. Rahimi, “Deep learning methods for object detection in smart manufacturing: A survey,” Journal of Manufacturing Systems, vol. 64, pp. 181–196, Jul. 2022. [Online]. Available: https://www.sciencedirect.com/science/article/pii/S0278612522001066
- [9] S. Puttemans, T. Callemein, and T. Goedemé, “Building robust industrial applicable object detection models using transfer learning and single pass deep learning architectures,” in Proceedings of the 13th International Joint Conference on Computer Vision, Imaging and Computer Graphics Theory and Applications. SCITEPRESS - Science and Technology Publications, 2018. [Online]. Available: http://dx.doi.org/10.5220/0006562002090217
- [10] J. Wang, P. Fu, and R. X. Gao, “Machine vision intelligence for product defect inspection based on deep learning and hough transform,” Journal of Manufacturing Systems, vol. 51, pp. 52–60, Apr. 2019.
- [11] J. Redmon and A. Farhadi, “Yolo9000: Better, faster, stronger,” in 2017 IEEE Conference on Computer Vision and Pattern Recognition (CVPR). IEEE, Jul. 2017, pp. 6517–6525.
- [12] F. Farahnakian, L. Koivunen, T. Mäkilä, and J. Heikkonen, “Towards autonomous industrial warehouse inspection,” in 2021 26th International Conference on Automation and Computing (ICAC), Sep. 2021, pp. 1–6.
- [13] T. Li, B. Huang, C. Li, and M. Huang, “Application of convolution neural network object detection algorithm in logistics warehouse,” The Journal of Engineering, vol. 2019, no. 23, pp. 9053–9058, 2019, _eprint: https://onlinelibrary.wiley.com/doi/pdf/10.1049/joe.2018.9180. [Online]. Available: https://onlinelibrary.wiley.com/doi/abs/10.1049/joe.2018.9180
- [14] R. Girshick, J. Donahue, T. Darrell, and J. Malik, “Rich feature hierarchies for accurate object detection and semantic segmentation,” in 2014 IEEE Conference on Computer Vision and Pattern Recognition. IEEE, Jun. 2014, pp. 580–587.
- [15] R. Girshick, “Fast r-cnn,” in Proceedings of the IEEE international conference on computer vision, 2015, pp. 1440–1448.
- [16] S. Ren, K. He, R. Girshick, and J. Sun, “Faster r-cnn: Towards real-time object detection with region proposal networks,” IEEE Transactions on Pattern Analysis and Machine Intelligence, vol. 39, no. 6, pp. 1137–1149, Jun. 2017.
- [17] W. Liu, D. Anguelov, D. Erhan, C. Szegedy, S. Reed, C.-Y. Fu, and A. C. Berg, SSD: Single Shot MultiBox Detector. Springer International Publishing, 2016, p. 21–37. [Online]. Available: http://dx.doi.org/10.1007/978-3-319-46448-0_2
- [18] J. Redmon, S. Divvala, R. Girshick, and A. Farhadi, “You only look once: Unified, real-time object detection,” in 2016 IEEE Conference on Computer Vision and Pattern Recognition (CVPR). IEEE, Jun. 2016, pp. 779–788.
- [19] J. Terven and D. Cordova-Esparza, “A comprehensive review of yolo: From yolov1 and beyond,” Oct. 2023, arXiv:2304.00501 [cs]. [Online]. Available: http://arxiv.org/abs/2304.00501
- [20] J. Redmon and A. Farhadi, “Yolov3: An incremental improvement,” in arXiv preprint arXiv:1804.02767. ArXiv, 2018.
- [21] T.-Y. Lin, P. Dollar, R. Girshick, K. He, B. Hariharan, and S. Belongie, “Feature pyramid networks for object detection,” in 2017 IEEE Conference on Computer Vision and Pattern Recognition (CVPR). IEEE, Jul. 2017, pp. 936–944.
- [22] A. Bochkovskiy, C.-Y. Wang, and H.-Y. M. Liao, “Yolov4: Optimal speed and accuracy of object detection,” ArXiv, vol. abs/2004.10934, 2020. [Online]. Available: https://api.semanticscholar.org/CorpusID:216080778
- [23] C.-Y. Wang, H.-Y. Mark Liao, Y.-H. Wu, P.-Y. Chen, J.-W. Hsieh, and I.-H. Yeh, “Cspnet: A new backbone that can enhance learning capability of cnn,” in 2020 IEEE/CVF Conference on Computer Vision and Pattern Recognition Workshops (CVPRW), Jun. 2020, pp. 1571–1580, iSSN: 2160-7516.
- [24] S. Liu, L. Qi, H. Qin, J. Shi, and J. Jia, “Path aggregation network for instance segmentation,” arXiv:1803.01534 [cs], Sep. 2018, arXiv: 1803.01534. [Online]. Available: http://arxiv.org/abs/1803.01534
- [25] S. Woo, J. Park, J.-Y. Lee, and I. S. Kweon, “Cbam: Convolutional block attention module,” in Proceedings of the European conference on computer vision (ECCV), 2018, pp. 3–19. [Online]. Available: http://openaccess.thecvf.com/content_ECCV_2018/html/Sanghyun_Woo_Convolutional_Block_Attention_ECCV_2018_paper.html
- [26] D. Misra, “Mish: A self regularized non-monotonic activation function,” arXiv:1908.08681 [cs, stat], Aug. 2020, arXiv: 1908.08681. [Online]. Available: http://arxiv.org/abs/1908.08681
- [27] Z. Zheng, P. Wang, W. Liu, J. Li, R. Ye, and D. Ren, “Distance-iou loss: Faster and better learning for bounding box regression,” in Proceedings of the AAAI conference on artificial intelligence, vol. 34, 2020, pp. 12 993–13 000, issue: 07. [Online]. Available: https://aaai.org/ojs/index.php/AAAI/article/view/6999
- [28] G. Jocher, A. Stoken, J. Borovec, NanoCode012, ChristopherSTAN, L. Changyu, Laughing, tkianai, A. Hogan, lorenzomammana, yxNONG, AlexWang1900, L. Diaconu, Marc, wanghaoyang0106, ml5ah, Doug, F. Ingham, Frederik, Guilhen, Hatovix, J. Poznanski, J. Fang, L. Y. , changyu98, M. Wang, N. Gupta, O. Akhtar, PetrDvoracek, and P. Rai, “ultralytics/yolov5: v3.1 - bug fixes and performance improvements,” Oct. 2020. [Online]. Available: https://zenodo.org/record/4154370/export/hx
- [29] S. Elfwing, E. Uchibe, and K. Doya, “Sigmoid-weighted linear units for neural network function approximation in reinforcement learning,” Nov. 2017, arXiv:1702.03118 [cs]. [Online]. Available: http://arxiv.org/abs/1702.03118
- [30] C. Li, L. Li, H. Jiang, K. Weng, Y. Geng, L. Li, Z. Ke, Q. Li, M. Cheng, W. Nie, Y. Li, B. Zhang, Y. Liang, L. Zhou, X. Xu, X. Chu, X. Wei, and X. Wei, “Yolov6: A single-stage object detection framework for industrial applications,” Sep. 2022, arXiv:2209.02976 [cs]. [Online]. Available: http://arxiv.org/abs/2209.02976
- [31] C.-Y. Wang, A. Bochkovskiy, and H.-Y. M. Liao, “Yolov7: Trainable bag-of-freebies sets new state-of-the-art for real-time object detectors,” in Proceedings of the IEEE/CVF Conference on Computer Vision and Pattern Recognition, 2023, pp. 7464–7475. [Online]. Available: http://openaccess.thecvf.com/content/CVPR2023/html/Wang_YOLOv7_Trainable_Bag-of-Freebies_Sets_New_State-of-the-Art_for_Real-Time_Object_Detectors_CVPR_2023_paper.html
- [32] C.-Y. Wang, H.-Y. M. Liao, and I.-H. Yeh, “Designing network design strategies through gradient path analysis,” Nov. 2022, arXiv:2211.04800 [cs]. [Online]. Available: http://arxiv.org/abs/2211.04800
- [33] X. Ding, X. Zhang, N. Ma, J. Han, G. Ding, and J. Sun, “Repvgg: Making vgg-style convnets great again,” in Proceedings of the IEEE/CVF conference on computer vision and pattern recognition, 2021, pp. 13 733–13 742. [Online]. Available: http://openaccess.thecvf.com/content/CVPR2021/html/Ding_RepVGG_Making_VGG-Style_ConvNets_Great_Again_CVPR_2021_paper.html
- [34] G. Jocher, A. Chaurasia, and J. Qiu, “Yolo by ultralytics,” URL: https://github. com/ultralytics/ultralytics, 2023. [Online]. Available: https://scholar.google.com/scholar?cluster=66001205780317853&hl=en&oi=scholarr
- [35] Z. Ge, S. Liu, F. Wang, Z. Li, and J. Sun, “Yolox: Exceeding yolo series in 2021,” arXiv:2107.08430 [cs], Aug. 2021, arXiv: 2107.08430. [Online]. Available: http://arxiv.org/abs/2107.08430
- [36] X. Li, W. Wang, L. Wu, S. Chen, X. Hu, J. Li, J. Tang, and J. Yang, “Generalized focal loss: Learning qualified and distributed bounding boxes for dense object detection,” Advances in Neural Information Processing Systems, vol. 33, pp. 21 002–21 012, 2020. [Online]. Available: https://proceedings.neurips.cc/paper/2020/hash/f0bda020d2470f2e74990a07a607ebd9-Abstract.html
- [37] I. J. Good, “Rational decisions,” Journal of the Royal Statistical Society: Series B (Methodological), vol. 14, no. 1, pp. 107–114, 1952, publisher: Wiley Online Library.
- [38] R. King, “Brief summary of yolov8 model structure - issue #189,” 2023, publication Title: GitHub repository. [Online]. Available: https://github.com/ultralytics/ultralytics/issues/189
- [39] N. Zendehdel, H. Chen, and M. C. Leu, “Real-time tool detection in smart manufacturing using you-only-look-once (yolo)v5,” Manufacturing Letters, vol. 35, pp. 1052–1059, Aug. 2023. [Online]. Available: https://www.sciencedirect.com/science/article/pii/S2213846323001190
- [40] M. Liu, Y. Chen, J. Xie, L. He, and Y. Zhang, “Lf-yolo: A lighter and faster yolo for weld defect detection of x-ray image,” IEEE Sensors Journal, vol. 23, no. 7, pp. 7430–7439, 2023, publisher: IEEE. [Online]. Available: https://ieeexplore.ieee.org/abstract/document/10054502/
- [41] J. Wang, H. Dai, T. Chen, H. Liu, X. Zhang, Q. Zhong, and R. Lu, “Toward surface defect detection in electronics manufacturing by an accurate and lightweight yolo-style object detector,” Scientific Reports, vol. 13, no. 1, p. 7062, 2023, publisher: Nature Publishing Group UK London. [Online]. Available: https://www.nature.com/articles/s41598-023-33804-w
- [42] C. Zhao, X. Shu, X. Yan, X. Zuo, and F. Zhu, “Rdd-yolo: A modified yolo for detection of steel surface defects,” Measurement, vol. 214, p. 112776, 2023, publisher: Elsevier. [Online]. Available: https://www.sciencedirect.com/science/article/pii/S0263224123003408
- [43] T.-T.-H. Vu, D.-L. Pham, and T.-W. Chang, “A yolo-based real-time packaging defect detection system,” Procedia Computer Science, vol. 217, pp. 886–894, Jan. 2023. [Online]. Available: https://www.sciencedirect.com/science/article/pii/S1877050922023638
- [44] Z. Zhao, X. Yang, Y. Zhou, Q. Sun, Z. Ge, and D. Liu, “Real-time detection of particleboard surface defects based on improved yolov5 target detection,” Scientific Reports, vol. 11, no. 1, p. 21777, Dec. 2021. [Online]. Available: https://www.nature.com/articles/s41598-021-01084-x
- [45] J. Hu, L. Shen, and G. Sun, “Squeeze-and-excitation networks,” in 2018 IEEE/CVF Conference on Computer Vision and Pattern Recognition. IEEE, Jun. 2018, pp. 7132–7141.
- [46] A. Rahimi, M. Anvaripour, and K. Hayat, “Object detection using deep learning in a manufacturing plant to improve manual inspection,” in 2021 IEEE International Conference on Prognostics and Health Management (ICPHM), Jun. 2021, pp. 1–7.
- [47] H. M. Ahmad, A. Rahimi, and K. Hayat, “Deep learning transforming the manufacturing industry: A case study,” in 2021 IEEE 23rd Int Conf on High Performance Computing &; Communications; 7th Int Conf on Data Science &; Systems; 19th Int Conf on Smart City; 7th Int Conf on Dependability in Sensor, Cloud &; Big Data Systems &; Application (HPCC/DSS/SmartCity/DependSys). IEEE, Dec. 2021. [Online]. Available: http://dx.doi.org/10.1109/HPCC-DSS-SmartCity-DependSys53884.2021.00196
- [48] Z. Liu and K. Ye, “Yolo-imf: An improved yolov8 algorithm for surface defect detection in industrial manufacturing field,” in Metaverse – METAVERSE 2023, ser. Lecture Notes in Computer Science, S. He, J. Lai, and L.-J. Zhang, Eds. Cham: Springer Nature Switzerland, 2023, pp. 15–28.
- [49] B. Luo, Z. Kou, C. Han, and J. Wu, “A “hardware-friendly” foreign object identification method for belt conveyors based on improved yolov8,” Applied Sciences, vol. 13, no. 20, p. 11464, Jan. 2023, number: 20 Publisher: Multidisciplinary Digital Publishing Institute. [Online]. Available: https://www.mdpi.com/2076-3417/13/20/11464
- [50] N. Ma, X. Zhang, H.-T. Zheng, and J. Sun, “Shufflenet v2: Practical guidelines for efficient cnn architecture design,” in Proceedings of the European conference on computer vision (ECCV), 2018, pp. 116–131. [Online]. Available: http://openaccess.thecvf.com/content_ECCV_2018/html/Ningning_Light-weight_CNN_Architecture_ECCV_2018_paper.html
- [51] G. Krummenacher, C. S. Ong, S. Koller, S. Kobayashi, and J. M. Buhmann, “Wheel defect detection with machine learning,” IEEE Transactions on Intelligent Transportation Systems, vol. 19, no. 4, pp. 1176–1187, Apr. 2018.
- [52] K. O’Brien and J. Humphries, “Object detection using convolutional neural networks for smart manufacturing vision systems in the medical devices sector,” Procedia Manufacturing, vol. 38, pp. 142–147, 2019.
- [53] H. Wei, M. Laszewski, and N. Kehtarnavaz, “Deep learning-based person detection and classification for far field video surveillance,” in 2018 IEEE 13th Dallas Circuits and Systems Conference (DCAS). IEEE, Nov. 2018, pp. 1–4.
- [54] C. Luo, L. Yu, E. Yang, H. Zhou, and P. Ren, “A benchmark image dataset for industrial tools,” Pattern Recognition Letters, vol. 125, pp. 341–348, Jul. 2019. [Online]. Available: https://www.sciencedirect.com/science/article/pii/S0167865519301606
- [55] E. M. Goldratt and J. Cox, The goal: a process of ongoing improvement. Routledge, 2016. [Online]. Available: https://books.google.com/books?hl=en&lr=&id=HyxLDQAAQBAJ&oi=fnd&pg=PT4&dq=Dr.+Eliyahu+Goldratt&ots=cpeo0icMBD&sig=sKLP6O9OGiQP9G0N9MIudfwM_LY
- [56] E. M. Goldratt, Theory of constraints. North River Croton-on-Hudson, 1990. [Online]. Available: http://brharnetc.edu.in/br/wp-content/uploads/2018/11/5.pdf
- [57] T.-Y. Lin, M. Maire, S. Belongie, L. Bourdev, R. Girshick, J. Hays, P. Perona, D. Ramanan, C. L. Zitnick, and P. Dollár, “Microsoft coco: Common objects in context,” Feb. 2015, arXiv:1405.0312 [cs]. [Online]. Available: http://arxiv.org/abs/1405.0312
- [58] A. Neubeck and L. Van Gool, “Efficient non-maximum suppression,” in 18th International Conference on Pattern Recognition (ICPR’06), vol. 3, Aug. 2006, pp. 850–855, iSSN: 1051-4651.
- [59] I. Loshchilov and F. Hutter, “Sgdr: Stochastic gradient descent with warm restarts,” 5th International Conference on Learning Representations, ICLR 2017 - Conference Track Proceedings, Aug. 2016, publisher: International Conference on Learning Representations, ICLR. [Online]. Available: https://arxiv.org/abs/1608.03983v5
- [60] N. Wojke, A. Bewley, and D. Paulus, “Simple online and realtime tracking with a deep association metric,” Proceedings - International Conference on Image Processing, ICIP, vol. 2017-Septe, pp. 3645–3649, Mar. 2017, publisher: IEEE Computer Society. [Online]. Available: https://arxiv.org/abs/1703.07402v1
- [61] C. K. Chui and G. Chen, “Kalman filtering with real-time applications,” Springer Series in Information Sciences, 1987. [Online]. Available: http://dx.doi.org/10.1007/978-3-662-02508-6
- [62] Y. You, I. Gitman, and B. Ginsburg, “Large batch training of convolutional networks,” Sep. 2017, arXiv:1708.03888 [cs] version: 3. [Online]. Available: http://arxiv.org/abs/1708.03888
- [63] N. Bjorck, C. P. Gomes, B. Selman, and K. Q. Weinberger, “Understanding batch normalization,” in Advances in Neural Information Processing Systems, vol. 31. Curran Associates, Inc., 2018. [Online]. Available: https://proceedings.neurips.cc/paper/2018/hash/36072923bfc3cf47745d704feb489480-Abstract.html
- [64] D. Powers, “Evaluation: From precision, recall and f-measure to roc, informedness, markedness and correlation,” Journal of Machine Learning Technologies, vol. 2, no. 1, pp. 37–63, 2011.
![[Uncaptioned image]](/html/2402.00243/assets/imgs/headshots/mahmad.jpg) |
Hafiz Mughees Ahmad completed his Bachelor’s and Master’s in Electrical Engineering from the Institute of Space Technology, Pakistan, in 2015 and 2018, respectively. He is currently pursuing a Ph.D. at the University of Windsor, Canada. Alongside his studies, he serves as a Deep Learning Engineer at IFIVEO CANADA INC. His previous roles include Research Associate at Istanbul Medipol University, Turkey, and Lecturer at the Institute of Space Technology, Pakistan. His research focuses on Computer Vision and Deep Learning, with applications in OD and real-time surveillance and monitoring in the production environment. He is a Graduate Student Member of IEEE. |
![[Uncaptioned image]](/html/2402.00243/assets/imgs/headshots/arahimi.jpg) |
Afshin Rahimi received his B.Sc. degree from the K. N. Toosi University of Technology, Tehran, Iran, in 2010, and the M.Sc. and Ph.D. degrees from Toronto Metropolitan University, Toronto, ON, Canada, in 2012, and 2017, respectively, in Aerospace Engineering. He was with Pratt & Whitney Canada from 2017 to 2018. Since 2018, he has been an Associate Professor in the Department of Mechanical, Automotive, and Materials Engineering at the University of Windsor, Windsor, ON, Canada. Since 2010, he has been involved in various industrial research, technology development, and systems engineering projects/contracts related to the control and diagnostics of satellites, UAVs, and commercial aircraft subsystems. In recent years, he has also been involved with industrial automation and using technologies to boost manual labor work in industrial settings. He is a senior member of IEEE, a lifetime member of AIAA, and a technical member of the PHM Society. |
![[Uncaptioned image]](/html/2402.00243/assets/imgs/headshots/khayat.jpg) |
Khizer Hayat is the co-founder and Chief Technology Officer at i-5O. He is a Forbes 30 under 30 entrepreneur and has been working with enterprise startups for over 7 years. Currently, he leads product development at IFIVEO CANADA INC. His educational background is in AI and Robotics, having graduated with a Master’s from the University of Pennsylvania. Previously, he spent 4+ years optimizing production processes using automation at Toyota Motor Corporation and Schlumberger Technology Corporation. He loves traveling and outdoor activities and is an avid Arsenal fan in his free time. |