Strain-Induced Speed-Up of Mn2+ Spin-Lattice Relaxation in (Cd,Mn)Te/(Cd,Mg)Te Quantum Wells: A Time-Resolved ODMR Study
Abstract
This study examines the spin-lattice relaxation rate of Mn2+ ions in strained diluted magnetic semiconductor (Cd,Mn)Te/(Cd,Mg)Te quantum wells using the optically detected magnetic resonance (ODMR) technique. By adjusting the magnesium (Mg) content in the buffer layer, we created samples with different strain levels. Our time-resolved ODMR results show that the spin-lattice relaxation time becomes faster as strain increases. We also found that the relaxation rate increases with both magnetic field and temperature, showing a power-law behavior. To understand these observations, we used a theoretical model based on six-level rate equations with non-equal level separations. This model suggests that the main factor affecting relaxation in our samples is a "direct" mechanism. The model’s predictions match well with our experimental data. Overall, our findings give insights into spin-lattice relaxation in strained quantum wells and could be important for the development of future quantum and spintronic devices.
I INTRODUCTION
Understanding spin-lattice relaxation mechanisms is of paramount importance for potential applications in quantum and spintronic devicesNorambuena et al. (2018); Debus et al. (2016); Koenraad and Flatté (2011); Preskill (1998). In this study, we aim to investigate the impact of strain in the crystal lattice surrounding magnetic ions on their spin relaxation. Our focus is on (Cd,Mn)Te/(Cd,Mg)Te quantum wells with incorporated low density of Mn2+ ions, which provide an intermediate system between quantum dots and bulk crystals, enabling us to explore the strain dependence.
| sample no. | buffer Mg (%) | barrier Mg (%) | QW Mn (%) | (‰) |
|---|---|---|---|---|
| UW1029 | 30.7 | 30.7 | 0.30 | 3.21 |
| UW1030 | 21.2 | 21.2 | 0.31 | 2.31 |
| UW1031 | 0.0 | 21.2 | 0.26 | 0.32 |
When studying crystals doped with magnetic ions, it is crucial to consider that even at very low dopant concentrations, a single paramagnetic ion or a spin system cannot be treated as completely isolated from its environmentLarson et al. (1988). The investigated system experiences constant energy exchange processes between the magnetic ions and the generalized thermal reservoirStandley and Vaughan (1969). This reservoir comprises lattice phonon vibrations (phonon excitations of the crystal), carriers, and the crystal environment (e.g., helium bath), all of which can affect the availability of relaxation pathways. Consequently, an ion in an excited state (e.g., due to the absorption of radiation) gradually loses the previously absorbed energy over time and returns to the equilibrium. The most common relaxation process in our system is the direct process mechanism Abragam and Bleaney (1970), also known as the spin-flip process. This process involves a change in the spin projection (transition between energy levels resulting from an external magnetic field splitting due to the emission or absorption of a single phonon from or into the crystal lattice Culvahouse et al. (1963).
Spin-lattice relaxation has been extensively studied in various diluted magnetic semiconductor (DMS) systems. These include bulk crystals Strutz et al. (1992, 1993); Witowski et al. (1995), quantum well systems Yakovlev et al. (2004); Ivanov et al. (2008), and lower-dimensional nanostructures Hundt et al. (2005); Tolmachev et al. (2020). A range of techniques has been employed to investigate the time-dependent magnetic properties of these systems. These include infrared laser pulse induced electron spin resonance Strutz et al. (1993), photocarrier-induced heating effects in quantum dots Hundt et al. (2005), phonon-induced variations in photoluminescence intensity Scherbakov et al. (2004), and time-resolved Faraday rotation Crooker et al. (1997). Among these methods, Optically Detected Magnetic Resonance (ODMR) Geschwind et al. (1959); Komarov et al. (1977); Godlewski et al. (2008); Ivanov et al. (2008); Tolmachev et al. (2012) stands out. Its high spatial resolution and sensitivity are particularly advantageous for our study, as they allow us to specifically target and analyze the small volume of the sample where strain and magnetic ions are present.
II SAMPLES, EXPERIMENTAL SETUP AND METHODS
II.1 Samples with controlled deformation in QW layer
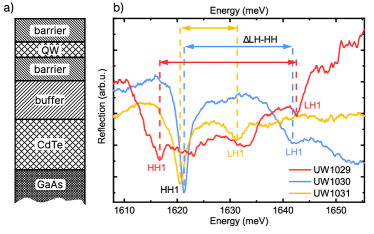
The samples studied in this paper consist of quantum wells (QWs) created by the molecular beam epitaxy (MBE) method. Different strains in the samples (as well as deformation ) were achieved by modifying the magnesium content in the buffer and barrier layers. Detailed characterization of the presented samples (UW1029, UW1030, UW1031) can be found in the article Bogucki et al. (2022), therefore here we describe them only briefly. The representative scheme for all used samples is illustrated in Fig. 1a), and the composition of each layer is described in Table 1. The samples were grown on GaAs substrates, and a CdTe layer of 4 m thickness was grown on top of the substrate for decoupling from the GaAs lattice constantCibert et al. (1990, 1991). A (Cd, Mg)Te buffer layer of 2 m (larger than the critical thickness of (Cd, Mg)Te Waag et al. (1993); Gerthsen et al. (1994)) was used to govern the strain in the samples, and thin (Cd, Mg)Te barriers of 50 nm (smaller than the critical thickness) were incorporated. We have determined the magnesium content using magnesium fluxes and reflectance measurements Hartmann et al. (1996); LeBlanc et al. (2017). The thickness of the (Cd, Mn)Te quantum wells (QWs) was selected at 10 nm, which is well below the critical thickness of CdTe lattice relaxation Cibert et al. (1990, 1991). Such a choice ensured good confinement and the appearance of narrow excitonic features. The modified Brillouin function was fitted to the giant Zeeman splitting to verify the manganese (Mn) content Gaj et al. (1994). We identified the reflectance spectrum features, including the assignment of heavy-hole excitonic states and light-hole excitonic states, using standard magneto-optical measurements Kossacki et al. (1997); Kossacki (2003); Kossacki et al. (2004). The reflectivity spectra of the samples, revealing identified features, are shown in Fig. 1b. The energy of the spectrum features confirms the designed strain in the samples. Moreover, XRD measurements have further verified the corresponding deformation values as described in Bogucki et al., 2022.
II.2 Time-resolved ODMR
Optically Detected Magnetic Resonance (ODMR) is a method based on the interaction of photo-created carriers and magnetic ions in a sample. Microwave radiation of constant frequency is delivered to the sample, placed within a constant external magnetic field. When the energy at a specific microwave frequency resonates with a paramagnetic transition at a particular magnetic field, paramagnetic resonance occurs, leading to a decrease in the net magnetization of the sample.
The decrease in magnetization, caused by paramagnetic resonance, is detectable as a change in the optical spectrum due to the exchange interaction between photo-generated carriers and magnetic spins. The ODMR method offers spatial resolution and sensitivity, probing only a small part of the sample (excitation laser was focused on the sample resulting in spot with approximately 100 m in diameter) and the thin Quantum Well (QW) where the magnetic ions are present (10 nm).
The difference in the optical spectrum at resonant conditions, compared to the spectrum measured without microwave radiation, is defined as the ODMR signal. In this study, time-resolved ODMR was used, employing pulsed microwave radiation and pulsed optical excitation/probing of samples. The microwave pulse period was 14 ms with a pulse width of 2 ms, and the optical probing pulse had the same period of 14 ms with a duration of 0.5 ms.
By changing the delay between the microwave and light pulses, the relaxation curve of the magnetic ions could be reconstructed. This method allows for the measurement of the dynamics of the ODMR signal, and therefore the spin-lattice relaxation rate of Mn2+ ions in CdTe QWs. During the experiments excitation power density of the laser was below 0.01 W/cm2 – low enough to avoid heating the lattice of the sample, as evidenced by lack of detectable redshift of the spectrumKeller et al. (2001).
A well-established method of obtaining high values of microwave radiation at the position of the sample is by using a microwave cavity, commonly employed in EPR measurements. However, this approach is not ideal for optical studies, as optical access to the sample becomes challenging. Moreover, the resonant microwave cavity is typically optimized for a limited number of frequencies. Therefore, in this work, we utilize a sample holder based on printed circuit boards, which effectively creates a closed loop of copper ribbon around the sample. This ensures the correct orientation (perpendicular) of the magnetic component of the microwave radiation with respect to the static magnetic field and the optical axis direction. The employed sample holder yields a robust ODMR signal across a wide range of microwave frequencies – we have tested it from 12 to 42 GHz.
III RESULTS
III.1 Time-resolved ODMR measurements
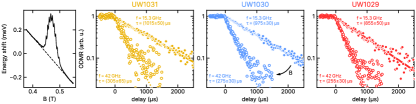
FIG. 2 presents the ODMR relaxation curves obtained for the measured samples, where deformation present in the QW increases from the left panel (sample UW1031) to the right panel (sample UW1029). The horizontal axis depicts the delay between the MW pulse and the light probing pulse, whereas the vertical axis represents the normalized ODMR signal amplitude. Each panel consists of two decay curves: the filled circles correspond to a MW frequency of 15.3 GHz, which is in tune with the resonant magnetic field of 0.547 T. The empty circles were obtained at a MW frequency of 42 GHz, resonating with a magnetic field of 1.5 T. It is evident that the relaxation time is shorter at higher magnetic fields (characteristic decay time approximately 0.3 ms at a higher magnetic field and around 1 ms for a lower magnetic field) for all samples. The results showcased in FIG. 2 were recorded at a temperature of 1.6 K (pumped helium bath).
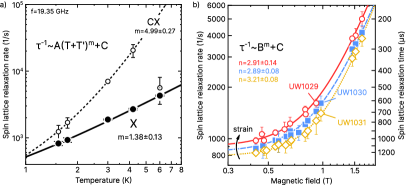
Since the relaxation rate is highly temperature-dependent, we measured its variation with temperature for sample UW1467, which contains 23% of Mg in the barrier and buffer, and 0.27% of Mn in the QW. The UW1467 sample bears a close resemblance in construction to UW1029. It was selected for temperature-dependent measurements owing to its exceedingly narrow excitonic line of approximately 1.2 meV. Minimizing line width is crucial because of line broadening at elevated temperatures; starting with the narrowest possible lines facilitated the identification of the ODMR signal at higher temperatures. The acquired spin-relaxation rates are depicted in the left panel of FIG. 3. The observed spin-lattice relaxation rate temperature dependence aligns well with the power law , where and the exponent is ascertained for the neutral exciton, implying that the relaxation is governed by a "direct" mechanism involving a single phonon since the exponent is near 1. A similar analysis can be performed for the ODMR signal derived from the charged exciton line. In this case to achieve a satisfactory fit, the phenomenological temperature shift of was added, eventually deriving an exponent for the charged exciton as . Due to the low signal-to-noise ratio, the 6 K point sourced from the charged exciton line (open circle marked with a black dot inside) was excluded from the fitting process. The difference in the measured rate has profound consequences, proving that magnetic ions probed by the charged exciton are not the same as those probed by the neutral exciton and that carriers plays an important role in the relaxation process. This observation will be elaborated upon in the IV section.
Additional information about the spin-lattice interaction may be retrieved from time-resolved ODMR measurements at different values of external magnetic field. The range of magnetic fields that were used during the experiments was limited by our microwave setup that covers frequency ranges of 12–27 GHz and 42–47 GHz which corresponds to resonant magnetic fields (for typical Mn2+ g-factor) 0.428–0.963 T and 1.5–1.68 T respectively.
The spin-lattice relaxation rates as a function of resonant magnetic field for measured samples are presented on right panel of FIG. 3 with empty symbols. Obtained spin-lattice relaxation rate dependencies are well described by formula , where , and are free parameters. The extracted exponents yield , , for samples UW1029, UW1030 and UW1031, respectively. All exponents are close to the value 3. Similar dependencies discussed in the literature provide values of 2, 4, 5 for different ions and experimental conditions Baker and Ford (1964); Strutz et al. (1992). At this stage, obtained in this work experiment exponent 3 is not easy to interpret. However, as it is shown in section III.2, this value in combination with numerical modelling of the system, gives additional evidence that the main spin-lattice relaxation mechanism involves only one phonon.
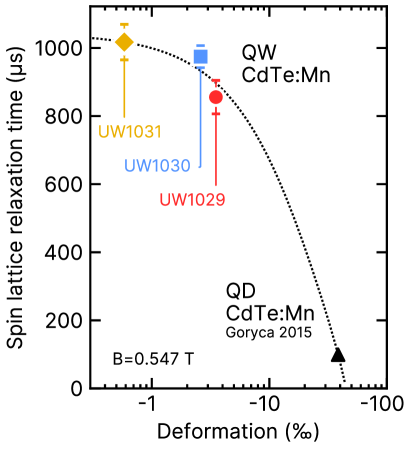
Interestingly, the fitted curves (red line, blue dashed line, orange dotted line) reveal systematic shift following the strain value present in quantum well layer. This is more clearly seen in FIG. 4 where spin-lattice relaxation time is presented as a function of deformation that is present in the QW layer. The thin dotted line is added as a guide for the eye. The spin-lattice relaxation is faster for Mn2+ ions incorporated in more strained CdTe material. The black triangle is spin-lattice relaxation time obtained for the CdTe/ZnTe quantum dot containing single Mn2+ ionGoryca et al. (2015). In such a quantum dot the deformation is calculated as lattice mismatch between the CdTe and ZnTe materials.
III.2 Numerical simulations
We aim to understand the observed data through modeling the spin-lattice relaxation in (Cd,Mn)Te/(Cd,Mg)Te quantum wells, using an adapted version of A. Witowski’s model Witowski (1992). The main assumption of this model is the "direct" relaxation mechanism, where only one phonon is involved, neglecting weak interactions with the nuclear spin. This simplifies the Mn2+ system to six energy levels corresponding to the electron spin projections on the quantization axis determined by the magnetic field, with deformation effects reflected by the axial term of the spin-Hamiltonian (parameter – see FIG. 5a and FIG. 5b). The simplified spin Hamiltonian is given by:
| (1) |
where manganese electronic spin , is Bohr magneton, is g-factor of manganese ion, and is the axial zero-field splitting (ZFS) parameter ( is also called the strain-induced axial-symmetry parameter)Abragam and Bleaney (1970). Parameter can be translated into deformation using spin-lattice coupling parameter neV, as presented in ref. Bogucki et al., 2022. In the case of studied QWs the sign of deformation is opposite to the sign of the spin Hamiltonian parameter Qazzaz et al. (1995).
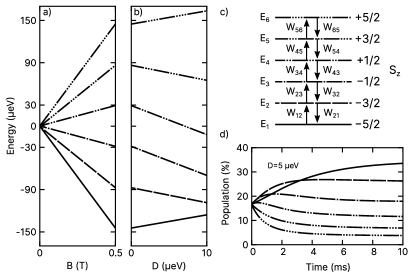
The kinetic model describes the temporal evolution of the occupancies of the six energy levels. The rate coefficients and governing the transitions between levels are derived from the energy differences between the levels and Boltzmann factors – see FIG. 5 c) – with expressions for and given as:
| (2) | ||||
| (3) |
Here, represents the energy of level , and is the Boltzmann factor associated with temperature , are numerical constants Witowski (1993). The energy spacing between levels and is given by:
| (4) |
We consider only dipole transitions, which change spin projection by . An example of the evolution of level populations is presented in FIG. 5 d). We then calculate the evolution of the mean spin value’s, which is approximated by a monoexponential decay Witowski (1992), with the characteristic decay time being the spin-lattice relaxation time.
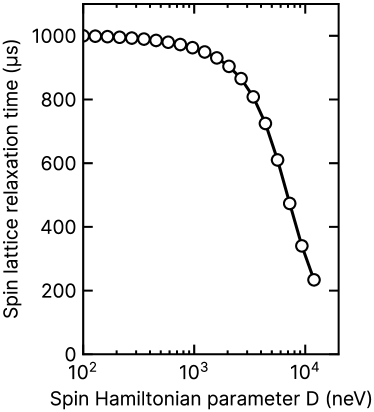
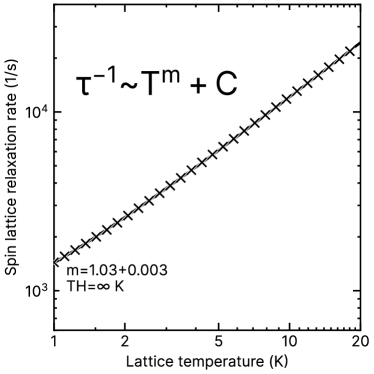
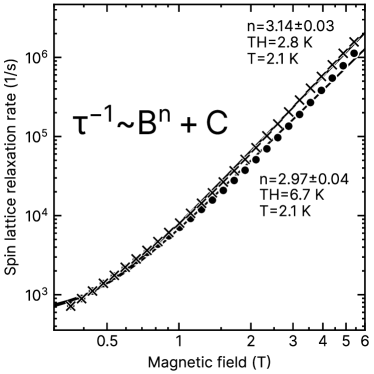
Values of spin-lattice relaxation times obtained, from such procedure, for multiple values of strain-related spin Hamiltonian parameter are shown in FIG. 6. The spin-lattice relaxation time becomes shorter with increasing strain-related spin Hamiltonian parameter . This behavior is in good agreement with measured dependence presented in FIG. 4. Moreover, similar simulations were performed as a function of the lattice temperature and magnetic field. Obtained dependencies of spin-relaxation rate are also in agreement with measured data and are presented in appendix (FIG. 7 and FIG. 8).
IV DISCUSSION, SUMMARY and CONCLUSIONS
It’s worth noting that the sensitivity of ODMR measurements is inherently temperature-dependent, as the ODMR signal is based on the Giant Zeeman effect. The amplitude of the Giant Zeeman effect decreases as the temperature of the system rises – this is a result of the decreasing net magnetization of the sample. Therefore, the practical upper limit of temperatures at which ODMR was measurable in our experimental setup was close to 6 K. The maximum ODMR amplitude for the neutral excitonic line at 6 K was 50 eV. The analogous value for the signal extracted from the charged exciton was 30 eV with a standard deviation of 8.5 eV. The obtained temperature dependence of the spin-relaxation rate for the neutral exciton strongly suggests a one-phonon relaxation mechanism. The spin-relaxation rate obtained from the charged exciton shows a much stronger dependence on temperature. One explanation for this observation could be that charged excitons are probing different populations of manganese ions. One can imagine local, submicrometer-scale spatial fluctuations of potential, where a charged exciton forms more frequently. The manganese ions located in such a charged area may have more possibilities of transferring energy to the crystal-lattice, as more quasiparticles are involved. Therefore, in case of manganese ions interacting with charged exciton the temperature exponent of the spin-lattice relaxation rate may be greater than 1. During the experiments laser spot had a diameter of approximately 100 m resulting in clear visibility of both charged and neutral excitons. In our case both the charged and neutral exciton exhibited resonance at the same magnetic field – we do not observe excitonic Knight shift Story et al. (1996); König et al. (2000); Teran et al. (2003); König and MacDonald (2003).
The model presented in section III.2, which assumes a one-phonon scattering mechanism, reproduces all observed trends: spin-lattice relaxation vs temperature, vs magnetic field, and vs deformation. However, the obtained exponent is not common in the literature in the context of the direct spin-lattice relaxation mechanism. This discrepancy can be attributed to the energy regimes at which the measurements were taken. In this work, the energy splittings corresponding to the paramagnetic resonance and zero field splitting are of the same order as the thermal energy. This is evident in FIG. 5d). In equilibrium, the most occupied level is the lowest energy level (solid curve). Yet, in a steady state, the highest energy level (marked by a line interrupted by four dots) still has a non-zero occupation, close to 4%. As a result, it’s challenging to provide an easily approximated analytical solution, as is typically presented in literature Baker and Ford (1964); Standley and Vaughan (1969); Abragam and Bleaney (1970); Strutz et al. (1992); Witowski (1993) for high-magnetic field, low-temperature regime, or for low-magnetic field, high-temperature regime.
Similarly, observed speed-up of spin-lattice relaxation rate of Mn2+ ions (despite the vanishing orbital momentum of manganese 2+ ion) originates from evolution of manganese energy levels due to the zero-field-splitting term – FIG. 5b). As the deformation increases, the lower states move closer together resulting in stronger coupling with available phonons. Again this unexpected outcome is a result of energy scales present in the system – energy levels shifts are comparable with shift caused by Zeeman splitting.
In summary in this work we presented systematic study of spin-lattice relaxation rate measured by time-resolved optically detected magnetic resonance (ODMR) on (Cd,Mn)Te/(Cd, Mg)Te MBE-grown quantum wells. We controlled the strain of Mn-doped QW layer by choosing the magnesium content present in the buffer layer and barrier layers. We observed that spin-lattice relaxation rate increases as the deformation present in the quantum well increases. The spin-lattice relaxation rate dependence vs magnetic field and temperature combined with numerical modelling suggest that direct process is a dominant mechanism responsible for energy transfer from Mn2+ spins system to the CdTe crystal lattice.
V Acknowledgements
We would like to thank Prof. Andrzej Witowski for fruitful discussions, and Zuzanna Śnioch for help in the measurements. This work was supported by the Polish National Science Centre under Decisions No. DEC-2016/23/B/ST3/03437, No. DEC-2020/38/E/ST3/00364, No. DEC-2020/39/B/ST3/03251 and No. 2021/41/B/ST3/04183.
Appendix A Temperature- and magnetic-dependent simulated spin lattice relaxation rate
References
- Norambuena et al. (2018) A. Norambuena, E. Muñoz, H. T. Dinani, A. Jarmola, P. Maletinsky, D. Budker, and J. R. Maze, Spin-lattice relaxation of individual solid-state spins, Physical Review B 97, 094304 (2018).
- Debus et al. (2016) J. Debus, V. Y. Ivanov, S. M. Ryabchenko, D. R. Yakovlev, A. A. Maksimov, Y. G. Semenov, D. Braukmann, J. Rautert, U. Löw, M. Godlewski, A. Waag, and M. Bayer, Resonantly enhanced spin-lattice relaxation of Mn2+ ions in diluted magnetic (Zn,Mn)Se/(Zn,Be)Se quantum wells, Physical Review B 93, 195307 (2016).
- Koenraad and Flatté (2011) P. M. Koenraad and M. E. Flatté, Single dopants in semiconductors, Nature Materials 10, 91 (2011).
- Preskill (1998) J. Preskill, Reliable quantum computers, Proceedings of the Royal Society of London. Series A: Mathematical, Physical and Engineering Sciences 454, 385 (1998).
- Larson et al. (1988) B. E. Larson, K. C. Hass, H. Ehrenreich, and A. E. Carlsson, Theory of exchange interactions and chemical trends in diluted magnetic semiconductors, Physical Review B 37, 4137 (1988).
- Standley and Vaughan (1969) K. J. Standley and R. A. Vaughan, Electron Spin Relaxation Phenomena in Solids (Springer US, Boston, MA, 1969), ISBN 978-1-4899-6251-5 978-1-4899-6539-4.
- Abragam and Bleaney (1970) A. Abragam and B. Bleaney, Electron paramagnetic resonance of transition ions, Oxford classic texts in the physical sciences (Oxford University Press, Oxford, 1970), ISBN 978-0-19-965152-8.
- Culvahouse et al. (1963) J. W. Culvahouse, W. P. Unruh, and D. K. Brice, Direct Spin-Lattice Relaxation Processes, Physical Review 129, 2430 (1963).
- Strutz et al. (1992) T. Strutz, A. M. Witowski, and P. Wyder, Spin-lattice relaxation at high magnetic fields, Physical Review Letters 68, 3912 (1992).
- Strutz et al. (1993) T. Strutz, A. M. Witowski, and P. Wyder, Observation on the high-magnetic-field electron-spin resonance of Te, Physical Review B 48, 17580 (1993).
- Witowski et al. (1995) A. M. Witowski, T. Strutz, C. Kutter, and P. Wyder, Magnetization and spin-lattice relaxation in semimagnetic semiconductors at high magnetic fields, Physica B: Condensed Matter 211, 372 (1995).
- Yakovlev et al. (2004) D. R. Yakovlev, M. Kneip, A. A. Maksimov, I. I. Tartakovskii, M. Bayer, D. Keller, W. Ossau, L. W. Molenkamp, A. V. Scherbakov, A. V. Akimov, and A. Waag, Spin and energy transfer between magnetic ions and freecarriers in diluted-magnetic semiconductor heterostructures, physica status solidi (c) 1, 989 (2004).
- Ivanov et al. (2008) V. Y. Ivanov, M. Godlewski, D. R. Yakovlev, M. K. Kneip, M. Bayer, S. M. Ryabchenko, and A. Waag, Optically detected magnetic resonance in (Zn,Mn)Se/(Zn,Be)Se quantum wells, Physical Review B 78 (2008).
- Hundt et al. (2005) A. Hundt, J. Puls, A. V. Akimov, Y. H. Fan, and F. Henneberger, Photocarrier-induced spin heating and spin-lattice relaxation in diluted magnetic Stranski-Krastanov quantum dots, Physical Review B 72, 033304 (2005).
- Tolmachev et al. (2020) D. O. Tolmachev, V. Yu. Ivanov, D. R. Yakovlev, E. V. Shornikova, B. Witkowski, S. Shendre, F. Isik, S. Delikani, H. Volkan Demir, and M. Bayer, Optically detected magnetic resonance in CdSe/CdMnS nanoplatelets, Nanoscale 12, 21932 (2020).
- Scherbakov et al. (2004) A. V. Scherbakov, A. V. Akimov, D. R. Yakovlev, W. Ossau, L. Hansen, A. Waag, and L. W. Molenkamp, Spin-lattice relaxation in heteromagnetic nanostructures, physica status solidi (c) 1, 2852 (2004).
- Crooker et al. (1997) S. A. Crooker, D. D. Awschalom, J. J. Baumberg, F. Flack, and N. Samarth, Optical spin resonance and transverse spin relaxation in magnetic semiconductor quantum wells, Physical Review B 56, 7574 (1997).
- Geschwind et al. (1959) S. Geschwind, R. J. Collins, and A. L. Schawlow, Optical Detection of Paramagnetic Resonance in an Excited State of in , Physical Review Letters 3, 545 (1959).
- Komarov et al. (1977) A. V. Komarov, S. Ryabchenko, O. Terletskii, and I. Zheru, Magneto-optical investigations of the exciton band in CdTe:Mn2+, Journal of Experimantal and Theoretical Physics 46, 318 (1977).
- Godlewski et al. (2008) M. Godlewski, V. Y. Ivanov, and S. Yatsunenko, Dynamics of spin interactions in Mn2+ doped CdMnTe semiconductors studied with optically detected magnetic resonance, Optical Materials 30, 669 (2008).
- Tolmachev et al. (2012) D. O. Tolmachev, A. S. Gurin, N. G. Romanov, A. G. Badalyan, R. A. Babunts, P. G. Baranov, B. R. Namozov, and Y. G. Kusrayev, Optically detected magnetic resonance of Mn-related excitations in (Cd,Mn)Te quantum wells, JETP Letters 96, 231 (2012).
- Bogucki et al. (2022) A. Bogucki, M. Goryca, A. Łopion, W. Pacuski, K. E. Połczyńska, J. Z. Domagała, M. Tokarczyk, T. Fąs, A. Golnik, and P. Kossacki, Angle-resolved optically detected magnetic resonance as a tool for strain determination in nanostructures, Physical Review B 105, 075412 (2022).
- Cibert et al. (1990) J. Cibert, Y. Gobil, L. S. Dang, S. Tatarenko, G. Feuillet, P. H. Jouneau, and K. Saminadayar, Critical thickness in epitaxial CdTe/ZnTe, Applied Physics Letters 56, 292 (1990).
- Cibert et al. (1991) J. Cibert, R. André, C. Deshayes, G. Feuillet, P. H. Jouneau, L. S. Dang, R. Mallard, A. Nahmani, K. Saminadayar, and S. Tatarenko, CdTe/ZnTe: Critical thickness and coherent heterostructures, Superlattices and Microstructures 9, 271 (1991).
- Waag et al. (1993) A. Waag, H. Heinke, S. Scholl, C. R. Becker, and G. Landwehr, Growth of MgTe and Cd1-xMgxTe thin films by molecular beam epitaxy, Journal of Crystal Growth 131, 607 (1993).
- Gerthsen et al. (1994) D. Gerthsen, D. Meertens, H. Heinke, A. Waag, T. Litz, and G. Landwehr, Structural properties of CdMgTe/CdTe superlattices, Journal of Applied Physics 75, 7323 (1994).
- Hartmann et al. (1996) J. M. Hartmann, J. Cibert, F. Kany, H. Mariette, M. Charleux, P. Alleysson, R. Langer, and G. Feuillet, CdTe/MgTe heterostructures: Growth by atomic layer epitaxy and determination of MgTe parameters, Journal of Applied Physics 80, 6257 (1996).
- LeBlanc et al. (2017) E. G. LeBlanc, M. Edirisooriya, O. S. Ogedengbe, O. C. Noriega, P. A. R. D. Jayathilaka, S. Rab, C. H. Swartz, D. R. Diercks, G. L. Burton, B. P. Gorman, A. Wang, T. M. Barnes, and T. H. Myers, Determining and Controlling the Magnesium Composition in CdTe/CdMgTe Heterostructures, Journal of Electronic Materials 46, 5379 (2017).
- Gaj et al. (1994) J. A. Gaj, W. Grieshaber, C. Bodin-Deshayes, J. Cibert, G. Feuillet, Y. Merle d’Aubigné, and A. Wasiela, Magneto-optical study of interface mixing in the CdTe(Cd,Mn)Te system, Physical Review B 50, 5512 (1994).
- Kossacki et al. (1997) P. Kossacki, N. The Khoi, J. A. Gaj, M. Kutrowski, M. Surma, G. Karczewski, T. Wojtowicz, and M. Guziewicz, Influence of strain and repeated annealing on interface mixing in annealed CdTeCdMnTe quantum wells, Solid State Communications 103, 619 (1997).
- Kossacki (2003) P. Kossacki, Optical studies of charged excitons in II VI semiconductor quantum wells, Journal of Physics: Condensed Matter 15, R471 (2003).
- Kossacki et al. (2004) P. Kossacki, H. Boukari, M. Bertolini, D. Ferrand, J. Cibert, S. Tatarenko, J. A. Gaj, B. Deveaud, V. Ciulin, and M. Potemski, Photoluminescence of p -doped quantum wells with strong spin splitting, Physical Review B 70 (2004).
- Keller et al. (2001) D. Keller, D. R. Yakovlev, B. König, W. Ossau, T. Gruber, A. Waag, L. W. Molenkamp, and A. V. Scherbakov, Heating of the magnetic ion system in (Zn, Mn)Se/(Zn, Be)Se semimagnetic quantum wells by means of photoexcitation, Physical Review B 65, 035313 (2001).
- Baker and Ford (1964) J. M. Baker and N. C. Ford, Dependence of Spin-Lattice Relaxation Time Upon Magnetic Field for Two Salts of Neodymium, Physical Review 136, A1692 (1964).
- Goryca et al. (2015) M. Goryca, M. Koperski, T. Smoleński, Ł. Cywiński, P. Wojnar, P. Plochocka, M. Potemski, and P. Kossacki, Spin-lattice relaxation of an individual Mn2+ ion in a CdTe/ZnTe quantum dot, Physical Review B 92, 045412 (2015).
- Witowski (1992) A. Witowski, Numerical Studies of Magnetization Relaxation of Mn2+ in Zinc Blende Crystals, Acta Physica Polonica A 82, 876 (1992).
- Qazzaz et al. (1995) M. Qazzaz, G. Yang, S. H. Xin, L. Montes, H. Luo, and J. K. Furdyna, Electron paramagnetic resonance of Mn2+ in strained-layer semiconductor superlattices, Solid State Communications 96, 405 (1995).
- Witowski (1993) A. Witowski, Numerical studies of magnetization relaxation of S-type ions with spin in cubic crystals, Solid State Communications 86, 347 (1993).
- Story et al. (1996) T. Story, C. H. W. Swüste, P. J. T. Eggenkamp, H. J. M. Swagten, and W. J. M. De Jonge, Electron Paramagnetic Resonance Knight Shift in Semimagnetic (Diluted Magnetic) Semiconductors, Physical Review Letters 77, 2802 (1996).
- König et al. (2000) B. König, I. A. Merkulov, D. R. Yakovlev, W. Ossau, S. M. Ryabchenko, M. Kutrowski, T. Wojtowicz, G. Karczewski, and J. Kossut, Energy transfer from photocarriers into the magnetic ion system mediated by a two-dimensional electron gas in (Cd,Mn)Te/(Cd,Mg)Te quantum wells, Physical Review B 61, 16870 (2000).
- Teran et al. (2003) F. J. Teran, M. Potemski, D. K. Maude, D. Plantier, A. K. Hassan, A. Sachrajda, Z. Wilamowski, J. Jaroszynski, T. Wojtowicz, and G. Karczewski, Collective Character of Spin Excitations in a System of Spins Coupled to a Two-Dimensional Electron Gas, Physical Review Letters 91, 077201 (2003).
- König and MacDonald (2003) J. König and A. H. MacDonald, EPR and Ferromagnetism in Diluted Magnetic Semiconductor Quantum Wells, Physical Review Letters 91, 077202 (2003).