Multimodal Clinical Pseudo-notes for Emergency Department Prediction Tasks using Multiple Embedding Model for EHR (MEME)
Abstract
In this work, we introduce Multiple Embedding Model for EHR (MEME), an approach that views Electronic Health Records (EHR) as multimodal data. This approach incorporates “pseudo-notes”, textual representations of tabular EHR concepts such as diagnoses and medications and allows us to effectively employ Large Language Models (LLMs) for EHR representation. This framework also adopts a multimodal approach, embedding each EHR modality separately. We demonstrate the effectiveness of MEME by applying it to several tasks within the Emergency Department across multiple hospital systems. Our findings show that MEME surpasses the performance of both single modality embedding methods and traditional machine learning approaches. However, we also observe notable limitations in generalizability across hospital institutions for all tested models.
1 Introduction
In recent years, increased access to Electronic Health Records (EHR) has provided patients and healthcare systems with valuable insights into a patient’s health history. This wealth of information makes EHR indispensable for inference tasks, particularly as the machine learning community increasingly focuses on healthcare applications. Both traditional and cutting-edge machine learning techniques have been harnessed to aid in specific diagnosis and prognosis tasks [1], with a recent keen interest in incorporating state-of-the-art language models, such as Large Language Models (LLMs) [2]. These advanced models, which have been pre-trained on extensive and diverse textual corpora, bring a broad understanding across numerous domains, thereby significantly enhancing their adaptability and effectiveness for a variety of complex tasks. Particularly noteworthy is their ability to generate high-fidelity latent representations , which can be directly employed in many classification tasks, often demonstrating state-of-the-art performance. However, the adoption of these models, built for natural language and text, has been hampered by the fact that the canonical form of generally available EHR data is tabular, and access to textual clinical notes are generally infeasible to access due to privacy concerns.
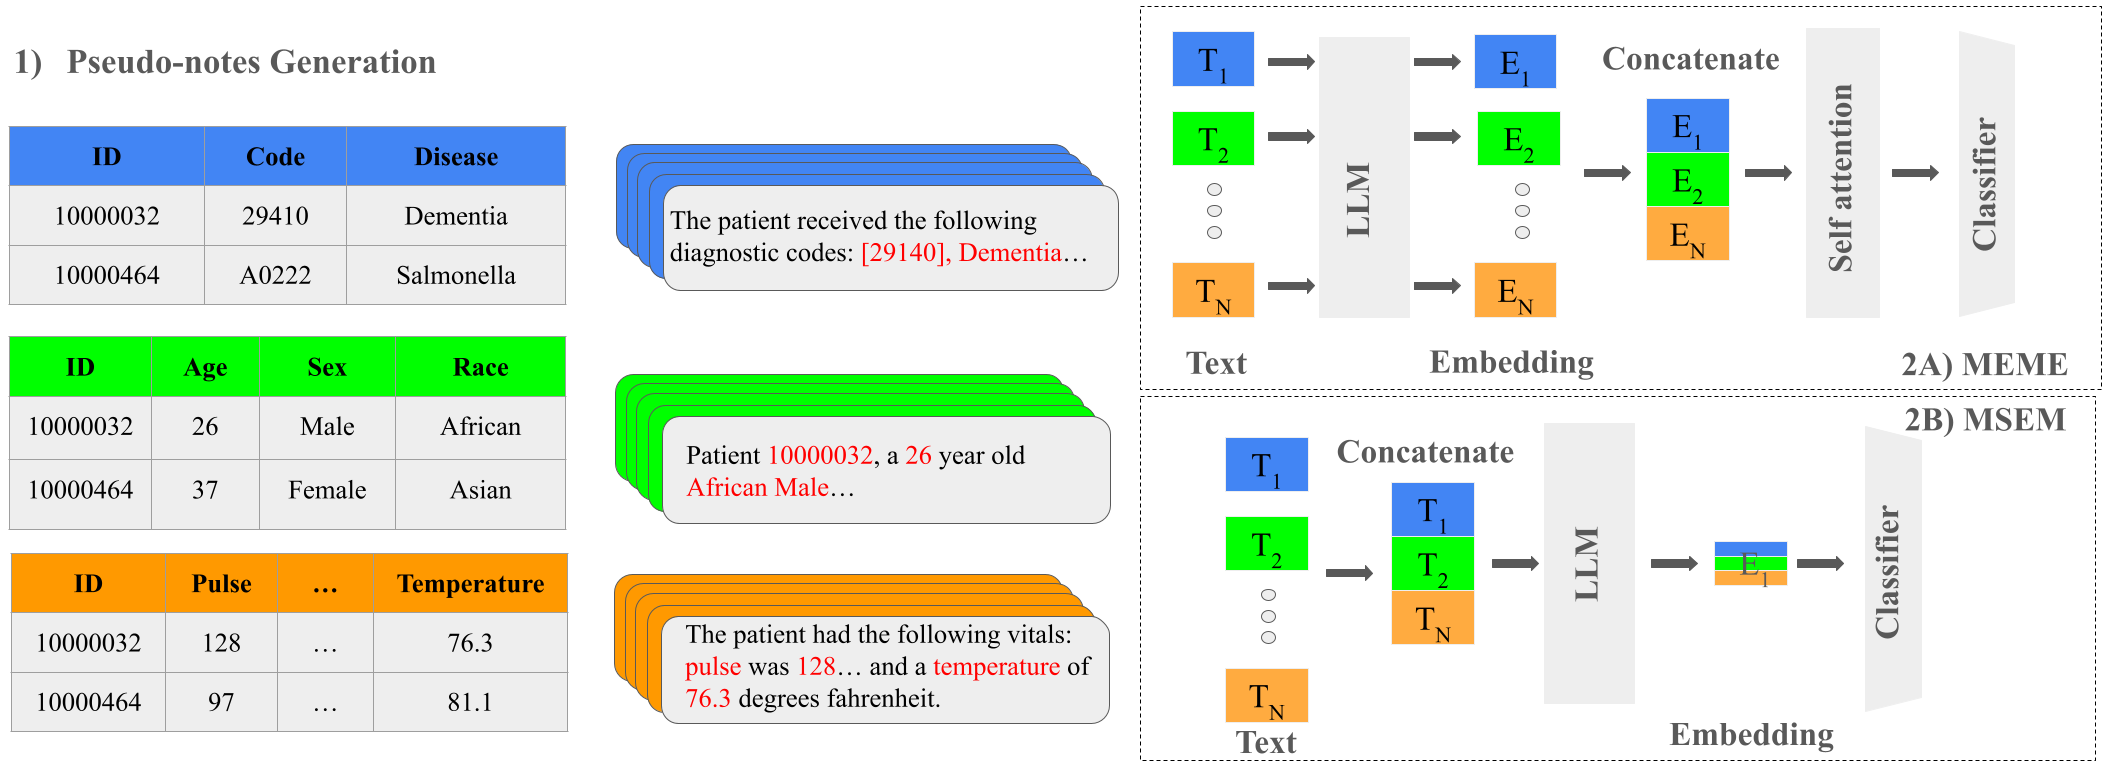
Therefore, in this work, we introduce Multiple Embedding Model for EHR (MEME), an approach that processes tabular health records and generates textual representations. Using these clinical pseudo-notes, MEME bridges the gap between tabular EHR data and modern NLP techniques. We then demonstrate the effectiveness of this approach by showcasing it on various EHR prediction tasks related to the Emergency Department (ED) across multiple hospital institutions. We also find that adopting a multimodal strategy, where different components of the EHR are encoded separately, yields better results compared to the single modality embedding approach, Multimodal Single Embedding Model (MSEM), and other conventional machine learning methodologies.
1.1 Contributions
The main contributions of this work are as follows:
-
•
We introduce our method MEME, a novel approach that converts tabular EHR data into clinical pseudo-notes. These notes are designed to be utilized in a variety of EHR-related tasks and were developed in collaboration with a clinician informaticist, drawing inspiration from patient report generation tools.
-
•
We demonstrate that multimodal representation outperforms traditional machine learning and LLM-based models which represent EHR as a single heterogeneous data modality across multiple tasks.
-
•
We find that the representation derived from the MIMIC-IV Database is insufficient for generalizing across different hospital systems.
2 Related Work
2.1 LLM & Tabular Data
An ongoing field of research involves the application of LLMs to tabular data. Previous attempts at constructing representations for tabular data have led to the emergence of a novel concept known as “stringified” or serialized tabular data. This technique involves converting tabular data into a text-based format, either as a simplified list (e.g., Age: 42, Height: 143cm, …) or as serialized sentences. This transformation enables a more natural integration of diverse data types into language models, facilitating their analysis using advanced machine learning techniques.
This growing interest has enabled the application of state-of-the-art language models to tabular data, often surpassing traditional machine learning models in scenarios with minimal or no training data. Such capability was demonstrated through a text-to-text prompt-based method using serialized tabular data, leveraging the general knowledge embedded within the parameters of LLMs across various zero-shot and few-shot learning tasks [3]. Moreover, another study explored the integration of paired datasets (e.g., images) for game data, incorporating both tabular textual and visual fields cohesively for predictive tasks. This was achieved using BERT models to handle the textual component of the datasets [4], showcasing their versatility in processing complex data structures and blending different types of information seamlessly. Such integrative approaches suggest new possibilities in applying LLMs beyond traditional text-based applications.
2.2 LLMs, Transformers & EHR
Transformer based models and LLMs have also been increasingly applied to EHR data [5]. These applications tend to fit in one of two paradigms as identified by [6]: One approach that operates upon structured information captured within the EHR and another that operates upon clinical text with recent methods involving multimodal approaches.
The models developed to represent structured EHR are generally based on the BERT architecture [5]. Broadly speaking, these approaches represent the electronic health record as a sequence of events. For example, BEHRT and its derivatives MedBert, CEHR-Bert, construct sequences of diagnostic codes and visit metainformation to be compatible with the BERT framework [7, 8, 9, 10]. These models are better adapted to currently available healthcare data due to deidentification and standardization efforts (e.g., OHDSI/OMOP [11]). Notably, nearly all approaches treat EHR data as a single heterogeneous data source, despite the fact that EHR covers data across multiple biological scales and clinical domains (e.g., billing-related diagnostic codes, molecular blood tests, vital-sign measurements). Indeed, more recently, EXBEHRT found that separately representing the components of EHR offers several benefits, including improved performance, shortened sequence length, and fewer required parameters [12].
Another approach directly operates upon clinical notes, which are in the form of natural text. The primary advantage of these approaches is the ability to incorporate pretrained models, such as GPT, BioBert, PubMedBert, etc. [13, 14]. However, these data are challenging to acquire, with nearly all applications restricted to a single database (MIMIC-III, [15]). Recently, efforts have been made to begin multimodal analysis, where groups analyze different data from the EHR (imaging, waveforms, etc.) for predictive tasks. MC-BEC uses all available data within their in-house dataset and performs a multilabel classification on various EHR tasks [16]. Other attempts have unified imaging data with text [17], and imaging data with structured EHR for various analyses [18].
Therefore, in this work, with the continued development of multimodal transformer and LLM methods, we develop our own approach that can capture a joint representation of multimodal structured EHR data. We do so by constructing “pseudo-notes” out of raw EHR tabular data contained within the MIMIC-IV and UCLA datasets. We then feed this data into a feed forward network with self attention to train a classifier model to predict various binary classification tasks related to the emergency department. This approach allows us to compare single-modality, MSEM and multi-modality approaches and assess performance on this transformer method.
3 Benchmarks
3.1 Benchmark tasks
This paper focuses on binary prediction tasks around Emergency Department disposition and decompensation defined in [16]. We test our multimodal method’s ability to be used in both single classification and multilabel classification tasks benchmarked against other single modality and traditional machine learning models. This assessment aims to demonstrate the performance advantages of adopting a multimodal strategy.
-
1.
ED Disposition (Binary Classification): Our first objective is to predict ED Disposition, determining where patients were sent after their Emergency Room visit, based on EHR measurements recorded during their stay in the ED. We frame this as a binary classification problem, distinguishing whether the patient was discharged home or admitted to the hospital.
-
2.
ED Decompensation (Multilabel Binary Classification): Our subsequent objective is to analyze the subset of patients admitted to the hospital and predict various other measures related to the ED. In this set of tasks, we adopt a multilabel binary classification approach, where the model predicts three separate ED tasks simultaneously. The first task involves predicting the patient’s next discharge location, distinguishing between home and other facilities (not home). The second task is predicting the requirement for Intensive Care Unit (ICU) admission. And the last task is predicting patient mortality, specifically whether the patient dies during their hospital stay.
| Task | MIMIC-IV | UCLA |
|---|---|---|
| ED Disposition | 0.395 | 0.253 |
| Discharge Location | 0.449 | 0.381 |
| ICU | 0.197 | 0.157 |
| Mortality | 0.029 | 0.031 |
In Table 1, we detail the classification objectives and provide a summary of dataset statistics related to the prevalence of each label in these tasks.
3.2 Data Source
Our study sources data from the Medical Information Mart for Intensive Care (MIMIC)-IV v2.2 database [19] and our UCLA EHR database. We detail the components of these databases to further explore the data inputs for our model. The use of these diverse databases allows for examination of EHR data across different settings and patient populations, enhancing the generalizability of our findings.
-
•
MIMIC-IV: For these downstream tasks, the EHR concepts (modalities) utilized include: arrival information, capturing patient demographics and means of arrival; triage, documenting patient vitals and complaints at the time of arrival; medication reconciliation (medrecon), detailing prior and current medications taken by the patient; diagnostic codes (ICD-9/10 codes) assigned for diagnosis; as well as measurements collected throughout the ED stay, including patient vitals and medications received from pyxis. All data points across modalities can be combined using a unique Visit or Hospital admission ID (Hadm_id) and can also be connected to all prediction labels.
-
•
UCLA Database: In our UCLA data, we have access to all data modalities from the MIMIC-IV database, with the exception of medication reconciliation (medrecon). However, there may be slight variations in the data across modalities due to the lack of certain features in different EHR systems. Our approach is to model our pseudo-notes so that they closely resemble each other. Similar to the MIMIC-IV database, all modalities in our institutional data can be linked using a hospital admission ID and are also associated with all prediction labels.
In the MIMIC-IV database, we analyzed patients, each associated with six modalities, contributing to a dataset size of approximately million text paragraphs. For predicting ED Disposition, we use the available data for training, validation, and testing with a set seed for reproducibility purposes. For the three decompensation prediction tasks, we utilize the subset of patients who were admitted to the hospital from the ED, resulting in a sample size of patients.
Additionally, in the UCLA database, we have a much larger sample size of patients with 5 available modalities (excluding medrecon, resulting in approximately million text paragraphs derived from the EHR. We use all available data for the ED disposition task, and the admitted patients were used for decompensation prediction.
4 Methods
MEME introduces two technical features: the conversion of EHR data into text and the multimodal treatment of EHR modalities. We describe the framework below.
4.1 EHR Pseudo-notes
MEME employs “pseudo-notes” to convert EHR raw tabular data into clinically meaningful text. These are generated by inserting tabular information into template sentences which resemble shorthand phrases regularly used in practice (cf., [3]. This transformation turns our multimodal EHR tabular data into separate structured language text paragraphs. A primary reason for undertaking this transformation is the presence of dimensionality constraints when operating on canonical tabular data, making one-hot encoding infeasible when dealing with a large number of categorical classes, as seen in disease diagnostics or medication codes. This method not only simplifies data handling but also enhances interpretability within data inputs, which is crucial in medical data analysis. Additionally, a more practical reason for converting our data into text is to easily align our different modalities into a textual representation and leverage the capabilities of Large Language Models that currently dominate the machine learning domain. By doing so, we bridge the gap between traditional EHR data formats and the advanced NLP techniques used in modern machine learning.
| Modality | Sentence |
|---|---|
| arrival | Patient 10000032, a 52 year old white female… |
| triage | At triage: temperature was 98.4, pulse was 70.4… |
| medrecon | The patient was previously taking the following medication: ibuprofen, nsaid analgesics (cox non-specific) - propionic acid derivatives… |
| vitals | The patient had the following vitals: pulse was 128… |
| codes | The patient received the following diagnostic codes: [0389], septicemia nos… |
| pyxis | The patient received the following medications: At 2125-03-19 13:05:00, lorazepam, lorazepam were administered… |
Example pseudo-notes are available in Table 2. These pseudo-notes provide a more intuitive understanding of complex medical data, benefiting both machine learning algorithms and human data analysts. We have included complete verbose examples of our pseudo-notes generation in our appendix.
Our pipeline handles missing data modalities with filler sentences, e.g., “Medications for this patient are not available”. This strategy allows our method to adapt to the absence of certain modalities, a frequent issue in many EHR systems in the context of both evaluation and augmentation for training.
4.2 Data Preprocessing
EHR data comprises some of the most complex raw forms of data, posing challenges for comprehensive analysis. EHR data are heterogeneous, spanning multiple data types and multiple biological domains and scales. In its native format, EHR data can encompass categorical, textual, numerical, and their combinations, all organized within a database of tabular EHR concepts. The conventional application of machine learning methods, such as one-hot encoding, often leads to memory-related issues and dimensionality complexities, especially when dealing with specific data concepts like diagnostic codes, which necessitate encoding each unique disease. This challenge further complicates the data ingestion process, resulting in the generation of numerous sparse columns. To address these issues and data types, we treat each EHR concept as text, aiming to reduce dimensionality and leverage the advanced methodologies provided by recent LLM research.
Our data curation process begins by constructing the pseudo-notes from our raw EHR data. Initially, we disregard missing entries in our tabular format as we complete the conversion from tabular to text. Subsequently, we address the missing data by incorporating filler sentences such as ‘The patient did not receive any medications’ in cases where the medrecon modality data is missing. We applied this method to all six modalities before feeding them into our tokenizer, loaded from any LLM model. In our approach, we utilize the WordPiece subword segmentation tokenizer from a MedBERT model, a methodology introduced to handle out-of-vocabulary (OOV) words and segment words into smaller units, often referred to as subword tokens or subword pieces. The pre-trained BERT model can be sourced from any general LLM model trained on broad tasks. However, for our purposes of accurately capturing the nuances of medical terminology, which often includes complex and technical terms, we utilized MedBERT [20].
Additionally, in the tokenization process, we set our sequence length to 512 tokens (roughly 250 words) and add parameters to truncate inputs longer than 512 tokens and add padding tokens to paragraphs under 512 tokens to maintain consistent embedding sizes. While naively concatenating text and submitting it to the network would result in a single 512-length sequence embedding, using a multimodal approach allows us to end up with 512-length sequence embeddings, where is the number of modalities. These can be fused to provide a richer representation as previously demonstrated by EXBEHRT [12]. This approach allows for a more comprehensive representation of the patient’s profile, capturing a broader spectrum of medical information. We finally split our dataset into training, validation, and testing sets with a fixed seed to ensure the replicability of the results found in this study, thus concluding the data preprocessing phase.
4.3 Network Architecture
In this section, we outline our model architecture, which is integral to our end-to-end pipeline. These networks are designed to process our preprocessed and tokenized textual inputs and output logits for each class. The class with the highest probability is then selected as the predicted class.
4.3.1 Step 1: Generating Embeddings
The first step of our model is to generate embeddings for each EHR concept. In our training loop, tokenized data is initially fed into our MedBERT encoders. These encoders are responsible for producing embeddings that encapsulate various aspects of a patient’s medical history in rich, high-dimensional vector representations. Unlike some previous works where the BERT model weights are updated via fine-tuning, we opt to freeze these encoders. This approach allows us to focus on updating parameters in the subsequent step, which is specifically dedicated to the prediction task, thereby streamlining the model’s efficiency. After generating the embeddings for all concepts, we concatenate them into a unified input. This consolidated input is then utilized by the subsequent step in the network for further processing. The process can be mathematically modeled as follows:
| (1) |
| (2) |
In the first phase of the model, we process and structure modality-specific pseudo-notes into a tokenized form, denoted as . This process delineates a series of unique medical concepts or characteristics derived from a patient’s records. Each concept, indicated as , undergoes a transformation via the MedBERT encoder, resulting in a high-dimensional vector, labeled . These vectors offer nuanced, context-rich portrayals of each EHR concept, effectively capturing complex clinical information in a format that’s readily interpretable by machine learning algorithms. Following this transformation, we unify all the embedding vectors () to construct a comprehensive, cohesive vector, referred to as .
4.3.2 Step 2: Self-attention Classifier
Step Two of the network introduces an innovative approach by training a self-attention layer, specifically designed to analyze our newly formed, singular concatenated representation vector as a unified entity. This second network arises from our intention to interpret the aligned modalities collectively, rather than as separate entities. Employing the self-attention layer allows the network to comprehensively operate on the entire concatenated vector. It assesses the relationships between its elements, thereby capturing patterns across different EHR concept vectors.
With this method now motivated, we train a basic self-attention layer from scratch in the feed forward network, focusing on updating the gradients of this specific component. Following this, the processed output is directed to a fully connected layer, followed by a ReLU activation function, before finally being fed into our final classifying layer for prediction. This two-step approach, with a distinct focus on unified analysis and attention-based processing, sets our method apart from traditional models and is central to the enhanced predictive capabilities of our framework. The second step of our network can be modeled below:
| (3) |
| (4) |
1. Model Output for ED Disposition:
| (5) |
| (6) |
Minimizing on the the Cross Entropy Loss
| (7) |
2. Model Output for ED Decompensation:
| (8) |
| (9) |
Minimizing on the the Binary Cross Entropy Loss
The model leverages a self-attention mechanism where the input vector is transformed into an attention vector , capturing internal relationships within the data. This attention vector then passes through a fully connected (FC) layer followed by a Rectified Linear Unit (ReLU) activation to form the vector , serving as a refined feature representation.
For ED Disposition, the refined features are fed into a classifier, producing logits , which are then passed through a softmax function to obtain predicted probabilities . The model’s performance is optimized by minimizing the Cross Entropy Loss , ensuring that the predicted probabilities closely align with the true labels . For ED Decompensation, a similar pathway is followed where is used to generate logits . However, given the multi-label nature of the task, each logit is processed independently through a sigmoid function , and the model is trained by minimizing a tailored Cross Entropy Loss that sums the binary cross-entropy losses across all labels for each observation, effectively capturing the multi-label aspects of the data.
| MIMIC-IV | ||||
| Task | Method | F1 | AUROC | AUPRC |
| Disposition | arrival | 0.895 0.003 | 0.940 0.002 | 0.861 0.005 |
| codes | 0.613 0.003 | 0.715 0.005 | 0.645 0.007 | |
| medrecon | 0.625 0.005 | 0.709 0.004 | 0.589 0.007 | |
| pyxis | 0.564 0.004 | 0.498 0.005 | 0.391 0.005 | |
| triage | 0.596 0.005 | 0.677 0.004 | 0.552 0.008 | |
| vitals | 0.619 0.005 | 0.720 0.004 | 0.623 0.007 | |
| MEME | 0.943 0.003 | 0.991 0.001 | 0.983 0.002 | |
| MSEM | 0.893 0.003 | 0.948 0.002 | 0.890 0.005 | |
| RandomForest | 0.826 0.013 | 0.902 0.010 | 0.902 0.012 | |
| Discharge | arrival | 0.533 0.008 | 0.689 0.007 | 0.625 0.010 |
| codes | 0.572 0.008 | 0.658 0.007 | 0.595 0.011 | |
| medrecon | 0.525 0.009 | 0.644 0.007 | 0.579 0.010 | |
| pyxis | 0.478 0.009 | 0.616 0.008 | 0.561 0.011 | |
| triage | 0.403 0.010 | 0.647 0.007 | 0.579 0.011 | |
| vitals | 0.366 0.009 | 0.598 0.008 | 0.544 0.010 | |
| MEME | 0.698 0.007 | 0.799 0.006 | 0.765 0.008 | |
| MSEM | 0.622 0.007 | 0.552 0.008 | 0.493 0.010 | |
| RandomForest | 0.625 0.026 | 0.862 0.014 | 0.645 0.036 | |
| Mortality | arrival | 0.063 0.005 | 0.709 0.019 | 0.076 0.013 |
| codes | 0.055 0.004 | 0.709 0.020 | 0.061 0.008 | |
| medrecon | 0.054 0.004 | 0.668 0.021 | 0.049 0.006 | |
| pyxis | 0.060 0.005 | 0.705 0.024 | 0.112 0.022 | |
| triage | 0.055 0.004 | 0.736 0.020 | 0.100 0.017 | |
| vitals | 0.067 0.006 | 0.740 0.021 | 0.087 0.014 | |
| MEME | 0.137 0.035 | 0.870 0.015 | 0.243 0.034 | |
| MSEM | 0.072 0.014 | 0.546 0.023 | 0.037 0.006 | |
| RandomForest | 0.175 0.094 | 0.847 0.055 | 0.102 0.044 | |
| ICU | arrival | 0.041 0.009 | 0.682 0.009 | 0.376 0.014 |
| codes | 0.054 0.009 | 0.714 0.008 | 0.410 0.014 | |
| medrecon | 0.029 0.005 | 0.622 0.009 | 0.286 0.010 | |
| pyxis | 0.167 0.015 | 0.704 0.009 | 0.484 0.015 | |
| triage | 0.367 0.015 | 0.758 0.008 | 0.504 0.015 | |
| vitals | 0.160 0.013 | 0.733 0.008 | 0.430 0.014 | |
| MEME | 0.572 0.014 | 0.862 0.006 | 0.709 0.012 | |
| MSEM | 0.334 0.008 | 0.522 0.009 | 0.216 0.009 | |
| RandomForest | 0.544 0.048 | 0.903 0.016 | 0.571 0.047 |
4.3.3 Model optimization
Models were trained with a batch size of 64, dropout rate of , AdamW optimizer with a learning rate of on a linear learning rate scheduler. For the ED disposition task, we employed Cross-Entropy Loss, and for multilabel decompensation classification, we use Binary Cross-Entropy (BCE) Loss. Training proceeds until a minimum is reached in the validation loss across 2 epochs (early stopping). We track F1 scores and loss after each epoch to assess the model’s effectiveness.
Our computational framework is developed in Python’s PyTorch, using LLM models available on the HuggingFace Platform. For development purposes, we use the g4dn.4xlarge EC2 instance from AWS Cloud Services. The model’s training and testing are conducted on a single A100 Nvidia GPU.
5 Results
We benchmarked the performance of Multiple Embedding Model for EHR (MEME) against the following methods.
-
1.
A Random Forest Classifier was chosen as a model which operates on canonically tabular data to evaluate our text-conversion approach
-
2.
Single-modality models using the MEME approach were trained to characterize the impact of each EHR modality on predictive performance
-
3.
“Multimodal single embedding model” (MSEM), which concatenates all EHR modalities rather than separately embedding them, to investigate the added value of multimodal representation.
These comparisons were run within and across datasets. In addition, we evaluated MEME using different LLM embeddings to assess its dependence on MedBert. The metrics used for evaluation include the Area Under the Receiver Operating Characteristic Curve (AUROC), the Area Under Precision-Recall Curve (AUPRC), and F1 scores. To ensure robustness, 95% confidence intervals were generated for each metric by resampling the test set 1,000 times. Our results—comprising AUROC scores, AUPRC scores, and F1 scores—are presented in Table 3.
5.1 MEME outperforms MSEM & Random Forest
From Table 3, it is clear that MEME outperforms all other models, including MSEM and random forest classifiers. A primary reason for the difference between MEME and MSEM could be attributed to MedBERT’s token sequence length, which truncates all input after reaching its 512 sequence limit. As a result, in the MSEM method, the ordering of modalities becomes crucial, as modalities appearing later are at risk of being truncated. To avoid bias in our study, we ordered the modalities alphabetically. Additionally, we observed that MEME surpasses the performance of the tabular Random Forest model. While Random Forest has a competitive advantage in its AUROC, these imbalanced tasks make the benchmarking more nuanced as it performs poorly when looking at AUPRC. This suggests that converting from tabular to textual format with MEME may create a higher quality representation of medical concepts, leading to better task prediction performance and higher precision & recall.
5.2 Replication using other LLMs
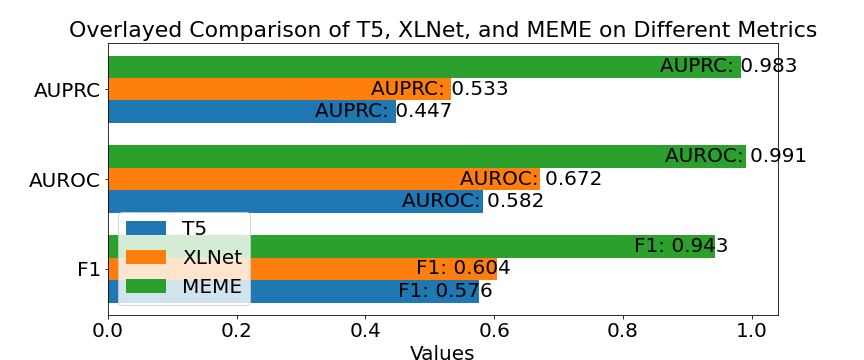
Since we employed a frozen MedBert encoder in this work, we also evaluated different Large Language Models (LLMs) to observe their performance variations in our analysis. We investigated the effect of other encoder-only backbones (t5 and XLNet) on overall predictive performance. As shown in Figure 2, MEME using a MedBert encoder displayed noticeably higher performance.
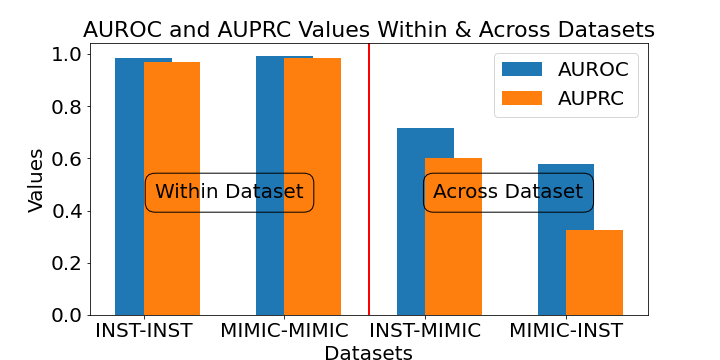
5.3 Generalization across datasets
A recent critique of healthcare AI applications identified the lack of external validation and therefore potential overfitting to existing publicly available data. Indeed, we observed that while our approach and our reference models displayed strong within-dataset performance using a train-test split, performance was reduced when externally validated across institution (Figure 3.)
We performed a qualitative error analysis on the top 10 and bottom 10 scoring exemplars in our UCLA dataset to gain insight into this performance gap. Concordant cases were defined as those which the model scored highly and were correctly identified, or scored lowly and correctly not
flagged, and Discordant cases were defined as vice versa. We found no systematic patterns or attributes of patients that explained this gap. However, the heterogeneity across EHR systems could be a reason behind this inconclusive finding and is worth further investigation.
6 Discussion
6.1 Limitations
One crucial limitation of the model, is the lack of external validity. While building a training dataset that combines MIMIC and our UCLA EHR, or performing external-site-specific fine tuning could alleviate this performance drop-off, it is important to highlight that there still exists a gap in generalizability for this model and competitors, as identified by Wornow and colleagues [6]. In addition to patient population differences, it is possible and likely that protocols around patient care vary across site and over time such that the same patient would experience different outcomes depending on when and where they experienced care. Therefore we conclude that current models developed on the publicly available MIMIC-IV ED dataset appear to be insufficient for ensuring true generalization across diverse healthcare systems.
Another limitation of this work is our inability to release our private UCLA data, due to privacy restrictions and UCLA policy. This highlights the significance of independent benchmarks, and underscores the necessity of external validation, for example benchmark datasets and tasks such as MC-BEC [16].
6.2 Future Works
This approach can be extended beyond classification tasks. These applications encompass, but are not limited to, Retrieval Augmented Generation (RAG), recommendation systems, and other clinical tasks associated with textual modalities. Additionally, another promising direction could involve pre-training a Large Language Model from scratch, utilizing pseudo-notes sourced from multiple institutions. This approach aims to build a pre-trained model fundamentally based on structured Electronic Health Records, potentially enhancing its relevance and efficacy in healthcare contexts.
6.3 Conclusion
In this paper we introduced our model MEME, an approach for transforming multimodal tabular EHR data into clinical pseudo-notes. This transformation significantly enhances the interpretability of our data inputs and utility of EHR data in various healthcare-related tasks. The pseudo-notes method not only simplifies data handling but also effectively bridges the gap between traditional EHR formats and advanced NLP techniques employed in modern machine learning.
A key finding from our study is the superior performance of the multimodal strategy employed by MEME. It outperforms a traditional ensembling machine learning method, single-modality and single-embedding methods, demonstrating the benefits of encoding different components of EHR separately. This approach allows for a more comprehensive representation of a patient’s medical profile, capturing a broader spectrum of medical information crucial for accurate predictions. It’s also worth noting that this approach can be extended to other clinical tasks that can be defined within the EHR.
However, our findings also highlight a significant challenge in the field of EHR analysis: the limited generalizability of models across different hospital institutions. Despite its strengths, the representation derived from the MIMIC-IV Database proved insufficient for generalization across diverse healthcare systems. This underscores the need for more representative publicly available datasets that can generalize to other EHR systems.
6.4 Code & Data
6.5 Impact Statement
The goal of this work is to advance the field of Machine Learning in Healthcare, and thus presents a novel potential interface between modern NLP (LLMs) and clinical data. However, this work does not directly address issues involving performance and bias of all forms within LLMs and thus potentially introduces these issues into healthcare applications. This, coupled with our limited inter-site performance, highlight an urgent need for inter-site validation and further study before these models can leave the laboratory.
References
- [1] Benjamin Shickel, Patrick James Tighe, Azra Bihorac, and Parisa Rashidi. Deep EHR: A Survey of Recent Advances in Deep Learning Techniques for Electronic Health Record (EHR) Analysis. IEEE journal of biomedical and health informatics, 22(5):1589–1604, September 2018.
- [2] Wayne Xin Zhao, Kun Zhou, Junyi Li, Tianyi Tang, Xiaolei Wang, Yupeng Hou, Yingqian Min, Beichen Zhang, Junjie Zhang, Zican Dong, Yifan Du, Chen Yang, Yushuo Chen, Zhipeng Chen, Jinhao Jiang, Ruiyang Ren, Yifan Li, Xinyu Tang, Zikang Liu, Peiyu Liu, Jian-Yun Nie, and Ji-Rong Wen. A Survey of Large Language Models, September 2023. arXiv:2303.18223 [cs].
- [3] Stefan Hegselmann, Alejandro Buendia, Hunter Lang, Monica Agrawal, Xiaoyi Jiang, and David Sontag. Tabllm: Few-shot classification of tabular data with large language models. In International Conference on Artificial Intelligence and Statistics, pages 5549–5581. PMLR, 2023.
- [4] Jiaying Lu, Yongchen Qian, Shifan Zhao, Yuanzhe Xi, and Carl Yang. Mug: A multimodal classification benchmark on game data with tabular, textual, and visual fields. In Findings of the Association for Computational Linguistics: EMNLP 2023, Dec. 2023.
- [5] Katikapalli Subramanyam Kalyan, Ajit Rajasekharan, and Sivanesan Sangeetha. AMMU: A survey of transformer-based biomedical pretrained language models. Journal of Biomedical Informatics, 126:103982, February 2022.
- [6] Michael Wornow, Yizhe Xu, Rahul Thapa, Birju Patel, Ethan Steinberg, Scott Fleming, Michael A. Pfeffer, Jason Fries, and Nigam H. Shah. The shaky foundations of large language models and foundation models for electronic health records. npj Digital Medicine, 6(1):135, July 2023.
- [7] Yikuan Li, Shishir Rao, José Roberto Ayala Solares, Abdelaali Hassaine, Rema Ramakrishnan, Dexter Canoy, Yajie Zhu, Kazem Rahimi, and Gholamreza Salimi-Khorshidi. BEHRT: Transformer for Electronic Health Records. Scientific Reports, 10(1):7155, December 2020.
- [8] Yikuan Li, Mohammad Mamouei, Gholamreza Salimi-Khorshidi, Shishir Rao, Abdelaali Hassaine, Dexter Canoy, Thomas Lukasiewicz, and Kazem Rahimi. Hi-BEHRT: Hierarchical Transformer-based model for accurate prediction of clinical events using multimodal longitudinal electronic health records, June 2021. arXiv:2106.11360 [cs].
- [9] Laila Rasmy, Yang Xiang, Ziqian Xie, Cui Tao, and Degui Zhi. Med-BERT: pretrained contextualized embeddings on large-scale structured electronic health records for disease prediction. npj Digital Medicine, 4(1):86, December 2021.
- [10] Chao Pang, Xinzhuo Jiang, Krishna S Kalluri, Matthew Spotnitz, RuiJun Chen, Adler Perotte, and Karthik Natarajan. CEHR-BERT: Incorporating temporal information from structured EHR data to improve prediction tasks. page 22.
- [11] OMOP Common Data Model.
- [12] Maurice Rupp, Oriane Peter, and Thirupathi Pattipaka. ExBEHRT: Extended Transformer for Electronic Health Records to Predict Disease Subtypes & Progressions, April 2023. arXiv:2303.12364 [cs].
- [13] Arpita R. and Shimei P. Incorporating medical knowledge in BERT for clinical relation extraction. In Proceedings of the 2021 Conference on Empirical Methods in Natural Language Processing, pages 5357–5366, Online and Punta Cana, Dominican Republic, November 2021. Association for Computational Linguistics.
- [14] Chang David, Hong Woo Suk, and Taylor Richard Andrew. Generating contextual embeddings for emergency department chief complaints. JAMIA Open, pages 160–166, 2020.
- [15] Alistair E.W. Johnson, Tom J. Pollard, Lu Shen, Li-wei H. Lehman, Mengling Feng, Mohammad Ghassemi, Benjamin Moody, Peter Szolovits, Leo Anthony Celi, and Roger G. Mark. MIMIC-III, a freely accessible critical care database. Scientific Data, 3(1):160035, December 2016.
- [16] Emma Chen, Aman Kansal, Julie Chen, Boyang Tom Jin, Julia Rachel Reisler, David A Kim, and Pranav Rajpurkar. Multimodal clinical benchmark for emergency care (mc-bec): A comprehensive benchmark for evaluating foundation models in emergency medicine, 2023.
- [17] F Khader, JN Kather, G Müller-Franzes, et al. Medical transformer for multimodal survival prediction in intensive care: integration of imaging and non-imaging data. Scientific Reports, 13:10666, 2023.
- [18] HY Zhou, Y Yu, C Wang, et al. A transformer-based representation-learning model with unified processing of multimodal input for clinical diagnostics. Nature Biomedical Engineering, 7:743–755, 2023.
- [19] Alistair Johnson, Lucas Bulgarelli, Tom Pollard, Steven Horng, Leo Anthony Celi, and Roger Mark. MIMIC-IV.
- [20] Charangan Vasantharajan, Kyaw Zin Tun, Ho Thi-Nga, Sparsh Jain, Tong Rong, and Chng Eng Siong. Medbert: A pre-trained language model for biomedical named entity recognition. In 2022 Asia-Pacific Signal and Information Processing Association Annual Summit and Conference (APSIPA ASC), pages 1482–1488, 2022.
Appendix A Appendix
A.1 Example Pseudonotes
In Section 4.1, we referred to the appendix to provide a verbose exploration of our pseudo-notes generation process, offering more detailed and illustrative examples. Building upon the foundation laid out earlier, we utilize color coordination to clearly delineate the distinctions between information sourced directly from our raw EHR data and content that was dynamically generated through our script.
Arrival Information
Patient 10000032, a 52 year old white female, arrived via ambulance at 2180-05-06 19:17:00. The patient’s marital status is widowed. The patient’s insurance is other. The patient’s language is english.
Emergency Department Disposition
The ED disposition was admitted at 2180-05-06 23:30:00. The patient died on 2180-09-09.
Triage
At triage: temperature was 98.4, pulse was 70, respirations was 16, o2 saturation was 97, systolic blood pressure was 106, diastolic blood pressure was 63, pain was 0, chief complaint was abd pain, abdominal distention. Acuity score was 3.
Medrecon
The patient was previously taking the following medications: albuterol sulfate, asthma/copd therapy - beta 2-adrenergic agents, inhaled, short acting. peg 3350-electrolytes, laxative - saline/osmotic mixtures. nicotine, smoking deterrents - nicotine-type. spironolactone [aldactone], aldosterone receptor antagonists. emtricitabine-tenofovir [truvada], antiretroviral - nucleoside and nucleotide analog rtis combinations. raltegravir [isentress], antiretroviral - hiv-1 integrase strand transfer inhibitors. spironolactone [aldactone], diuretic - aldosterone receptor antagonist, non-selective. furosemide, diuretic - loop. ipratropium bromide [atrovent hfa], asthma/copd - anticholinergic agents, inhaled short acting. ergocalciferol (vitamin d2), vitamins - d derivatives.
Patient Vitals
The patient had the following vitals: At 2180-05-06 23:04:00, temperature was 97.7, pulse was 79, respirations was 16, o2 saturation was 98, systolic blood pressure was 107, diastolic blood pressure was 60, pain was 0.
Pyxis
The patient received the following medications: At 2180-08-05 22:29:00, morphine were administered. At 2180-08-05 22:55:00, donnatol (elixir), aluminum-magnesium hydrox.-simet, aluminum-magnesium hydrox.-simet, ondansetron, ondansetron were administered.
Diagnostic Codes
The patient received the following diagnostic codes: ICD-9 code: [78959], other ascites. ICD-9 code: [07070], unspecified viral hepatitis c without hepatic coma. ICD-9 code: [5715], cirrhosis of liver nos. ICD-9 code: [v08], asymptomatic hiv infection.
A.2 Model Descriptions
In the subsequent section, we delve into the details of the model architectures employed by other single modality approaches and machine learning methods. We disclose more detailed hyperparameters and architectural designs that constitute these models, facilitating a transparent benchmarking process. If there are any further questions after reading this section, feel free to contact the authors for more details.
Single Modality Specific Methods
In our analysis, we presented six distinct model variations, each tailored to one of the six modalities used for predicting the target variable. While these models share similarities with our multimodal approach, they diverge in certain aspects as deliberate feature removal sets them apart from our multimodal methodology. These single modality approaches adhere to a more conventional Language Model (LLM) fine-tuning paradigm. However they still do slightly diverge from these approaches as well. In these single modality models, we froze each LLM encoder and trained a linear classifier to be able to learn the proper underlying representations to make a proper prediction.
Moreover, unlike our multimodal model, these single modality models forego our second step to the network, which incorporates an additional self-attention layer step, as they do not necessitate learning a unified input. This approach reflects the task-specific focus of these models, optimizing for individual modality predictions without the need for a unified multimodal analysis.
In terms of preprocessing, we used the same preprocessing steps as our multimodal approach and extracted the modality-specific subset Dataset object from the Hugging Face library for our analysis. Subsequently, we loaded these dataset objects into conventional PyTorch dataloaders for training the classifier. Similar to our multimodal approach, we also utilized the Cross-Entropy Loss and AdamW optimizer, with a learning rate of , and trained until the validation error converges. Additionally, we implemented a linear learning rate scheduler to adjust the model’s learning rate during training, thus tuning this hyperparameter, which impacts our overall model performance. We tracked F1 scores to assess the performance of our model after every epoch.
Multimodal Single Embedding Model
In our benchmarking study, we also included a model referred to as the Multimodal Single Embedding Model (MSEM). This inclusion represents the canonical LLM approach of consolidating all text data into a single embedding. The MSEM closely resembles single modality models in terms of architecture; however, it diverges primarily in its preprocessing step, where all text is merged into a single column and truncated during tokenization.
The feasibility of an MSEM is largely constrained by context-length limitations imposed by BERT and other Large Language Models (LLMs). In our study, we focused on Emergency department EHR data, which encompassed six corresponding modalities. However, in broader applications like general EHR, the data can span as many as 10-20 different modalities related to a patient’s health history. These limitations are significant as they potentially restrict the depth and breadth of data that can be effectively processed and analyzed by models like the MSEM.
Random Forest Classifier
Lastly, our benchmarking also involved training and fitting a Random Forest classifier. We selected 1000 estimators, equivalent to creating 1000 trees. In contrast to our approach with pseudo-notes, the data preparation for the Random Forest classifier was markedly different. While BERT and transformer-based models primarily process text data, such an approach was not viable with the Random Forest. Consequently, we utilized the EHR data in its unaltered tabular format. To maintain consistency across our analyses, we filtered this data using the same patient subsets identified in the test, validation, and training sets of our transformer-based methods. Furthermore, we implemented one-hot encoding on various modalities, including medication reconciliation, ICD codes, and Pyxis drugs, to effectively prepare the data for the Random Forest model.