Maintaining User Trust Through Multistage Uncertainty Aware Inference
Abstract
This paper describes and evaluates a multistage approach to AI deployment. Each stage involves a more accurate method of inference, yet engaging each comes with an increasing cost. In outlining the architecture, we present a method for quantifying model uncertainty that facilitates confident deferral decisions. The architecture is currently under active deployment to thousands of cotton farmers across India. The broader idea however is applicable to a growing sector of AI deployments in challenging low resources settings.
Introduction
Artificial intelligence is playing an increasingly prominent role in decision support systems. This change has opened a new line of work in building systems that users can trust and on which they can safely rely (Kaur et al. 2022). This paper considers a scenario in which users have justifiably high standards for model performance, however deployment conditions make using state-of-the-art modeling techniques difficult. Our solution is to use a cascade of models that balance response time with recommendation accuracy.
For the last several years our group has developed and deployed computer vision models to help small holder cotton farmers make pest management decisions (Dalmia et al. 2020). A mobile app first asks users—farmers and farming extension workers—to take photos of bollworms caught in pest traps around their field. The images are then passed to the vision model, trained to identify and count bollworms in the photo. Counts are used to provide pesticide spraying advice based on rules from reputed agricultural bodies.
One of our challenges has been maintaining user trust. Like many users of AI systems (Kocielnik, Amershi, and Bennett 2019), our audience has high expectations of model performance. This makes it easy to damage the relationship we have with users when incorrect recommendations are suggested. In many cases that means decreased chances of repeat usage, as farmers have little time for tools that are not reliable. In more extreme cases the fallout is worse: panic that a crop is seriously endangered, and allocation of limited resources toward unnecessary spraying.
There are a number of ways to address this deployment challenge responsibly. This paper presents the technical approach we have taken: a pipeline of increasingly accurate, decreasingly accessible, models that defer to one another based on their evaluation of uncertainty. A variant the models presented here, and their encompassing architecture, is currently in active deployment to thousands of cotton farmers across India.
Related Work
Work in human-AI decision systems has introduced several methods for increasing trust among users (Lai et al. 2023). A popular technique for doing so is incorporating model uncertainty into the workflow. Some methods directly expose users to model confidence (Bhatt et al. 2021; Greis et al. 2017). The idea being that such transparency increases user agency. This methodology puts an onus on interface design and usability education, something that is outside the scope of our work.
Other efforts use uncertainty to suppress model output. Some propose outright rejection (White et al. 2022), while others defer to based on models of human expertise Mozannar and Sontag (2020). Wilder, Horvitz, and Kamar (2020) optimize “human-machine teamwork” by training models that take into account the strengths each for a given task. This as opposed to a model that is fixed during human evaluation time. They report strong improvements in this joint setup. As with our work, White et al. (2022) use box confidence to determine uncertainty, however they do not do it in the context of multistage modeling.
There is evidence that slowing down the inference process improves user interaction (Park et al. 2019). Our architecture inherently does that in some cases.
Problem Setup
Pest detection in low resource settings
Our users are cotton farmers and farming extension officers who have placed specialized pest traps throughout their fields. The traps are designed to capture pink and American bollworms, which have been a menace to Indian cotton farmers for decades (Najork et al. 2021). The key to mitigating crop loss caused be these pests is early detection, something the specialized traps facilitate.
Under normal operation, the traps are periodically emptied and their contents analyzed. The number of bollworms caught is an indicator of what action to take. Our app allows this process to be supported by AI: photos of the trap contents are fed to a model that is trained to identify pink and American bollworms; rule-based logic within the app turns those counts into action recommendations.
While there have been several contributions to AI-based pest detection (Toscano-Miranda et al. 2022; Harsha et al. 2022), successful deployment poses challenges beyond modeling. Because our app is used in rural settings, we cannot rely on consistent mobile internet connectivity. In addition, users are sensitive to app size footprints, being hesitant to download specialty apps that are more-than about 50MB. To meet these requirements, our primary in-app model must be small and capable of operating offline.
Exposing optimal inference
In general, smaller models are not as performant as those with more parameters. Our own baseline experiments confirm that generality in this context. Because of the importance users place on our estimates, it is prudent to explore all means of providing optimal model performance.
The motivation for our approach came from observations from our own on-ground studies. First, while users prefer instant feedback—spray recommendations that come during natural app interaction—they are not necessarily wedded to that. In small scale experiments, we found users willing to wait up to 24 hours for a result. Second, rural internet connectivity is not always binary. There are several cases in which connectivity is fluid throughout the field, and others in which it occurs long after a field visit. Such cases can arise either because of tower-environment dynamics, or because of travel away from the field after trap monitoring.
A multistage modeling approach
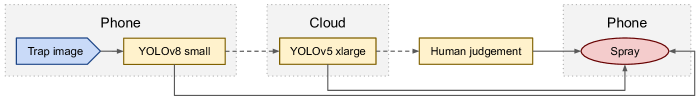
To take advantage of these observations, we propose a multistage architecture that sequentially passes the image to larger models, culminating with a human-in-the-loop (figure 1). The first model in the sequence resides on the phone, while the second model lives in the cloud. The third stage in the sequence is human judgment. Which model estimate is presented to the user depends on the uncertainty surrounding that models judgment. The final stage of the pipeline involving humans is assumed to be certain and accurate.
Methodology
Object detection for count classification
The objective of the system is to provide a spray recommendation given an image of trapped bollworms. Recommendations take the form of a three-valued alert depending on the number of bollworms present: no action required; imminent spray required; or “be cautious,” akin something in between. Within this paper we use a generally accepted count-to-alert mapping as follows: zero pests represents no action required, one to seven pests be cautious, and eight or more spray. We train and evaluate our models using an open source dataset designed for bollworm model development (White et al. 2023).111Data set version 20220912-2056. Evaluation in this paper was performed over the validation set of 2093 images: 698 no action, 728 cautious, 667 spray.
Our phone and cloud models (figure 1) are based on object detection systems. This means that the systems are not trained to classify, but to focus on pest recognition. Counts from the recognition are turned into alerts using the rules described above. Both models are variants of the YOLO family (Redmon et al. 2016), and within that based on derivatives from Ultralytics. The phone model is YOLOv8 small, while the cloud model is YOLOv5x6 xlarge. The models consist of 11.2 million and 43.7 million parameters respectively. The relatively low parameter count of small allows it to fit within our mobile app footprint budget.
By default, YOLO models produce a large number of boxes at different levels of confidence. A majority of the boxes are often invalid, with confidence values very close to zero. A standard model culls these low-confidence estimates via a parameter passed at inference. Our method eschews this parameter, considering all boxes. It empirically explores windows of confidence values over which model estimates can be trusted. Specifically a lower and upper bound that when applied at inference proves robust to proper classification of alert thresholds. Where the model is unsure, it abstains rather than estimates.
Box confidence windowing
Consider a collection of boxes and corresponding box confidences produced by YOLO inference of an image. Box confidences range from zero to one, exclusive. A window consists of an upper and lower value that partitions the collection into two sets. The first are boxes with confidence greater-than the lower value; the second boxes with confidence greater than upper. The lower set acts to cull noise, while the upper focuses on high confidence.
Uncertainty is determined by calculating the difference in cardinality between the two sets, relative the alert boundaries described earlier. Let and represent the cardinalities of the first (lower established) and second (upper established) partitions, respectively. If and produce the same alert, the model estimate is accepted and a recommendation made. If that is not the case, the model abstains, sending the message to the next evaluator in the chain (figure 1).
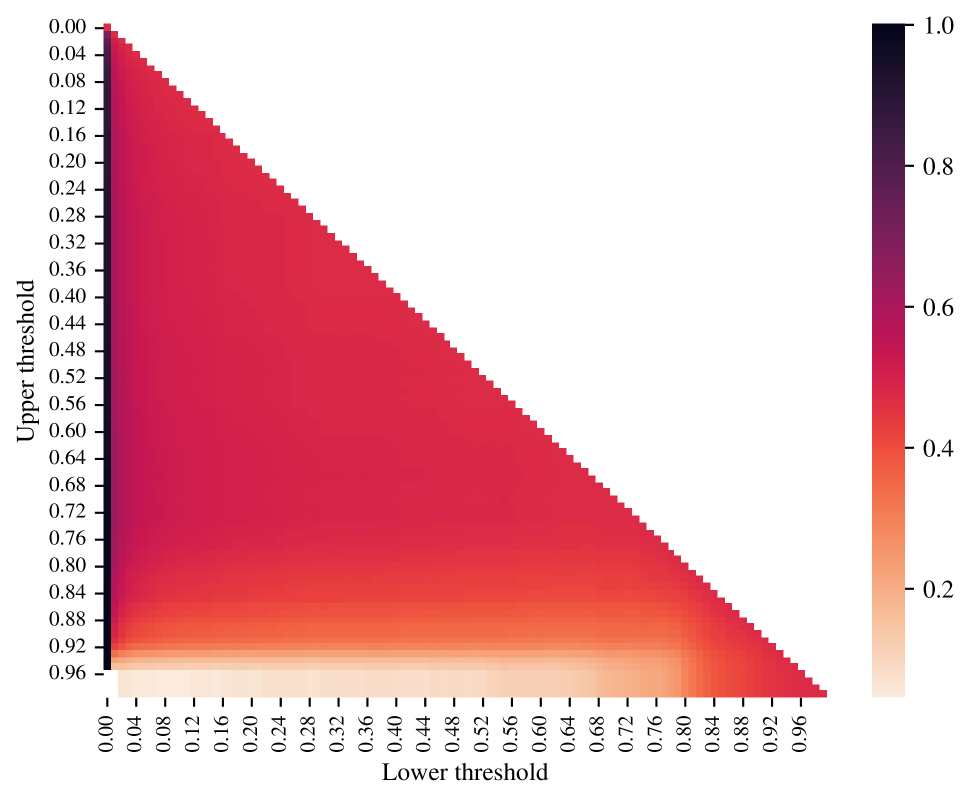
We determine the ideal window empirically, by studying tendencies over the validation set. figure 2 displays such tendencies of the phone model. Model performance is measured using Matthews correlation coefficient (MCC). Performance tends to be extreme—very good or very bad, relatively—at high abstention levels. This occurs when the lower threshold is zero, and when the upper threshold is above about 0.85. As we move away from those areas—toward the diagonal, for example—there a number of potentially acceptable windows that maximize performance while minimizing abstention.
Controlling the balance between performance and abstention is important. While better classification is the goal, abstention has both a usability and an operational cost. Phone abstention forces users to wait longer for a recommendation. For example, in a recent deployment the phone model took well under a second to respond. The mean cloud response time however was approximately seven hours. The mode of the cloud distribution was even higher (almost 12 hours) suggesting highly variable internet access across our users. When the cloud also abstains, human experts must make time to review the images. A cloud model that rarely abstains is ideal.
Results
This section examines combined models that operate sequentially, as outlined in figure 1. These models show an improvement to the phone model. They also offer a framework by which we can engage stakeholders to make more informed deployment decisions.
End-to-end performance
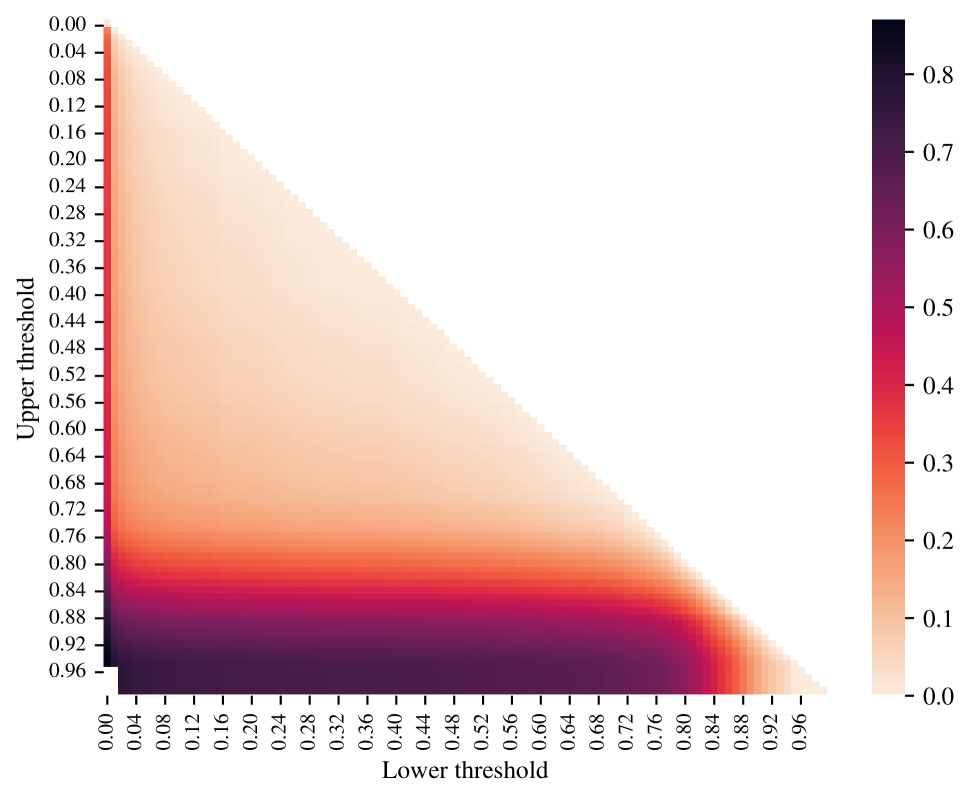
figure 3 displays the performance (MCC) of our combined model. The -axis represents the abstention level of the phone model; the -axis that of the cloud model “conditioned” on the phone. A conditioned system is developed as follows: let a model candidate be the output of a model at a given confidence window. Phone candidates, for example, are cells in the heatmaps of figure 2. We first group phone candidates by their abstention fraction, then select a single model within each. In cases where there are multiple candidates for a given fraction, the candidate with the highest MCC is selected. For each candidate, the process is repeated for the cloud model. However, only images on which the phone candidate abstained is the respective cloud model evaluated. This is what is meant by conditioning. Images over which a cloud candidate abstains are assumed to be human-judged and given predictions that match the ground truth. This process provides a realistic picture of how the models will perform in practice.
figure 3 shows that as the phone model abstention fraction increases, so to does performance. The lower-left portion of the figure represents the system if only the phone were in operation. The upper-right represents performance if only human intervention was used. By examining cells in other regions, we can make informed deployment decisions that balance model performance with user and operational staff burden.
Comparative performance
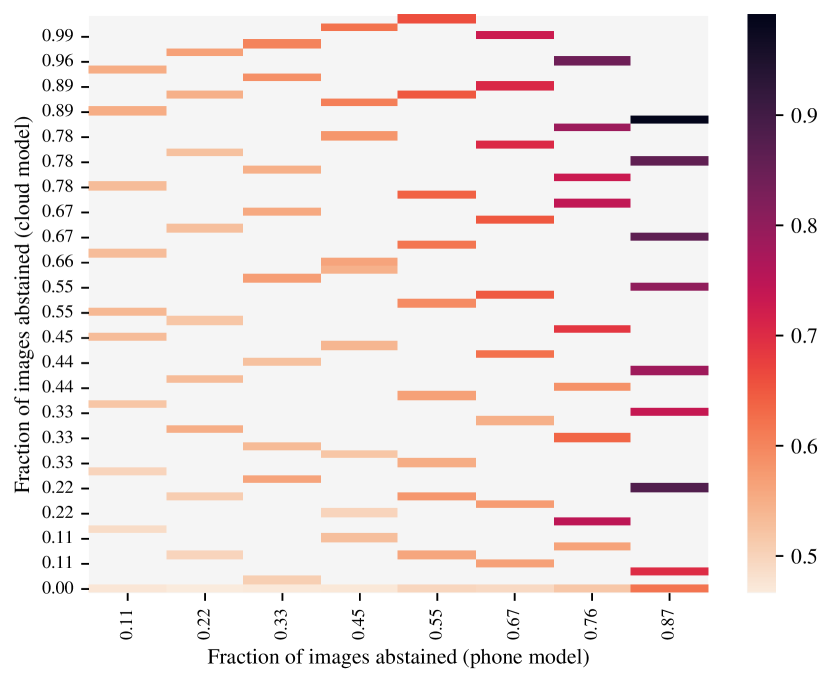
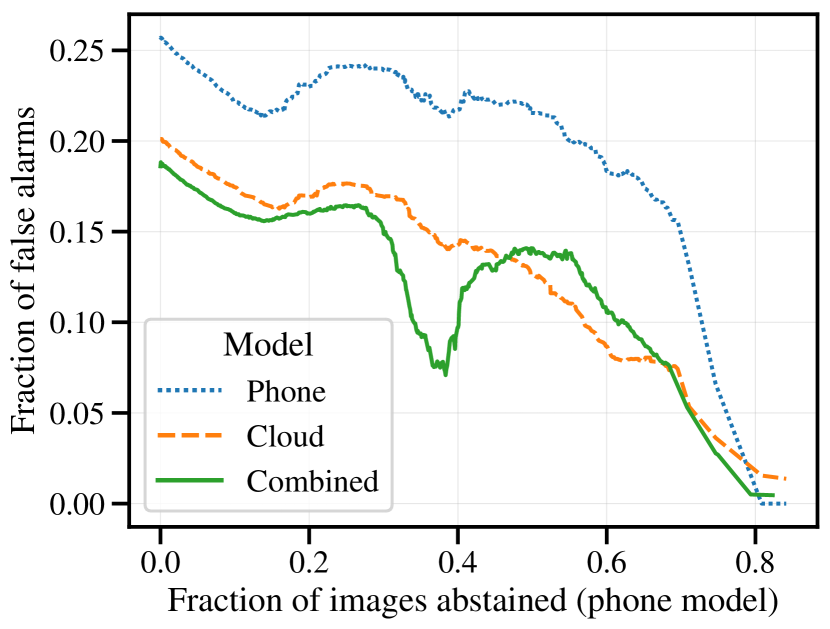
While figure 3 is informative, it does not give a sense for how much more beneficial the combined model is as compared to other types of single model deployments. figure 4 is an effort to bridge that gap. The curves display the fraction of false alarms (FA) made across abstention fractions. A false alarm is a case in which the model erroneously makes a spray recommendation. As discussed in the introduction, such cases can be expensive and distressing for our users.
It is difficult to compare models directly because of the difference in images at similar abstention fractions, and because in the combined model there are several candidates from which to choose. To provide a fair evaluation framework, we first group our phone candidates by abstention fraction. For each candidate a cloud candidate is selected that has the same inclusion set. The candidate with the lowest FA score is taken in the case of ties. All candidate models are taken from the combined model set, however only abstained images are excluded before the candidate is evaluated. The result of this process is shown in figure 4.
Performance is highly variable across abstention levels; and because the combined model is composed of several candidates at each, it is highly variable within an abstention fraction. For this reason, curves have been smoothed using a sliding window. Windows use median aggregation to reduce strong expert biases in combined model sets.
Despite this processing—and the sacrifices that come with making consistent evaluation sets at each abstention level—the curves provide a good sense for how models compare. The combined model presented in this paper consistently outperforms the phone model, and even the cloud model in some cases. The performance difference is especially notable at low abstention fractions (less-than 0.2). This is encouraging because such fractions represent acceptable levels for our deployment.
Conclusion and Future Work
This paper presents a variant of the architecture and methodology we have used to deploy a decision support system to farmers across India. The use of a staged model to increase trust and reliability is a novel improvement over our previous efforts (Dalmia et al. 2020). Framing the modeling effort in a duality between performance and response time has been helpful in engaging our partners and users.
Immediate future work includes evaluating our on-ground performance. At the time of writing, we are nearing the end of the primary cotton growing season in India, and in turn our active deployment. A deeper understanding of our frameworks performance is forthcoming.
The approach taken in this paper has largely been empirical. Framing the problem as one of optimization will allow us to reason about the proposed approach more robustly; picking windows deterministically, or taking response time into account, for example. It will also allow us to build and compare other approaches. In our own experiments, treating the problem as one of classification rather than threshold based object detection has yet to show promise. However it is a worthy effort that deserves exploration.
Finally, picking thresholds based on training set abstention rates is limiting. Ideally, we should also take downstream resource availability into account. For example, the phone model optimizing for network availability, or the cloud model accounting for the human expert limitations. Such an approach has precedence (Dvijotham et al. 2023; Mozannar and Sontag 2020), and is a line of work worth pursuing.
Responsible AI deployment is an imperative; especially as AI systems become ingrained in increasingly more critical tasks. Using a multi-stage approach is one we are excited to see become more broadly adopted.
Acknowledgements
We thank our fellow team members for their various contributions to the project: Jatin Agarwal, Ayushi Bhotica, Soma Dhavala, Sonali Ghike, Fahad Khan, Abhishek Kumar, Anika Murarka, Srinivasa Rao, Mohammad Salman, and JP Tripathi. We also thank the anonymous reviewers for their insightful feedback.
References
- Bhatt et al. (2021) Bhatt, U.; Antorán, J.; Zhang, Y.; Liao, Q. V.; Sattigeri, P.; Fogliato, R.; Melançon, G.; Krishnan, R.; Stanley, J.; Tickoo, O.; Nachman, L.; Chunara, R.; Srikumar, M.; Weller, A.; and Xiang, A. 2021. Uncertainty as a Form of Transparency: Measuring, Communicating, and Using Uncertainty. In Conference on AI, Ethics, and Society, 401––413. ACM/AAAI.
- Dalmia et al. (2020) Dalmia, A.; White, J.; Chaurasia, A.; Agarwal, V.; Jain, R.; Vora, D.; Dhame, B.; Dharmaraju, R.; and Panicker, R. 2020. Pest Management In Cotton Farms: An AI-System Case Study from the Global South. In International Conference on Knowledge Discovery and Data Mining, KDD, 3119–3127. ACM.
- Dvijotham et al. (2023) Dvijotham, K.; Winkens, J.; Barsbey, M.; Ghaisas, S.; Stanforth, R.; Pawlowski, N.; Strachan, P.; Ahmed, Z.; Azizi, S.; Bachrach, Y.; Culp, L.; Daswani, M.; Freyberg, J.; Kelly, C.; Kiraly, A.; Kohlberger, T.; McKinney, S.; Mustafa, B.; Natarajan, V.; Geras, K.; Witowski, J.; Qin, Z. Z.; Creswell, J.; Shetty, S.; Sieniek, M.; Spitz, T.; Corrado, G.; Kohli, P.; Cemgil, T.; and Karthikesalingam, A. 2023. Enhancing the reliability and accuracy of AI-enabled diagnosis via complementarity-driven deferral to clinicians. Nature Medicine, 29(7): 1814–1820.
- Greis et al. (2017) Greis, M.; Hullman, J.; Correll, M.; Kay, M.; and Shaer, O. 2017. Designing for Uncertainty in HCI: When Does Uncertainty Help? In CHI Conference Extended Abstracts on Human Factors in Computing Systems, 593––600. ACM.
- Harsha et al. (2022) Harsha, K.; Banerjee, K.; Vinooth, P.; Varshney, S.; Gupta, S.; and Jasrotia, S. 2022. Comparative Analysis of Smart Pesticide Recommendation System sing ML/AI. In International Conference on Contemporary Computing and Informatics, 2222–2226.
- Kaur et al. (2022) Kaur, D.; Uslu, S.; Rittichier, K. J.; and Durresi, A. 2022. Trustworthy Artificial Intelligence: A Review. ACM Computing Surveys, 55(2).
- Kocielnik, Amershi, and Bennett (2019) Kocielnik, R.; Amershi, S.; and Bennett, P. N. 2019. Will You Accept an Imperfect AI? Exploring Designs for Adjusting End-User Expectations of AI Systems. In CHI Conference on Human Factors in Computing Systems, 1––14. ACM.
- Lai et al. (2023) Lai, V.; Chen, C.; Smith-Renner, A.; Liao, Q. V.; and Tan, C. 2023. Towards a Science of Human-AI Decision Making: An Overview of Design Space in Empirical Human-Subject Studies. In Conference on Fairness, Accountability, and Transparency, 1369––1385. ACM.
- Mozannar and Sontag (2020) Mozannar, H.; and Sontag, D. 2020. Consistent Estimators for Learning to Defer to an Expert. In III, H. D.; and Singh, A., eds., International Conference on Machine Learning, volume 119 of Proceedings of Machine Learning Research, 7076–7087. PMLR.
- Najork et al. (2021) Najork, K.; Gadela, S.; Nadiminti, P.; Gosikonda, S.; Reddy, R.; Haribabu, E.; and Keck, M. 2021. The Return of Pink Bollworm in India’s Bt Cotton Fields: Livelihood Vulnerabilities of Farming Households in Karimnagar District. Progress in Development Studies, 21(1): 68–85.
- Park et al. (2019) Park, J. S.; Barber, R.; Kirlik, A.; and Karahalios, K. 2019. A Slow Algorithm Improves Users’ Assessments of the Algorithm’s Accuracy. Human Compututer Interaction, 3.
- Redmon et al. (2016) Redmon, J.; Divvala, S.; Girshick, R.; and Farhadi, A. 2016. You Only Look Once: Unified, Real-Time Object Detection. arXiv:1506.02640.
- Toscano-Miranda et al. (2022) Toscano-Miranda, R.; Toro, M.; Aguilar, J.; Caro, M.; Marulanda, A.; and Trebilcok, A. 2022. Artificial-intelligence and sensing techniques for the management of insect pests and diseases in cotton: a systematic literature review. The Journal of Agricultural Science, 160(1-2): 16––31.
- White et al. (2023) White, J.; Agrawal, C.; Ojha, A.; Agnihotri, A.; Sharma, M.; and Doshi, J. 2023. BOLLWM: A real-world dataset for bollworm pest monitoring from cotton fields in India. In Workshop on Practical Machine Learning for Developing Countries. ICLR.
- White et al. (2022) White, J.; Madaan, P.; Shenoy, N.; Agnihotri, A.; Sharma, M.; and Doshi, J. 2022. A Case for Rejection in Low Resource ML Deployment. In Workshop on Challenges In Deploying And Monitoring Machine Learning Systems. NeurIPS.
- Wilder, Horvitz, and Kamar (2020) Wilder, B.; Horvitz, E.; and Kamar, E. 2020. Learning to Complement Humans. In Bessiere, C., ed., International Joint Conference on Artificial Intelligence, 1526–1533. International Joint Conferences on Artificial Intelligence Organization.