Observation of the scaling dimension of fractional quantum Hall anyons
Abstract
Unconventional quasiparticles emerging in the fractional quantum Hall regime [1] present the challenge of observing their exotic properties unambiguously. Although the fractional charge of quasiparticles has been demonstrated since nearly three decades [2, 3, 4], the first convincing evidence of their anyonic quantum statistics has only recently been obtained [5, 6] and, so far, the so-called scaling dimension that determines the quasiparticles’ propagation dynamics remains elusive. In particular, while the non-linearity of the tunneling quasiparticle current should reveal their scaling dimension, the measurements fail to match theory, arguably because this observable is not robust to non-universal complications [7, 8, 9, 10, 11]. Here we achieve an unambiguous measurement of the scaling dimension from the thermal to shot noise cross-over, and observe a long-awaited agreement with expectations. Measurements are fitted to the predicted finite temperature expression involving both the quasiparticles scaling dimension and their charge [11, 12], in contrast to previous charge investigations focusing on the high bias shot noise regime [13]. A systematic analysis, repeated on multiple constrictions and experimental conditions, consistently matches the theoretical scaling dimensions for the fractional quasiparticles emerging at filling factors , and . This establishes a central property of fractional quantum Hall anyons, and demonstrates a powerful and complementary window into exotic quasiparticles.
Exotic quasiparticles could provide a path to protected manipulations of quantum information [14]. Yet their basic features are often challenging to ascertain experimentally. The broad variety of quasiparticles emerging in the regimes of the fractional quantum Hall effect constitutes a prominent illustration [1]. These are characterized by three unconventional properties [15, 16]: (i) their charge is a fraction of the elementary electron charge , (ii) their anyonic quantum statistics is different from that of bosons and fermions, and (iii) the dynamical response to their injection or removal along the propagative edge channels is peculiar, ruled by a ‘scaling dimension’ different from the trivial of non-interacting electrons. In the simplest Laughlin quantum Hall states, at filling factors (), the fractional anyon quasiparticles have a charge , an exchange phase and a scaling dimension . Despite four decades of uninterrupted investigations of the quantum Hall physics, experimental confirmations of the predicted scaling dimension remain lacking, including for Laughlin fractions.
Such a gap may appear surprising since plays a role in most transport phenomena across quantum point contacts (QPC), the basic building block of quantum Hall circuits. Indeed, the elementary tunneling process itself consists in the removal of a quasiparticle on one side of a QPC and its reinjection on the other side, whose time correlations are set by [15, 16]. In Luttinger liquids, the quasiparticles’ scaling dimension is related to the interaction strength, also referred to as the interaction parameter , which notably determines the non-linear characteristics across a local impurity [17]. Consequently, the knowledge of is often a prerequisite to connect a transport observable with a property of interest. Furthermore, as straightforwardly illustrated in the Hong-Ou-Mandel setup [18, 19, 20], naturally rules time controlled manipulations of anyons, which are required in the perspective of topologically protected quantum computation based on braiding [14]. In this work, the scaling dimension of fractional quantum Hall quasiparticles is disclosed from the thermal noise to shot noise crossover, as recently proposed [11, 12]. The observed good agreement with universal predictions experimentally establishes the theoretical understanding and completes our picture of the exotic fractional quantum Hall anyons.
Characterizing exotic quasiparticles.
The first unconventional property of quantum Hall quasiparticles that has been established is their fractional charge .
Consistent values were observed by multiple experimental approaches, with the main body of investigations based on shot noise measurements across a QPC [2, 3, 4, 21, 22, 23, 24, 25, 26, 27].
In this case, the scaling dimension can be canceled out, leaving only , by focusing on the ratio between shot noise and tunneling current (the Fano factor) at high bias voltages.
The non-standard braiding statistics of fractional quasiparticles turned out more challenging to observe.
Convincing evidences were obtained only recently, through Aharonov-Bohm interferometry [5, 28] as well as from noise measurements in a ‘collider’ geometry [6, 29, 30, 31].
Note that whereas the latter strategy is particularly versatile, the noise signal is also entangled with the scaling dimension [32, 33, 19, 20], which complicates a quantitative determination of the anyon exchange phase [29].
Finally, the quasiparticles scaling dimension was previously investigated through measurements of the non-linear current-voltage characteristics of a QPC [34, 35, 36].
However, no reliable value of could be obtained for the fractional quasiparticles of the quantum Hall regime (see [37] for an observation in a circuit quantum simulator, and [38] for a good match on the of tunneling electrons across a interface).
Indeed, the characteristics is generally found at odds with the standard model of a chiral Luttinger liquid with a local impurity (see e.g. [39, 40, 13, 16] and references therein).
Most often a fit is impossible, or only by introducing extra offsets and with unrealistic values for and [35, 41, 36, 30].
The puzzling situation motivated multiple theoretical investigations. A simple possible explanation for the data-theory mismatch is that the shape of the QPC potential, and therefore the quasiparticle tunneling amplitude, is impacted by external parameters, such as an electrostatic deformation induced by a change in the applied bias voltage, the temperature or the tunneling current itself [9]. Other possible non-universal complications include an energy-dependent tunneling amplitude [10], additional edge modes either localized [7] or propagative [42, 43], and Coulomb interactions between different edges [8]. In this context, the scaling dimension was connected to different, arguably more robust proposed observables such as delta- noise [44, 45], thermal to shot noise crossover [11, 12] and thermal Fano factor [46].
A proven strategy to cancel out non-universal behaviors consists in considering a well-chosen ratio of transport properties, as illustrated by the Fano factor successfully used to extract . Recently, it was proposed that the same could also give access to the quasiparticles’ scaling dimension, when focusing on the lower bias voltage regime where the crossover between thermal noise and shot noise takes place [11, 12]. As further detailed later-on, the predicted evolution of along the crossover exhibits a markedly different width and overall shape depending on the value of .
The present investigation implements the characterization of the scaling dimension from the Fano factor crossover on four different quantum Hall quasiparticles [15, 47]: (i) the quasiparticles at and along the outer edge channel at , of predicted ; (ii) the quasiparticles along the inner edge channel at , of predicted ; (iii) the quasiparticles at , of predicted ; (iv) the electrons at of trivial .
Experimental implementation.
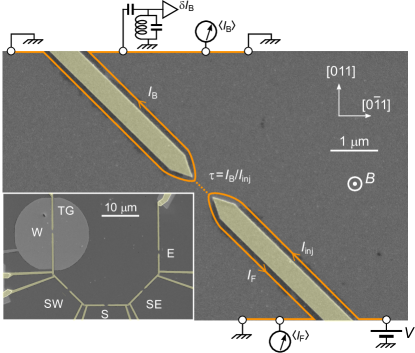
The measured sample is shown in Fig. 1 together with a schematic representation of the setup.
It is nanofabricated by e-beam lithography from a Ga(Al)As two-dimensional electron gas (2DEG).
The experiments are performed at mK, if not specified otherwise, and the sample is immersed in a strong perpendicular magnetic field corresponding to the quantum Hall effect at filling factors .
In these quantum Hall regimes, the current propagates chirally along the sample edges, as schematically pictured by lines with arrows.
The buried 2DEG is electrically connected through large ohmic contacts (depicted as circles) positioned m away from the QPCs.
Quantum point contacts are formed in the 2DEG by field effect, within the opening of metallic split gates (yellow) deposited at the surface, on top of an intercalated layer of HfO2.
We characterize a QPC by the gate-controlled transmission ratio , with the back-scattered current and the incident current along the partially transmitted edge channel (the other channels at and are either fully reflected or transmitted).
The sample includes five QPCs of different orientations with respect to the Ga(Al)As crystal.
A specific QPC is individually addressed by completely closing all the other ones.
The split gates geometry is nominally identical for all QPCs.
QPCW, of identical orientation as QPCE, also includes an additional top-gate, which allows us to locally tune the 2DEG density, and increases the screening of long-range Coulomb interactions [8, 48] and the sharpness of the edge confinement potential [42].
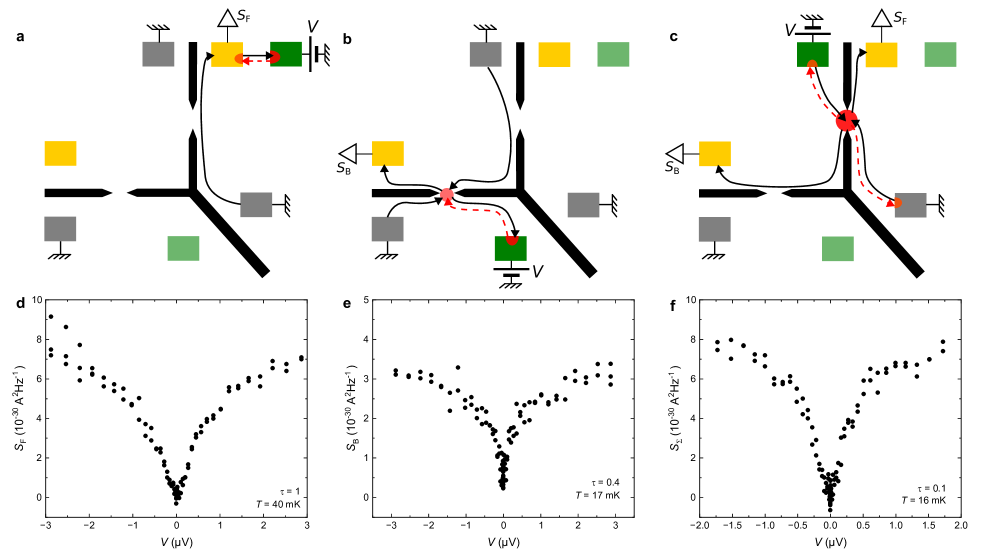
The central noise signal is measured using two homemade cryogenic amplifiers (one schematically shown). These are connected through nearly identical tank circuits. A reliable and independent knowledge of the electronic temperature within the device and of the gain of the amplification chain are particularly crucial for the analysis of the thermal to shot noise crossover. This was achieved through the robust fluctuation-dissipation relation to thermal noise (Methods). One cryogenic amplifier (top-left in Fig. 1) measures the back-scattered (tunneling) current noise for any addressed QPCs. The second cryogenic amplifier (not shown) measures the forward current fluctuations transmitted specifically across QPCE. Therefore, for QPCE we also have access to the noise in the forward current and to the cross-correlations between forward and back-scattered current fluctuations . Besides increasing the signal to noise ratio, this allows one to ascertain that matches the more robust cross-correlation signal [49]. In practice, the additional noise introduced by the amplification chains is removed by focusing on the excess noise with respect to zero bias: .
Scaling dimension characterization.
In previous characterizations of the charge of fractional quantum Hall quasiparticles, the shot noise is usually plotted as a function of the back-scattered current , and is extracted by matching the high-bias slope with , where corrects for tunneling correlations at finite [50].
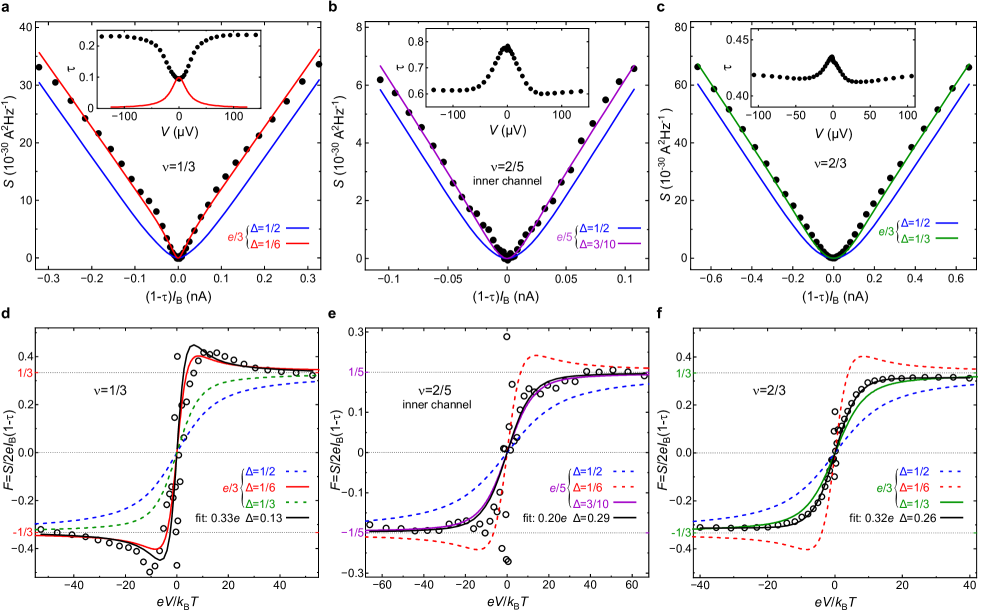
Even in this representation, which adequately puts the emphasis on the larger high-bias shot noise, a visually discernible and experimentally relevant difference allows one to discriminate between predicted and trivial , as illustrated in the first row of Fig. 2.
Blue continuous lines display the excess shot noise of quasiparticles of trivial and of charge (a,c) or (b), which is given by the broadly used phenomenological expression [50, 13]:
| (1) |
The continuous lines of a different color in the main panels of Fig. 2a,b,c show the excess noise for the predicted quasiparticle scaling dimension (red, (a)), (purple, (b)) and (green, (c)) obtained from [7, 11, 12]:
| (2) |
with the digamma function and the ad hoc amplitude factor used for extracting from the shot noise slope at high bias. (Note that Eq. 2 reduces to Eq. 1 at .) The difference is strongest for the quasiparticles predicted at , with an apparent width of the thermal-shot noise crossover more than twice narrower than for (Fig. 2a). The difference is smaller for the quasiparticles and since is closer to (Fig. 2b,c). Nevertheless, as can be straightforwardly inferred from the scatter of the data, it remains in all cases larger than our experimental resolution on the noise. One can already notice that the illustrative shot noise measurements shown in Fig. 2a,b,c are closer to the parameter-free prediction of Eq. 2 with the expected . Note that this agreement is accompanied by a puzzling characteristics as previously mentioned (see in insets and also in Supplementary Fig. S6).
For the present aim of characterizing from the thermal-shot noise crossover, the Fano factor of bounded amplitude at high bias is better suited [11, 12]. It is plotted versus the relevant variable (see Eq. 2) in the lower row of Fig. 2, with symbols and colored lines corresponding to the noise displayed in the panel immediately above. Importantly, the effect of on is not limited to an increased slope at low bias, which could in principle be attributed to a temperature lower than the separately characterized , but results in marked changes in the overall shape of . In particular, for the Fano factor is non-monotonous (red line in Fig. 2d). The increasing steepness while reducing combined with an overall change of shape facilitates the extraction of this parameter from a fit of the noise data using Eq. 2. Qualitatively, the value of at large bias solely reflects , the overall cross-over shape (such as a non-monotonous dependence at ) solely involves , and the low-bias slope is a combination of both and . The results of such fits (minimizing the data-Eq. 2 variance) are shown as black continuous lines in Fig. 2d,e,f, together with the corresponding fitting parameters and (the temperature being fixed to the separately determined mK). In order to firmly establish the extracted values of the quasiparticles scaling dimension, and to test the universal character of our observations, the same procedure was systematically repeated on numerous device settings, as detailed in the next section.
Robustness of observations.
Focusing on the Fano factor cancels out some of the non-universal behaviors, but not all of them.
Of particular concern are the disorder-induced resonances, which could result in a Coulomb-dominated sequential tunneling with a strong effect on the Fano factor.
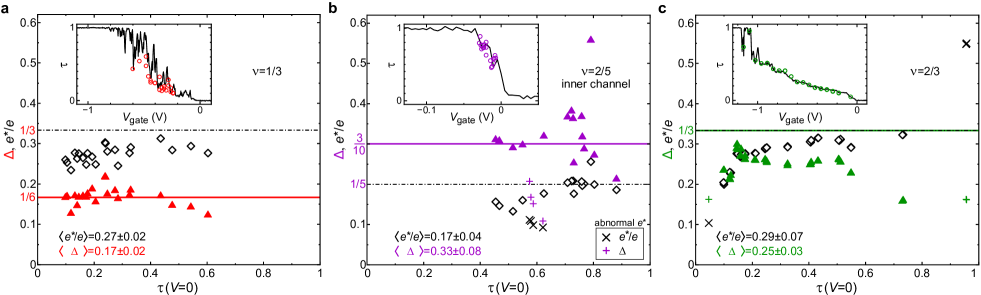
This is likely to happen in the fractional quantum Hall regime where QPCs often exhibit narrow peaks and dips in their transmission versus gate voltage (see insets in Fig. 3).
Accordingly, for some gate voltages we find that an accurate fit of the noise data is not possible with Eq. 2, whatever and .
In such cases, the resulting fitted values are meaningless.
This was transparently addressed with a maximum variance criteria between data and best fit.
If the fit-data variance is higher than this, the extracted and are discarded (see Methods).
This same procedure was systematically applied to all the noise measurements performed over a broad span of gate voltages controlling (the full data set, including discarded fits and analysis code, is available in a Zenodo deposit).
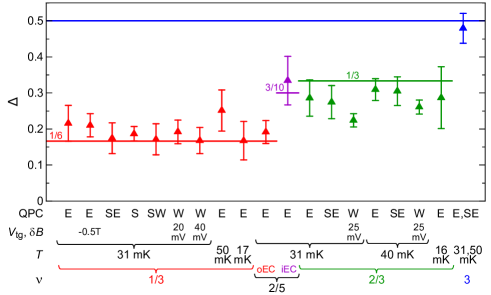
The values of and obtained while spanning the gate voltage of the same QPCE are shown versus in Fig. 3, for each of the three probed fractional quasiparticles (see Supplementary Information for electrons at ). We find remarkably robust scaling dimensions (and charges), close to the predictions shown as horizontal lines. In particular, although the nature of the tunneling quasiparticles is eventually going to change at , we observe that and extracted with Eq. 2 (which is exact only at ) remain relatively stable over a broad range of . Such a stability matches previous measurements, including a particularly steady [51]. Figure 3a shows data points obtained in the plateau. A statistical analysis of the ensemble of these points yields with a spread of , which is to be compared with the prediction . The data-prediction agreement on is at the level, if not better, than that on (often found slightly lower than expected). Similar sweeps are shown in Fig. 3b,c for the inner channel of conductance at (b), and at (c). Note that a few data points at and at are displayed as pairs of ‘’ () and ‘’ () instead of open and full symbols (Fig. 3, panels b and c). This indicates an anomalous fitted value of the charge , off by about 50% or more from the well-established prediction and respectively (dash-dot line). Because this suggests a non-canonical QPC behavior with substantial consequences on the mean and spread of , we chose not to include these relatively rare points in the data ensemble analysis of (they remain included in the statistical analysis of ). For this reduced data set composed of fifteen measurements along the inner channel at , we obtain with a spread of , which is to be compared with the predicted of quasiparticles. Lastly, at , the gate voltage sweep shown in Fig. 3c gives and , close to the predicted .
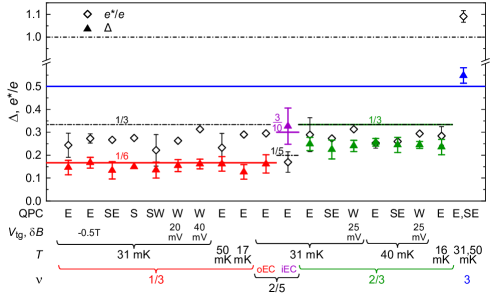
The robustness and generic character of these observations are further established by repeating the same procedure in different configurations: (i) on several QPCs, with different orientations with respect to the Ga(Al)As crystal; (ii) for multiple temperatures ; (iii) for several top gate voltages controlling the density in the vicinity of QPCW; (iv) by changing the magnetic field, both along the plateau and to on the outer edge channel. Figure 4 recapitulates all our measurements (283 in total), including conventional electrons at . Each point represents the average value () or () and the corresponding standard deviation obtained while broadly spanning the gate voltage of the indicated QPC (individually extracted and are provided in Supplementary Information). See also Methods for consistent conclusions from an alternative fitting procedure where is the only free parameter ( being fixed to the well-established prediction, and focusing on low voltages ).
Conclusion.
Fano factor measurements previously used to investigate the charge of tunneling quasiparticles also allow for a consistent determination of their scaling dimension, from the width and specific shape of .
Combined with a systematic approach, the resulting observations of establish long-lasting theoretical predictions for the fractional quantum Hall quasiparticles at , and .
This approach could be generalized to other quasiparticles, and in particular to shed light on the non-abelian quantum Hall quasiparticles predicted at even-denominator filling factors [52].
References
- Stern [2008] Stern, A. Anyons and the quantum Hall effect—A pedagogical review. Ann. Phys. 323, 204–249 (2008).
- Goldman & Su [1995] Goldman, V. J. & Su, B. Resonant Tunneling in the Quantum Hall Regime: Measurement of Fractional Charge. Science 267, 1010–1012 (1995).
- de Picciotto et al. [1997] de Picciotto, R. et al. Direct observation of a fractional charge. Nature 389, 162–164 (1997).
- Saminadayar et al. [1997] Saminadayar, L., Glattli, D. C., Jin, Y. & Etienne, B. Observation of the Fractionally Charged Laughlin Quasiparticle. Phys. Rev. Lett. 79, 2526–2529 (1997).
- Nakamura et al. [2020] Nakamura, J., Liang, S., Gardner, G. C. & Manfra, M. J. Direct observation of anyonic braiding statistics. Nat. Phys. 16, 931–936 (2020).
- Bartolomei et al. [2020] Bartolomei, H. et al. Fractional statistics in anyon collisions. Science 368, 173–177 (2020).
- Rosenow & Halperin [2002] Rosenow, B. & Halperin, B. I. Nonuniversal Behavior of Scattering between Fractional Quantum Hall Edges. Phys. Rev. Lett. 88, 096404 (2002).
- Papa & MacDonald [2004] Papa, E. & MacDonald, A. H. Interactions Suppress Quasiparticle Tunneling at Hall Bar Constrictions. Phys. Rev. Lett. 93, 126801 (2004).
- Shtanko et al. [2014] Shtanko, O., Snizhko, K. & Cheianov, V. Nonequilibrium noise in transport across a tunneling contact between fractional quantum Hall edges. Phys. Rev. B 89, 125104 (2014).
- Dolcetto et al. [2012] Dolcetto, G., Barbarino, S., Ferraro, D., Magnoli, N. & Sassetti, M. Tunneling between helical edge states through extended contacts. Phys. Rev. B 85, 195138 (2012).
- Snizhko & Cheianov [2015] Snizhko, K. & Cheianov, V. Scaling dimension of quantum Hall quasiparticles from tunneling-current noise measurements. Phys. Rev. B 91, 195151 (2015).
- Schiller et al. [2022] Schiller, N., Oreg, Y. & Snizhko, K. Extracting the scaling dimension of quantum Hall quasiparticles from current correlations. Phys. Rev. B 105, 165150 (2022).
- Heiblum [2010] Heiblum, M. Fractional Charge Determination via Quantum Shot Noise Measurements, 115–136 (in Perspectives of Mesoscopic Physics, Edited by A. Aharony and O. Antin-Wholman, World Scientific Publishing, 2010).
- Nayak et al. [2008] Nayak, C., Simon, S. H., Stern, A., Freedman, M. & Das Sarma, S. Non-Abelian anyons and topological quantum computation. Rev. Mod. Phys. 80, 1083–1159 (2008).
- Wen [2004] Wen, X. G. Quantum Field Theory of Many-Body Systems: From the Origin of Sound to an Origin of Light and Electrons (Oxford University Press, Oxford, 2004).
- Jain [2007] Jain, J. Composite Fermions (Cambridge University Press, Cambridge, 2007).
- Giamarchi [2004] Giamarchi, T. Quantum Physics in One Dimension. International Series of Monographs on Physics (Oxford University Press, 2004).
- Jonckheere et al. [2023] Jonckheere, T., Rech, J., Grémaud, B. & Martin, T. Anyonic Statistics Revealed by the Hong-Ou-Mandel Dip for Fractional Excitations. Phys. Rev. Lett. 130, 186203 (2023).
- Iyer et al. [2023] Iyer, K. et al. The finite width of anyons changes their braiding signature (2023). ArXiv: 2311.15094.
- Thamm & Rosenow [2023] Thamm, M. & Rosenow, B. Finite Soliton Width Matters: Investigating Non-equilibrium Exchange Phases of Anyons (2023). ArXiv: 2312.04475.
- Reznikov et al. [1999] Reznikov, M., de Picciotto, R., Griffiths, T., Heiblum, M. & Umansky, V. Observation of quasiparticles with one-fifth of an electron’s charge. Nature 399, 238–241 (1999).
- Martin et al. [2004] Martin, J. et al. Localization of Fractionally Charged Quasi-Particles. Science 305, 980–983 (2004).
- Dolev et al. [2008] Dolev, M., Heiblum, M., Umansky, V., Stern, A. & Mahalu, D. Observation of a quarter of an electron charge at the = 5/2 quantum Hall state. Nature 452, 829–834 (2008).
- Venkatachalam et al. [2011] Venkatachalam, V., Yacoby, A., Pfeiffer, L. & West, K. Local charge of the = 5/2 fractional quantum Hall state. Nature 469, 185–188 (2011).
- Kapfer et al. [2019] Kapfer, M. et al. A Josephson relation for fractionally charged anyons. Science 363, 846–849 (2019).
- Bisognin et al. [2019] Bisognin, R. et al. Microwave photons emitted by fractionally charged quasiparticles. Nature Communications 10, 1708 (2019).
- Röösli et al. [2021] Röösli, M. P. et al. Fractional Coulomb blockade for quasi-particle tunneling between edge channels. Science Advances 7, eabf5547 (2021).
- Nakamura et al. [2023] Nakamura, J., Liang, S., Gardner, G. C. & Manfra, M. J. Fabry-Pérot Interferometry at the Fractional Quantum Hall State. Phys. Rev. X 13, 041012 (2023).
- Glidic et al. [2023a] Glidic, P. et al. Cross-Correlation Investigation of Anyon Statistics in the and Fractional Quantum Hall States. Phys. Rev. X 13, 011030 (2023a).
- Ruelle et al. [2023] Ruelle, M. et al. Comparing Fractional Quantum Hall Laughlin and Jain Topological Orders with the Anyon Collider. Phys. Rev. X 13, 011031 (2023).
- Lee et al. [2023] Lee, J.-Y. M. et al. Partitioning of diluted anyons reveals their braiding statistics. Nature 617, 281 (2023).
- Rosenow et al. [2016] Rosenow, B., Levkivskyi, I. P. & Halperin, B. I. Current Correlations from a Mesoscopic Anyon Collider. Phys. Rev. Lett. 116, 156802 (2016).
- Lee & Sim [2022] Lee, J.-Y. M. & Sim, H.-S. Non-Abelian anyon collider. Nature Communications 13, 6660 (2022).
- Roddaro et al. [2004a] Roddaro, S., Pellegrini, V., Beltram, F., Biasiol, G. & Sorba, L. Interedge Strong-to-Weak Scattering Evolution at a Constriction in the Fractional Quantum Hall Regime. Phys. Rev. Lett. 93, 046801 (2004a).
- Radu et al. [2008] Radu, I. P. et al. Quasi-particle properties from Tunneling in the = 5/2 Fractional Quantum Hall State. Science 320, 899 (2008).
- Baer et al. [2014] Baer, S. et al. Experimental probe of topological orders and edge excitations in the second Landau level. Phys. Rev. B 90, 075403 (2014).
- Anthore et al. [2018] Anthore, A. et al. Circuit Quantum Simulation of a Tomonaga-Luttinger Liquid with an Impurity. Phys. Rev. X 8, 031075 (2018).
- Cohen et al. [2023] Cohen, L. A. et al. Universal chiral Luttinger liquid behavior in a graphene fractional quantum Hall point contact. Science 382, 542–547 (2023).
- Chang [2003] Chang, A. M. Chiral Luttinger liquids at the fractional quantum Hall edge. Rev. Mod. Phys. 75, 1449–1505 (2003).
- Roddaro et al. [2004b] Roddaro, S., Pellegrini, V., Beltram, F., Biasiol, G. & Sorba, L. Interedge Strong-to-Weak Scattering Evolution at a Constriction in the Fractional Quantum Hall Regime. Phys. Rev. Lett. 93, 046801 (2004b).
- Lin et al. [2012] Lin, X., Dillard, C., Kastner, M. A., Pfeiffer, L. N. & West, K. W. Measurements of quasiparticle tunneling in the fractional quantum Hall state. Phys. Rev. B 85, 165321 (2012).
- Yang [2003] Yang, K. Field Theoretical Description of Quantum Hall Edge Reconstruction. Phys. Rev. Lett. 91, 036802 (2003).
- Ferraro et al. [2008] Ferraro, D., Braggio, A., Merlo, M., Magnoli, N. & Sassetti, M. Relevance of Multiple Quasiparticle Tunneling between Edge States at . Phys. Rev. Lett. 101, 166805 (2008).
- Rech et al. [2020] Rech, J., Jonckheere, T., Grémaud, B. & Martin, T. Negative Delta- Noise in the Fractional Quantum Hall Effect. Phys. Rev. Lett. 125, 086801 (2020).
- Zhang et al. [2022] Zhang, G., Gornyi, I. V. & Spånslätt, C. Delta- noise for weak tunneling in one-dimensional systems: Interactions versus quantum statistics. Phys. Rev. B 105, 195423 (2022).
- Ebisu et al. [2022] Ebisu, H., Schiller, N. & Oreg, Y. Fluctuations in Heat Current and Scaling Dimension. Phys. Rev. Lett. 128, 215901 (2022).
- Kane & Fisher [1995] Kane, C. L. & Fisher, M. P. A. Impurity scattering and transport of fractional quantum Hall edge states. Phys. Rev. B 51, 13449–13466 (1995).
- Kamata et al. [2014] Kamata, H., Kumada, N., Hashisaka, M., Muraki, K. & Fujisawa, T. Fractionalized wave packets from an artificial Tomonaga–Luttinger liquid. Nature Nanotechnology 9, 177–181 (2014).
- Batra & Feldman [2023] Batra, N. & Feldman, D. E. Different fractional charges from auto- and cross-correlation noise in quantum Hall states without upstream modes (2023). ArXiv: 2307.03713.
- Blanter & Büttiker [2000] Blanter, Y. & Büttiker, M. Shot noise in mesoscopic conductors. Phys. Rep. 336, 1–166 (2000).
- Griffiths et al. [2000] Griffiths, T. G., Comforti, E., Heiblum, M., Stern, A. & Umansky, V. Evolution of Quasiparticle Charge in the Fractional Quantum Hall Regime. Phys. Rev. Lett. 85, 3918–3921 (2000).
- Muralidharan et al. [2023] Muralidharan, B., Kumar, M. & Li, C. Emerging quantum hybrid systems for non-Abelian-state manipulation. Front. Nanotechnol. 5 (2023).
- Davies & Larkin [1994] Davies, J. H. & Larkin, I. A. Theory of potential modulation in lateral surface superlattices. Phys. Rev. B 49, 4800–4809 (1994).
- Iftikhar et al. [2016] Iftikhar, Z. et al. Primary thermometry triad at 6 mK in mesoscopic circuits. Nat. Commun. 7, 12908 (2016).
- Liang et al. [2012] Liang, Y., Dong, Q., Gennser, U., Cavanna, A. & Jin, Y. Input Noise Voltage Below 1 nV/Hz1/2 at 1 kHz in the HEMTs at 4.2 K. J. Low Temp. Phys. 167, 632–637 (2012).
- Jezouin et al. [2013] Jezouin, S. et al. Quantum Limit of Heat Flow Across a Single Electronic Channel. Science 342, 601–604 (2013).
- Glidic et al. [2023b] Glidic, P. et al. Quasiparticle Andreev scattering in the fractional quantum Hall regime. Nature Communications 14, 514 (2023b).
- Gross et al. [2012] Gross, Y., Dolev, M., Heiblum, M., Umansky, V. & Mahalu, D. Upstream Neutral Modes in the Fractional Quantum Hall Effect Regime: Heat Waves or Coherent Dipoles. Phys. Rev. Lett. 108, 226801 (2012).
- Bid et al. [2009] Bid, A., Ofek, N., Heiblum, M., Umansky, V. & Mahalu, D. Shot Noise and Charge at the Composite Fractional Quantum Hall State. Phys. Rev. Lett. 103, 236802 (2009).
- Kane et al. [1994] Kane, C. L., Fisher, M. P. A. & Polchinski, J. Randomness at the edge: Theory of quantum Hall transport at filling =2/3. Phys. Rev. Lett. 72, 4129–4132 (1994).
Data and code availability. Plotted data, raw data and data analysis code are available on Zenodo: https://doi.org/10.5281/zenodo.10599319
Acknowledgments. This work was supported by the European Research Council (ERC-2020-SyG-951451) and the French RENATECH network. We thank K. Snizhko for discussions and E. Boulat for providing the prediction at in Fig. 2.
Author Contributions. A.V., C.P., P.G., Y.S. and F.P. performed the experiments with inputs from A.Aa. and A.An.; A.V. and F.P. analyzed the data with inputs from A.An., C.P., P.G. and Y.S.; A.C. and U.G. grew the 2DEG; A.V., A.Aa, and F.P. fabricated the sample; Y.J. fabricated the HEMT used in the cryogenic noise amplifiers; A.V. and F.P. wrote the manuscript with contributions from all authors; A.An. and F.P. led the project.
Author Information.
Correspondence and requests for materials should be addressed to A.An. (anne.anthore@c2n.upsaclay.fr) and F.P. (frederic.pierre@cnrs.fr).
Note added.– Coincident to the present investigation, two other works are experimentally addressing the scaling dimension of the fractional quantum Hall quasiparticles at . An experiment by the team of M. Heiblum with a theoretical analysis led by K. Snizhko (N. Schiller et al., in preparation) exploits the same thermal to shot noise crossover as in the present work, with a focus on low voltages and assuming the predicted fractional charge (see Fig. 5 for such a single parameter data analysis at low bias), and finds . The team of G. Feve (M. Ruelle et al., submitted) relies on a different, dynamical response signature and finds . In these two coincident works the extracted scaling dimension is different from the pristine prediction , which is observed in the present work. As pointed out in the manuscript, the emergence of non-universal behaviors could be related to differences in the geometry of the QPCs.
METHODS
Sample.
The sample is nanofabricated by e-beam lithography on a Ga(Al)As heterojunction forming a 2DEG buried at 140 nm, of density cm-2, and of mobility cm2V-1s-1.
The 2DEG mesa is first delimited by a wet etching of 105 nm, deeper than the Si -doping located 65 nm below the Ga(Al)As surface.
The large ohmic contacts are then formed by e-beam evaporation of a AuGeNi stack followed by a 50s thermal annealing at 440∘C.
A 15 nm layer of HfO2 is grown by thermal ALD at 100∘C over the entire mesa, in order to strongly reduce a gate-induced degradation of the 2DEG that could complicate the edge physics.
This degradation is generally attributed to unequal thermal contractions upon cooling [53] or a deposition stress, which could also modulate the edge potential carrying the quantum Hall channels along the gates.
The Ti (5 nm) - Au (20 nm) gates used to form the QPCs are evaporated on top of the HfO2.
The split gates have a nominal tip-to-tip distance of 600 nm and a 25∘ tip opening angle prolonged until a gate width of 430 nm.
The relatively important gate width (about three times the 2DEG depth) was chosen to reduce possible complications from Coulomb interactions between the quantum Hall edges across the gates [8, 48], and to better localize the tunneling location when the QPC is almost open (for less negative gate voltages) [10].
The nominal separation between the split gates controlling QPCW and the surrounding metal gate is 150 nm.
Note that all the gates were grounded during the cooldown.
Additional pictures of the sample are displayed in the Supplementary Information.
Measurement setup. The sample is cooled in a cryofree dilution refrigerator and electrically connected through measurement lines both highly-filtered and strongly anchored thermally (see [54] for details). Final filters with CMS components are positioned within the same metallic enclosure screwed to the mixing chamber that holds the sample: 200 k-100 nF for gate lines, 10 k-100 nF for the bias line, and 10 k-1 nF for low frequency measurement lines. Note a relatively important filtering of the bias line, which prevents an artificial rounding of the thermal noise-shot noise crossover from the flux noise induced by vibrations in a magnetic field. The differential QPC transmission is measured by standard lock-in techniques at 13 Hz. A particularly small ac modulation is applied on (of rms amplitude ) to avoid any discernible rounding of the thermal noise-shot noise crossover. The transmitted and reflected dc currents are obtained by integrating with the applied bias voltage the corresponding lock-in signal .
Noise measurements are performed using specific cryogenics amplification chains connected to dedicated ohmic contacts, through nearly identical tanks of resonant frequency MHz [55, 56]. The noise ohmic contacts are located upstream of the ohmic contacts used for low frequency transmission measurements, as shown in Fig. 1. A dc block (2.2 nF) at the input of the tanks preserves the low frequency lock-in signal. See Supplementary Information for a discussion of the relationship between measured noise and tunneling noise.
The device was immersed in a magnetic field close to the center of the corresponding Hall resistance plateaus, except when a shift is specifically indicated.
The data at , , and were obtained at T (13.2 T for T), 11.3 T, 6.8 T and T, respectively.
See Supplementary Information for the localization of these working points within a magnetic field sweep of the device.
Thermometry.
The electronic temperature inside the device is ascertained by the noise measured at thermal equilibrium, with all QPCs closed.
For temperatures mK (up to the maximum mK), we find at and that the measured thermal noise is linear with the temperature readings of our calibrated RuO2 thermometer.
This establishes the good thermalization of electrons in the device with the mixing chamber, as well as the calibration of the RuO2 thermometer.
Accordingly, we indifferently get mK from the equilibrium noise or the equivalent RuO2 readings.
At the lowest probed temperatures mK, the RuO2 thermometers are no longer reliable and is obtained from the thermal noise, by linearly extrapolating from mK.
Note that the slope was not recalibrated at , but its change from was calculated from the separately obtained knowledge of the tank circuit parameters, see ‘Noise amplification chains calibration’ below.
Noise amplification chains calibration. The gain factors between raw measurements of the auto-correlations, integrated within a frequency range , and the power spectral density of current fluctuations are obtained from:
| (3) |
with the effective parallel resistance accounting for the dissipation in the considered tank, and the slope of the raw thermal noise versus temperature. The cross-correlation gain factor is simply given by , up to a negligible reduction () due to the small difference between the two tanks. In practice, the thermal noise slopes where only measured at and . The changes in at from the gains at are obtained from:
| (4) |
with the tank impedance given by , where H and pF (see Methods in [57] for details regarding the calibration of the tank parameters).
At , we integrated the noise signal in the same frequency window kHz and kHz.
At , a larger window kHz and kHz takes advantage of the larger bandwidth .
Noise tests.
Among various experimental checks, we point out:
(i) The effect of a dc bias voltage on the noise when each of the QPCs are either fully open or fully closed, which is here found below our experimental resolution.
The presently imperceptible ‘source’ noise could have resulted from poor ohmic contact quality, incomplete electron thermalization in the contacts, dc current heating of the resistive parts of the bias line…
(ii) The effect of the QPC transmission on the noise at zero dc bias voltage, which is here negligible at our experimental resolution.
This rules out a possibly higher electron temperature in the ohmic contact connected to the bias line with respect to one connected to a cold ground, which would translate into an increase in at compared to .
It also shows that the vibration noise in the bias line at frequencies well below 1 MHz does not translate into a discernible broadband excess shot noise for intermediate values of .
Fitting details. The extracted values of and shown in Fig. 3 (see Supplementary Information for the other gate voltage spans) represent the best fit parameters minimizing the variance between the shot noise data and Eq. 2. Only the meaningful points are displayed and included in the statistical analysis. These fulfill two conditions: (i) an accurate fit of the data can be achieved and (ii) the charge does not deviate too much from the expected value. Condition (i) requires a quantitative assessment of the fit accuracy. We used for this purpose the coefficient of determination and chose to apply the same threshold to all the data taken in similar conditions. Specifically, we automatically discarded fits of at and for the outer channel at , for the inner channel at , and at . The number of sweeps discarded by condition (i) is important, 2/3 of the total number (mostly when is too close to 0 or 1). We checked that the overall results are only marginally affected by the specific threshold value (within reasonable variations). All the points that satisfy condition (i) are displayed and included in the statistical analysis of the quasiparticle charge. Condition (ii) is subsequently applied to deal with situations where the fitting charge is found at odds with the predicted value. Specifically we discarded sweeps for which the charge is found to be more than 44% off, i.e. or . The former happens at small with a small QPC gate voltage. This gate voltage might not be enough to deplete the gas under the QPC gates, which could make tunneling happen in several places along the gates, and not only located at their tip, deviating from the model of a point contact. The latter occurs in the so-called strong back-scattering regime where the nature of the tunneling quasiparticles is expected to change. Indeed, in the weak back-scattering regime () the tunnneling barrier between the two edges is made of the electron gas in the fractional quantum Hall regime that selects the quasiparticles. However in the strong back-scattering regime () the tunnneling barrier between the two edges is made of vacuum that will select electrons. The points that do not satisfy condition (ii) are displayed with different symbols and not included in the statistical analysis of . They represent a small fraction (5%) of the data satisfying (i).
A complementary fitting procedure was employed to further establish the robustness of our results. In Fig. 5 we summarize the extracted obtained by fitting the thermal to shot noise crossover of using for the theoretically predicted value. The fits are performed on the same set of sweeps as for the main fitting procedure for (obeying the two above mentioned conditions (i) and (ii)). The voltage bias extension of these fits is reduced to to limit the weight of the shot noise solely sensitive to .
Filling factor 2/3. In this more complex hole conjugate state [15, 16, 47] (i) the edges are not fully chiral and found to carry a backward heat current (going upstream the flow of electricity), and (ii) the QPCs often exhibit a plateau at half transmission (see e.g. [58, 59]). The former may introduce unwanted heat-induced contributions to the noise, while the latter allude to a composite edge structure with possible consequences on the interpretation of the noise signal.
(i) Non-chiral heating. As in previous works (see e.g. [58]), we observe in our device a non-chiral heating (only) at , through three noise signatures, see Fig. 6. (1) The strongest noise signal, seen at all temperatures, is obtained when the noise ohmic contact is electrically upstream a hot spot created m downstream by applying a voltage to an adjacent ohmic contact (e.g. the contact normally used for measuring in Fig. 1, see Fig. 6a for a schematic of the configuration). See Fig. 3 of [58] for a similar observation in the same configuration. Note that in configurations used for investigating , the noise measurement contacts are electrically upstream a floating contact (used to measure ) and, consequently, there is no such hot spot. (2) For the longer distance of m between a hot spot in an ohmic contact and a QPC electrically upstream, a weaker noise signal from a different thermally induced partition mechanism can be detected at and only at the lowest temperature mK (the same configuration is labeled NC in Fig. 4 of [58], see Fig. 6b for a schematic of the configuration). The lower (imperceptible) effect at higher temperatures is expected assuming stronger heat exchanges between counter-propagating neutral and charge modes. Note that in the configurations used to probe the ohmic contacts electrically downstream the QPC are floating (used to measure the noise or ) and, consequently, there is no such hot spot. (3) A possibly more consequential signature of upstream heating is observed when using the configuration to probe through the increase in the noise sum . From charge conservation and the chirality of electrical current, corresponds to the thermal noise from the ohmic contacts electrically upstream the QPC (and not the direct partition noise at the QPC). In fully chiral states such as this temperature is independent of the applied bias , and so is . At and mK this is not the case, which is interpreted as hot spots generated in the m upstream ohmic contacts by neutral modes generated at the voltage-biased QPC (for a previous observation of the same mechanism, see configuration labeled CN in Fig. 4 of [58], see Fig. 6c for a schematic of the configuration). In practice, we observe a fast increase followed by a near saturation at , which is not negligible with respect to the partition noise of interest (see Fig. 2c). To limit the impact of this effect at mK and , we only considered the cross-correlation signal () measured on QPCE. Indeed, a symmetric heating of the two ohmic contacts electrically upstream of QPCE (biased at and grounded) would not result in any change of the cross-correlations (but in a thermally induced increase of the auto-correlations). See [49] for a discussion regarding the increased robustness to artifacts of cross-correlations with respect to auto-correlations. At the higher probed temperatures, there was no discernible change in and we performed our data analysis using all the noise measurements available.
(ii) Noisy plateau. A small plateau at is present in the transmission versus split gate voltage of both QPCE (see inset in Fig. 3c) and QPCSE. For specific voltages applied to the top gate (e.g. mV) a broad plateau can also develop on QPCW (other QPCs were not used at ). These plateaus, which are robust to the application of a bias voltage , suggest the presence of two edge channels sequentially transmitted across the QPC. In that case there would be no partition noise at the QPC and one would naively expect an absence of shot noise. We do observe such noiseless plateaus at and . However, at , we find an important shot noise signal, effectively transparent to the presence of the plateau (see e.g. [59] for a previous observation of a noisy plateau at ). Accordingly, the QPC transmission is here defined as that of a single charge-carrying channel of conductance , in agreement with the widespread theoretical description of the edge as one charge mode and one counter-propagating neutral mode [60].