Exploring the impact of the inverse Faraday-effect on all-optical helicity-dependent magnetization switching
Abstract
All-optical helicity-dependent magnetization switching (AO-HDS) is the quickest deterministic technique for data storage by solely using ultrashort laser pulses. Granular high data density magnetic storage media developed for heat-assisted magnetic recording (HAMR) provide an ideal playground to investigate the interplay of effects leading to magnetization switching. In the latest perception, we identify two effects, the magnetic circular dichroism (MCD) and the inverse Faraday effect (IFE), as the forces driving the switching process. During photon absorption, which leads to a rapid temperature rise and thus to magnetization quenching, the MCD ensures two distinct electron temperatures due to helicity-dependent absorption. This effect already holds a nonvanishing probability for magnetization switching. At the same time, the IFE induces a magnetic moment within the material, enhancing the switching probability. We present AO-HDS experiments using ultrashort laser pulses () in the near-infrared range from to . The experiments demonstrate a strong dependence of the switching efficiency on the absorbed energy density, elevating the electron temperature in the vicinity of the Curie point, allowing for the IFE to take full effect, inducing a magnetic moment for deterministic switching in the quenched magnetization state. While we do not observe an enhanced switching due to an increased MCD, a higher induced magnetization usually improves the switching rate if the electron temperature reaches the transition temperature vicinity. Therefore, we conclude that the magnetic moment generated by the IFE is crucial for the switching efficiency and the distinct deterministic character of the switching process. Laser pulses with a higher absorption induce a higher magnetic moment and switch magnetization at lower fluences.
Ultrafast magnetization dynamics remains a topic of ongoing research and has been pushing into the attosecond range [1, 2], recently. At the femtosecond timescale, however, the interest shifts to the search for applications. One example is the deterministic magnetization control enabling the exploration for applications like all-optical magnetization switching, which are interesting for memory storage and magnetic sensors. Several switching mechanisms in metals have been recently investigated in numerous publications, splitting the field into all-optical helicity dependent switching (AO-HDS) [3, 4, 5, 6] and all-optical helicity independent switching (AO-HIS) [7, 8, 9, 10]. Utilizing these techniques opens possibilities for more specific switching types such as toggle switching [11, 12] and switching by moving domain walls in thin films [13, 14]. Additionally, investigations on more complicated magnetic structures like dielectric crystals with a four-fold magnetic anisotropy reveal the possibility of controlling magnetization on ultra-fast time scales [15, 16]. More recently, even ways to control the magnetic order through the phononic system are explored [17]. All these experiments uncover the effects necessary for ultra-fast magnetization control in various material systems and how their interplay affects the magnetic ordering process. While in metals, this process requires heating the electron system to the vicinity of the Curie Temperature, the switching in dielectrics is conducted non-thermally.
AO-HDS is a promising approach for magnetic data recording in future generations of magnetic storage devices because, in subsequent development steps, it can be integrated into heat-assisted magnetic recording (HAMR) technology. In contrast to HAMR, AO-HDS works purely optically, utilizing femtosecond circularly polarized laser pulses. In the latest picture, for ferromagnetic granular media, the MCD and the IFE are understood as the main effects contributing to the magnetization switching in AO-HDS [5].
Multiple publications investigate the all-optical helicity-independent switching (AO-HIS) [7, 8, 9, 10] showing that switching is possible utilizing linear polarized femtosecond laser pulses. AO-HDS was first demonstrated on ferrimagnets[3] and has been since applied to ferromagnetic materials [Lambert.2014, 5, 18, 19, 20]. Recent theoretical calculations even show the potential for switching magnetization in anti-ferromagnetic materials like CrPt [21]. Recent developments in this research field have focused on thin film and layered systems [22, 20, 14] and the reduction of pulses required to drive the switching process [23]. Further, extensive research has been performed on granular alloys like CoPt or FePt [24, 25, 5, 26, 27, 28]. These materials are well suited for magnetic recording media production due to their large coercive fields and saturation magnetization, making them magnetically stable at room temperature. Besides this, the magnetic separation of single grains allows magnetization switching of single grains with dimensions down to , with possible bit area densities (AD) around [29, 30].
Employment of AO-HDS in magnetic data storage devices for ultrafast recording requires further elucidation of the involved processes. So far, the switching experiments usually have been conducted with laser pulses at wavelengths around or photon energies . The calculations published in [5, 31] point to enhanced switching efficiency for smaller photon energies due to the increasing difference in both the complex part of the refractive index and the IFE coefficient for both helicities.
In this publication, we study the wavelength dependence for the switching efficiency of granular FePt media in AO-HDS experiments. We present data for and the range of , gaining a deeper insight into the switching efficiency dependence on photon energy. Our data clearly shows a decreasing switching efficiency for smaller photon energies. This outcome indicates less efficient heating of the electron system to the vicinity of the Curie Temperature due to a decreasing overall absorption for those wavelengths.
We conduct all switching experiments on FePt granular media previously examined in[5]. The individual grains with diameters around are embedded into a non-magnetic protective carbon matrix, which separates the grains and their magnetization. They are grown by sputter deposition on an MgO seed layer with a NiTa heat sink on glass substrates, see schematic and electron microscope image in figure 1a) and figure 1b) respectively. The grains have a strong perpendicular magnetic anisotropy with coercive fields of and saturation fields of [24]. The samples are demagnetized for switching experiments in an ultra high vacuum chamber within a heating above the Curie Temperature and cooling down to room temperature cycle without an applied magnetic field. This procedure ensures an initial state before AO-HDS with a up-down magnetic configuration of the grains.
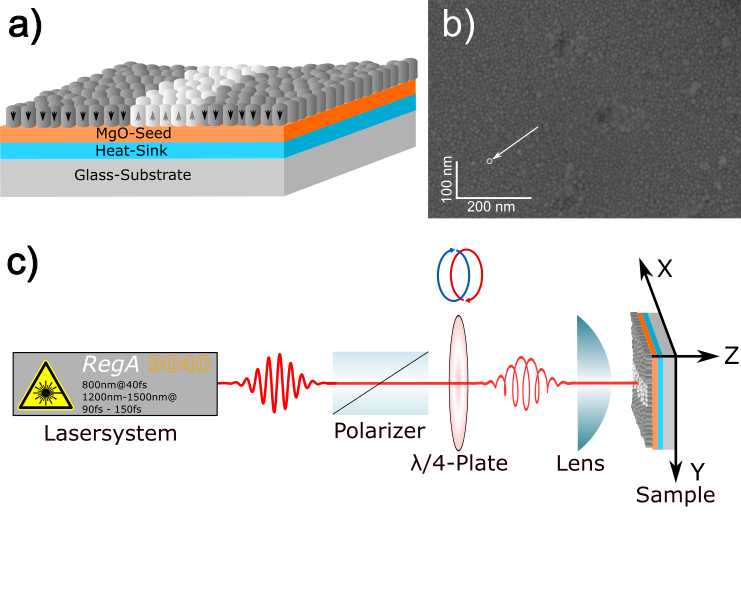
Figure 1c) displays the experimental setup schematics. We employ a Ti:Sapphire Regenerative Amplifier RegA 9040 seeded by a Mira Ti:Sapphire mode-locked oscillator (Coherent). The pulse repetition rate is set to , the central wavelength is with a full width half maximum spectral bandwidth, resulting in a pulse duration after compression. The pulses are tuned by an optical parametric amplifier, Coherent OPA 9850, for experiments in the wavelength range from . After conversion to higher wavelengths, the pulse length increases to due to a higher bandwidth product. For switching, a lens focusses the beam to a spot size with a diameter at the sample surface. The power deposited on the sample surface is set from generating fluences from and peak intensities from . We set the helicity by a polarizer quarter-wave-plate sequence, using a retarder for and an achromatic retarder AQWP05M-1600 (Thorlabs Inc) for the range. The helicity of the circular laser pulses is determined to .
The motorized -stage moves the sample holder and enables transitions in -direction to translate the laser beam on the sample surface and in -direction for spot size fine adjustment. The stage parameters allow for step sizes and speeds up to in combination with the employed repetition rate. Thus, we deposit pulses per FWHM beam waist at every spot. This number of pulses ensures reaching the saturation state of magnetization for each helicity [5]. Within the data analysis, we compare the magnetization state after saturation for the employed wavelengths.
We image the switched magnetic areas with a magneto-optical Kerr microscope with polar sensitivity. The microscope uses a Zyla 5.5 camera (Andor - Oxford Instruments), a Zeiss ec epiplan x 50 with a numeric aperture objective and a light source SOLIS-525C (Thorlabs Inc) configured for Köhler-illumination. In addition to the Kerr rotation, the light reflected from the sample surface contains Kerr ellipticity, which is compensated for by an additional quarter-wave plate employed in the crossed polarizer configuration. All evaluated images are averages over 100 captured frames using background subtraction to eliminate illumination inhomogeneities and obtain maximum magnetic contrast.
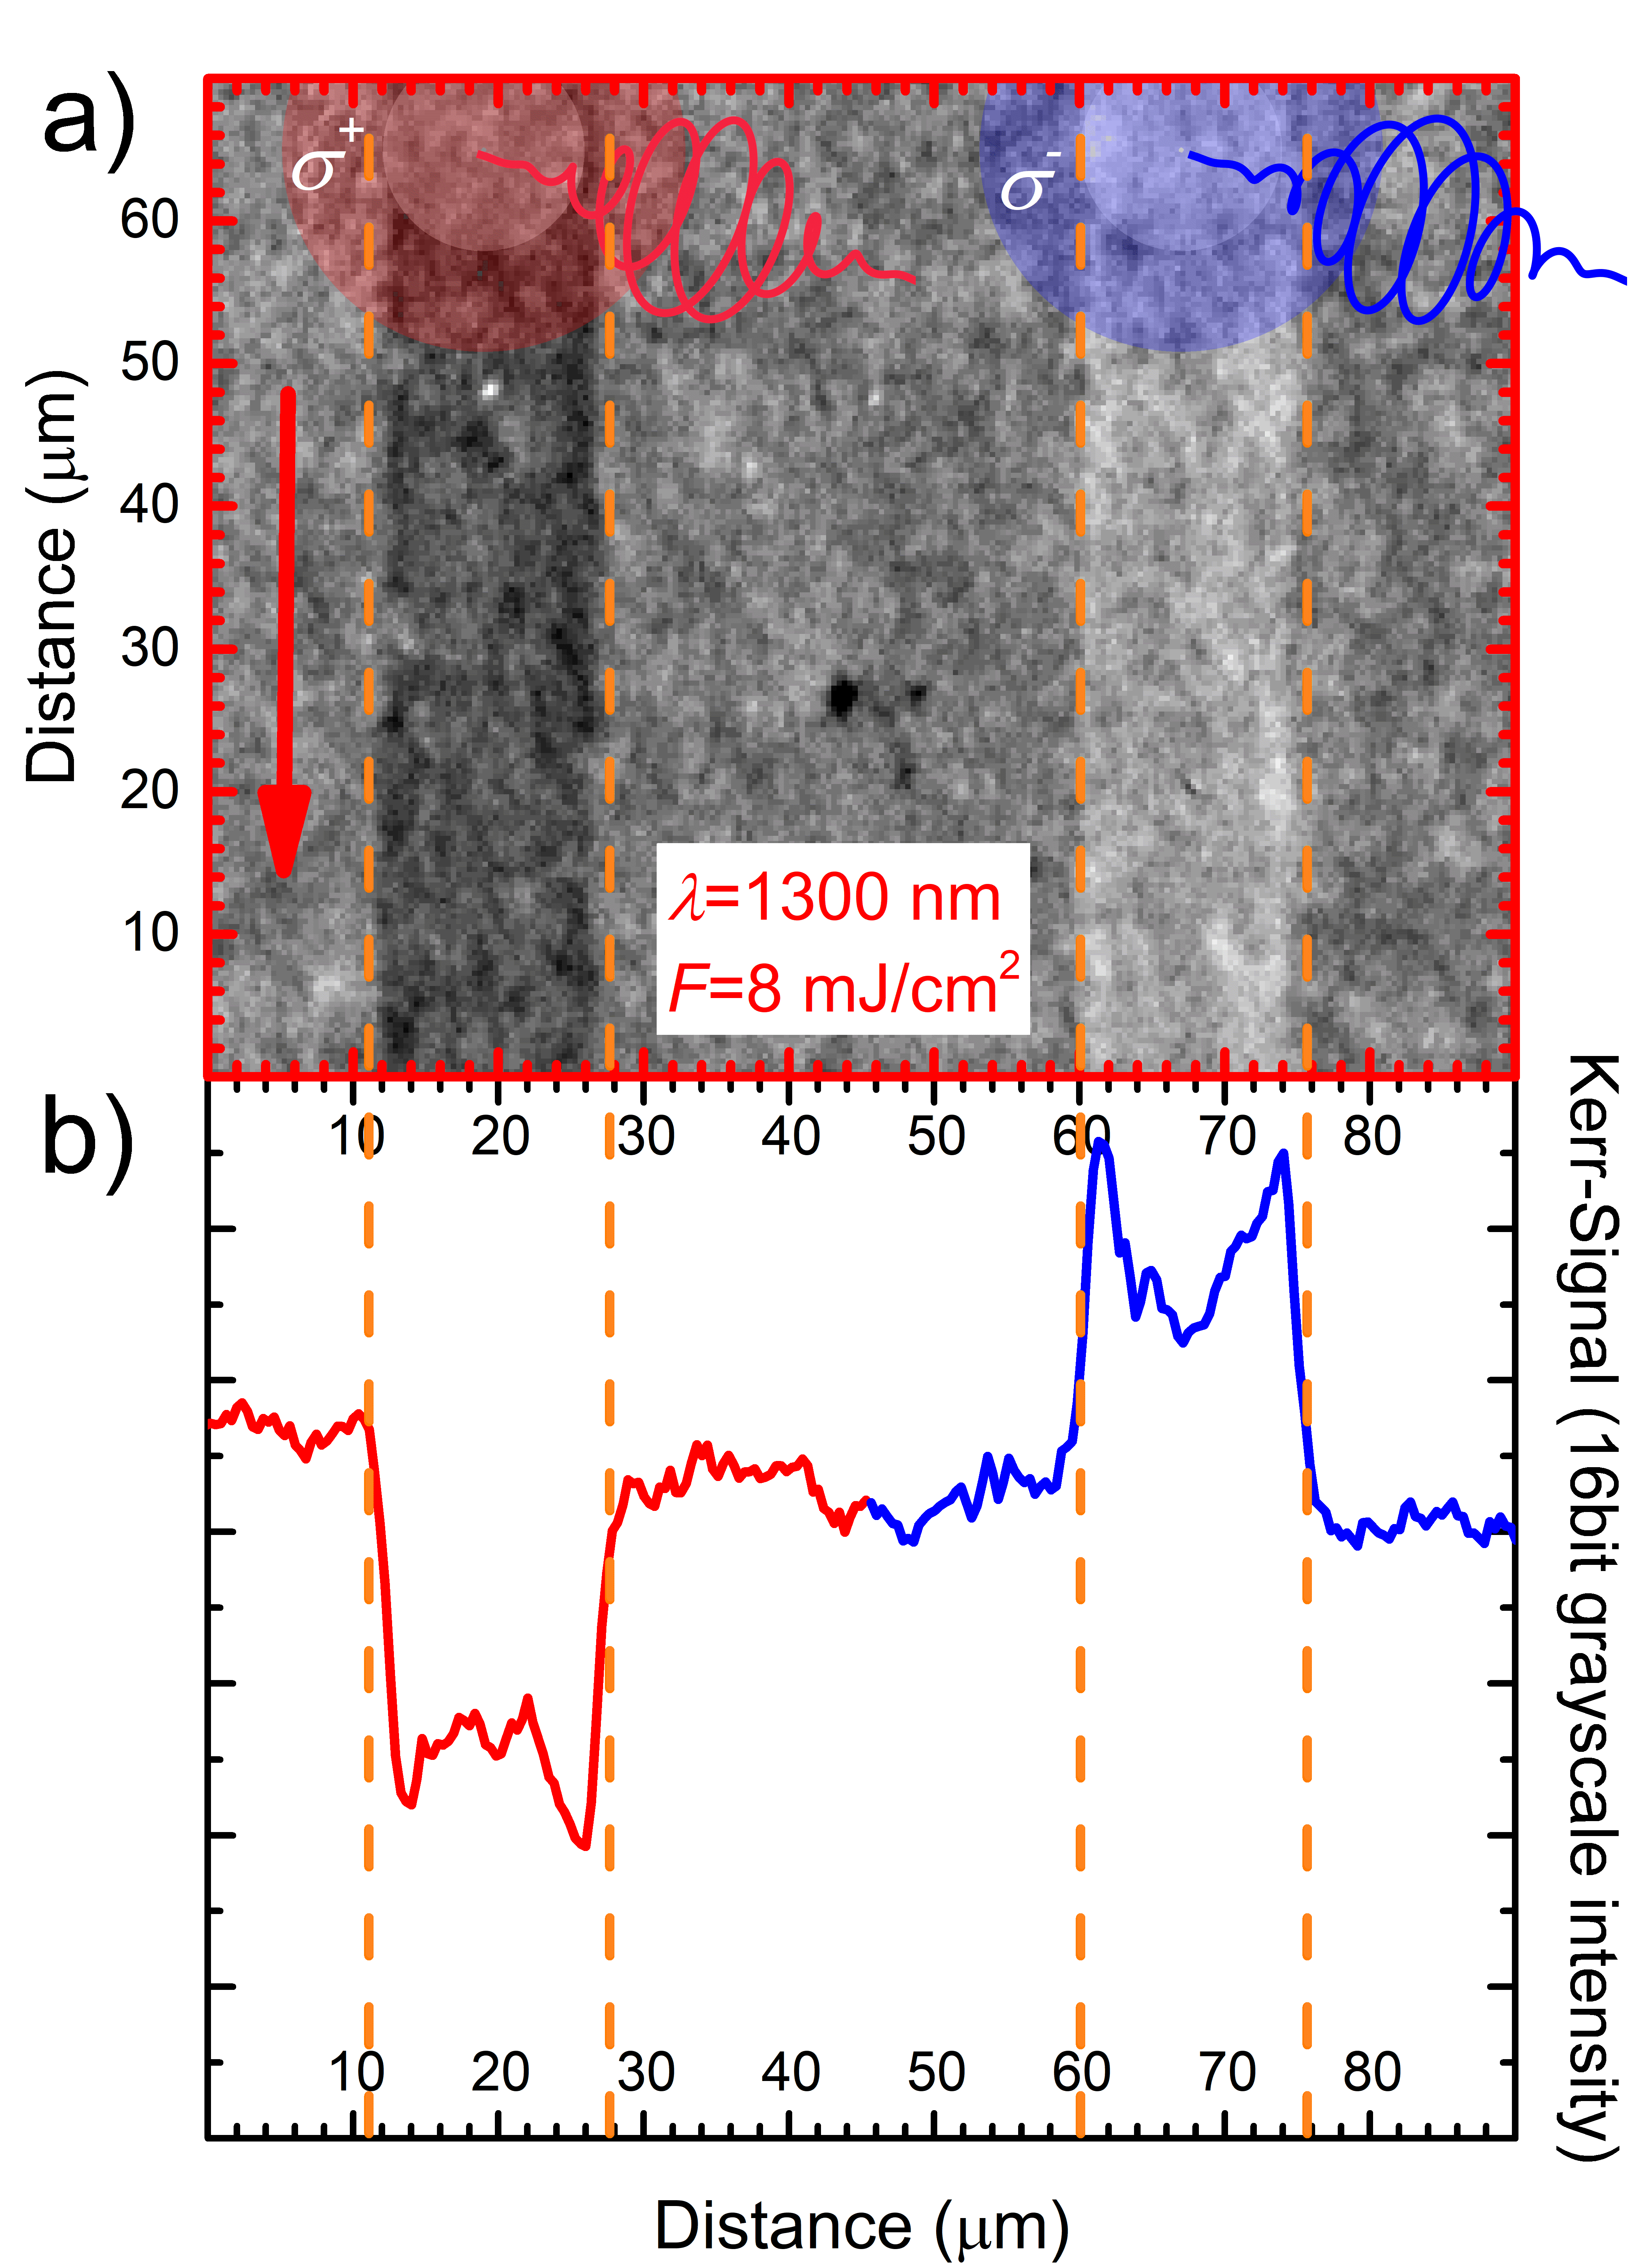
For the switching efficiency discussion, we extract the profiles across the written lines from the Kerr images to evaluate the Kerr-Contrast and switched area size. Figure 2a) introduces a Kerr-microscope magnetic greyscale image of two lines, after magnetization switching along the direction of the red arrow using opposite helicities starting from a demagnetized state. The example depicts the outcome employing the wavelength and fluence set to . Both circular laser beam spots are indicated in red () and blue (). We obtain the intensity value profiles from the image, averaging the magnetization contrast within the area edged in red over multiple pixel rows to improve the signal-to-noise ratio (SNR) for data evaluation. The two extracted representative profiles showing the cross-section Kerr-Contrast are plotted in figure 2b). We define the areas switched using right-hand helicity, as the darker areas, decreasing the Kerr signal, and the areas switched using left-hand helicity, as the brighter areas, increasing the Kerr signal. The resulting Kerr-Contrast is proportional to the switched magnetization or the switching rate. The nonuniform magnetization across the lines indicates a lower switching rate in the center than on the edges. Due to the Gaussian beam profile, we deposit a higher energy density in the beam center, generating nonuniform electron temperatures and different magnetization dynamics across the beam. This non-uniformity causes a reduced switching efficiency in the beam center. Besides this, the profile width is , only one-half of the beam spot diameter. Both extracted quantities strongly depend on the laser fluence and applied wavelength, and therefore, we use them to discuss the switching efficiency of the involved mechanisms and their interplay.
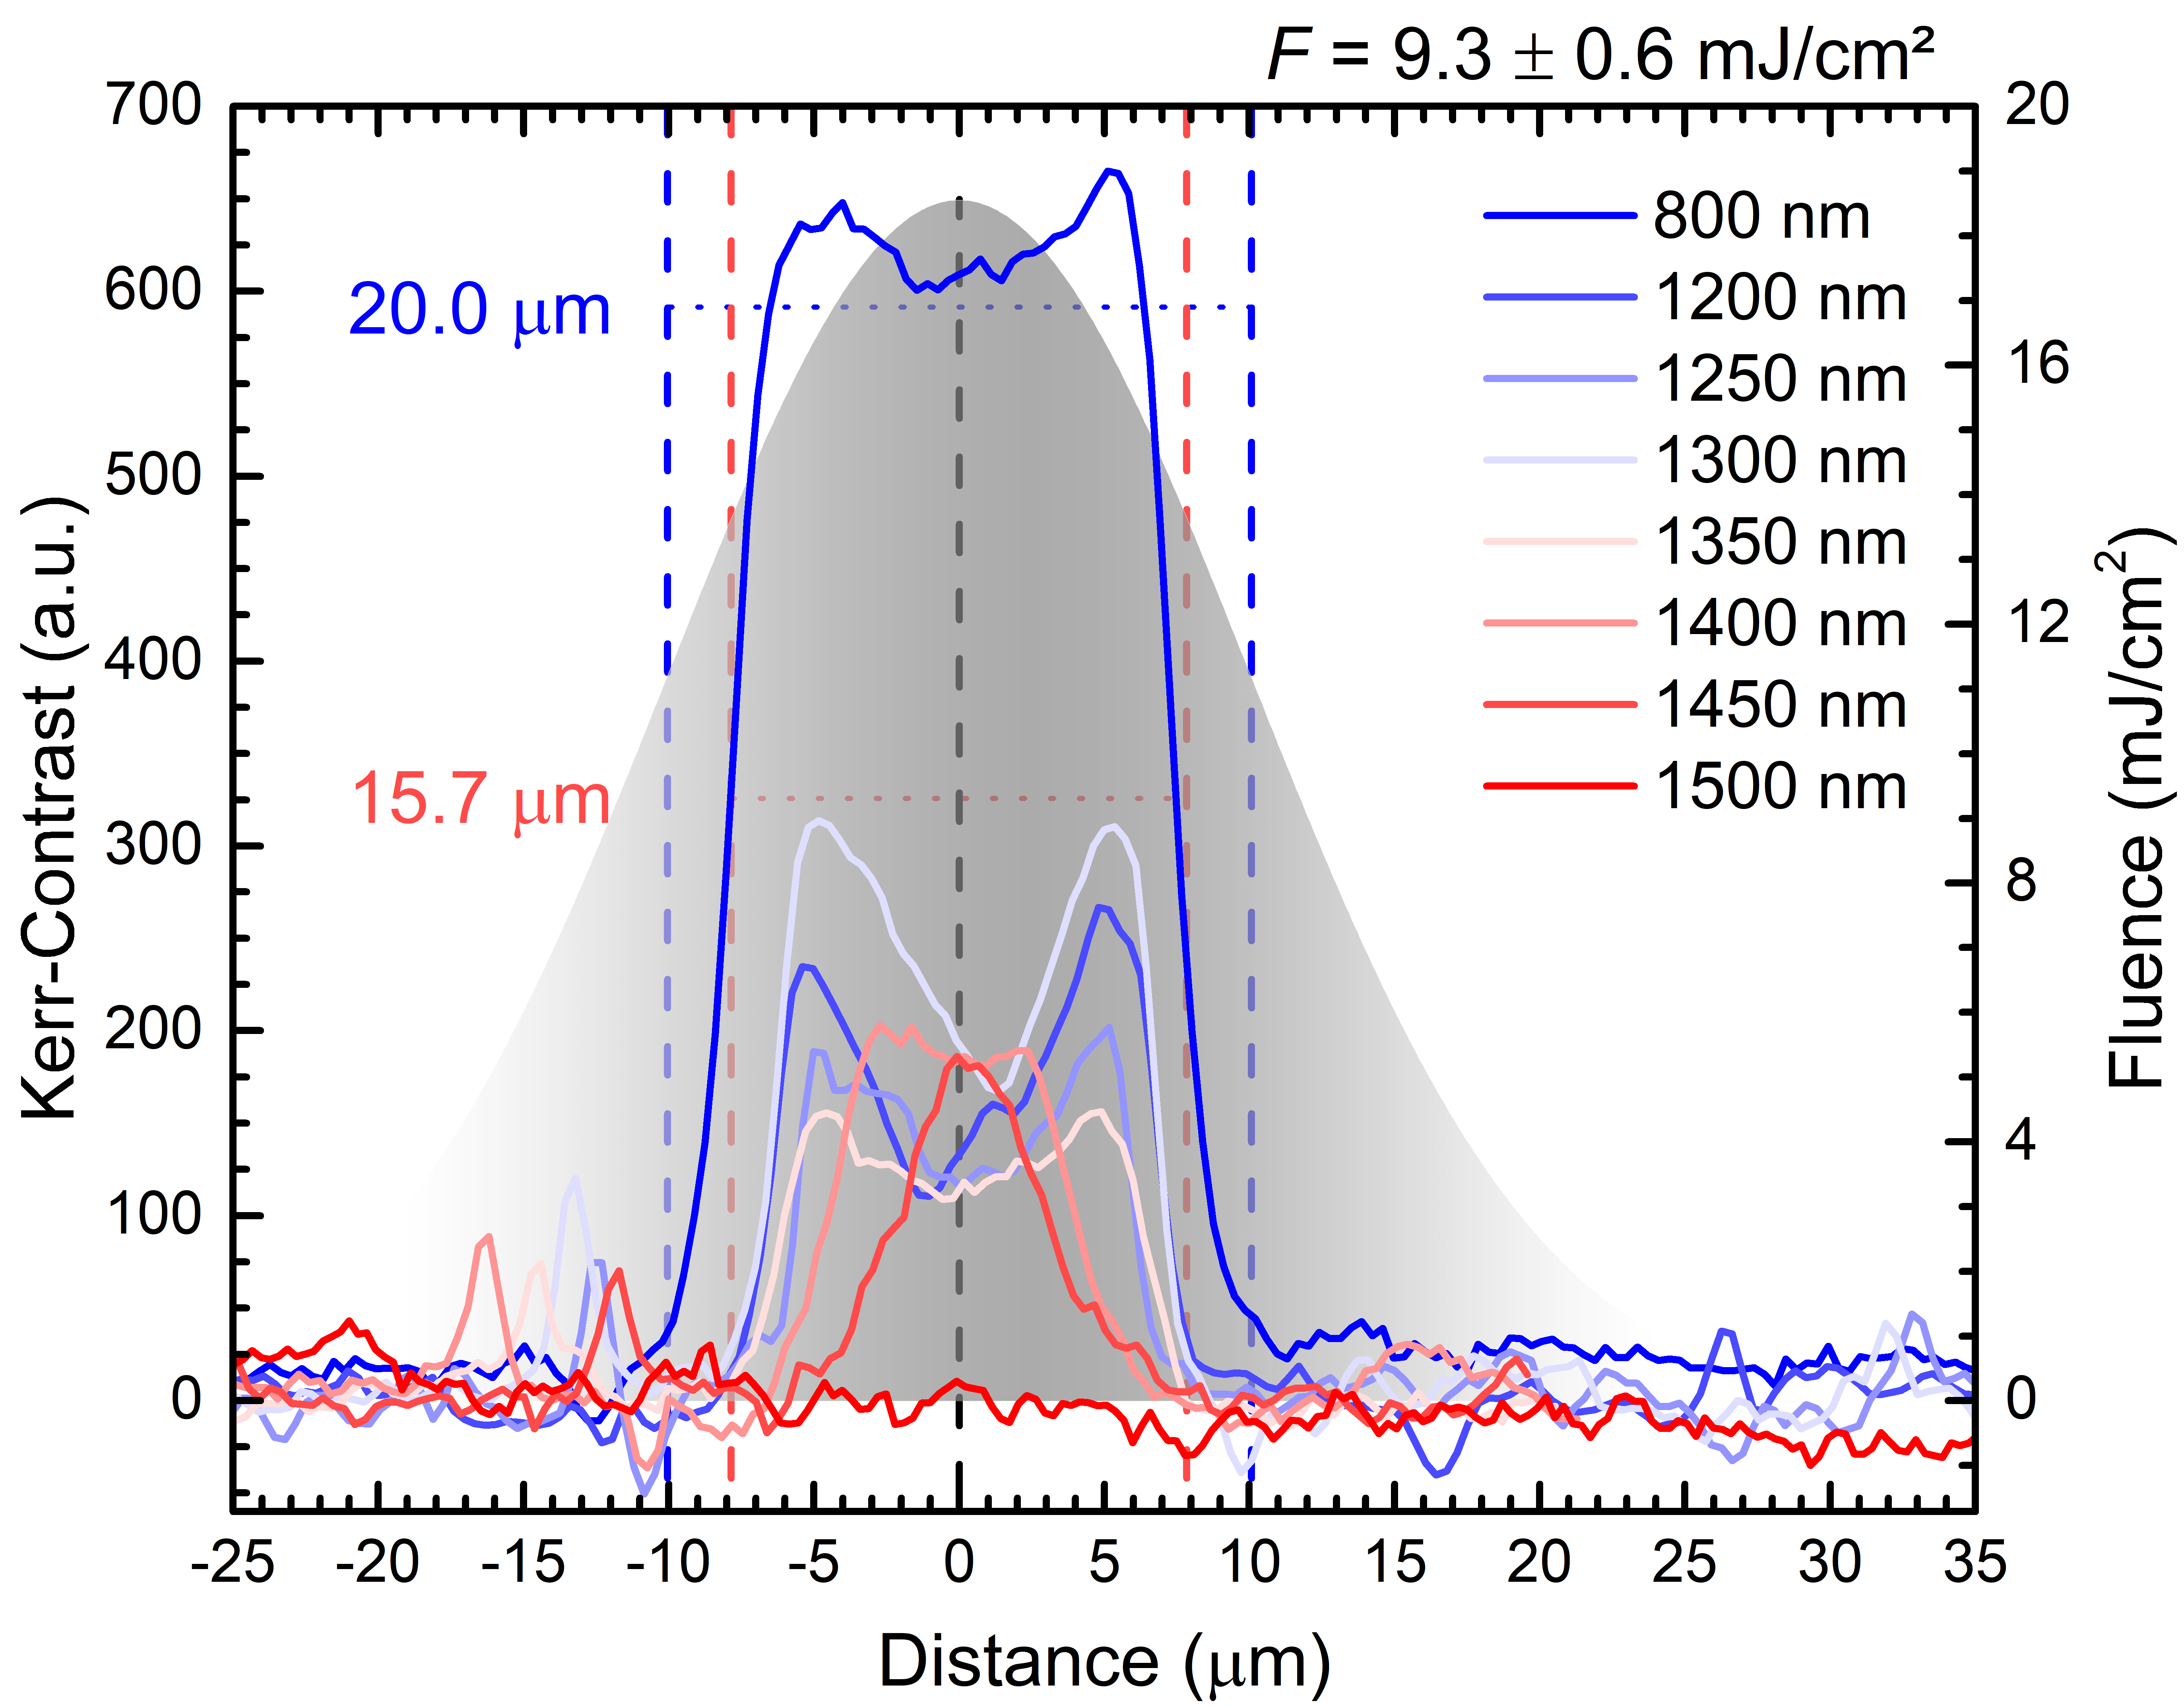
First, we examine the differences and characteristics in the switching data for all investigated wavelengths. Figure 3 shows the profiles after a switching process using helicity pulses for all applied wavelengths with the incoming irradiation at the fluence . Usually, the Kerr images exhibit slight deviations of less than in the overall signal from minor brightness differences and illumination offsets. Therefore, we present those profiles shifted, with Kerr-Contrast set to 0 representing the initial demagnetized state and positive values describing the switched magnetization for direct comparison. The profiles for both helicities show a high symmetry. Accordingly, we limit the discussion to the data. The grey-shaded Gaussian function in the background represents the laser spot with a radius and a spacial fluence distribution scaled on the right y-axis. The data obtained using pulses for switching attracts attention with a distinctly higher Kerr-Contrast over the whole profile and a slightly larger switched magnetization area, corresponding to a radius , indicated by the blue dashed lines. Compared to this, all other profiles exhibit a Kerr-Contrast reduced by and switched areas corresponding to radii , around of the laser spot radius, indicated by the red dashed lines. Both quantities, the Kerr-Contrast and the switched area, decrease by shifting the wavelength towards . This behavior hints at an elevated switching efficiency for pulses compared to the other employed wavelengths.
Moreover, all profiles switched by wavelengths show a drop in the center of the switching area hinted by the dashed black line in figure 3, indicating a reduced switching rate in this area. One reason for the lower magnetization reversal is the Gaussian beam shape, containing the largest fluence in the beam center. The laser pulse deposits the highest energy in this place, generating the highest electron temperature elevation. Through this enhanced heating, the electron temperature dynamics in the beam center differs from that at the edges. While the electrons at the edges reach temperatures above for a timeframe below returning into the ferromagnetic state immediately after the laser pulse ends, the electrons in the beam center reach temperatures twice as high as , remaining in this elevated state for up to around . Therefore, having a reduced magnetization relaxation time, the electrons at the edges reverse their magnetization towards the up-state, generating demagnetizing fields that suppress the switching probability for the hot electrons in the beam center, causing a lower switching rate. Our dataset is consistent with magnetization dynamics and the extracted electron temperatures presented in [32]. Within our data set, the switching rate reduction caused by the accelerated cooling process at the edges differs for the employed wavelengths. However, it does not show any significant trend in the wavelength dependence because the switching procedure is more complex, containing other wavelength-dependent effects discussed below.
Both wavelengths, and achieve their maximum switching capability indicated by the plateau and the peak in the profile plots, respectively. These wavelengths do not reach the switching rate suppression in the profile center due to lower overall electron temperatures. They merely achieve electron temperatures sufficient for magnetization switching in the center. Finally, no switching process is initiated for pulses at the applied fluence of . Lastly, the slight asymmetries in the profiles originate from laser beam astigmatism, while the peaks at Distance showing in some profile data originate from impurities on the sample surface.
For a systematic analysis, we extract the maximum Kerr-Contrast and the switched areas from all profiles to discuss the relation between the amount of deposited energy required for magnetization switching and to evaluate the resulting efficiency.
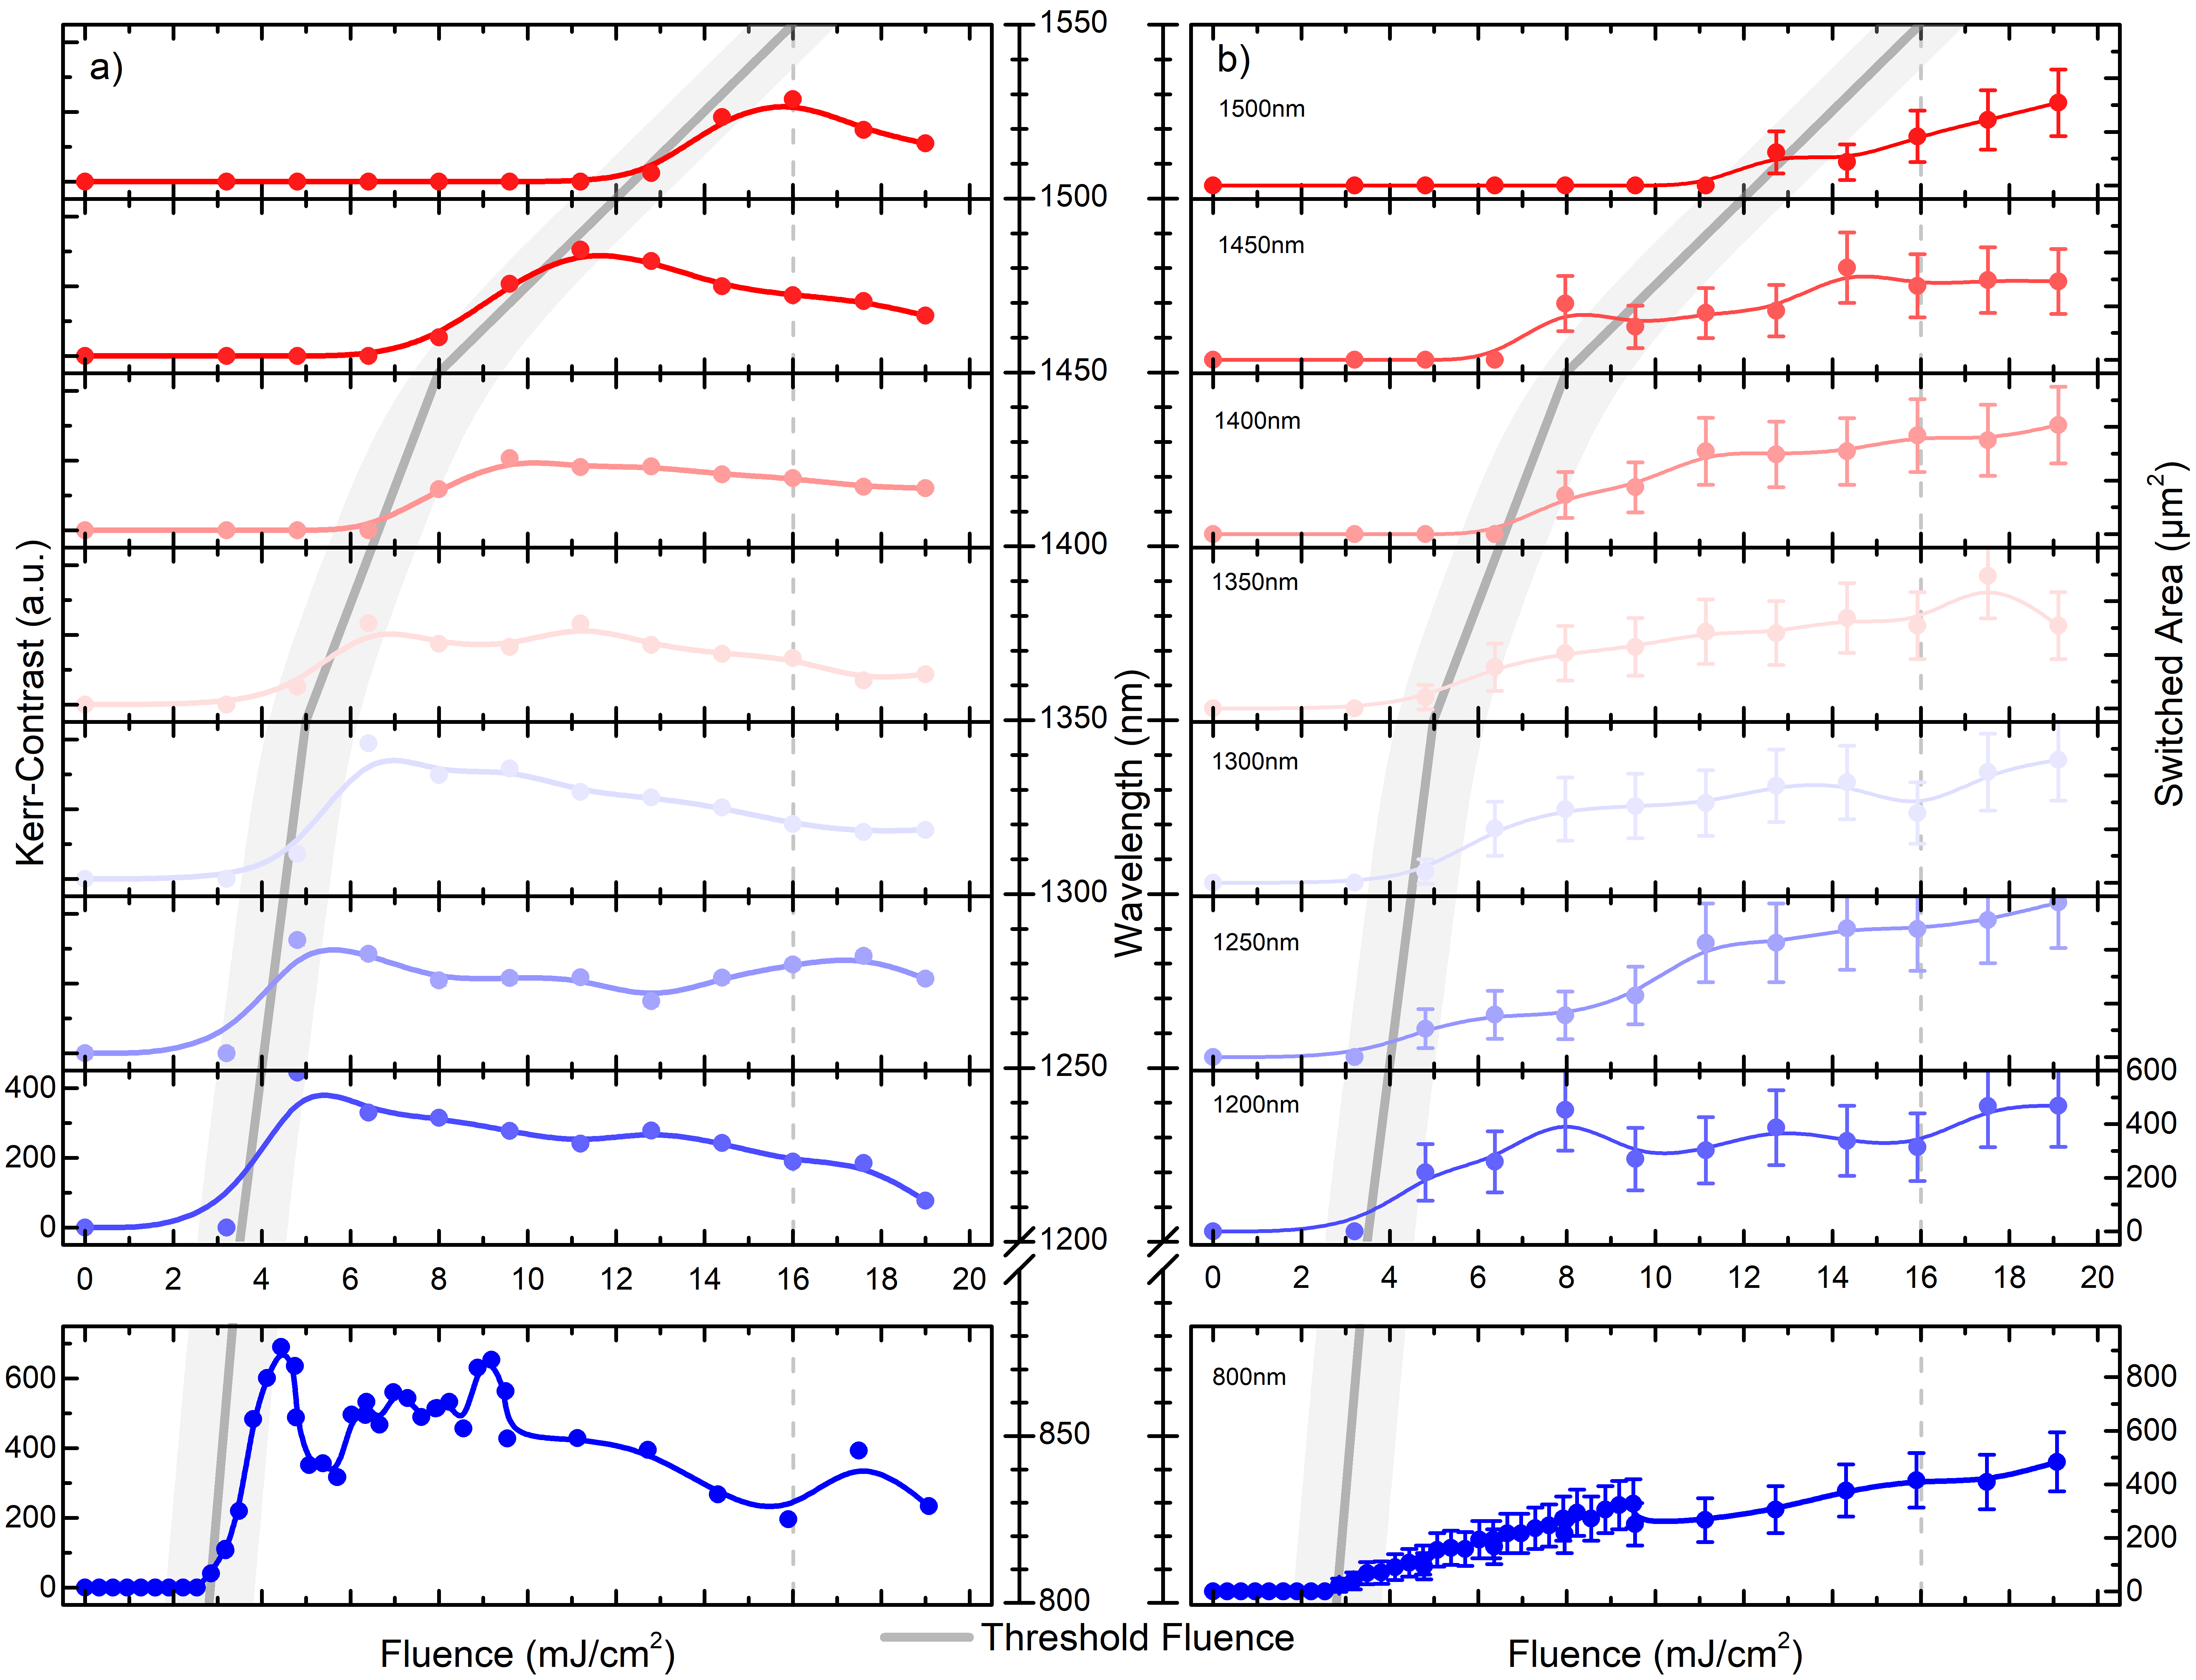
Figure 4 displays the maximum Kerr-Contrast a) and the switched area b), plotted as a function of deposited irradiation fluence. The data are arranged from in the top panel to in the bottom panel. Note that the scale range for the lower panel is larger, allowing for constant scaling throughout the panels. We determine the Kerr-Contrast error in figure 4a) as the standard deviation of the Kerr microscope image noise, which is significantly smaller than the signal, and calculate the switched area error using the radius inaccuracies extracted from the line widths. Both data sets show a typical laser fluence initiating the switching process within each spectrum, which increases for longer wavelengths. We define this minimum fluence required for a detectable switching rate as the threshold fluence, plotted in the background by the grey lines across the panels as a guide to the eye, using the fluence scale and the wavelength scale in the center. The light grey areas represent the corresponding fluence error.
The Kerr-Contrast data shows an optimum fluence inducing the highest switching efficiency, providing maximum Kerr-Contrast for each wavelength, which usually occurs within to above the threshold fluence. When shifting the laser pulses to longer wavelengths from to , this Kerr-Contrast peak decreases by up to , and requires a larger fluence rise to occur. For all applied wavelengths, increasing the fluence above the optimum point reduces the maximum Kerr-Contrast, indicating a reduced switching efficiency.
This decreasing switching rate at higher fluences, which follow the optimum switching fluence, is consistent with simulations using the multiscale switching rate model published in [33]. Those simulations for an antiferromagnet reveal that both processes, the differing heat entry through the MCD and the IFE, contribute to magnetization switching and can trigger a switching rate independently. However, the heat entry alone only induces very low switching probabilities at fluences below the material melting point. Therefore, the IFE, which scales with the laser fluence, significantly increases the switching probability when heating achieves temperatures close to the critical temperature. After that, higher temperatures induce more disorder into the spin system, undermining the deterministic effect of the IFE. The reduced magnetization switching rate we observe for some wavelengths across the beam profile in figure 3 depends on the emerging demagnetizing fields diminishing the switching procedure and the interplay of those two effects. Therefore, we do not observe any simple wavelength-dependent trend forming in the data.
The second parameter is the switched area size , plotted in figure 4b) as a function of fluence for each applied wavelength. This factor reveals the switching efficiency regarding heat entering the magnetic material and its distribution across the laser beam profile, while taking into account the impact of the IFE. The data shows, in general, a linear switched area growth with increasing laser fluence within the investigated range for a constant laser spot size . The maximum switched area remains below , reaching around half of for all employed wavelengths. The maximum switched area decreases for the longer wavelengths, which is consistent with the Kerr-Contrast behavior.
The second parameter, the switched area size , plotted in figure 4b) as a function of fluence for each applied wavelength, increases linearly with the deposited fluence for all applied wavelengths for a constant laser spot size . Thata hints essentailly to a linearly increasing area, at which the critical electron temperature enabling the switching process is reached. The maximum switched area remains below , reaching around half of and decreasaes with increasing wavelength, which is consistent with the Kerr-Contrast behavior.
The results presented in figure 4 suggest a superior switching efficiency for laser pulses compared to the other employed wavelengths. Within further data analysis, we elaborate on the effects acting during the absorption of circularly polarized laser pulses and their balancing to trigger magnetization reversal.
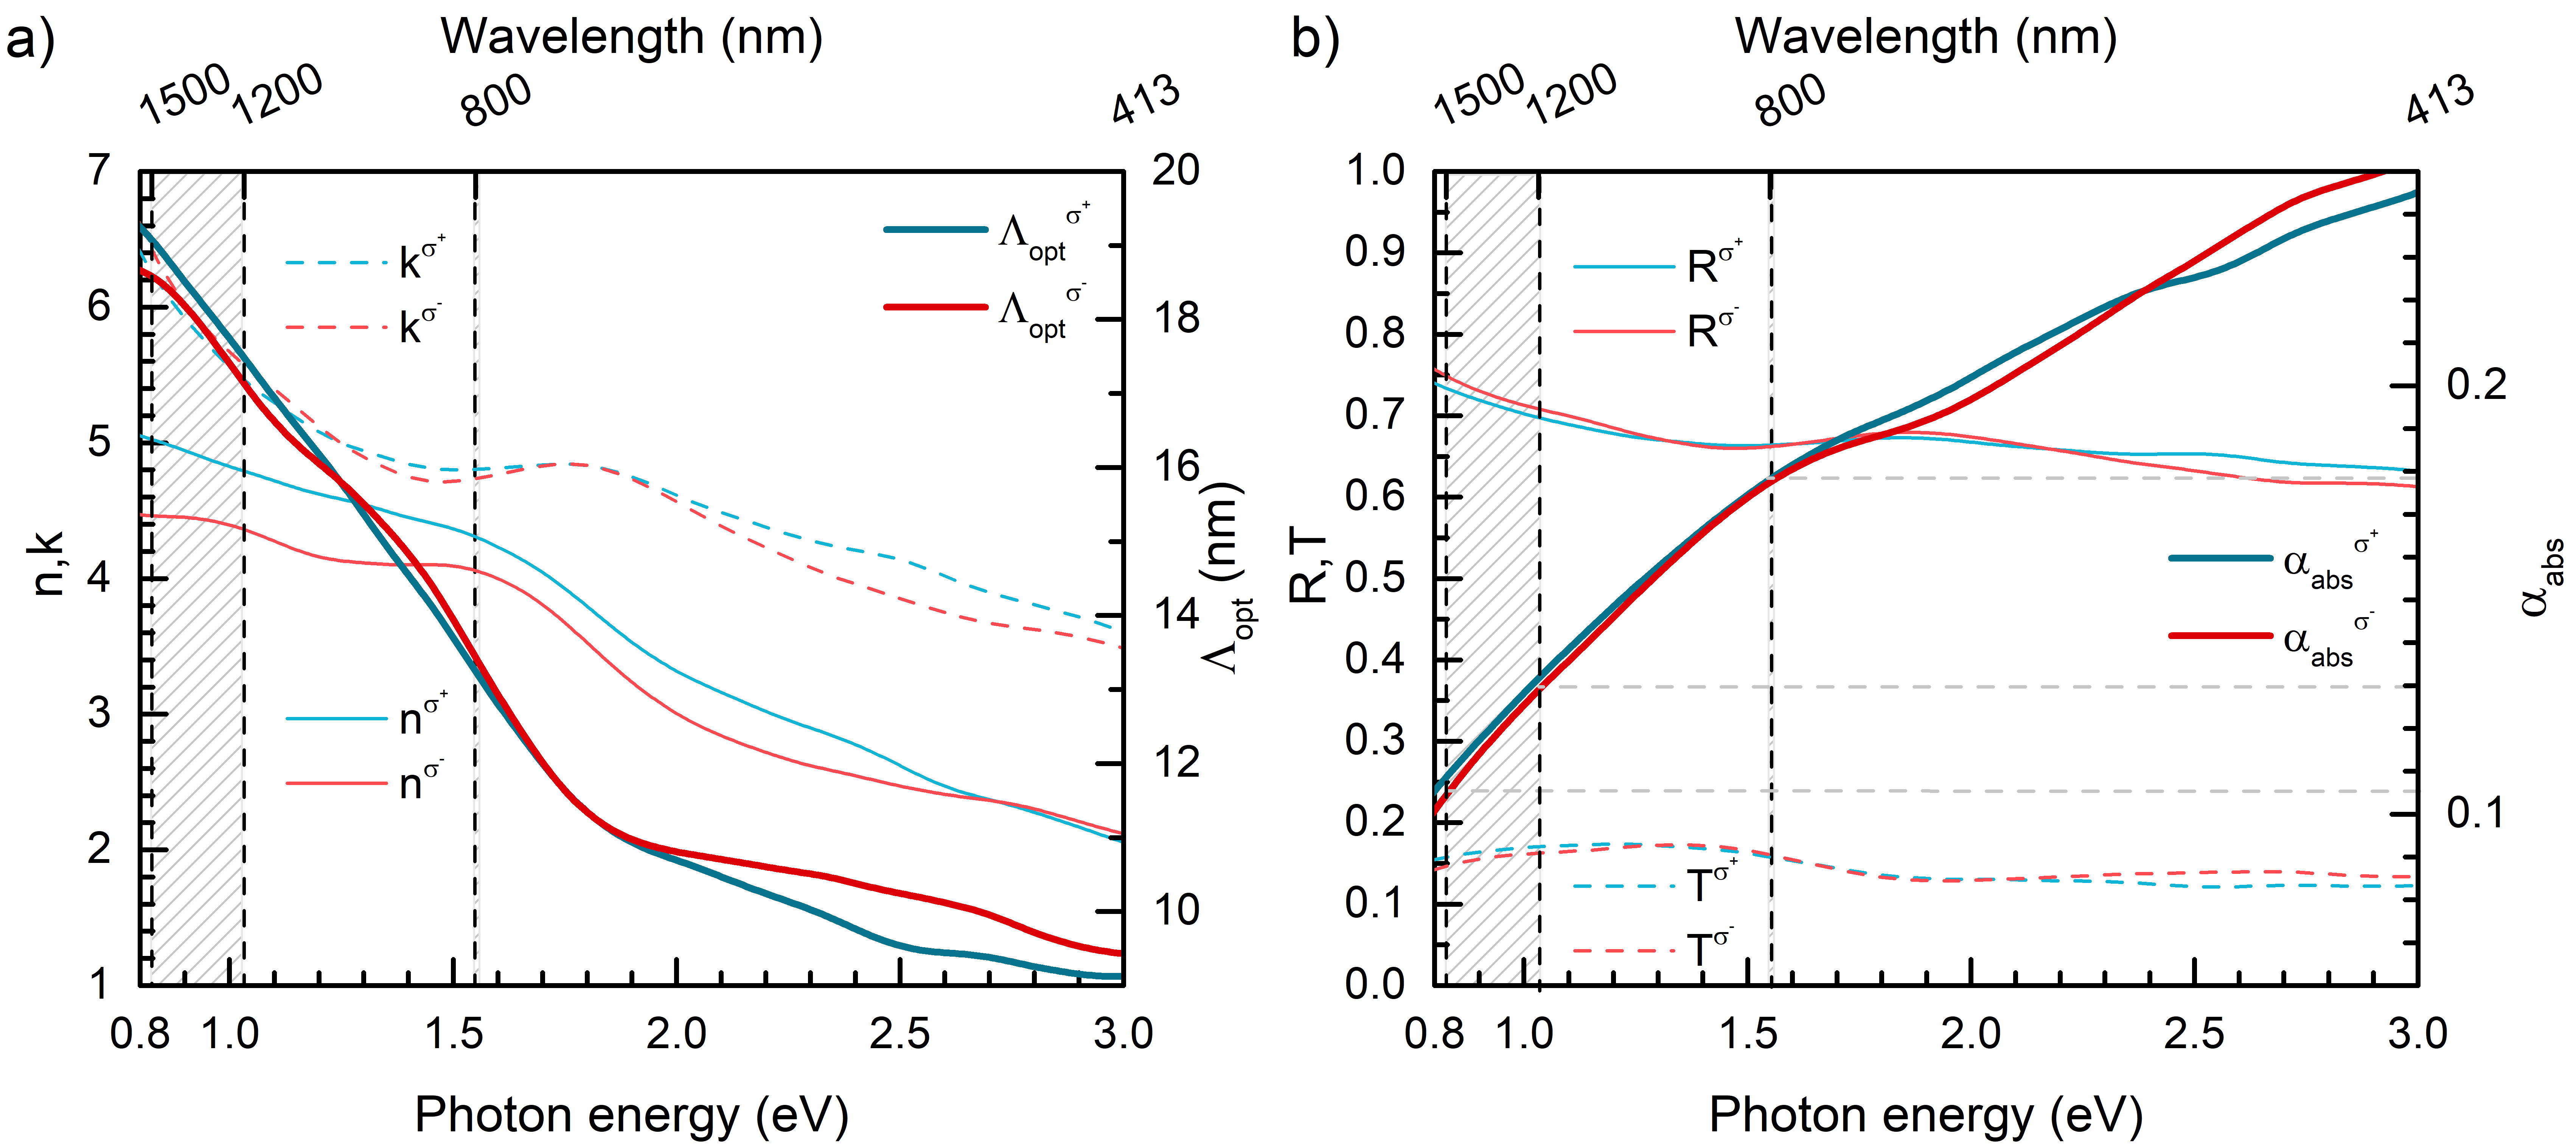
Accordingly, we examine the optical properties derived from the helicity-dependent refractive index for FePt with crystalline structure calculated using ab initio methods. The data in figure 5 a) implies a small change in reflectivity due to a rather constant real part of the refractive index and a higher absorption for longer wavelengths due to the increasing imaginary part of the refractive index. The penetration depth calculated from these parameters increases from for to around for the other investigated wavelengths. Finally, using the derived reflectivity and transmission , for normal incidence, we calculate the absorption for sized grains. On the one hand, this approach yields a larger overall absorption for dropping to , shown in figure 5 b). On the other hand, the absorption difference between the two helicities increases for the longer wavelengths, resulting in a 5 to 10 times larger MCD. These calculations confirm the tendency observed in the experimental data. The absorption of shorter wavelength photons conducts higher electron temperatures more efficiently, leading to a lower threshold fluence for switching. Electron temperatures close to the curie temperature are crucial because, at those temperatures, a quenched magnetization [32] facilitates switching by the low induced magnetization of the inverse Faraday effect . Heating the electron system far above the Curie temperature is disadvantageous because the growing thermal disorder diminishes the impact of induced by the IFE. Further, the higher switching rates reached by laser pulses hint at a negligible impact of the MCD, which should deliver more distinct switching rates for the longer wavelengths at higher fluences. Consequently, we review the extracted Kerr-Contrast as a function of the absorbed fluence for all employed wavelengths considering calculated from the available IFE data.
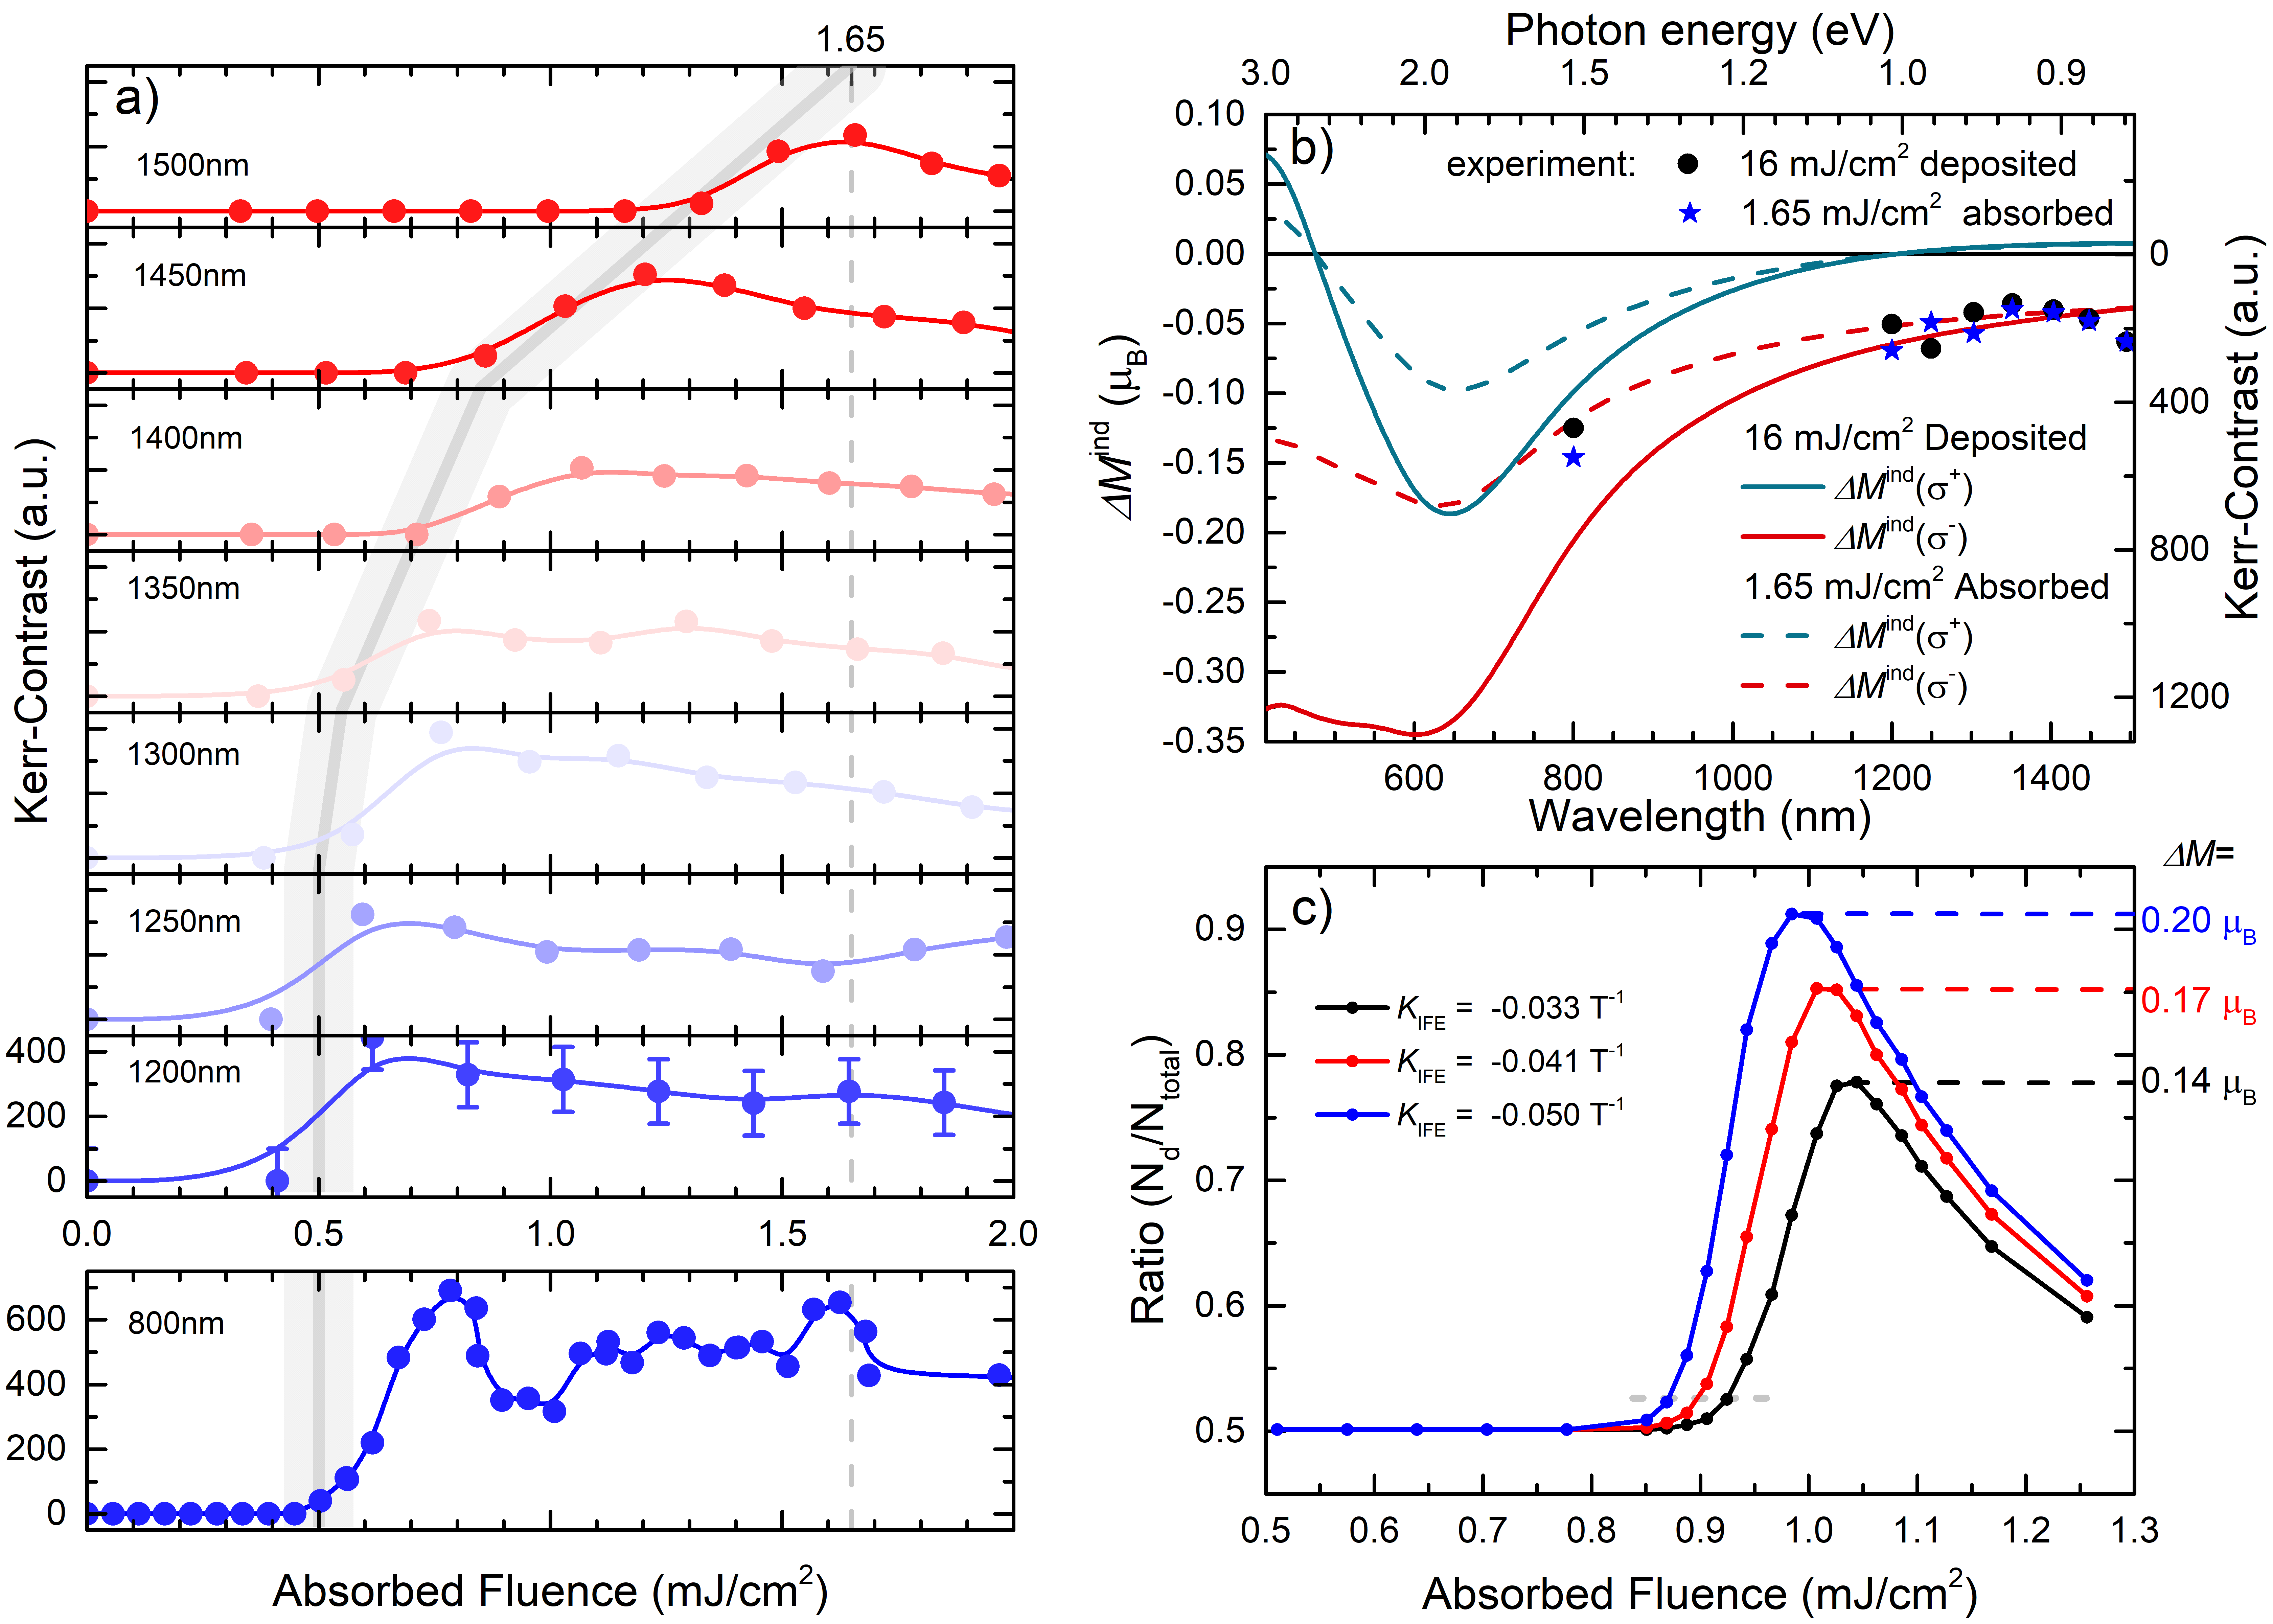
The data rescaled in figure 6 a) confirms that taking into account absorption from figure 5 b), the threshold fluence required for magnetization switching remains at the same level over a long range up to and doubles for the longer wavelengths due to slightly increased pulse length. The grey line across the panels marks the trend. A similar behavior is reported in [34] for GdFeCo in the wavelength range . A comparison with temperatures extracted from the two-temperature model shows that the threshold fluences generate electron temperatures around below and a magnetization quenched to below of the magnetization at room temperature. The maximum Kerr contrast corresponding to the maximum number of switched grains is achieved at fluences generating exactly . We see the decreasing trend in Kerr contrast at higher fluences for all wavelengths. In the publication [35], the authors show that solely an MCD of merely is enough to perform all-optical helicity-dependent switching. However, in our data the wavelengths with a larger MCD do not achieve a higher magnetization switching rate. We want to further elucidate the involved effects to show, that the IFE increases the switching efficiency. For this, we calculate the induced magnetization in units of :
| (1) |
using values from [5] in , the absorbed laser pulse intensity from experiments and the speed of light. At threshold fluence, the calculated remains below for all investigated wavelengths. At those electron temperatures, the saturation magnetization is quenched to below of the saturation magnetization at room temperature. In figure 6 b), we compare for the plotted wavelength spectrum. We consider two cases to compare the magnetic moment induced by the IFE. First, for a deposited fluence of (solid lines), we see that due to a higher overall absorption, for , while the value is less than one third, for the other wavelengths. For we observe a sign change for . Nevertheless, the small value of for the longer wavelengths remains at the level achieved at threshold fluence for helicity, avoiding visible effects. Second, we compare the calculated assuming the same absorbed fluence throughout the investigated wavelenght spectrum (dahsed lines). In this case, the differences in reduce. However, the value for is still twice as large as for the remaining wavelengths. This shows, that due to the larger for , the switching efficiency is always larger for this wavelength. The larger absorption enables the maximum switching efficiency at lower deposited fluences. However, increasing the fluence and thus does not result in a higher switching efficiency because the electron temperature remains elevated above on time scales in the picosecond range. During this time, spin fluctuations destroy the deterministic switching character. Finally, in figure 6 b), the right scale shows the extracted Kerr-contrast values for the investigated wavelengths at the discussed fluences. We see especially for a higher Kerr-contrast for the lower fluence (blue star) closer to the optimum than for the higher fluence, where we expect a larger . In the last step, we discuss the impact of the inverse Faraday effect on the switching ratio, shown in figure 6 c). The multiscale simulations use the same procedure as in [John.2018] show a threshold fluence for switching, slightly higher than the experimental values. The important statement shown here is that increasing the impact of the inverse Faraday effect and leaving the remaining parameters stable leads to a higher switching rate at lower fluences and decreases the switching rate at higher fluences at higher temperatures above .
In conclusion, our results show that the switching efficiency in all-optical helicity-dependent switching strongly depends on the combined synergy of the occurring effects. First, the amount of energy absorbed by the magnetic grains needs to generate electron temperatures in close vicinity to to quench the magnetization. Higher temperatures lead to a less efficient switching process because thermal spin fluctuations annihilate the magnetization direction induced by the photon helicity. In [36], the authors calculate the corresponding temperature-dependent susceptibilities, , perpendicular and , parallel to the magnetization direction. While vanishes at , shows a peak, leading to a stronger attraction in this direction. Therefore, photons with wavelengths inducing a higher magnetization generate a higher magnetization switching probability at these temperatures. In our data, this shows in a larger Kerr-contrast.
We are grateful to the German Science Foundation (DFG) for financial support through the program: ’Fundamental aspects of all-optical single pulse switching in nanometer-sized magnetic storage media’ Project number: 439225584. Further, we thank Tiffany Santos for the granular FePt hard disk media.
References
- Siegrist et al. [2019] F. Siegrist, J. A. Gessner, M. Ossiander, C. Denker, Y.-P. Chang, M. C. Schröder, A. Guggenmos, Y. Cui, J. Walowski, U. Martens, J. K. Dewhurst, U. Kleineberg, M. Münzenberg, S. Sharma, and M. Schultze, “Light-wave dynamic control of magnetism,” Nature 571, 240–244 (2019).
- Neufeld et al. [2023] O. Neufeld, N. Tancogne-Dejean, U. de Giovannini, H. Hübener, and A. Rubio, “Attosecond magnetization dynamics in non-magnetic materials driven by intense femtosecond lasers,” npj Computational Materials 9, 1–10 (2023).
- Stanciu et al. [2007] C. D. Stanciu, F. Hansteen, A. V. Kimel, A. Kirilyuk, A. Tsukamoto, A. Itoh, and T. Rasing, “All-optical magnetic recording with circularly polarized light,” Physical Review Letters 99, 047601 (2007).
- Mangin et al. [2014] S. Mangin, M. Gottwald, C.-H. Lambert, D. Steil, V. Uhlíř, L. Pang, M. Hehn, S. Alebrand, M. Cinchetti, G. Malinowski, Y. Fainman, M. Aeschlimann, and E. E. Fullerton, “Engineered materials for all-optical helicity-dependent magnetic switching,” Nature Materials 13, 286–292 (2014).
- John et al. [2017] R. John, M. Berritta, D. Hinzke, C. Müller, T. Santos, H. Ulrichs, P. Nieves, J. Walowski, R. Mondal, O. Chubykalo-Fesenko, J. McCord, P. M. Oppeneer, U. Nowak, and M. Münzenberg, “Magnetisation switching of fept nanoparticle recording medium by femtosecond laser pulses,” Scientific Reports 7, 4114 (2017).
- Cheng et al. [2020] F. Cheng, Z. Du, X. Wang, Z. Cai, L. Li, C. Wang, A. Benabbas, P. Champion, N. Sun, L. Pan, and Y. Liu, “All–optical helicity–dependent switching in hybrid metal–ferromagnet thin films,” Advanced Optical Materials 8, 2000379 (2020).
- Radu et al. [2011] I. Radu, K. Vahaplar, C. Stamm, T. Kachel, N. Pontius, H. A. Dürr, T. A. Ostler, J. Barker, R. F. L. Evans, R. W. Chantrell, A. Tsukamoto, A. Itoh, A. Kirilyuk, T. Rasing, and A. V. Kimel, “Transient ferromagnetic-like state mediating ultrafast reversal of antiferromagnetically coupled spins,” Nature 472, 205–208 (2011).
- Le Guyader et al. [2012] L. Le Guyader, S. El Moussaoui, M. Buzzi, R. V. Chopdekar, L. J. Heyderman, A. Tsukamoto, A. Itoh, A. Kirilyuk, T. Rasing, A. V. Kimel, and F. Nolting, “Demonstration of laser induced magnetization reversal in gdfeco nanostructures,” Applied Physics Letters 101, 022410 (2012).
- Lalieu et al. [2017] M. L. M. Lalieu, M. J. G. Peeters, S. R. R. Haenen, R. Lavrijsen, and B. Koopmans, “Deterministic all-optical switching of synthetic ferrimagnets using single femtosecond laser pulses,” Physical Review B 96 (2017), 10.1103/physrevb.96.220411.
- Vergès et al. [2023] M. Vergès, S. Perumbilavil, J. Hohlfeld, F. Freire-Fernández, Y. Le Guen, N. Kuznetsov, F. Montaigne, G. Malinowski, D. Lacour, M. Hehn, S. van Dijken, and S. Mangin, “Energy efficient single pulse switching of co/gd/ptn nanodisks using surface lattice resonances,” Advanced science (Weinheim, Baden-Wurttemberg, Germany) 10, e2204683 (2023).
- Ignatyeva et al. [2019] D. O. Ignatyeva, C. S. Davies, D. A. Sylgacheva, A. Tsukamoto, H. Yoshikawa, P. O. Kapralov, A. Kirilyuk, V. I. Belotelov, and A. V. Kimel, “Plasmonic layer-selective all-optical switching of magnetization with nanometer resolution,” Nature Communications 10, 4786 (2019).
- Banerjee et al. [2020] C. Banerjee, N. Teichert, K. E. Siewierska, Z. Gercsi, G. Y. P. Atcheson, P. Stamenov, K. Rode, J. M. D. Coey, and J. Besbas, “Single pulse all-optical toggle switching of magnetization without gadolinium in the ferrimagnet mn2ruxga,” Nature Communications 11, 4444 (2020).
- Liao et al. [2019] J.-W. Liao, P. Vallobra, L. O’Brien, U. Atxitia, V. Raposo, D. Petit, T. Vemulkar, G. Malinowski, M. Hehn, E. Martínez, S. Mangin, and R. P. Cowburn, “Controlling all-optical helicity-dependent switching in engineered rare-earth free synthetic ferrimagnets,” Advanced science (Weinheim, Baden-Wurttemberg, Germany) 6, 1901876 (2019).
- Yoshikawa et al. [2023] H. Yoshikawa, D. Tajima, Y. Kasatani, and A. Tsukamoto, “Different helicity dependency of all-optical magnetization switching in gdfeco films with optical interference layer,” Japanese Journal of Applied Physics 62, SB1009 (2023).
- Stupakiewicz et al. [2017] A. Stupakiewicz, K. Szerenos, D. Afanasiev, A. Kirilyuk, and A. V. Kimel, “Ultrafast nonthermal photo-magnetic recording in a transparent medium,” Nature 542, 71–74 (2017).
- Stupakiewicz et al. [2019] A. Stupakiewicz, K. Szerenos, M. D. Davydova, K. A. Zvezdin, A. K. Zvezdin, A. Kirilyuk, and A. V. Kimel, “Selection rules for all-optical magnetic recording in iron garnet,” Nature Communications 10, 612 (2019).
- Stupakiewicz et al. [2021] A. Stupakiewicz, C. S. Davies, K. Szerenos, D. Afanasiev, K. S. Rabinovich, A. V. Boris, A. Caviglia, A. V. Kimel, and A. Kirilyuk, “Ultrafast phononic switching of magnetization,” Nature Physics 17, 489–492 (2021).
- Granitzka et al. [2017] P. W. Granitzka, E. Jal, L. Le Guyader, M. Savoini, D. J. Higley, T. Liu, Z. Chen, T. Chase, H. Ohldag, G. L. Dakovski, W. F. Schlotter, S. Carron, M. C. Hoffman, A. X. Gray, P. Shafer, E. Arenholz, O. Hellwig, V. Mehta, Y. K. Takahashi, J. Wang, E. E. Fullerton, J. Stöhr, A. H. Reid, and H. A. Dürr, “Magnetic switching in granular fept layers promoted by near-field laser enhancement,” Nano letters 17, 2426–2432 (2017).
- Yamamoto et al. [2019] K. Yamamoto, Y. Kubota, M. Suzuki, Y. Hirata, K. Carva, M. Berritta, K. Takubo, Y. Uemura, R. Fukaya, K. Tanaka, W. Nishimura, T. Ohkochi, T. Katayama, T. Togashi, K. Tamasaku, M. Yabashi, Y. Tanaka, T. Seki, K. Takanashi, P. M. Oppeneer, and H. Wadati, “Ultrafast demagnetization of pt magnetic moment in l1 0 -fept probed by magnetic circular dichroism at a hard x-ray free electron laser,” New Journal of Physics 21, 123010 (2019).
- Takahashi et al. [2023] R. Takahashi, T. Ohkochi, D. Kan, Y. Shimakawa, and H. Wadati, “Optically induced magnetization switching in nico 2 o 4 thin films using ultrafast lasers,” ACS Applied Electronic Materials 5, 748–753 (2023).
- Dannegger et al. [2021a] T. Dannegger, M. Berritta, K. Carva, S. Selzer, U. Ritzmann, P. M. Oppeneer, and U. Nowak, “Ultrafast coherent all-optical switching of an antiferromagnet with the inverse faraday effect,” Physical Review B 104 (2021a), 10.1103/physrevb.104.l060413.
- Liu et al. [2023] Y. Liu, H. Cheng, P. Vallobra, H. Wang, S. Eimer, X. Zhang, G. Malinowski, M. Hehn, Y. Xu, S. Mangin, and W. Zhao, “Ultrafast single-pulse switching of tb-dominant cotb alloy,” Applied Physics Letters 122, 022401 (2023).
- Yamada et al. [2022] K. T. Yamada, A. V. Kimel, K. H. Prabhakara, S. Ruta, T. Li, F. Ando, S. Semin, T. Ono, A. Kirilyuk, and T. Rasing, “Efficient all-optical helicity dependent switching of spins in a pt/co/pt film by a dual-pulse excitation,” Frontiers in Nanotechnology 4, 6 (2022).
- Weller et al. [2013] D. Weller, O. Mosendz, G. Parker, S. Pisana, and T. S. Santos, “L1 0 feptx-y media for heat-assisted magnetic recording,” physica status solidi (a) 210, 1245–1260 (2013).
- Takahashi et al. [2016] Y. K. Takahashi, R. Medapalli, S. Kasai, J. Wang, K. Ishioka, S. H. Wee, O. Hellwig, K. Hono, and E. E. Fullerton, “Accumulative magnetic switching of ultrahigh-density recording media by circularly polarized light,” Physical Review Applied 6, 054004 (2016).
- Suzuki and Takahashi [2023] I. Suzuki and Y. K. Takahashi, “Grain density control in fept granular films for heat-assisted magnetic recording media,” Japanese Journal of Applied Physics 62, SB0801 (2023).
- Tsai et al. [2023] J.-L. Tsai, C.-Y. Sun, J.-H. Lin, Y.-Y. Huang, and H.-T. Tsai, “Magnetic properties and microstructure of fept(bn, x, c) (x = ag, re) films,” Nanomaterials 13, 539 (2023).
- Tham, Kushibiki, and Saito [2023] K. K. Tham, R. Kushibiki, and S. Saito, “Systematic study of nitride matrix of fept granular films for heat assisted magnetic recording media,” AIP Advances 13, 035034 (2023).
- Weller et al. [2014] D. Weller, G. Parker, O. Mosendz, E. Champion, B. Stipe, X. Wang, T. Klemmer, G. Ju, and A. Ajan, “A hamr media technology roadmap to an areal density of 4 tb/in$^2$,” IEEE Transactions on Magnetics 50, 1–8 (2014).
- Suzuki et al. [2023] I. Suzuki, T. Abe, H. Sepehri-Amin, K. Hono, and Y. K. Takahashi, “Microstructure evolution in fept-cr2o3 granular thin films,” Journal of Magnetism and Magnetic Materials 579, 170874 (2023).
- Berritta et al. [2016] M. Berritta, R. Mondal, K. Carva, and P. M. Oppeneer, “Ab initio theory of coherent laser-induced magnetization in metals,” Physical Review Letters 117, 137203 (2016).
- Mendil et al. [2014] J. Mendil, P. Nieves, O. Chubykalo-Fesenko, J. Walowski, T. Santos, S. Pisana, and M. Münzenberg, “Resolving the role of femtosecond heated electrons in ultrafast spin dynamics,” Scientific Reports 4, 3980 (2014).
- Dannegger et al. [2021b] T. Dannegger, M. Berritta, K. Carva, S. Selzer, U. Ritzmann, P. M. Oppeneer, and U. Nowak, “Ultrafast coherent all-optical switching of an antiferromagnet with the inverse faraday effect,” Physical Review B 104 (2021b), 10.1103/physrevb.104.l060413.
- Steil et al. [2011] D. Steil, S. Alebrand, A. Hassdenteufel, M. Cinchetti, and M. Aeschlimann, “All-optical magnetization recording by tailoring optical excitation parameters,” Physical Review B 84 (2011), 10.1103/PhysRevB.84.224408.
- Gorchon, Yang, and Bokor [2016] J. Gorchon, Y. Yang, and J. Bokor, “Model for multishot all-thermal all-optical switching in ferromagnets,” Physical Review B 94 (2016), 10.1103/PhysRevB.94.020409.
- Atxitia et al. [2009] U. Atxitia, O. Chubykalo-Fesenko, R. W. Chantrell, U. Nowak, and A. Rebei, “Ultrafast spin dynamics: the effect of colored noise,” Physical Review Letters 102, 057203 (2009).