Optically-Trapped Nanodiamond-Relaxometry Detection of Nanomolar Paramagnetic Spins in Aqueous Environments
Abstract
Probing electrical and magnetic properties in aqueous environments remains a frontier challenge in nanoscale sensing. Our inability to do so with quantitative accuracy imposes severe limitations, for example, on our understanding of the ionic environments in a diverse array of systems, ranging from novel materials to the living cell. The Nitrogen-Vacancy (NV) center in fluorescent nanodiamonds (FNDs) has emerged as a good candidate to sense temperature, pH, and the concentration of paramagnetic species at the nanoscale, but comes with several hurdles such as particle-to-particle variation which render calibrated measurements difficult, and the challenge to tightly confine and precisely position sensors in aqueous environment. To address this, we demonstrate relaxometry with NV centers within optically-trapped FNDs. In a proof of principle experiment, we show that optically-trapped FNDs enable highly reproducible nanomolar sensitivity to the paramagnetic ion, . We capture the three distinct phases of our experimental data by devising a model analogous to nanoscale Langmuir adsorption combined with spin coherence dynamics. Our work provides a basis for routes to sense free paramagnetic ions and molecules in biologically relevant conditions.
I Introduction
Investigating the electrical and magnetic properties of biologically relevant and aqueous solutions on the nanoscale has remained a persistent challenge. Progress here is expected to vastly improve our understanding of many complex biological processes such as electron transport in chemiosmosis, the generation of free radicals from redox reactions, and intracellular communication nie2021quantum ; dai2023interface ; barton2020nanoscale ; rendler2017optical ; fan2023diamond ; barry2016optical ; igarashi2020tracking ; kuo2013fluorescent . Conventional techniques, such as fluorescent dyes, are limited by photobleaching and prone to artefactual changes to the signal. The recent development of quantum sensors in fluorescent nanodiamonds (FNDs), namely the Nitrogen-Vacancy (NV) centers, offers a potential alternative. NV centers are atomic-scale defects whose spin levels are extremely sensitive to the local changes of temperature, pH, strain, and electromagnetic signals schrand2009nanodiamond ; kucsko2013nanometre ; fujiwara2020real ; simpson2017non ; petrini2022nanodiamond ; hsieh2019imaging ; Fujisaku2019 ; xu2024quantum ; block2021optically ; PeronaMartnez2020 ; bian2021nanoscale ; aslam2023quantum ; wu2022recent ; rodgers2021materials ; mochalin2020properties ; shi2015single ; choi2020probing ; chen2022immunomagnetic ; glenn2015single . The transitions between these spin levels can be optically probed via electron spin resonance (ESR) spectroscopy and spin relaxometry measurements. Moreover, the chemical inertness and high thermal conductivity of diamond make NV centers in FNDs highly bio-compatible, and highlight their ability to serve as nano-scale quantum sensors in biological conditions chipaux2018nanodiamonds ; hsiao2016fluorescent ; shenderova2015science ; van2018nanodiamonds . However, due to random Brownian motion, positioning and detecting FND particles in aqueous environments remains a challenge. To this end, prior works have demonstrated the immobilization of FNDs to substrates either through adhesion or functionalization miller2020spin ; jariwala2020surface ; xie2022biocompatible , as well as the use of an optical trap to spatially confine FNDs in solutions Horowitz2012 ; hoang2016electron ; Russell2018 .
In this work, we demonstrate robust spin-relaxometry with optically-trapped nm FNDs to sense free electronic spins in solution with nanomolar resolution. In a proof of principle experiment, we find that the NV sensor lifetime, (), exhibits a novel triphasic response with the increase of paramagnetic species, gadolinium ions (Gd3+), in solution. We develop a comprehensive theoretical model to understand and quantitatively capture the three distinct regimes observed in experiment—surface dynamics, surface saturation, and solution dynamics.
II Results
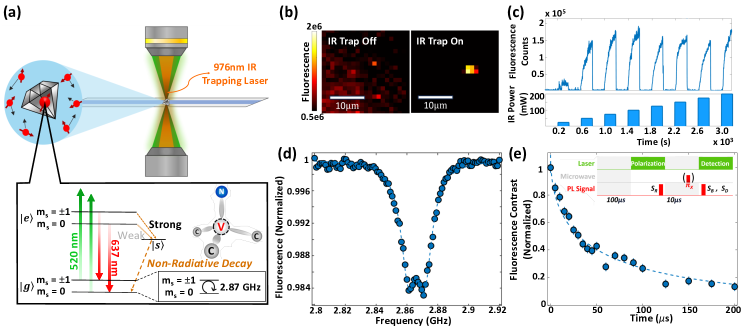
Characterization of Optically-Trapped Nanodiamond Sensors — We choose to work with nm size of nanodiamond particles containing part per million (ppm) NV centers (Fig. 1a). Each NV center consists of a substitutional nitrogen impurity adjacent to a vacancy replacing two intrinsic carbon atoms inside the tetrahedral diamond lattice. The electronic ground state of NV centers exhibits a spin-1 degree of freedom. In the absence of any external perturbations, spin sublevels are degenerate and separated from by GHz. Excitation with a green laser pumps the NV spin to the excited state, which then decays back to the ground state and emits a red fluorescent photon. When the spin state is in , it can also decay through an additional non-radiative singlet level back to the . This enables the optical initialization of the NV center to and the detection of the spin state, as sublevels on average emit less fluorescent photons than .
To realize 3-dimensional confinement and positioning of FNDs in an aqueous environment for sensing applications, we integrate a tightly focused, near-infrared laser trapping beam ( nm) into our home-built confocal microscope (see Supplementary Materials for more details). We start with a sample chamber containing free FNDs suspended in deionized water (0.1 mg/mL). When the trapping beam is off, the FNDs randomly diffuse in the solution, leading to a weak, near uniform fluorescence image as we raster scan the green excitation beam (Fig. 1b). In contrast, when the trapping beam is on, the dielectric nanodiamond particles experience a trapping force due to the scattering of photons and aggregate near the focus of the beam, resulting in a region with strong fluorescent signals. Figure 1c shows an experiment where we monitor the fluorescence intensity at the center of the trapping beam, turning it on and off at regular intervals while incrementally increasing power. We observe that the fluorescence counts from the FND aggregate steadily increases and saturates around 100 mW of laser power and fully vanishes when the trapping beam is off. By mounting the sample chamber onto a piezo-electric stage, we further realize the 3D spatial control of a trapped FND aggregate in liquid solution (see Supplementary Materials). This enables the characterization of spatially-dependent phenomena with the same FND aggregate, eliminating the difficulties of calibrating different FNDs due to particle-to-particle variation.
The spin transition energies of NV centers in optically trapped FND aggregates can be probed using electron-spin resonance (ESR) spectroscopy: by sweeping the frequency of the applied microwave drive while monitoring the fluorescence signal, we expect a decrease in fluorescence when the microwave frequency is resonant with the electronic spin transition and drives the spin from to the less bright sublevels. Figure 1d displays the obtained ESR spectrum from a trapped FND aggregate in water in the absence of any external fields. We observe the characteristic NV resonance at GHz with a small peak splitting, originating from the local strain and electric environment of the FNDs mittiga2018imaging .
Next, we demonstrate spin-relaxometry, i.e. the use of the NV spin’s lifetime, , to sense the local magnetic fluctuation from paramagnetic spin species in liquid environment. To reliably probe the spin relaxation dynamics of NV centers in FNDs, we utilize a robust differential measurement scheme illustrated in Figure 1e. Specifically, after letting the spin system reach charge state equilibration for s in the dark, we apply a s green laser to initialize the spin state of NV centers, followed by free spin relaxation. A second green laser pulse is applied at the end for fluorescence detection, with the photon counts designated as the bright signal, . By repeating the same sequence but with a final -pulse before the readout to swap the spin populations between and sublevels, we measure the fluorescence of an orthogonal spin state to be the dark signal, . The difference in fluorescence (contrast) between the two quantities, , can faithfully represent the measured spin relaxation dynamics of NV centers, where is a reference signal we measure at the end of the initialization laser pulse. We remark that such a differential measurement scheme has been widely employed in studies of dense ensembles of solid-state spin defects to counter the photo-ionization process. If one only accounts for the normalized signal bright, , the measured dynamics can be highly dependent on the laser power of the applied green laser and does not reflect the actual spin relaxation () process of the NV centers within FNDs mrozek2015longitudinal ; choi2017depolarization ; Gong2023 .
Figure 1e shows the measured spin relaxation dynamics of NV centers in the aggregated FNDs. Interestingly, we find that the decay follows a stretched exponential profile, , rather than a conventional single exponential profile. This profile can be understood as the average effect from an ensemble of NV centers in FNDs, as each has a different decay timescale sensitive to local environment (see the ”theoretical model” section below). For optically trapped nm FNDs in deionized water, we extract timescale ranging from s. We note that the measured timescale with FNDs trapped in deionized water are typically shorter than dried FNDs with similar sizes Tetienne2013 .
Sensing Paramagnetic Species with Nanomolar Resolution — Now with optically-trapped FNDs in hand, we then seek to probe paramagnetic species in aqueous environments using relaxometry. For a proof of principle experiment, we employ the use of GdCl3, which when dissolved in water dissociates into Cl- and Gd3+ ions. Because of its seven unpaired electrons, Gd3+ species is highly paramagnetic and has been widely used in magnetic resonance experiments Tetienne2013 ; sushkov2014all ; Radu2019 ; PeronaMartnez2020 ; gao2023quantum .
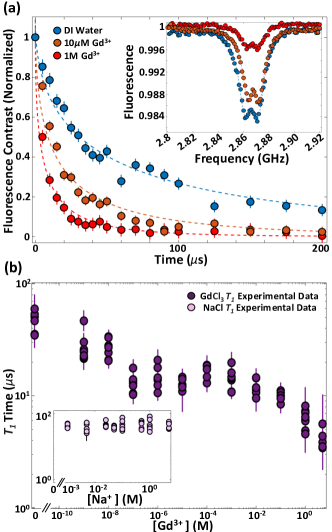
To experimentally determine the effect of Gd3+ on NV centers in optically-trapped FNDs, we collect measurements at a series of Gd3+ concentrations expanding more than 9 orders of magnitude, from 1 nM to 5 M (Figure 2a). FNDs are first suspended in deionized water and mixed with GdCl3 solution, and then injected into a fluidics chamber. We apply 93 mW of the IR trapping laser beam to confine and form a FND aggregate with sizes ranging between m in solution, and then perform ESR and measurements at the center of the aggregate. We notice that the suspended FNDs tend to aggregate more at higher GdCl3 density, agreeing with findings from prior studies that salts can diminish the repulsive forces between the negatively charged surfaces of FNDs hemelaar2017interaction . At each Gd3+ concentration, the measurement is repeated for seven different aggregates to account for the particle-to-particle variation and obtain sufficiently statistically reliable measurements of the timescales. In particular, after acquiring a measurement, we flush the chamber with additional FND-Gd3+ solution to dissipate the trapped FND aggregate, allowing for a new aggregate to be formed in the trap. We flush and clean the fluidics chamber with deionized water before moving on to a different Gd3+ concentration.
Intuitively, paramagnetic spins in solution will generate magnetic fluctuations at the FNDs, leading to reduction of the NV spin relaxation time. This is indeed borne out of our data. As shown in Figure 2a, the measured NV drops from s in deionized water to s with M Gd3+, and to s with M Gd3+. Moreover, the reduction of at higher Gd3+ density is further corroborated with the decrease of ESR contrast (Figure 2a Inset), as shorter spin lifetime can result in worse optical initialization efficiency under green laser excitation.
Figure 2b summaries the dependence of NV on Gd3+ concentration. Crucially, in contrast to a simple monotonic decay of with increasing [Gd3+], we observe a clear triphasic response: the timescale first exhibits a sharp drop from 1 nM to 100 nM, and then plateau within a broad range of [Gd3+], followed by another drop beyond mM concentration. To confirm that the change in the of NV centers indeed comes from paramagnetic species Gd3+ in the solution, we perform another set of relaxometry experiments on FNDs in soltions of NaCl, as neither Na+ nor Cl- ions carry unpaired electrons. In this situation, we observe that the of NV centers in FNDs is independent of NaCl concentration (Figure 2b Inset).
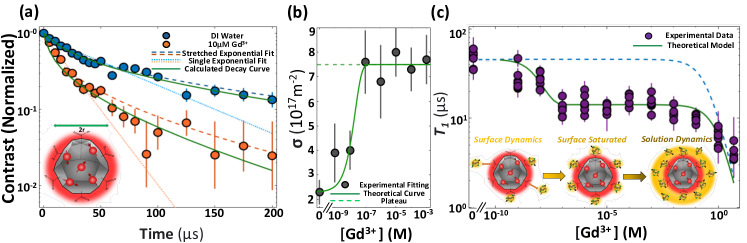
Theoretical model — To capture the observed triphasic response of NV in FNDs, we develop a theoretical model accounting for both the freely moving paramagnetic spins in solution and the spins attracted towards the surface of the FNDs. In particular, the initial drop in at nanomolar concentrations can be understood via the attraction of Gd+3 ions from the solution to the FND surface, which effectively create a dense layer of paramagnetic spins on the FND surface.
The FNDs used in this work have carboxyl surface (-COOH) groups which may confer a negative charge to the FND’s surface Fujisaku2019 (Fig. 3a inset). As positively charged Gd3+ ions are introduced into the solution, some of them can be attracted to the FND surface via Coulomb interaction, leading to an effective shell of dense paramagnetic spins even at nanomolar Gd3+ concentration. These surface paramagnetic spins are responsible for the initial sharp drop of NV from 1 nM to 100 nM Gd3+ concentration. As Gd3+ density keeps increasing, the amount of surface spins saturates due to the limited availability of negatively charged bonds on the FND surface (Fig. 3b). This results in the second phase where the response plateaus within a broad range from 100 nM to 10 mM. When Gd3+ concentration goes beyond mM, the spins in the solution become the dominant source for magnetic noise, and the of NV centers continue to decrease in the third phase (Fig. 3c).
To achieve quantitative agreement between our model and experiment, we theoretically calculate the of NV centers in FNDs in the presence of Gd3+ ions. Within a single nm FND, there exists on average NV centers, thus the experimentally measured spin relaxation decay is the summation of the signals from all NV centers distributed inside the FND. Assuming the decay profile for each NV center, labeled by index , follows a single exponential decay with timescale , the measured then takes the form,
| (1) |
where N characterizes the total number of NV centers.
For each NV, is induced by the paramagnetic spins from the surrounding, whose value can be estimated following prior work Tetienne2013 ,
| (2) |
where refers to the paramagnetic spins in the environment, including both surface spins (characterized by surface density ) and the spins in solution (characterized by volume density [Gd3+]), is the strength of the magnetic field at the site of the NV center (perpendicular to the NV axis), is the correlation time of field, and GHz is the spin transition frequency between and sublevels. By averaging across all possible random positions of NV centers within the FND, as well as the surrounding paramagnetic spins, we fit the theoretically calculated spin relaxation dynamics to the experimental data and extract values for the surface spin density, , as a function of volume spin density . At a given Gd3+ concentration, the only fitting parameter in our model is the surface Gd3+ concentration, , while all other terms can be independently estimated (see Supplementary Materials for more details).
Using our model, we successfully reproduce the characteristic decay profiles of the measured NV spin relaxation dynamics (Fig. 3a). Specifically, the calculated decay curves across all concentrations follow a stretched exponential fit rather than the conventional single exponential profiles. Such agreement further corroborates the feasibility of our theoretical model. Figure 3b shows the extracted surface spin concentration value, , which saturates at around m-2, corresponding to an average spacing of nm between surface spins. We highlight that even in the case of deionized water, there exists a finite density of surface spins, presumably from the dangling bonds on the FND surface. This agrees with the previous studies that shallow NV centers typically exhibit shorter timescale compared to NV centers in the bulk diamond. Combining both the contributions of spins from the surface and solution concentrations, our model proves to be in complete congruence with the experimentally measured timescale across all three stages (Fig. 3c).
III Outlook
Looking forward, our work opens the door to several intriguing future directions. On the technological front, the nanomolar resolution of detection demonstrated here relies on the carboxylated surface of FND sensors to attract charged paramagnetic species from the solution. One interesting direction to explore would be the potential to boost quantum sensing and fine tune the sensitivity of FNDs using various methods of surface functionalization xie2022biocompatible ; janitz2022diamond ; ackermann2019efficient ; sangtawesin2019origins ; kawai2019nitrogen ; kayci2021multiplexed . On the scientific front, paramagnetic species regulate critical physiological processes, including metabolism and cell signaling nie2021quantum ; dai2023interface . Achieving localized detection and quantification of these species will be essential to bolster the mechanistic understanding of these processes in living systems.
Acknowledgements: We gratefully acknowledge assistance in the early stage of the experiment from R. Gong, Z. Liu, G. He and X. Du. We thank A. Jayich, Z. Zhang and M. Xie for helpful discussions. This work is supported by the seed funding from Center for Quantum Leaps at Washington University. E.H. acknowledges suppoort from the Gordon and Betty Moore Foundation, grant DOI 10.37807/gbmf11560. S.M. acknowledges support from NIH grant R35GM142704. C.Z. acknowledges support from NSF ExpandQISE 2328837.
References
- (1) Nie, L. et al. Quantum monitoring of cellular metabolic activities in single mitochondria. Science advances 7, eabf0573 (2021).
- (2) Dai, Y. et al. Interface of biomolecular condensates modulates redox reactions. Chem (2023).
- (3) Barton, J. et al. Nanoscale dynamic readout of a chemical redox process using radicals coupled with nitrogen-vacancy centers in nanodiamonds. ACS nano 14, 12938–12950 (2020).
- (4) Rendler, T. et al. Optical imaging of localized chemical events using programmable diamond quantum nanosensors. Nature communications 8, 14701 (2017).
- (5) Fan, S. et al. Diamond quantum sensing revealing the relation between free radicals and huntington’s disease. ACS Central Science (2023).
- (6) Barry, J. F. et al. Optical magnetic detection of single-neuron action potentials using quantum defects in diamond. Proceedings of the National Academy of Sciences 113, 14133–14138 (2016).
- (7) Igarashi, R. et al. Tracking the 3d rotational dynamics in nanoscopic biological systems. Journal of the American Chemical Society 142, 7542–7554 (2020).
- (8) Kuo, Y., Hsu, T.-Y., Wu, Y.-C. & Chang, H.-C. Fluorescent nanodiamond as a probe for the intercellular transport of proteins in vivo. Biomaterials 34, 8352–8360 (2013).
- (9) Schrand, A. M., Hens, S. A. C. & Shenderova, O. A. Nanodiamond particles: properties and perspectives for bioapplications. Critical reviews in solid state and materials sciences 34, 18–74 (2009).
- (10) Kucsko, G. et al. Nanometre-scale thermometry in a living cell. Nature 500, 54–58 (2013).
- (11) Fujiwara, M. et al. Real-time nanodiamond thermometry probing in vivo thermogenic responses. Science advances 6, eaba9636 (2020).
- (12) Simpson, D. A. et al. Non-neurotoxic nanodiamond probes for intraneuronal temperature mapping. ACS nano 11, 12077–12086 (2017).
- (13) Petrini, G. et al. Nanodiamond–quantum sensors reveal temperature variation associated to hippocampal neurons firing. Advanced Science 9, 2202014 (2022).
- (14) Hsieh, S. et al. Imaging stress and magnetism at high pressures using a nanoscale quantum sensor. Science 366, 1349–1354 (2019).
- (15) Fujisaku, T. et al. pH nanosensor using electronic spins in diamond. ACS Nano 13, 11726–11732 (2019). URL https://doi.org/10.1021/acsnano.9b05342.
- (16) Xu, F. et al. Quantum-enhanced diamond molecular tension microscopy for quantifying cellular forces. Science Advances 10, eadi5300 (2024).
- (17) Block, M. et al. Optically enhanced electric field sensing using nitrogen-vacancy ensembles. Physical Review Applied 16, 024024 (2021).
- (18) Martínez, F. P., Nusantara, A. C., Chipaux, M., Padamati, S. K. & Schirhagl, R. Nanodiamond relaxometry-based detection of free-radical species when produced in chemical reactions in biologically relevant conditions. ACS Sensors 5, 3862–3869 (2020). URL https://doi.org/10.1021/acssensors.0c01037.
- (19) Bian, K. et al. Nanoscale electric-field imaging based on a quantum sensor and its charge-state control under ambient condition. Nature Communications 12, 2457 (2021).
- (20) Aslam, N. et al. Quantum sensors for biomedical applications. Nature Reviews Physics 5, 157–169 (2023).
- (21) Wu, Y. & Weil, T. Recent developments of nanodiamond quantum sensors for biological applications. Advanced Science 9, 2200059 (2022).
- (22) Rodgers, L. V. et al. Materials challenges for quantum technologies based on color centers in diamond. MRS Bulletin 46, 623–633 (2021).
- (23) Mochalin, V., Shenderova, O., Ho, D. & Gogotsi, Y. The properties and applications of nanodiamonds. Nano-enabled medical applications 313–350 (2020).
- (24) Shi, F. et al. Single-protein spin resonance spectroscopy under ambient conditions. Science 347, 1135–1138 (2015).
- (25) Choi, J. et al. Probing and manipulating embryogenesis via nanoscale thermometry and temperature control. Proceedings of the National Academy of Sciences 117, 14636–14641 (2020).
- (26) Chen, S. et al. Immunomagnetic microscopy of tumor tissues using quantum sensors in diamond. Proceedings of the National Academy of Sciences 119, e2118876119 (2022).
- (27) Glenn, D. R. et al. Single-cell magnetic imaging using a quantum diamond microscope. Nature methods 12, 736–738 (2015).
- (28) Chipaux, M. et al. Nanodiamonds and their applications in cells. Small 14, 1704263 (2018).
- (29) Hsiao, W. W.-W., Hui, Y. Y., Tsai, P.-C. & Chang, H.-C. Fluorescent nanodiamond: a versatile tool for long-term cell tracking, super-resolution imaging, and nanoscale temperature sensing. Accounts of chemical research 49, 400–407 (2016).
- (30) Shenderova, O. A. & McGuire, G. E. Science and engineering of nanodiamond particle surfaces for biological applications. Biointerphases 10 (2015).
- (31) van der Laan, K., Hasani, M., Zheng, T. & Schirhagl, R. Nanodiamonds for in vivo applications. Small 14, 1703838 (2018).
- (32) Miller, B. S. et al. Spin-enhanced nanodiamond biosensing for ultrasensitive diagnostics. Nature 587, 588–593 (2020).
- (33) Jariwala, D. H., Patel, D. & Wairkar, S. Surface functionalization of nanodiamonds for biomedical applications. Materials Science and Engineering: C 113, 110996 (2020).
- (34) Xie, M. et al. Biocompatible surface functionalization architecture for a diamond quantum sensor. Proceedings of the National Academy of Sciences 119, e2114186119 (2022).
- (35) Horowitz, V. R., Aleman, B. J., Christle, D. J., Cleland, A. N. & Awschalom, D. D. Electron spin resonance of nitrogen-vacancy centers in optically trapped nanodiamonds. Proceedings of the National Academy of Sciences 109, 13493–13497 (2012). URL https://doi.org/10.1073/pnas.1211311109.
- (36) Hoang, T. M., Ahn, J., Bang, J. & Li, T. Electron spin control of optically levitated nanodiamonds in vacuum. Nature communications 7, 12250 (2016).
- (37) Russell, L. W. et al. Manipulating the quantum coherence of optically trapped nanodiamonds. ACS Photonics 5, 4491–4496 (2018). URL https://doi.org/10.1021/acsphotonics.8b00946.
- (38) Mittiga, T. et al. Imaging the local charge environment of nitrogen-vacancy centers in diamond. Physical review letters 121, 246402 (2018).
- (39) Mrózek, M. et al. Longitudinal spin relaxation in nitrogen-vacancy ensembles in diamond. EPJ Quantum Technology 2, 1–11 (2015).
- (40) Choi, J. et al. Depolarization dynamics in a strongly interacting solid-state spin ensemble. Physical review letters 118, 093601 (2017).
- (41) Gong, R. et al. Coherent dynamics of strongly interacting electronic spin defects in hexagonal boron nitride. Nature Communications 14 (2023). URL https://doi.org/10.1038/s41467-023-39115-y.
- (42) Tetienne, J.-P. et al. Spin relaxometry of single nitrogen-vacancy defects in diamond nanocrystals for magnetic noise sensing. Physical Review B 87 (2013). URL https://doi.org/10.1103/physrevb.87.235436.
- (43) Sushkov, A. et al. All-optical sensing of a single-molecule electron spin. Nano letters 14, 6443–6448 (2014).
- (44) Radu, V. et al. Dynamic quantum sensing of paramagnetic species using nitrogen-vacancy centers in diamond. ACS Sensors 5, 703–710 (2019). URL https://doi.org/10.1021/acssensors.9b01903.
- (45) Gao, X. et al. Quantum sensing of paramagnetic spins in liquids with spin qubits in hexagonal boron nitride. arXiv preprint arXiv:2303.02326 (2023).
- (46) Hemelaar, S. R. et al. The interaction of fluorescent nanodiamond probes with cellular media. Microchimica Acta 184, 1001–1009 (2017).
- (47) Janitz, E. et al. Diamond surface engineering for molecular sensing with nitrogen—vacancy centers. Journal of Materials Chemistry C 10, 13533–13569 (2022).
- (48) Ackermann, J. & Krueger, A. Efficient surface functionalization of detonation nanodiamond using ozone under ambient conditions. Nanoscale 11, 8012–8019 (2019).
- (49) Sangtawesin, S. et al. Origins of diamond surface noise probed by correlating single-spin measurements with surface spectroscopy. Physical Review X 9, 031052 (2019).
- (50) Kawai, S. et al. Nitrogen-terminated diamond surface for nanoscale nmr by shallow nitrogen-vacancy centers. The Journal of Physical Chemistry C 123, 3594–3604 (2019).
- (51) Kayci, M., Fan, J., Bakirman, O. & Herrmann, A. Multiplexed sensing of biomolecules with optically detected magnetic resonance of nitrogen-vacancy centers in diamond. Proceedings of the National Academy of Sciences 118, e2112664118 (2021).