Sunyaev-Zeldovich signatures from non-thermal, relativistic electrons using CMB maps
Abstract
Relativistically energetic, non-thermal population of electrons can give rise to unique CMB spectral distortion signatures which can be significantly different from thermal Sunyaev-Zeldovich signal or -distortion. These signatures depend upon the spectrum of non-thermal electrons, therefore, a detection can inform us about the existence and abundance of non-thermal electrons in our universe. Using public CMB maps and data, we derive upper limits on non-thermal -parameter for a relativistic, power-law electron distribution. With future CMB experiments, we may be in a position to detect or put significantly tighter constraints on these signals which can affect our understanding of non-thermal electron distributions in our universe.
1 Introduction
The Sunyaev-Zeldovich (SZ) effect ZS1969 has become an indispensable tool for Cosmology as well as astrophysics in recent times due to the precise observation of Cosmic Microwave Background (CMB) radiation wmap2011 ; PlanckSZ_2016 ; SPT2022 ; ACT2023 . The SZ effect can be of two types, (i) thermal SZ effect ZS1969 , which is produced due to the inverse Compton scattering of CMB photons by hot, energetic electrons, (ii) kinetic SZ effect SZ1980 , due to Doppler boosting by bulk flow of electrons. The thermal SZ effect is predominantly produced at , once massive structures such as galaxy clusters forms KS2002 . Due to the bulk motion of these galaxy clusters, they also produce the kinetic SZ effect, however, it is subdominant compared to the thermal SZ effect by an order of magnitude SBDH2010 . During reionization epoch at , formation of ionized bubbles also contribute to the total kinetic SZ effect GH1998 . The readers are referred to B1999 ; M2019 for a detailed review on the SZ effect.
Gravitational collapse of matter leads to conversion of potential energy to thermal energy which heats up the electrons to keV temperatures inside massive objects such as galaxy clusters. CMB photons while passing through these structures get upscattered with probability given by the optical depth or where is the electron density, is the Thomson cross section and is the line of sight dimension of the object. On each collision, the thermal electrons impart a fraction of their energy () to the CMB photons, where is the electron temperature. This effect distorts the CMB blackbody Fixsen1996 with a distinct spectral shape which is classically termed as -distortion ZS1969 . This characteristic shape help us in distinguishing the thermal SZ signature from kinetic SZ as well as CMB and other astrophysical foregrounds.
The spectral distortion shape is sensitive to the kinematics of Compton scattering between the electron and the CMB photons. For 1 keV, the thermal SZ signature is independent of the temperature as Compton scattering is non-relativistic. At higher temperatures, relativistic corrections become important due to Klein-Nishina terms IKN1998 ; Challinor1998 ; SS1998 . These computations can be done extremely fast using the public code SZpack CNSN2012 . For a non-thermal relativistic electron distribution, perturbative corrections terms are not sufficient and one needs to resort to a more general formulation EK2000 ; C2008 . The non-thermal SZ effect carries distinct information of the electron spectrum which produced it in the first place. Therefore, this is an ideal tool to study the abundance of relativistic electrons in our universe using CMB maps. Although, in this paper, we only consider scattering of electrons with the CMB photons, in general, these electrons will scatter all photons in the way which need not be just CMB photons. Recent works have discussed scattering of Cosmic Infrared Background SHB2022 ; AC2023 and radio background HC2021 photons with the electrons residing inside galaxy clusters which can give rise to interesting signatures.
Possible sources of non-thermal electrons include cosmic ray electrons and relativistic electrons in radio galaxy lobes FR1969 ; S1974 ; BC1989 ; N1995 ; ZPP2014 . The electron distribution is typically a power law CMBM2013 which is inferred from radio and X-ray observations ITGHNHSM2009 . For a relativistic electron with Lorentz factor , a photon with energy is boosted to via inverse Compton scattering BG1970 . For electrons with , the boosted CMB photons still show up in CMB band ( GHz). Electrons in same population but with can boost the CMB photons to X-ray bands. These eletrons in extreme high energy tail also produce radio signature via synchrotron emission. Therefore, a detection of non-thermal SZ signature will nicely complement the radio and X-ray probes of relativistic electrons. Even a non-detection can put interesting upper limits, rule out some parameter space and can constrain our understanding of particle acceleration processes. In a recent work CCAT2023 , the authors claim to obtain competitive constraints on magnetic field inside clusters hosting radio halos by constraining the abundance of non-thermal electrons.
In this paper, we aim to constrain non-thermal SZ signal for a few representative electron spectra using Planck full sky CMB data Pl2016 . Using a stacking approach, we obtain upper limits on the amplitude of the signal. While the current limits may be uninteresting, with future CMB experiments, we may be in a position to detect or set interesting upper limits on these signals. This paper is organized as follows. In Sec. 2, we describe non-thermal SZ signature in detail. We discuss the datasets used and matched filtering method in Sec. 3 and 4 respectively. We detail our modelling of data in Sec. 5 and explain our results in Sec. 6. We conclude with some potential future directions in Sec. 7.
2 Sunyaev-Zeldovich (SZ) effect from non-thermal electron distribution
The CMB photons while passing through a distribution of energetic electrons can get upscattered by the electrons which imprints a characteristic distortion signal on top of CMB. For a distribution of thermal electrons, the CMB distortion signal is given by the well-known -distortion (ZS1969, ). The distortion signal is sensitive to electron energy distribution as it depends upon the kinematics of scattering process involved which in this case is inverse Compton scattering. The number of CMB photons which get upscattered from energy to is given by,
| (1) |
where is the kernel of the inverse Compton scattering which captures the kinematics of photon scattering with the electrons with electron momentum , is the dimensionless frequency of photons which is given by , being the CMB temperature and . The kernel satisfies the relation, , since Compton scattering is a photon number conserving process. The expression for is given by (EK2000, ),
| (2) |
Exact expressions for Compton scattering kernels across all energy ranges can be found in SCL2019 . By taking into account the number of photons which escape or enter into a particular energy bin and summing over all bins, we obtain the spectral shape of distorted CMB. The intensity of this distortion is given by,
| (3) |
where is the change in intensity of distorted CMB with respect to the undistorted Planckian spectrum. The amplitude of distortion signal is given by (where stands for non-thermal) whose expression is given by,
| (4) |
where is the pressure and is a length element along the line of sight. The spectral shape is the spectral distortion shape from a normalized electron distribution and as explained above is sensitive to the non-thermal electron distribution. In this work, we assume the non-thermal electrons to have a power-law shape with electron number density where is the dimensionless momentum with , being the Lorentz factor. We assume the spectrum to be extended from to though reasonable change to will not affect results significantly. We fix to be 3 which is the average spectral index inferred from a population of radio galaxies CMBM2013 .
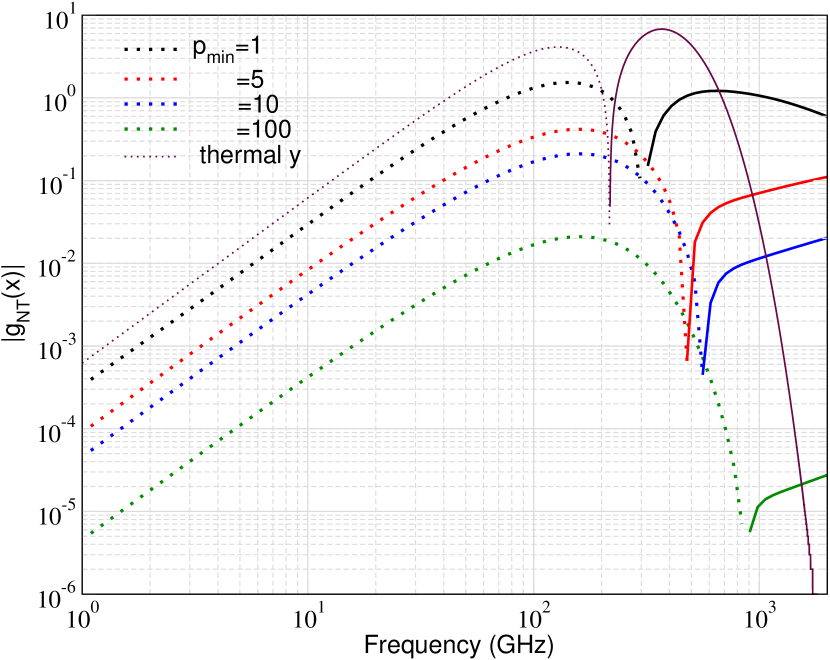
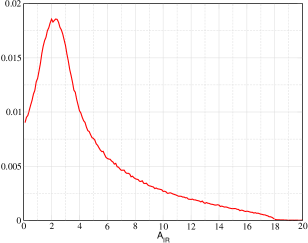
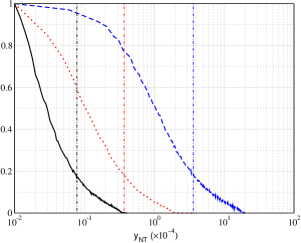
In Fig. 1, we plot the dimensionless spectral distortion shape for few different and assuming . With increase in electron energy, an electron can boost the CMB photons to higher energy, therefore, moving the null points to the right. Since captures the fraction of energy injected to the scatterd CMB photons with respect to unscattered photons, keeping fixed and increasing , reduces the amplitude of . This is beacuse a higher energy electron can impart a larger fraction of energy to the CMB photons in one scattering. Therefore, as the photons move to higher energy, their overall amplitude in the CMB band reduces. It is interesting to note that below GHz, the distortion shapes looks like scaled version of each other. This is expected since the target photon distribution, which is the CMB, is same for all the electrons. Therefore, the negative part of distortion or removal of photons mimics the spectrum of CMB. This also illustrates a non-trivial result that one can not distinguish different non-thermal electron distribution using multifrequency CMB experiments with frequency channels below GHz and higher frequency channels are critical for such science case.
We should also point out that the intensity distortion of CMB () is the physical observable. Therefore, a detection or non-detection of non-thermal spectral distortion will result in constraints which are degenerate combination of and . This is opposed to the case of thermal distortion for which one assumes the distortion shape to be so-called -distortion (ZS1969, ) which is universal and has no parameter dependence in it. Therefore, one can directly translate the constraints on the intensity to thermal -parameter, , or just which is the notation used in literature. However, things will not be that simple once we take into account relativistic corrections which has a dependence of gas temperature (Wright1979, ; Fabbri1981, ; Rephaeli1995, ; Challinor1998, ; Sazonov1998, ; Itoh98, ) and is relevant for the environment inside the biggest galaxy clusters in the universe (RBRC2019, ). Then, one needs the temperature information to get constraint on thermal -parameter.
In this work, we choose a few representative , 10 and 100. As can be noted from Fig. 1, chances of detecting non-thermal SZ signature goes down with increasing . However, such cases will generate signals in radio, X-ray or may be even gamma ray bands which can provide complementary constraints on radio galaxy parameters. Therfore, a non-detection in CMB bands while a correlated detection in higher energy bands can constrain our understanding of particle acceleration processes.
2.1 Sources of non-thermal electrons inside galaxy clusters
Compression of matter due to gravity during collapse of matter or structure formation, releases energy which heat gas. Since structure formation is a complex process, it is not impossible to believe that a significant portion of electrons do not follow thermal or Maxwell-Boltzmann distribution and remain relativistic with a power-law like spectrum. Besides, cosmic ray electrons and emission of relativistic electrons from accreting supermassive black holes can produce a non-negligible population of non-thermal electrons EK2000 ; C2008 ; CMBM2013 . Non-thermal electrons in radio galaxy lobes produce radio emission through synchrotron emission as well as X-rays via inverse Compton process on the CMB photons CHHBBW2005 ; ITGHNHSM2009 . Therefore, a distortion in CMB bands is expected from the same population of electrons. Studying the correlated signatures of these non-thermal electrons across CMB, radio and X-ray bands can potentially improve our knowledge of these energetic processes significantly. In this paper, we assume that all non-thermal electrons are hosted within the galaxy clusters and use the available CMB data to constrain their abundance.
3 Datasets
3.1 Planck full-sky maps
In this work, we have used 2nd data release of Planck full sky map Pl2016 . We have used the maps for 5 frequency channels (70,100,143,217 and 353 GHz) and ignored the lower and higher frequency channels. The lower frequency channels (30 and 44 GHz) have much lower angular resolution, 32 and 27 arcmin respectively, and are expected to be contaminated by radio point sources. Similarly, 545 and 857 GHz are severely contaminated by dust and infrared point sources. The resolution of Planck frequency maps are tabulated in Table 1. The maps are provided in HEALPIX (healpix2005, ) format with . We have reduced the maps to for computational simplicity. The maps between 30-353 GHz are provided in the units of and we have converted to the units of using the transformation,
| (5) |
where and the maps are provided in the format of K. We have also used the mask, in order to reduce the galactic contamination.
3.2 Galaxy cluster catalogue
Our goal of this work is to constrain non-thermal SZ contribution which we assume to be sourced inside the massive structures in the universe such as galaxy clusters. Therefore, we use the Planck second Sunyaev-Zeldovich source Union catalog PlanckSZ_2016 which provides a sample of candidate galaxy cluster objects. The Union catalogue combines the result of three independent galaxy cluster extraction algorithms. Several of properties such as angular coordinates, redshift, mass are listed in the catalogue, however, in this work, we use only the angular coordinates of these galaxy clusters. Our use of galactic mask reduces the number of galaxy clusters unaffected by the mask which turns out to be . We use all of these objects in the mask-free region for our stacking computation.
| Frequency (GHz) | FWHM (arcmin) |
|---|---|
| 70 | 13.31 |
| 100 | 9.66 |
| 143 | 7.27 |
| 217 | 5.01 |
| 353 | 4.86 |
4 Matched filtering method
In this work, we have used the matched filtering approach to extract the temperature fluctuation along the direction of galaxy clusters. The matched filtering approach was developed in the works of HT1996 ; HSHBDML2002 ; MBD2006 and was subsequently applied to CMB data to extract galaxy cluster catalogues, as an example see PlanckSZ_2016 . For more recent and interesting applications, the readers are referred to SGEPS2017 ; EBCB2018 . In this approach, we use a template for the signal we are looking for in order to extract this signal from a map containing signal along with foregrounds and noise. In general, one can use both a spatial and frequency template to make the filtering process more effective. Indeed, it is typically assumed that the hot gas inside the galaxy clusters give rise to thermal SZ signal predominantly and its spectral independence from all other foregrounds along with CMB as well as the spatial profile of clusters is used to identify the galaxy cluster candidates. Here, we use only the spatial information in the filtering step for individual galaxy cluster candidate and use frequency template to isolate non-thermal SZ signal only after stacking all the objects in our galaxy catalogue.
The signal at an angular location in sky can be modelled as,
| (6) |
where is the spatial template, parameterized by and centered at , is the magnitude of the signal component, that we are after, at the center of the object and is the noise which refer to every other signal that we are not interested in including instrumental noise. We want to construct a filter which when applied to this data will reliably give us back the signal we are after or concretely,
| (7) |
In the flat sky approximation, the filter in the fourier space is given by (MBD2006, ),
| (8) |
where . In the flat-sky approximation, there is a one-to-one correspondence between the angular multipole and fourier mode as . Also the noise power spectrum can be identified with which can be be directly extracted from the map. Technically, the noise power spectrum extracted from the data includes the contribution from the signal that we are looking after. However, in case of galaxy clusters, this contribution is negligible compared to the CMB as well as the foregrounds. A recent work looks into a more accurate computation using an iterative approach ZRCB2023 which can be important for future CMB experiments.
The filter needs to convolved with the beam since one can not resolve sources with size less than the width of the beam. Including the effect of beamwidth, the expression for filter becomes,
| (9) |
The beam is assumed to be gaussian with FWHM given in Table 1.
We assume that the non-thermal SZ signature is correlated with the shape of galaxy clusters which is typically a spherical beta model. A signal correlated with the shape of the cluster can be expressed as,
| (10) |
where is the core radius and is assumed to be 1. The analytic spherical transform of the profile with is given by SGEPS2017 ,
| (11) |
where is the modified Bessel function of the second kind.
The galaxy clusters resides inside dark matter halos whose size are denoted by which can be related to its mass and redshift as,
| (12) |
where is the mass of the halo, and is the angular diameter distance and is the hydrostatic bias Planck2014_powerspectrum . For the redshift and mass distribution of galaxy cluster catalogue, varies between to 10 arcmin. The core size is related to halo size by the expression, , where using the concentration-mass relation HK2003 ; DSKD2008 . In this work, we fix arcmin to be the representative size of the galaxy clusters and do not bin the objects by their sizes. We do not expect this choice to significantly affect our results as we do a stacking computation which should average out these effects.
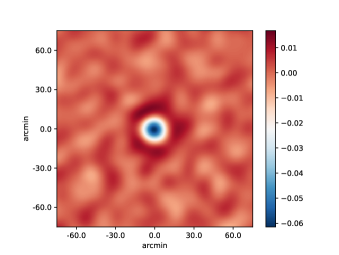
In Fig. 2, we show the matched filter in pixel space which we use for the 143 GHz map. The filter is polar symmetric which is expected due to our choice of cluster profile. The filter shows ringing pattern with positive and negative values which helps in removing large scale foregrounds, uncorrelated to the galaxy clusters. Essentially, our matched filter acts as a high pass filter. We apply the filter to appropriate frequency maps and then stack all the unmasked galaxy clusters. In principle, one can bin clusters in mass or redshift. However, we expect the signal to be weak and binning will make it even more weaker. Therefore, in this work, we have stacked all the clusters without any binning. This is useful in providing upper limits and once we have a detection, we can look for variation of signal as a function of mass or redshift of galaxy clusters.
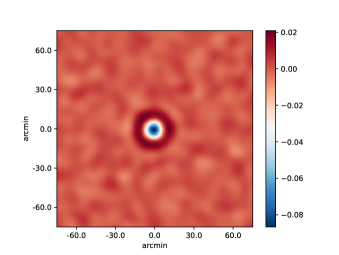
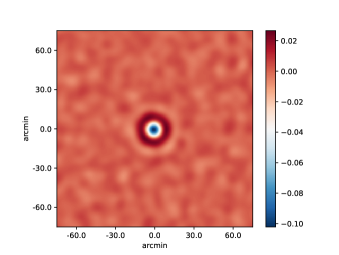
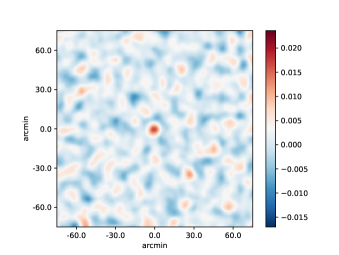
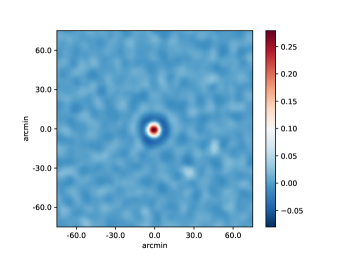
In Fig. 3, we show the spectral intensity of signal at the location of clusters by stacking them. One can clearly see the stacked signal with high significance at the central pixel. One can also see that the spectral intensity is negative at GHz while positive at higher frequency. We now move to fitting frequency template to the matched filtered data and discuss our modelling in the next section.
5 Data modelling
After filtering, the only surviving contribution from galaxy clusters are thermal SZ and infrared emission correlated to the clusters, in addition to non-thermal SZ, if any. Therefore, we fit a three component model to our data. The thermal -distortion is given by the analytic formula ZS1969 ,
| (13) |
where and is the amplitude which is a free parameter. Similarly, the template for infrared component is given by a modified blackbody function,
| (14) |
We have fixed the value of GHz, and K. This simple choice of template and parameters fit the data well Planck_infrared but we do not claim that it captures all the physics correctly. In SHKO2012 and MM2021 , the authors describe a halo model approach which motivate a similar spectral template within the context of current data. The non-thermal distortion is parameterized as in eq. 3,
| (15) |
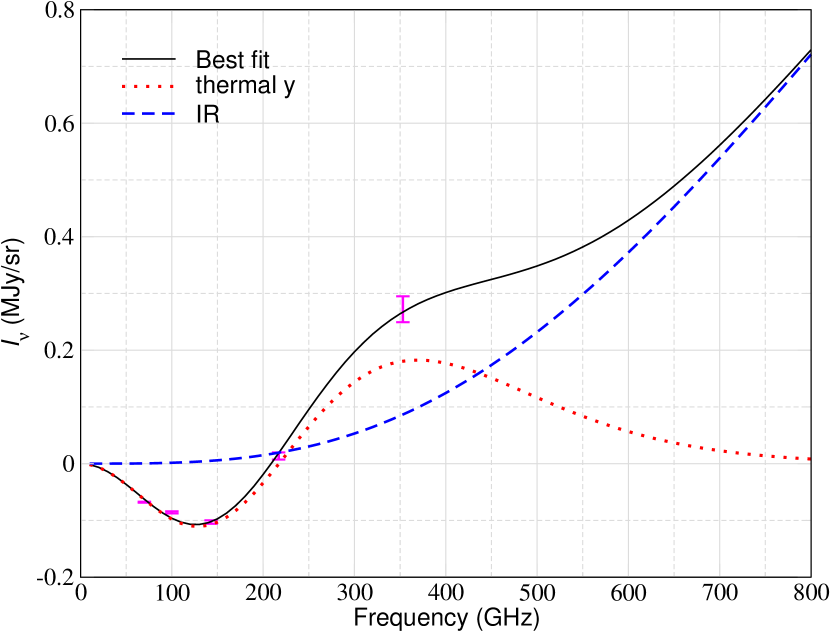
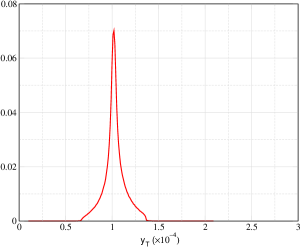
In our modelling, we allow only the amplitude of the three components to vary. To estimate the noise covariance matrix, we stack uniformly distributed random positions, with same number as many as galaxy clusters in our sample, in the map. We repeat the exercise for times to obtain a distribution which sets the variance for individual frequency channel. We ignore correlation across different frequency channel, therefore, our covariance matrix is diagonal. Assuming gaussian likelihood, we use Markov Chain Monte Carlo (MCMC) sampling to obtain posterier distribution on the free parameters. In Fig. 4, we show our matched filtered, stacked data and best fit combination to data with just thermal and IR. In addition, we show the marginalized posterior distribution on and in Fig. 5. The best fit and turns out to be and 2.2 respectively. In the next section, we include non-thermal SZ and derive marginalized constraints on .
6 Results
In this section, we provide our main results in the form of upper limits on for a few different non-thermal electron spectrum parameterized by as in Sec. 2. We use flat prior on , and for MCMC sampling.
6.1 Constraining with varying and
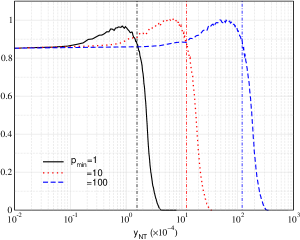
In Fig. 6, we show the marginalized posterior on by simultaneously varying , and . For , we obtain upper limit on which is of the order of . This is expected as the spectral shape for is similar to thermal -distortion (at least for GHz), therefore, our upper limit is of the same order as the best fit as obtained in the previous section. The constraints weaken significantly for higher which again follows from behaviour as seen in Fig. 1.
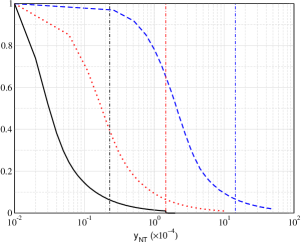
We further consider a case, where we fix and . This corresponds to the case where we have a strong prior on both of these parameters. This might be possible with future CMB experiments such as SO2019 ; CMB_HD2019 ; CCAT2023 where we will detect thermal SZ signature with very high significance and can model IR component much better with more high frequency channels. As expected, we obtain much stronger constraints with for .
6.2 Constraining with varying only
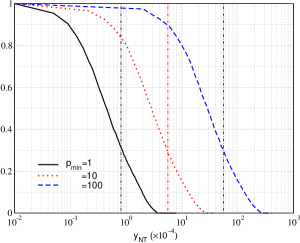
As described in the previous section, we have used a simple description for IR component where we have fixed some of the parameters (dust temperature as an example). Depending on the complexity of the modelling, constraints on obtained above might change. Therefore, in this section, we do not fit for IR component to the data. In Fig. 7, we show the marginalized posterior on for this case. We obtain upper limits which are quantitatively similar compared to the previous subsection.
In this work, we have used a sample of galaxy clusters while, in future, we might have a sample of clusters CMB_HD2019 . Assuming the noise in Fig. 4 goes down by , where is the number of galaxy clusters, the constraints can further tighten up or may lead to a potential detection. We simulate such a situation where we have simply scaled down the noise in Fig. 4 by a factor of 10 and repeating the analysis. The results are shown in the right hand panel of Fig. 7. We find that keeping up with the noise level, the constraints also tighten up by an order of magnitude and reach a level of for . An upper limit of would constraint non-thermal electron pressure to less than about 10 percent of thermal electrons. Even though higher results in weaker constraints, a non-detection will result in ruling out some parameter space in conjunction with radio or X-ray observations. This will have interesting implications for particle acceleration mechanisms in cosmic objects like galaxy clusters.
7 Conclusion
In this paper, we have obtained constraints on non-thermal SZ signatures with a power-law electron population, assuming that these non-thermal electrons are hosted inside the galaxy clusters. We have used Planck public data and galaxy cluster catalogue to obtain the upper limits on non-thermal SZ for a few representative electron populations. Unsurprisingly, these upper limits depend upon the electron spectrum and our strongest upper limit is of the order of . This would imply that the maximum possible non-thermal electron pressure is about the same order of magnitude compared to thermal electrons. This may be physically non-interesting as thermal electrons are expected to dominate non-thermal electrons inside the galaxy clusters. However, with increase in number of galaxy cluster detections with future CMB experiments such as CMB-HD, we could tighten the upper limits by an order of magnitude. Even with eROSITA galaxy cluster catalogue erosita2012 with about detections, we may be able to reach that goal in near future. While a detection will be exciting, a non-detecton of non-thermal SZ signature in combination with radio, X-ray surveys can put strong constraints on parameter space of potential non-thermal electron spectra and expand our knowledge of particle acceleration mechanism inside galaxy clusters.
8 Acknowledgements
This work is supported by ARCO fellowship. We acknowledge discussions with Vyoma Muralidhara in the early part of the project. We acknowledge Jens Chluba for comments on the draft and Rishi Khatri for discussions on some aspects of calculations.
References
- (1) Ya. B. Zeldovich and R. A. Sunyaev. The Interaction of Matter and Radiation in a Hot-Model Universe. ApSS, 4(3):301–316, July 1969. [DOI], [ADS].
- (2) E. Komatsu, K. M. Smith, J. Dunkley, C. L. Bennett, B. Gold, G. Hinshaw, N. Jarosik, D. Larson, M. R. Nolta, L. Page, D. N. Spergel, M. Halpern, R. S. Hill, A. Kogut, M. Limon, S. S. Meyer, N. Odegard, G. S. Tucker, J. L. Weiland, E. Wollack, and E. L. Wright. Seven-year Wilkinson Microwave Anisotropy Probe (WMAP) Observations: Cosmological Interpretation. ApJS, 192(2):18, February 2011. arXiv:1001.4538, [DOI], [ADS].
- (3) Planck Collaboration. Planck 2015 results. XXVII. The second Planck catalogue of Sunyaev-Zeldovich sources. A&A, 594:A27, September 2016. arXiv:1502.01598, [DOI], [ADS].
- (4) SPT-SZ collaboration. CMB/kSZ and Compton-y Maps from 2500 deg2 of SPT-SZ and Planck Survey Data. ApJS, 258(2):36, February 2022. arXiv:2102.05033, [DOI], [ADS].
- (5) ACT collaboration. The Atacama Cosmology Telescope: High-resolution component-separated maps across one-third of the sky. arXiv e-prints, page arXiv:2307.01258, July 2023. arXiv:2307.01258, [DOI], [ADS].
- (6) R. A. Sunyaev and Ya. B. Zeldovich. The velocity of clusters of galaxies relative to the microwave background - The possibility of its measurement. MNRAS, 190:413–420, February 1980. [DOI], [ADS].
- (7) E. Komatsu and U. Seljak. The Sunyaev-Zel’dovich angular power spectrum as a probe of cosmological parameters. MNRAS, 336(4):1256–1270, November 2002. arXiv:astro-ph/0205468, [DOI], [ADS].
- (8) Neelima Sehgal, Paul Bode, Sudeep Das, Carlos Hernandez-Monteagudo, Kevin Huffenberger, Yen-Ting Lin, Jeremiah P. Ostriker, and Hy Trac. Simulations of the Microwave Sky. ApJ, 709(2):920–936, February 2010. arXiv:0908.0540, [DOI], [ADS].
- (9) Andrei Gruzinov and Wayne Hu. Secondary Cosmic Microwave Background Anisotropies in a Universe Reionized in Patches. ApJ, 508(2):435–439, December 1998. arXiv:astro-ph/9803188, [DOI], [ADS].
- (10) M. Birkinshaw. The Sunyaev-Zel’dovich effect. Physics Reports, 310(2-3):97–195, March 1999. arXiv:astro-ph/9808050, [DOI], [ADS].
- (11) T. Mroczkowski et al. Astrophysics with the Spatially and Spectrally Resolved Sunyaev-Zeldovich Effects. A Millimetre/Submillimetre Probe of the Warm and Hot Universe. Space Sci Rev, 215(1):17, February 2019. arXiv:1811.02310, [DOI], [ADS].
- (12) D. J. Fixsen et. al. The Cosmic Microwave Background Spectrum from the Full COBE FIRAS Data Set. ApJ, 473:576, December 1996. arXiv:astro-ph/9605054, [DOI], [ADS].
- (13) Naoki Itoh, Yasuharu Kohyama, and Satoshi Nozawa. Relativistic Corrections to the Sunyaev-Zeldovich Effect for Clusters of Galaxies. ApJ, 502(1):7–15, July 1998. arXiv:astro-ph/9712289, [DOI], [ADS].
- (14) A. Challinor and A. Lasenby. Relativistic Corrections to the Sunyaev-Zeldovich Effect. ApJ, 499:1–+, May 1998. arXiv:arXiv:astro-ph/9711161, [DOI], [ADS].
- (15) S. Y. Sazonov and R. A. Sunyaev. Cosmic Microwave Background Radiation in the Direction of a Moving Cluster of Galaxies with Hot Gas: Relativistic Corrections. ApJ, 508(1):1–5, November 1998. [DOI], [ADS].
- (16) Jens Chluba, Daisuke Nagai, Sergey Sazonov, and Kaylea Nelson. A fast and accurate method for computing the Sunyaev-Zel’dovich signal of hot galaxy clusters. MNRAS, 426(1):510–530, October 2012. arXiv:1205.5778, [DOI], [ADS].
- (17) T. A. Enßlin and C. R. Kaiser. Comptonization of the cosmic microwave background by relativistic plasma. A&A, 360:417–430, August 2000. arXiv:astro-ph/0001429, [ADS].
- (18) S. Colafrancesco. SZ effect from radio-galaxy lobes: astrophysical and cosmological relevance. MNRAS, 385(4):2041–2048, April 2008. arXiv:0801.4535, [DOI], [ADS].
- (19) Alina Sabyr, J. Colin Hill, and Boris Bolliet. Inverse-Compton scattering of the cosmic infrared background. Phys.Rev.D, 106(2):023529, July 2022. arXiv:2202.02275, [DOI], [ADS].
- (20) Sandeep Kumar Acharya and Jens Chluba. Importance of intracluster scattering and relativistic corrections from tSZ effect with cosmic infrared background. MNRAS, 519(2):2138–2154, February 2023. arXiv:2205.00857, [DOI], [ADS].
- (21) Gilbert Holder and Jens Chluba. The radio SZ effect as a probe of the cosmological radio background. arXiv e-prints, page arXiv:2110.08373, October 2021. arXiv:2110.08373, [ADS].
- (22) James E. Felten and Martin J. Rees. Cosmological Implications of the Diffuse X-Ray Background. Nature, 221(5184):924–926, March 1969. [DOI], [ADS].
- (23) P. A. G. Scheuer. Models of extragalactic radio sources with a continuous energy supply from a central object. MNRAS, 166:513–528, March 1974. [DOI], [ADS].
- (24) Mitchell C. Begelman and Denis F. Cioffi. Overpressured Cocoons in Extragalactic Radio Sources. ApJL, 345:L21, October 1989. [DOI], [ADS].
- (25) Biman B. Nath. Intergalactic matter and cocoons of radio galaxies. MNRAS, 274(1):208–212, May 1995. arXiv:astro-ph/9412010, [DOI], [ADS].
- (26) Fabio Zandanel, Christoph Pfrommer, and Francisco Prada. On the physics of radio haloes in galaxy clusters: scaling relations and luminosity functions. MNRAS, 438(1):124–144, February 2014. arXiv:1311.4795, [DOI], [ADS].
- (27) S. Colafrancesco, P. Marchegiani, P. de Bernardis, and S. Masi. A multi-frequency study of the SZE in giant radio galaxies. A&A, 550:A92, February 2013. arXiv:1211.4809, [DOI], [ADS].
- (28) Naoki Isobe, Makoto S. Tashiro, Poshak Gandhi, Asami Hayato, Hiroshi Nagai, Kazuhiro Hada, Hiromi Seta, and Keiko Matsuta. Suzaku Observation of the Giant Radio Galaxy 3C 326. ApJ, 706(1):454–463, November 2009. arXiv:0910.2467, [DOI], [ADS].
- (29) George R. Blumenthal and Robert J. Gould. Bremsstrahlung, Synchrotron Radiation, and Compton Scattering of High-Energy Electrons Traversing Dilute Gases. Reviews of Modern Physics, 42(2):237–271, January 1970. [DOI], [ADS].
- (30) CCAT-Prime Collaboration. CCAT-prime Collaboration: Science Goals and Forecasts with Prime-Cam on the Fred Young Submillimeter Telescope. ApJS, 264(1):7, January 2023. arXiv:2107.10364, [DOI], [ADS].
- (31) Planck Collaboration. Planck 2015 results. I. Overview of products and scientific results. A&A, 594:A1, September 2016. arXiv:1502.01582, [DOI], [ADS].
- (32) Abir Sarkar, Jens Chluba, and Elizabeth Lee. Dissecting the Compton scattering kernel I: Isotropic media. MNRAS, 490(3):3705–3726, December 2019. arXiv:1905.00868, [DOI], [ADS].
- (33) E. L. Wright. Distortion of the microwave background by a hot intergalactic medium. ApJ, 232:348–351, September 1979. [DOI], [ADS].
- (34) R. Fabbri. Spectrum of the Sunyaev-Zel’dovich effect for high electron temperatures. ApSS, 77:529–537, July 1981. [DOI], [ADS].
- (35) Y. Rephaeli. Cosmic microwave background comptonization by hot intracluster gas. ApJ, 445:33–36, May 1995. [DOI], [ADS].
- (36) S. Y. Sazonov and R. A. Sunyaev. Cosmic Microwave Background Radiation in the Direction of a Moving Cluster of Galaxies with Hot Gas: Relativistic Corrections. ApJ, 508:1–5, November 1998. [DOI], [ADS].
- (37) N. Itoh, Y. Kohyama, and S. Nozawa. Relativistic Corrections to the Sunyaev-Zeldovich Effect for Clusters of Galaxies. ApJ, 502:7–+, July 1998. arXiv:arXiv:astro-ph/9712289, [DOI], [ADS].
- (38) Mathieu Remazeilles, Boris Bolliet, Aditya Rotti, and Jens Chluba. Can we neglect relativistic temperature corrections in the Planck thermal SZ analysis? MNRAS, 483(3):3459–3464, March 2019. arXiv:1809.09666, [DOI], [ADS].
- (39) J. H. Croston, M. J. Hardcastle, D. E. Harris, E. Belsole, M. Birkinshaw, and D. M. Worrall. An X-Ray Study of Magnetic Field Strengths and Particle Content in the Lobes of FR II Radio Sources. ApJ, 626(2):733–747, June 2005. arXiv:astro-ph/0503203, [DOI], [ADS].
- (40) K. M. Górski, E. Hivon, A. J. Banday, B. D. Wandelt, F. K. Hansen, M. Reinecke, and M. Bartelmann. HEALPix: A Framework for High-Resolution Discretization and Fast Analysis of Data Distributed on the Sphere. ApJ, 622(2):759–771, April 2005. arXiv:astro-ph/0409513, [DOI], [ADS].
- (41) M. G. Haehnelt and M. Tegmark. Using the Kinematic Sunyaev-Zeldovich effect to determine the peculiar velocities of clusters of galaxies. MNRAS, 279:545, March 1996. arXiv:astro-ph/9507077, [DOI], [ADS].
- (42) D. Herranz, J. L. Sanz, M. P. Hobson, R. B. Barreiro, J. M. Diego, E. Martínez-González, and A. N. Lasenby. Filtering techniques for the detection of Sunyaev-Zel’dovich clusters ¡br/¿ in multifrequency maps. MNRAS, 336(4):1057–1068, November 2002. arXiv:astro-ph/0203486, [DOI], [ADS].
- (43) J. B. Melin, J. G. Bartlett, and J. Delabrouille. Catalog extraction in SZ cluster surveys: a matched filter approach. A&A, 459(2):341–352, November 2006. arXiv:astro-ph/0602424, [DOI], [ADS].
- (44) Bjoern Soergel, Tommaso Giannantonio, George Efstathiou, Ewald Puchwein, and Debora Sijacki. Constraints on AGN feedback from its Sunyaev-Zel’dovich imprint on the cosmic background radiation. MNRAS, 468(1):577–596, June 2017. arXiv:1612.06296, [DOI], [ADS].
- (45) Jens Erler, Kaustuv Basu, Jens Chluba, and Frank Bertoldi. Planck’s view on the spectrum of the Sunyaev-Zeldovich effect. MNRAS, 476(3):3360–3381, May 2018. arXiv:1709.01187, [DOI], [ADS].
- (46) Íñigo Zubeldia, Aditya Rotti, Jens Chluba, and Richard Battye. Galaxy cluster SZ detection with unbiased noise estimation: an iterative approach. MNRAS, 522(3):4766–4780, July 2023. arXiv:2204.13780, [DOI], [ADS].
- (47) Planck Collaboration. Planck 2013 results. XXI. Power spectrum and high-order statistics of the Planck all-sky Compton parameter map. A&A, 571:A21, November 2014. arXiv:1303.5081, [DOI], [ADS].
- (48) Wayne Hu and Andrey V. Kravtsov. Sample Variance Considerations for Cluster Surveys. ApJ, 584(2):702–715, February 2003. arXiv:astro-ph/0203169, [DOI], [ADS].
- (49) Alan R. Duffy, Joop Schaye, Scott T. Kay, and Claudio Dalla Vecchia. Dark matter halo concentrations in the Wilkinson Microwave Anisotropy Probe year 5 cosmology. MNRAS, 390(1):L64–L68, October 2008. arXiv:0804.2486, [DOI], [ADS].
- (50) Planck Collaboration. Planck 2013 results. XXX. Cosmic infrared background measurements and implications for star formation. A&A, 571:A30, November 2014. arXiv:1309.0382, [DOI], [ADS].
- (51) Cien Shang, Zoltán. Haiman, Lloyd Knox, and S. Peng Oh. Improved models for cosmic infrared background anisotropies: new constraints on the infrared galaxy population. MNRAS, 421(4):2832–2845, April 2012. arXiv:1109.1522, [DOI], [ADS].
- (52) Fiona McCarthy and Mathew S. Madhavacheril. Improving models of the cosmic infrared background using CMB lensing mass maps. Phys.Rev.D, 103(10):103515, May 2021. arXiv:2010.16405, [DOI], [ADS].
- (53) P. Ade et al. The Simons Observatory: science goals and forecasts. JCAP, 2019(2):056, February 2019. arXiv:1808.07445, [DOI], [ADS].
- (54) Neelima Sehgal et. al. CMB-HD: An Ultra-Deep, High-Resolution Millimeter-Wave Survey Over Half the Sky. In Bulletin of the American Astronomical Society, volume 51, page 6, September 2019. arXiv:1906.10134, [ADS].
- (55) A. Merloni, P. Predehl, W. Becker, H. Böhringer, T. Boller, H. Brunner, M. Brusa, K. Dennerl, M. Freyberg, P. Friedrich, A. Georgakakis, F. Haberl, G. Hasinger, N. Meidinger, J. Mohr, K. Nandra, A. Rau, T. H. Reiprich, J. Robrade, M. Salvato, A. Santangelo, M. Sasaki, A. Schwope, J. Wilms, and the German eROSITA Consortium. eROSITA Science Book: Mapping the Structure of the Energetic Universe. arXiv e-prints, page arXiv:1209.3114, September 2012. arXiv:1209.3114, [DOI], [ADS].