?reference?
Beyond Automated Evaluation Metrics: Evaluating Topic Models On Practical Social Science Content Analysis Tasks
Abstract
Topic models are a popular tool for understanding text collections, but their evaluation has been a point of contention. Automated evaluation metrics such as coherence are often used, however, their validity has been questioned for neural topic models (ntms) and can overlook a model’s benefits in real-world applications. To this end, we conduct the first evaluation of neural, supervised and classical topic models in an interactive task-based setting. We combine topic models with a classifier and test their ability to help humans conduct content analysis and document annotation. From simulated, real user and expert pilot studies, the Contextual Neural Topic Model does the best on cluster evaluation metrics and human evaluations; however, lda is competitive with two other ntms under our simulated experiment and user study results, contrary to what coherence scores suggest. We show that current automated metrics do not provide a complete picture of topic modeling capabilities, but the right choice of ntms can be better than classical models on practical tasks.
1 Introduction
Establishing a label set to organize a collection of documents is a fundamental task in many fields such as social science, linguistics, education, and bioinformatics Liu et al. (2016); Paul and Girju (2009). For example, in the social sciences, grounded theory emphasizes structural coding as a framework for discovering similarities and differences in large-scale experimental data and assigning meaning to it Glaser and Strauss (2017); Lindstedt (2019); Krommyda et al. (2021). Such a process is difficult and time-consuming, partly because it requires a global understanding of the entire dataset, and local knowledge to accurately label individual documents.
Topic modeling Boyd-Graber et al. (2017) has emerged as a popular tool to help with the coding process (Section 2.4). These models treat documents as mixtures of latent topics, each represented by a distribution over words. The most popular topic model, Latent Dirichlet Allocation (lda) Blei et al. (2003) has over 40,000 citations with numerous extensions and variants Churchill and Singh (2022).
Prior research has demonstrated the effectiveness of combining lda with an active learning classifier to help people create label sets more efficiently Poursabzi-Sangdeh et al. (2016): topic models provide a global overview of the data, exposing the broad themes of the corpus that help with creating a label set; active learning selects documents that direct the annotator’s attention to topically distinct examples to label, and train the classifier more efficiently.
However, a gap remains in the literature, given recent advancements in topic modeling. Neural topic models (ntm), which use continuous text embeddings to capture contextual and semantic relationships in high-dimensional data, have gained prominence, outperforming classical topic models on automatic evaluation metrics, such as coherence Aletras and Stevenson (2013). However, automated evaluation metrics have been called into question, and do not necessarily correlate with human ratings on topic model outputs Hoyle et al. (2021b). There is a lack of work assessing neural models on their practical applications, such as helping people conduct content analysis.
We aim to fill this gap, and evaluate the effectiveness of neural, supervised, and classical topic models to help social scientists with content analysis and label set creation. Specifically, we introduce Topic Enabled Neural Organization and Recommendation system (tenor), an interactive tool that supports various topic models with active learning for speeding up the process of content analysis.111https://github.com/zli12321/TENOR.git We conduct synthetic experiment on lda, supervise lda and three ntms with followup user study and expert user study and show that the choice of Contextualized Topic Model Bianchi et al. (2021) (ctm) help users create higher quality label sets than using classical lda, as measured by both cluster metrics (Section 4.5) and user ratings. However, lda is still competitive or better with two other popular ntms. Thus we show that thoughtfully using topic models as part of a larger system with human interactions gives a more comprehensive evaluation and understanding of their real-world usage (Section 4.5).
2 Background
Manually sorting thousands of documents to establish a label set to create is mentally challenging and time-consuming. Baumer et al. (2017) compare grounded theory with topic modeling, and show that although the two methods are from distinct fields, they produce similar insights on large-scale data. Topic models cluster documents and extract meaningful themes and can help people figure out basic categories of labels.
For the task of content analysis, the current machine learning and nlp literature mainly focuses on the development ntms Hoyle et al. (2021b), because they are winning nearly every automatic coherence metric. However, most of the computational social science community remains focused on older probabilistic models Abdelrazek et al. (2023) due to ntms more complex architecture. Thus, we explore this open question: should we use classical or neural topic models for label induction and content analysis?
One of the reasons that ntms might be better is that alto showed the benefits of active learning Settles (2012): start with a dataset with an undefined label set; users add labels to the set by going through individual documents (guided by topic overviews); once the users establish at least two distinct labels for the label set, a classifier trained on the labeled documents can help point users to documents that are either difficult for the current label set or that might require new labels. One of the criticisms of neural topic models is that they are too granular and specific, but this may be a boon for label induction: it can find candidates for a new label.
In addition to ignoring neural models (which had not reached maturity), another lacuna of (Poursabzi-Sangdeh et al., 2016) is that it ignores supervised topic models that can combine classification with topics. Supervised models Mcauliffe and Blei (2007) change as labels are added and can capture—for instance—when a user associates two labels with a topic. Thus we evaluate neural and classical topic models that tasks humans with creating a label set and annotating a document collection, with the assistance of topic models and a text classifier on the Bills dataset.222http://www.congressionalbills.org We delve into specific topic models, active learning, evaluation metrics for the rest of this section.
2.1 Topic Models
Topic models identify latent themes within a corpus, providing a snapshot of its overall narrative. Given a set of documents and a specified topic count , these models divide documents into clusters. Each cluster represents a topic defined by key terms, denoting its core theme. Examples from various models are in Appendix 3. Users can explore the corpus’s main themes and label individual documents with the topics and keywords.
Supervised Latent Dirichlet Allocation
slda retains the generative process inherent to lda, but also introduces an additional step to generate labels for each document given its distribution over topic assignments in a document. For example, for movie comment reviews, lda generates general topics people discuss from the reviews that we have no control with slda can align user star ratings with topics in the generative process, where we can easily analyze topics for each star rating level. We use the classifier’s predictions as surrogate response variables, and updates slda constantly as users label more documents in our study. We expect slda generates topics that are more related to the user inputs by interacting with the classifier trained with user input labels.
Neural Topic Models
Current popular neural topic models include Contexualized topic models (Bianchi et al., 2021, ctm), Bertopic Grootendorst (2022), and Embedded topic model (Dieng et al., 2020, etm). Theses neural models takes advantage of pre-trained word embeddings with rich contextual information to enhance the quality of discovered topics. ctm leverages pre-trained language models like sbert Reimers and Gurevych (2019) to generate sentence embeddings concatenated with Bag-of-Word (BoW) representation of documents, and run a variational autoencoder (vae) on the representation, while Bertopic uses umap McInnes et al. (2020) and hdbscan McInnes et al. (2017) create and refine topics from encoded word embeddings. etm is retains the same generative process as lda but the topics are learned from word embeddings that contain rich semantic meanings instead of pure word distributions.
2.2 Active Learning
Active learning Settles (2012) guides users’ attention to examples that would be the most beneficial to label for a classifier, using techniques such as uncertainty sampling. By directing users to annotate uncertain documents first, active learning is valuable in situations constrained by time or budget.
2.3 Preference Functions
During the initial stages of training, it is crucial for a classifier to generalize to unseen data quickly. A rapid improvement facilitates high-quality data analysis and optimizes time and costs, especially for large datasets Dasgupta and Hsu (2008). We use preference functions to achieve this early rapid gain of classifier generalization to the rest of the datasets so users can take advantage of tenor early in their tool usage.
A preference function uses uncertainty sampling to pick the most beneficial document and guide users’ local attention to that document to label. According to the preference function, the classifier favors documents with the highest confusion scores. For our baseline classifier, when it does not incorporate topic models, the preference function for a document is:
| (1) |
Here, represents the cross-entropy Mao et al. (2023) of the classifier. This approach ensures that the classifier consistently prioritizes the most informative documents to present to the user for labeling. The preference function also incorporates vector representation of topic models and users’ feedback to match their individual preferences Zhang et al. (2019).
When incorporating topic models and active learning, the preference function is topic-dependent, which involves a sequential decision-making process: first, the most confusing topic by the classifier is selected, and then, within this topic, the document with the highest preference function score (the most confusing document) is chosen.
Given topics from topic models, each document is characterized by a specific topic distribution, denoted by . For a particular document, its predominant topic is:
| (2) |
We also adopt hierarchical sampling for active learning Dasgupta and Hsu (2008) to flat topic, with the preference function
| (3) |
With a clearly defined preference function, we choose a topic first based on the following criterion: Given topics, let denote the set of all documents that are most prominently associated with topic . The classifier selects a topic such that its documents’ median preference score, , is maximized. Formally, this is
| (4) |
2.4 Evaluation Metrics
Our objective is for users to establish new label sets for a common dataset. In crowdsourcing scenarios, comparing the accuracy of labels generated by different users without a predefined label set becomes impossible Kleinberg (2002). We use three clustering metrics to evaluate the concordance between the labels predicted by the classifier trained on user input labels and the gold standard labels for a fair comparison. Besides standard cluster evaluation metrics, we also measure the coherence for each topic of lda, slda, ntms. More details of the metrics are in Appendix A.
Purity
Purity evaluates how pure an induced cluster is: in other words, what proportion of documents are placed in a cluster that is not commingled with documents with another gold label Zhao (2005). As we will see with many of the clustering metrics, there is a clear failure mode: the purity metric can be easily manipulated by assigning a unique label to each document. We mitigate this risk by not disclosing these metrics to labelers and limiting the time users have to create labels.
Adjusted Normalized Mutual Information (ANMI)
Normalized Mutual Information (Strehl and Ghosh, 2003, nmi) assesses clustering quality by measuring the interdependence between true and predicted labels. One can gain insights into the other by understanding one set of labels. The ANMI Amelio and Pizzuti (2016), an enhancement of NMI, corrects for the chance alignment of clusters.
Adjusted Rand Index (ARI)
The Rand Index (RI)(Rand, 1971, ri) measures the similarity between two clusters by evaluating the agreement between them. Specifically, it counts all sample pairs and note pairs that are either grouped or separated in both clusters. The Adjusted Rand Index (ARI) (Sundqvist et al., 2022, ari) refines this measure. While RI gauges basic agreement, ARI accounts for and corrects any random cluster agreement, providing a more accurate similarity assessment.
Coherence
Normalized pointwise mutual information (npmi) measures how semantically similar the top words of a topic are, which came up for classical topic models, but can also be used for ntms Aletras and Stevenson (2013).333npmi and anmi are over different evaluation metrics over different probability spaces. Theoretically, a higher npmi indicates that the keywords of a topic are more cohesive and easier to interpret. We use npmi to evaluate the quality of individual topics generated by topic models.
The clustering metrics evaluate the alignment, quality, and information overlap between two clusters. A higher value in these metrics indicates greater similarity and alignment between the clusters. However, using just one of them to measure user label quality has limitations. If users assign every document a different label, they will reach a perfect purity score, but that violates the task. ari does not measure the quality of individual clusters. For example, two clusters might have high ari, but both are very poor quality. anmi is sensitive to the number of clusters, where a significant difference in the number of clusters between the standard cluster and classifier predictions can lead to a reasonable anmi score, but the clusters have a high mismatch. By using all of them to complement each other, we are more confident in comparing the quality of classifier predictions.
3 Study Setup
3.1 Groups
For the simulated user study, we use the following models: {enumerate*}
Active Learning only–(none);
Active Learning, lda–(lda)
Active Learning, slda–(slda)
Active Learning, Bertopic–(Bertopic)
Active Learning, Embedded Topic Model–(etm)
Active Learning, Contextualized Topic Model–(ctm)
Our baseline (1) gives users access to a classifier with active learning, but no topic model to verify the benefit of having a topic model in helping users create labels.
3.2 Dataset
Our simulated experiment uses the 20newsgroups Mitchell (1999) and the Congressional bills dataset. Both datasets have hierarchical labels; the first level is a general category, such as Health, Education for the Bills, and rec, sci for 20newsgroups. Under each of the first layer labels, there are more specific labels; for example, under Health, there are Health Insurance, Mental Health and Cognitive Capacities, Children and Prenatal Care, etc.
Since we want to test our system theoretically and in a user study setting, having datasets with hierarchical labels enables us to use more specific labels as user input labels and more general labels as standard labels in simulated experiments. In real-world settings, users are more likely to make more specific labels that are more closely related to the contents of individual documents.
3.3 Simulated Experiment
Before conducting a real-world user study, we run simulated experiments on both datasets. We choose topics for all five topic models.444We choose because it optimizes average coherence for all topic models. Training details and hyperparameter selections are in Appendix B Since users are more likely to create more detailed labels for each document, we use sub-labels as pseudo-user labels, while using the more general labels as our gold standard. We use logistic regression as our classifier and unigram tf-idf as input features for the classifier.555Using sentence transformer features produces similar results but takes much longer to update We also concatenate topic probability distributions for all the documents with tf-idf features, which encodes topic information to the classifier for groups with topic models. We use incremental leaning Rosenblatt (1958) to fit and update the classifier for every document labeled.666There are two exceptions we reinitialize the classifier: we reinitialize the classifier and train it with labeled documents if a new label class is introduced to the classifier; if slda is updated with surrogate response variables, we rebuild the features by concatenating tf-idf features with new topic information. The clustering quality is assessed by the classifier’s predictions with the more general labels using the three evaluation metrics. We run the experiment for 400 documents since we expect it to be the maximum for a participant to label within an hour.
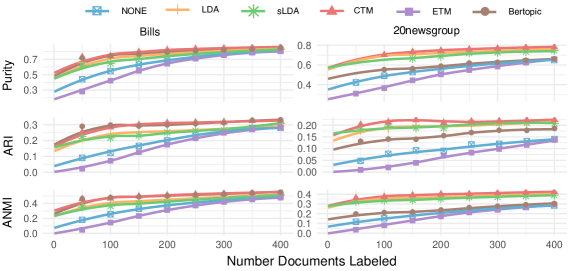
Coherence and simulated experiment results do not have a direct relationship
Figure 1 shows that ctm does the best on all cluster metrics on both datasets, while lda and slda remain competitive with other ntms. Although Table 1 shows that all ntms have higher npmi coherence than lda, with etm has the highest coherence followed by Bertopic and ctm, the simulated experiment show opposite results than coherence ranking, with etm does the worst among all the groups and ctm does the best, where lda and slda are even better than Bertopic and etm on the 20newsgroup dataset.
| lda | sLDA | ctm | etm | Bertopic |
| 0.07 | 0.09 | 0.09 | 0.21 | 0.15 |
Our simple simulated experiments serve as a reliable proxy for the user study. However, relying solely on automated evaluation metrics does not capture how much the users find the topic model helpful in helping them conduct content analysis. Our user study investigates this question and surveys users’ ratings on how they find topic models useful.
4 User Study
We conduct a general user study and expert study to compare topic models in the rest of the paper. For the general user study, we use (1), (2), (3), and (6) since ctm is the best-performing neural model in the simulated experiment. We use the Bills dataset to conduct a 60-user study with our interface, with 15 people in each group. Our Bills dataset contains selected topics that are easy enough for the general public, thus our general user study does not require user expertise in the social science field, and we care more about the overall user experience and cluster results while users are using the tool. We then run followup expert study on an expert dataset, where the experts are familiar with the topics in the dataset with the best two models from our user study results. The goal of the expert study is to ensure that our user study results can generalize to experts, where all the participants have similar backgrounds in a dataset.
4.1 User Study Interface
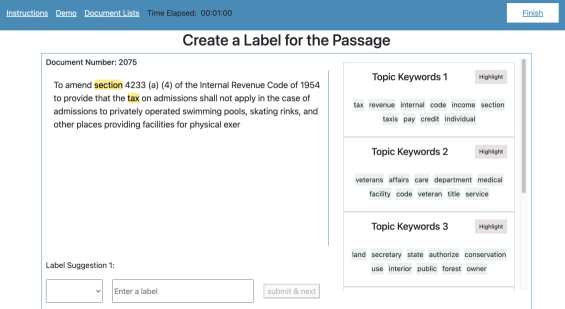
For the groups using topic models, users are shown documents grouped by their top topic, with topic keywords. The document selected by the active learning preference function is highlighted and displayed both at the top of its topic and at the top of the interface. When users click a document, they are presented with its full text, label options, top 5 topics, and top 10 keywords per topic. Words above a 0.05 threshold in the primary topic are highlighted. In none group, users see unsorted documents with the recommended one at the top. Clicking a document shows only its content, without topic keywords or highlights. Detailed interface information is in Appendix E.
4.2 Participant Recruitment
We sourced participants via Prolific, restricting our selection to individuals from the US with an approval rate exceeding and at least ten previous submissions. Participants were randomly assigned to one of four groups, each accommodating a maximum of 15 participants.777We use the same trained models from the simulated experiment. We update slda in the backend once the previous training is complete. Participants first reviewed the task instructions and underwent a brief tutorial to familiarize themselves with the process. They then engaged in a one-hour user study session. After completing the session, participants were redirected to a follow-up survey to receive a 20-dollar compensation.
4.3 Cluster Quality Evaluation Metrics
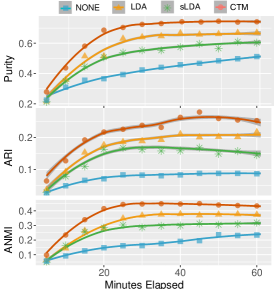
We record the purity, ari, and anmi for every minute passed during each session. For each group, we plot the median of each metric for every minute passed (Figure 2).
Topic model groups do better than none
Throughout the 60-minute study session, the classifier has a wide gap between groups with topic models and none. Topic model groups have faster early gains on all three metrics than none.
ctm does the best on cluster metrics, followed by ctm, slda, and none.
In real-world user applications, ctm still demonstrates advantage on classification. The classifier with neural topic probability features, trained on user input labels, can generalize unseen data better than classical generative topic probability features. Although ctm is the best, having the classifier have access to topic model features is better for the classifier to generalize and predict unseen data than not having access to them in our user study. We later manually evaluate the validity of the user labels by random sampling with details in Appendix D.
slda performs worse on cluster metrics compared to lda and ctm
This could be partly attributed to inaccuracies present in the classifier’s predictions on the dataset. For instance, when a user labels 30 documents midway through the session, the classifier, in turn, predicts labels for the entire dataset. However, if the classifier only has a few training examples, and the quality of labels is low, using its predictions as response variables to train slda to generate document topic probability as features can confuse the classifier. Nonetheless, slda can align certain topics with user intent labels, which means that slda might be capable of generating topic keywords that are semantically similar to user labels, thus improving users’ overall experience. Subsequent survey analyses will investigate whether slda substantiates this hypothesis in user survey ratings.
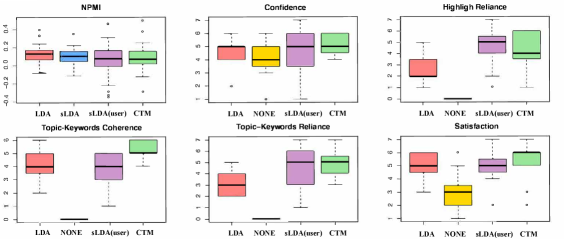
Examining coherence, quality of document clusters, and quality of topic keywords
We go through the topics with top 2, middle 2, and bottom 2 coherence scores for the models we use for user study (including slda trained on user labels), and show the npmi, topic keywords, and a randomly selected passage from the topic in Table 3 and 5.888We load the saved slda model trained on user labels predicted by the classifier at the end of the session, we call it slda(user). Although the coherence scores vary for different topics, the top keywords are representative of the documents. Figure 4 shows a low median coherence score does not necessarily show lower median user ratings. ctm has the highest top coherence scores but the median coherence score is lower than slda and lda. However, ctm still does the better on clustering evaluations and user ratings.
4.4 User Ratings
Our survey comprises five questions aimed at gauging user judgment and evaluating topic models, using a scale ranging from 1 to 7. 999Confidence asks how confident the users feel about their created labels. Highlight Reliance asks how much the users rely on the highlight functionality to make labels. Topic-Keywords Coherence asks whether users find the topic keywords coherent while they explore topics and peruse keywords to assist them in label creation. Topic-keyword Dependence investigates the frequency at which users consult the most related topic keywords while creating labels for documents. Satisfaction assesses the users’ overall satisfaction with the tool, exploring whether users find the tool likable and helpful.
ctm and slda users rely more on topic model features with more confidence than lda users on average
Figure 4, the second to sixth plot show a summary of users’ ratings for question 1 to 5. The median of user ratings on ctm and slda are similar for most of the questions except for Topic-Keyword Coherence, which slda falls short. Based on the median user ratings, users generally rely more on topic keywords and highlights to create labels for documents if they are assigned to ctm or slda group. Users also rate the topic keywords they use to label documents as more coherent for ctm and slda. Although the classifier in slda falls short on the three cluster metrics among the three topic models, users generally have better overall experience with slda than lda users.
Although lda’s topics have higher median coherence scores, overall users’ median ratings are lower
First plot in figure 4 shows the coherence of all 35 topics for lda, slda, ctm, and slda trained on user labels. Although the top topics for ctm, slda and slda(user) have higher coherence scores than lda does, lda’s coherence scores are quite tight in the boxplot and lda has higher median coherence than the other two models. slda(user) has diverse coherence scores for its topics. However, when looking at the median user rating of all the five questions, lda does not show any better advantage than ctm and slda. The result supports the claim that there is not a strong and direct relationship between coherence and human usability and reliance on topic models when topic models are used to do general dataset exploration and label set establishment, where users focus on individual documents to create labels.
Different topic models, different purposes
We run ANOVA Fisher (1935) and Posthoc-test Turkey-Kramer for pairwise comparison between ratings of any two of the user groups. Users are less likely to rely on the topic keywords generated by lda to label documents, compared to ctm and slda based on significance results in table 2 because lda generates too general topic keywords that are less useful to label individual documents. For specific tasks, such as label set establishment and tasks involving understanding individual documents, ctm is a better choice.
ctm is good at task-based applications
We see an improvement of clustering metrics using ctm, as well as overall higher user preference ratings over the classical topic models in the label set creation task. Although there has been a debate on ntms producing less interpretable topics, under the correct choice of ntms, we do not see a significant difference in user ratings between ntm and the classical topic models except for Topic-Keyword Reliance, where users seem to prefer ntms’ topic keywords to make labels for documents.
| Metric | p-Value | Significant Pair |
|---|---|---|
| Confidence | 0.327 | None |
| HighlightReliance | 0.035 | slda vs. lda |
| topicCoherence | 0.017 | ctm vs. slda |
| topicReliance | 0.034 | ctm vs. lda |
| satisfaction | 0.002 | none vs. Other 3 |
4.5 Expert Verification
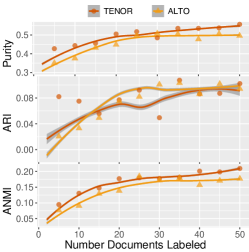
We conduct followup expert studies using lda and ctm, which are the two winning conditions in our general user study on 6 experts. The experts all hold at least a graduate degree in community resilience related field that focuses on assisting communities and stakeholders on issues related to anticipated hazards conditions, disaster preparedness, and issues related to buildings and the interdependencies of physical infrastructure systems.101010https://www.nist.gov/community-resilience We use the same user interface described in Section 4.1 with the given expert dataset on 800 documents. The dataset is related to community resilience topics and also have hierarchical labels created by multiple experts using Cohen’s Kappa agreement McHugh (2012) over a six-month period. Figure 4 shows that ctm is still better than lda on two out of three clustering metrics, and similar ari at the 50th document labeled when the users have similar expertise on the dataset.
Experts rely less on topic keywords to label documents but still finds the tool convenient and useful
Since all the experts are quite familiar with the topics in the dataset, one expert using lda mentions that the topic keywords are not helpful but the highlighted texts are more helpful for individual document annotation. lda produces topics that are too general that experts already familiar with while the more specific keywords from ctm are a better choice for experts to read and for classification.
5 Related Work
Applications of topic models are important, as exemplified by previous work by Fang et al Fang et al. (2023), which addresses the human-centric applications of topic models. (Bakharia et al., 2016) shows that interactive topic models have gained traction among social science researchers and data analysts. Nevertheless, classical topic models dominate most applications in social science research Boyd-Graber et al. (2017); Lin (2009). Despite their theoretical advantages, this persistent preference for classical models underscores the need for comprehensive studies on the practical utility of ntms.
As one of the most popular topic models, lda has been widely applied and tested in various fields, such as health area Paul and Dredze (2011), political opinion analysis Chen et al. (2010), social media data analysis Zhao et al. (2011), etc. Since there is already tons of work using lda on human applications, lda has shown to be an effective topic model for real applications.
Most of the work has explored slda’s power to predict response variables for texts and documents Xu and Eguchi (2022). Few works have studied using slda to align topics with user intent labels to establish label sets for documents. Using slda interactively for document recommendation and annotation is more intuitive and straightforward than using unsupervised classical lda.
Besides slda, the recent popularity of neural networks leads to the popularity of doing topic modeling with them. ntms have gained popularity in machine learning research with over a hundred invariants Zhao et al. (2021). So far, the evaluation of ntms is mainly based on topic coherence, topic diversity, and classification applications Zhao et al. (2021). The major framework of ntms are mostly sequential ntms, which leverages the architecture power of Recurrent Neural Network (rnn); ntms with pre-trained language models, such as bert, that already learns the semantic relationship and association of words from a large corpus of texts. ntms have the advantage of producing higher automatic evaluation scores, and classification abilities, along with other more extensive applications that classical topic models cannot do, which includes texts generation Tang et al. (2019); Wang et al. (2019), summarization Zhao et al. (2020); Wang et al. (2020).
However, with the new popularity of ntms, to the best of our knowledge, there are still few works using ntms for social science, medical areas, or political opinion analysis, due to their complex architecture and more computing resource demanding. Our work examines this gap to study the trade-off between using neural, supervised, or classical topic models. While some recent studies have compared ntm and lda with human analysis of the topic outputs, they still predominantly rely on automatic evaluation metrics Papadia et al. (2023), with limited emphasis on analyzing the quality of models from a human perspective or task-based utility of topic models. These studies concluded that lda outperforms ntm in metrics such as diversity Dieng et al. (2019), similarity Webber et al. (2010), coherenceRöder et al. (2015), and classification Phan et al. (2008). However, these conclusions are for non-English datasets. Our research intends to bridge this gap by conducting an English-language topic model quality evaluation, incorporating human interaction to help content analysis.
Our approach differs from previous studies, which compares ntms and classical models’ stability and alignment with stationary, pre-determined ground truth labels Hoyle et al. (2021a). In the former, lda was better; in the latter, lda was better than many ntms Hoyle et al. (2021b). However, Hoyle et al. (2021a)’s approaches only evaluate topic models by analyzing human ratings on topic keywords or topic keywords with labels without any task applications. In contrast, our method also incorporates general and expert users’ preferences on using topic keywords to comprehend and categorize individual documents.
6 Conclusion
We provide an interactive task-based evaluation of neural, supervised, and classical topic models, using the task of content analysis and label set creation. Using ctm with an active learning classifier helps both expert and non-expert annotators produce higher quality label sets more quickly, according to cluster metrics and human ratings, validating that the right choice of ntms can be better than lda for content analysis. However, lda is still competitive with two other ntms, contrary to what coherence scores would suggest. We show that current automated metrics do not provide a complete picture of topic modeling capabilities, but the right choice of ntms can still be better than classical models on practical tasks. Future work can include exploring more effective ways to use topic models for content analysis, where experts use tenor to conduct the coding process and answer their research questions.
7 Limitations
We provide a human-in-the-loop framework to evaluate topic models, extending beyond automated evaluation metrics. Yet, our experiment only focuses on a very narrow and specific task to evaluate topic models. In addition, although our work shows that the right choice of ntm can bee more powerful than lda for specific tasks, the debate about evaluation of topic models is still present. From a language perspective, our experiments are based on English dataset only. Our conclusions theoretically can be generalized to some other languages but need to be practically tested. It might come to a different conclusion for languages with completely different structures than English. In addition, given our objective is to create label sets for document collections, we train slda using classifier predictions of the dataset. However, the limited training examples compared to the entire dataset can affect accuracy. This results in lower cluster metrics for slda compared to ctm and lda. A more comprehensive future analysis of slda, using accurate response variables like movie star ratings and human interaction, could solidify the benefits of slda. In addition, our simulated experiment covers three ntms but our general user study only covers the best ntm–ctm. Although the simulated experiments shows that Bertopic and etm can be worse at classification than lda, we have not investigated the user ratings and preferences on other ntms in our paper.
8 Ethics
We received approval from the Institutional Review Board before initiating the user study. All participants are based in the United States. Users are required to review an instruction and consent statement before participation commitment. They have the option to withdraw if they disagree with the terms. Throughout the study, no personal information that could reveal identities is collected. To the best of our knowledge, our study presents no known risks.
9 Acknowledgement
We thank anonymous reviewers and Alexander Hoyle for their insightful comments for helping us make our paper experiments and arguments more solid. We thank Emily Walpole and Juan Fung’s community resilience groups for taking their time participating our expert verification experiment and providing valuable qualitative comments and feedback. Zongxia Li, Andrew Mao, Daniel Stephens, and Pranav Goel’s contributions are supported by the nist Professional Research Experience Program.
References
- Abdelrazek et al. (2023) Aly Abdelrazek, Yomna Eid, Eman Gawish, Walaa Medhat, and Ahmed Hassan. 2023. Topic modeling algorithms and applications: A survey. Information Systems, 112:102131.
- Aletras and Stevenson (2013) Nikolaos Aletras and Mark Stevenson. 2013. Evaluating topic coherence using distributional semantics. In Proceedings of the 10th International Conference on Computational Semantics (IWCS 2013) – Long Papers, pages 13–22, Potsdam, Germany. Association for Computational Linguistics.
- Amelio and Pizzuti (2016) Alessia Amelio and Clara Pizzuti. 2016. Correction for closeness: Adjusting normalized mutual information measure for clustering comparison: Correction for closeness: Adjusting nmi. Computational Intelligence, 33.
- Bakharia et al. (2016) Aneesha Bakharia, Peter Bruza, Jim Watters, Bhuva Narayan, and Laurianne Sitbon. 2016. Interactive topic modeling for aiding qualitative content analysis. In Proceedings of the 2016 ACM on Conference on Human Information Interaction and Retrieval, CHIIR ’16, page 213–222, New York, NY, USA. Association for Computing Machinery.
- Baumer et al. (2017) Eric P. S. Baumer, David Mimno, Shion Guha, Emily Quan, and Geri K. Gay. 2017. Comparing grounded theory and topic modeling: Extreme divergence or unlikely convergence? J. Assoc. Inf. Sci. Technol., 68(6):1397–1410.
- Bianchi et al. (2021) Federico Bianchi, Silvia Terragni, and Dirk Hovy. 2021. Pre-training is a hot topic: Contextualized document embeddings improve topic coherence. In Proceedings of the 59th Annual Meeting of the Association for Computational Linguistics and the 11th International Joint Conference on Natural Language Processing (Volume 2: Short Papers), pages 759–766, Online. Association for Computational Linguistics.
- Blei et al. (2003) David M Blei, Andrew Y Ng, and Michael I Jordan. 2003. Latent dirichlet allocation. Journal of machine Learning research, 3(Jan):993–1022.
- Boyd-Graber et al. (2017) Jordan Boyd-Graber, Yuening Hu, and David Minmo. 2017. Applications of Topic Models. Now Foundations and Trends.
- Chen et al. (2010) Bi Chen, Leilei Zhu, Daniel Kifer, and Dongwon Lee. 2010. What is an opinion about? exploring political standpoints using opinion scoring model. In Proceedings of the Twenty-Fourth AAAI Conference on Artificial Intelligence, AAAI’10, page 1007–1012. AAAI Press.
- Churchill and Singh (2022) Rob Churchill and Lisa Singh. 2022. The evolution of topic modeling. ACM Comput. Surv., 54(10s).
- Dasgupta and Hsu (2008) Sanjoy Dasgupta and Daniel Hsu. 2008. Hierarchical sampling for active learning. In Proceedings of the 25th International Conference on Machine Learning, ICML ’08, page 208–215, New York, NY, USA. Association for Computing Machinery.
- Dieng et al. (2020) Adji B. Dieng, Francisco J. R. Ruiz, and David M. Blei. 2020. Topic modeling in embedding spaces. Transactions of the Association for Computational Linguistics, 8:439–453.
- Dieng et al. (2019) Adji B. Dieng, Francisco JR Ruiz, and David M. Blei. 2019. The dynamic embedded topic model. ArXiv preprint arXiv:1907.05545.
- Fang et al. (2023) Zheng Fang, Lama Alqazlan, Du Liu, Yulan He, and Rob Procter. 2023. A user-centered, interactive, human-in-the-loop topic modelling system.
- Fisher (1935) Ronald A. Fisher. 1935. The Design of Experiments. Oliver and Boyd, Edinburgh.
- Glaser and Strauss (2017) Barney Glaser and Anselm Strauss. 2017. Discovery of grounded theory: Strategies for qualitative research. Routledge.
- Grootendorst (2022) Maarten Grootendorst. 2022. Bertopic: Neural topic modeling with a class-based tf-idf procedure.
- Hoyle et al. (2021a) Alexander Hoyle, Pranav Goel, Andrew Hian-Cheong, Denis Peskov, Jordan Boyd-Graber, and Philip Resnik. 2021a. Is automated topic model evaluation broken? the incoherence of coherence. In Advances in Neural Information Processing Systems, volume 34, pages 2018–2033.
- Hoyle et al. (2021b) Alexander Hoyle, Pranav Goel, Denis Peskov, Andrew Hian-Cheong, Jordan Boyd-Graber, and Ps Resnik. 2021b. Is automated topic model evaluation broken?: The incoherence of coherence.
- Kleinberg (2002) Jon Kleinberg. 2002. An impossibility theorem for clustering. In Advances in Neural Information Processing Systems, volume 15. MIT Press.
- Krommyda et al. (2021) Maria Krommyda, Anastasios Rigos, Kostas Bouklas, and Angelos Amditis. 2021. An experimental analysis of data annotation methodologies for emotion detection in short text posted on social media. Informatics, 8(1).
- Lee (2022) Minchul Lee. 2022. bab2min/tomotopy: 0.12.3.
- Lin (2009) Jimmy Lin. 2009. Is searching full text more effective than searching abstracts? BMC Bioinformatics, 10:46.
- Lindstedt (2019) Nathan C. Lindstedt. 2019. Structural topic modeling for social scientists: A brief case study with social movement studies literature, 2005–2017. Social Currents, 6(4):307–318.
- Liu et al. (2016) L Liu, L Tang, W Dong, S Yao, and W Zhou. 2016. An overview of topic modeling and its current applications in bioinformatics. SpringerPlus, 5(1):1608.
- Mao et al. (2023) Anqi Mao, Mehryar Mohri, and Yutao Zhong. 2023. Cross-entropy loss functions: Theoretical analysis and applications.
- Mcauliffe and Blei (2007) Jon Mcauliffe and David Blei. 2007. Supervised topic models. Advances in neural information processing systems, 20.
- McHugh (2012) Mary L McHugh. 2012. Interrater reliability: the kappa statistic. Biochemia Medica, 22(3):276–282.
- McInnes et al. (2017) Leland McInnes, John Healy, and S. Astels. 2017. hdbscan: Hierarchical density based clustering. J. Open Source Softw., 2:205.
- McInnes et al. (2020) Leland McInnes, John Healy, and James Melville. 2020. Umap: Uniform manifold approximation and projection for dimension reduction.
- Mikolov et al. (2013) Tomas Mikolov, Kai Chen, Gregory S. Corrado, and Jeffrey Dean. 2013. Efficient estimation of word representations in vector space. In International Conference on Learning Representations.
- Mitchell (1999) Tom Mitchell. 1999. Twenty Newsgroups. UCI Machine Learning Repository. DOI: https://doi.org/10.24432/C5C323.
- Papadia et al. (2023) Gabriele Papadia, Massimo Pacella, Massimiliano Perrone, and Vincenzo Giliberti. 2023. A comparison of different topic modeling methods through a real case study of italian customer care. Algorithms, 16(2).
- Paul and Girju (2009) Michael Paul and Roxana Girju. 2009. Topic modeling of research fields: An interdisciplinary perspective. In Proceedings of the International Conference RANLP-2009, pages 337–342, Borovets, Bulgaria. Association for Computational Linguistics.
- Paul and Dredze (2011) Michael J. Paul and Mark Dredze. 2011. You are what you tweet: Analyzing twitter for public health. Proceedings of the International AAAI Conference on Web and Social Media.
- Phan et al. (2008) Xuan Hieu Phan, Minh Le Nguyen, and Susumu Horiguchi. 2008. Learning to classify short and sparse text & web with hidden topics from large-scale data collections. In The Web Conference.
- Poursabzi-Sangdeh et al. (2016) Forough Poursabzi-Sangdeh, Jordan Boyd-Graber, Leah Findlater, and Kevin Seppi. 2016. ALTO: Active learning with topic overviews for speeding label induction and document labeling. In Proceedings of the 54th Annual Meeting of the Association for Computational Linguistics (Volume 1: Long Papers), pages 1158–1169, Berlin, Germany. Association for Computational Linguistics.
- Rand (1971) William M Rand. 1971. Objective criteria for the evaluation of clustering methods. Journal of the American Statistical association, 66(336):846–850.
- Reimers and Gurevych (2019) Nils Reimers and Iryna Gurevych. 2019. Sentence-bert: Sentence embeddings using siamese bert-networks. In Conference on Empirical Methods in Natural Language Processing.
- Röder et al. (2015) Michael Röder, Andreas Both, and Alexander Hinneburg. 2015. Exploring the space of topic coherence measures. WSDM ’15, page 399–408, New York, NY, USA. Association for Computing Machinery.
- Rosenblatt (1958) Frank Rosenblatt. 1958. The perceptron: a probabilistic model for information storage and organization in the brain. Psychological review, 65(6):386.
- Settles (2012) Burr Settles. 2012. Active learning (synthesis lectures on artificial intelligence and machine learning). In Findings.
- Strehl and Ghosh (2003) Alexander Strehl and Joydeep Ghosh. 2003. Cluster ensembles — a knowledge reuse framework for combining multiple partitions. J. Mach. Learn. Res., 3(null):583–617.
- Sundqvist et al. (2022) Martina Sundqvist, Julien Chiquet, and Guillem Rigaill. 2022. Adjusting the adjusted rand index: A multinomial story. Comput. Stat., 38(1):327–347.
- Tang et al. (2019) Hongyin Tang, Miao Li, and Beihong Jin. 2019. A topic augmented text generation model: Joint learning of semantics and structural features. In Proceedings of the 2019 Conference on Empirical Methods in Natural Language Processing and the 9th International Joint Conference on Natural Language Processing (EMNLP-IJCNLP), pages 5090–5099, Hong Kong, China. Association for Computational Linguistics.
- Wang et al. (2019) Wenlin Wang, Zhe Gan, Hongteng Xu, Ruiyi Zhang, Guoyin Wang, Dinghan Shen, Changyou Chen, and Lawrence Carin. 2019. Topic-guided variational auto-encoder for text generation. In Proceedings of the 2019 Conference of the North American Chapter of the Association for Computational Linguistics: Human Language Technologies, Volume 1 (Long and Short Papers), pages 166–177, Minneapolis, Minnesota. Association for Computational Linguistics.
- Wang et al. (2020) Zhengjue Wang, Zhibin Duan, Hao Zhang, Chaojie Wang, Long Tian, Bo Chen, and Mingyuan Zhou. 2020. Friendly topic assistant for transformer based abstractive summarization. In Proceedings of the 2020 Conference on Empirical Methods in Natural Language Processing (EMNLP), pages 485–497, Online. Association for Computational Linguistics.
- Webber et al. (2010) William Webber, Alistair Moffat, and Justin Zobel. 2010. A similarity measure for indefinite rankings. ACM Trans. Inf. Syst., 28(4).
- Wilson and Chew (2010) A. T. Wilson and P. A. Chew. 2010. Term weighting schemes for latent dirichlet allocation. In Human Language Technologies: The 2010 Annual Conference of the North American Chapter of the Association for Computational Linguistics, pages 465–473. Association for Computational Linguistics.
- Xu and Eguchi (2022) W Xu and K Eguchi. 2022. A supervised topic embedding model and its application. PLoS One, 17(11):e0277104. PMID: 36331905; PMCID: PMC9635756.
- Zhang et al. (2019) Hongming Zhang, Hantian Ding, and Yangqiu Song. 2019. Sp-10k: A large-scale evaluation set for selectional preference acquisition.
- Zhao et al. (2021) He Zhao, Dinh Phung, Viet Huynh, Yuan Jin, Lan Du, and Wray Buntine. 2021. Topic modelling meets deep neural networks: A survey. In Proceedings of the Thirtieth International Joint Conference on Artificial Intelligence, IJCAI-21, pages 4713–4720. International Joint Conferences on Artificial Intelligence Organization. Survey Track.
- Zhao et al. (2020) He Zhao, Piyush Rai, Lan Du, Wray Buntine, Dinh Phung, and Mingyuan Zhou. 2020. Variational autoencoders for sparse and overdispersed discrete data. In Proceedings of the Twenty Third International Conference on Artificial Intelligence and Statistics, volume 108 of Proceedings of Machine Learning Research, pages 1684–1694. PMLR.
- Zhao et al. (2011) Wayne Xin Zhao, Jing Jiang, Jianshu Weng, Jing He, Ee-Peng Lim, Hongfei Yan, and Xiaoming Li. 2011. Comparing twitter and traditional media using topic models. In European Conference on Information Retrieval.
- Zhao (2005) Ying Zhao. 2005. Criterion Functions for Document Clustering. Ph.D. thesis, USA. AAI3180039.
10 Appendix
Appendix A Clustering Evaluation Metric Details
We list and show the calculation details of automated evaluation metrics discussed in Section 2.4 for easy of reproducing our work in this section. Suppose the classifier is trained on existing documents with user input labels (5% of the documents), and the classifier predicts labels for all the documents, and they are partitioned into clusters denoted as . The official gold clusters are denoted as .
Purity
It is calculated by assigning each cluster to the class which is most frequent in the cluster, and counting the correctly assigned points in that cluster. The formula to calculate the purity between the predicted and the gold clusters is:
| (5) |
is the total number of points, is the cluster, is the class. is the number of points in cluster that belongs to class , and is maximum number of class intersection with cluster Zhao (2005).
Adjusted Normalized Mutual Information
The Adjusted Normalized Mutual Information (anmi) is an improved version of the Normalized Mutual Information (nmi) metric used for comparing the similarity between two clusterings that adjusts for chance to make the score more robust and comparable across different situations:
| (6) |
The mutual information (mi) measures how much information we know about the gold clustering by knowing about the predicted clustering. The expected mutual information e[mi] is calculation of what the mi would be if the predicted clusters were completely at random, but still considering the size of the clusters. H(k) measures the randomness or disorder within the gold clustering and H(c) measures the randomness or disorder within the predicted clustering–entropy. A higher entropy means higher randomness for the clusters Amelio and Pizzuti (2016).
Adjusted Rand Index
Rand Index (ri) computes the similarity between two clustering by considering pairs that are assigned in the same or different clusters in the predicted and true clustering Rand (1971). The formula for ri is:
| (7) |
tp is the number of pairs that are in the same set in both the predicted and gold clusters, and tn is the number of pairs that are in different sets in the predicted and gold clusters. Otherwise, the pairs are either fp or fn.
The Adjusted Rand Index (ari) is the corrected-for-chance version of the ri. It accounts for the fact that the RI score will increase as the number of clusters increases, even if the clustering is random:
| (8) |
Expected ri is the expected value of the ri under random labeling, respecting the marginal distributions of cluster sizes. Max ri is the highest possible value that the ri could take, given the constraints of the clustering problem. A Max ri of 1.0 indicates two clusterings are identical, but when adjusting it for chance, Max ri can be less than 1 depending on the distribution of cluster sizes.
Normalized Pointwise Mutual Information
npmi evaluates how semantically related the top words in each topic are to the documents in that topic, which in turn reflects the quality of the generated topics by a topic model:
| (9) |
P(x, y) represents the probability of words x and y co-occuring together in a set of documents, where P(x) and P(u) are probabilities of observing words x and y independently in the set of documents.
Appendix B Simulated Experiment Details
Training Topic Models
We preprocess the dataset by tokenizing and filtering stopwords; we use a tf-idf threshold of three to remove rare and too-common words.
For lda and slda, we use the Tomotopy library Lee (2022), which uses Gibbs sampling to train classical topic models. To compare two datasets fairly, we chose topics for all five topic models in our group, which optimized average coherence. For lda and slda, we use the term weight scheme ONE Wilson and Chew (2010). slda takes more extra hyperparameters than lda does. For slda, we also use binary-type response variables to indicate user input labels. Otherwise, lda and slda use the default hyperparameter values. slda initially does not take in any response variables. We train lda and slda with 2000 iterations until a smaller change of log-likelihood and NPMI coherence.
For ctm, we use SBERT paraphrase-distilroberta-base-v2 to fetch sentence embeddings for the dataset, then concatenate them with BoW representation. We used CombinedTM Bianchi et al. (2021) with a 768 contextual size, with topics, and trained it with 250 epochs. We also use paraphrase-distilroberta-base-v2 to fetch sentence ebmeddings to train Bertopic. For etm, we use Word2Vec Mikolov et al. (2013) to encode documents and train it with 250 epochs.
Classifier Initialization and Features
Since users are more likely to create more granular label specifications for each document. We used sub-labels as pseudo user-entered labels while using the more general labels as our gold standard.
We use sklearn SGD as our classifier for active learning document selection.111111We use hyperparameters: loss=’log_loss’, penalty=’l2’, tolerance=10e-3, random_state=42, learning_rate=’optimal’, eta0=0.1, validation_fraction=0.2, and alpha=0.000005. We transform our raw dataset using unigram tf-idf as input features for the classifier. For lda, slda, and ctm groups, we also concatenate topic probability distributions for all the documents with unigram tf-idf features that also encode topic information to the classifier. Since the classifier requires at least two classes to be fitted, we pick random documents, and use sub-labels as surrogate user input labels, and activate the preference function until the classifier has at least two class labels. We use incremental leaning Rosenblatt (1958) to fit and update the classifier, retaining originally learned parameters.121212There are two exceptions we reinitialize the classifier: if a new label class is introduced to the classifier, we reinitialize the classifier and train it with labeled documents; if slda is updated with surrogate response variables, we rebuild the features by concatenating tf-idf features with new topic probability distributions, and restart the classifier with new features. The classifier’s predictions with the more general labels assess the clustering quality.
Simulated Experiment
Upon analyzing the document lengths in our dataset, we deduced that considering individual reading speed variances, a user can feasibly label between 90 to 400 documents within an hour. For our simulated user study, we automatically run our algorithm for each group to input labels for 400 documents, constantly updating the classifier for every document labeled, and slda for every 50 documents labeled. Each group underwent 15 iterations of the experiment. For consistency, we aggregated the results by taking the median value for each document in each group.
Validity of Simulated Experiments
Of all the methods, ctm consistently does better on purity, ari, and anmi, which underscores the right choice of ntm can generate topic probability features that do better on classification. Such features, rooted in pre-trained embeddings, are perceived by compact machine learning models as more intuitive than the generative topic probabilities yielded by classical models like lda and slda. slda and etm, on the other side, is worse than lda, where lda remains competitive against two other ntms. The classifier without topic information falls short behind the classifier with topic information except for etm.
Our simple simulated experiments serve as a reliable proxy, allowing us to expect similar trends when actual human labeling is in play and to track the evolution of classifier predictions as more documents are labeled over time. However, we acknowledge that relying solely on simulated evaluation metrics has limitations. The classifier does not consider using topic keywords and topic overviews to create labels. Other factors, including fatigue and loss of attention, might also affect the quality of labels created by real users. Such metrics also do not capture the complete essence of user preferences, especially concerning the keywords produced by topic models, the highlighted keywords, or the specific documents recommended by the preference function.
Appendix C Dataset Details
The Bills have over 400,000 bills spanning from 1947 to 2009, where each bill is meticulously labeled with primary and secondary topics, as detailed in a comprehensive codebook.131313https://comparativeagendas.s3.amazonaws.com/codebookfiles/Codebook_PAP_2019.pdf. The latest iteration of this dataset has seen its topics labeled by adept human coders, who were trained using the preceding dataset version. The inter-annotator agreement was observed to be an impressive 95% for primary topics and 75% for secondary ones. Such extensive and refined labeling, carried out by trained annotators over numerous years, assures the dataset’s label quality. The 20newsgroup is a popular benchmark dataset that has 6 major labels and 20 sub-labels. We remove duplicate documents, documents that are shorter than 30 tokens, documents that contain sensitive topics, and documents that the general public is not familiar with the Bills and 20newsgroup dataset.
Appendix D User Label Evaluations
We do a sanity check on the 800 randomly selected labeled documents, to ensure users are creating meaningful labels. Within each group, we sort the users based on the summation of purity, ari, anmi at the end of the 61st minute in ascending order. We take the middle 8 users and randomly pick 200 labeled documents from each group. We have two annotators manually judge the user labels based on the following two criteria: 1. Can the user label be considered equivalent or a subfield of the gold label (major label and sub label)? 2. Does the user label reflect the contents of the passage? If the annotator rates ‘yes’ for criteria 1, criteria 2 will be skipped. Otherwise, the annotator will need to read the actual passage to judge the quality of the user labels. Among 800 labeled documents, we have 787 documents that satisfy at least one of the two criteria, which ensures most users are making meaningful labels and carefully conducting the study.
Appendix E User Interface
Figure 5 and Figure 6 show a basic layout of ctm used in our user study. The keywords and document clusters will not be displayed to none group users. Instead, a random list of documents are displayed to them in Figure 5 page. In Figure 6 page, none users are not displayed with the Top Topic Keywords and the highlighted texts.
Appendix F Topic Model Keywords
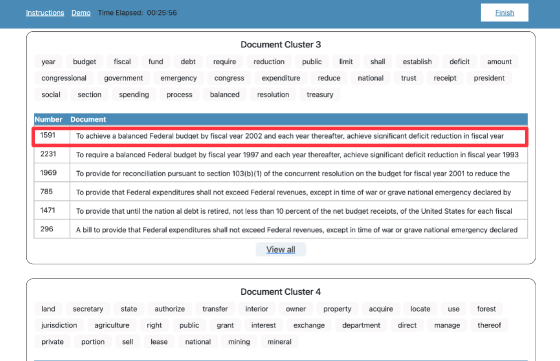
Table 3, 4, and 5 show the 2 topics with highest, median, and lowest npmi coherence scores for lda, slda, ctm, and slda trained with user input labels as response variables. The topic keywords generated by lda are more general and inclusive while the topic keywords generated by ctm are more specific and related to the top passages.
| Model | NPMI | Keywords | Passage |
|---|---|---|---|
| lda | 0.39 | exemption, income, dependent, increase, taxpayer, tax, spouse, personal, additional, include | To provide that certain survivor benefits received by a child under public retirement systems shall not be taken into account in determining whether the child is a dependent for income tax purposes. |
| lda | 0.24 | tax, revenue, internal, code, income, section, taxis, pay, credit, individual | To amend the Internal Revenue Code of 1954 to include the sintering and burning of clay, shale, and slate used as lightweight aggregates as a treatment process considered as mining. |
| slda | 0.35 | rescind, control, authority, budget, president, special, impoundment, propose, transmit, section | To rescind certain budget authority proposed to be rescinded (R92-66) in a special message transmitted to the Congress by the President on March 20, 1992. |
| slda | 0.22 | tax, revenue, income, internal, code, exemption, section, individual, taxis, shall | To amend the Internal Revenue Code to provide that gain or loss from the sale or exchange of certain real estate shall be treated as a capital gain or loss. |
| ctm | 0.50 | president, authority, propose, rescind, congress, special, impoundment, march, accordance, trasmit, message | A bill to rescind certain budget authority contained in the message of the President of January 27, 1978 (H. Doc. 95-285), transmitted pursuant to the Impoundment Control Act of 1974. |
| ctm | 0.38 | exemption, include, taxpayer, personal, additional, increase, dependent, spouse, income, old | To increase from $600 to $750 the personal income tax exemptions of a taxpayer (including the exemption for a spouse, the exemption for a dependent, and the additional exemption for old age, or blindness). |
| slda(user) | 0.42 | budget, rescind, control, president, authority, impoundment, congress, transmit, message, section | To amend part C of the Balanced Budget and Emergency Deficit Control Act of 1985 to extend the discretionary spending limits and pay-as-you-go through fiscal year 2009. |
| slda(user) | 0.26 | education, school, student, loan, program, secondary, institution, elementary, educational, teacher | To amend the Higher Education Act of 1965 to expand the loan forgiveness and loan cancellation programs for teachers, to provide loan forgiveness and loan cancellation programs for nurses, and for other purposes. |
| Model | NPMI | Keywords | Passage |
|---|---|---|---|
| lda | 0.13 | water, wildlife, conservation, fish, establish, management, resource, national, development, coastal | To create a joint commission of the United States and the State of Alaska to make administrative determinations of navigability of inland nontidal waters in the State of Alaska for State selections. |
| lda | 0.12 | food, drug, use, cosmetic, respect, human, child, information, intend, manufacturer | A bill to amend Sections 403 and 405 of the Federal Food, Drug, and Cosmetic Act to require that foods intended for human consumption be labeled to show the amount of sodium and potassium they contain. |
| slda | 0.10 | labor, section, employee, national, organization, fair, provision, relations, right, railway | To amend the Railroad Retirement Act of 1937 and the Social Security Act to eliminate those provisions which restrict the right of a spouse or survivor to receive benefits simultaneously under both acts. |
| slda | 0.07 | highway, title, section, amend, national, code, fund, system, construction, stat | A bill to supplement the Federal Aid Road Act, approved July 11, 1916, as amended and supplemented, to authorize appropriations for the construction of greatly needed rural local roads, and for other purposes. |
| ctm | 0.07 | contract, standards, work, wage, contractor, cause, hour, fair, employer, employee | A bill to provide for the creditability of certain service in determining the order of retention for competing employees in a reduction in force affecting the Federal Grain Inspection Service. |
| abrctm | 0.06 | revenue, internal, code, section, estate, sale, admission, value, treatment, relate | To amend section 112 (b) of the Internal Revenue Code (relating to recognition of gain in certain corporate liquidations) so that it will apply to cases where the transfer of all the property under the liquidation occurs within 1 calendar month in 1953. |
| slda(user) | 0.03 | program, establish, improve, development, system, promote, assist, provide, national, encourage | A bill to improve existing tertiary eye centers, to examine the delivery of eye care to the general public, and to study the feasibility of implementing a system of tertiary eye care centers throughout the United States. |
| slda(user) | 0.02 | state, fund, program, year, title, establish, assistance, construction, facility, authorize | To amend the National Housing Act to authorize the Secretary of Housing and Urban Development to insure mortgages for the acquisition, construction… |
| Model | NPMI | Keywords | Passage |
|---|---|---|---|
| lda | -0.10 | person, foreign, prohibit, business, engage, country, trade, domestic, enable, stock | To provide an exception from certain group health plan requirements to allow small businesses to use pre-tax dollars to assist employees in the purchase of policies in the individual health insurance market, and for other purposes. |
| lda | -0.08 | vessel, coast, guard, marine, specie, merchant, port, law, academy, endangered | To amend the Merchant Marine Act of 1936 and the Maritime Academy Act of 1958 to enlarge the mission of the U.S. Merchant Marine Academy and to assist in enlarging the mission of the State maritime academies. |
| slda | -0.12 | meat, product, inspection, state, continental, shelf, outer, poultry, import, land | A bill to modify the method of determining quantitative limitations on the importation of certain articles of meat and meat products, to apply quantitative limitations on the importation of certain additional articles of meat, meat products, and livestock, and for other purposes. |
| slda | -0.11 | fla, know, value, historic, shall, national, site, use, fort, dam | A bill to provide that the reservior formed by the lock and dam referred to as the Millers Ferry lock and dam on the Alabama River, Alabama, shall hereafter be known as the William Bill Dannelly Reservior. |
| ctm | -0.29 | locate, convey, transfer, territory, memorial, historical, washington, smithsonian, city, conveyance | To provide for the conveyance of certain excess real property of the United States to the city of Mission, the city of McAllen, and the city of Edinburg, all situated in the State of Texas. |
| ctm | -0.12 | highway, aid, interstate, road, alaska, system, fund, fla, commission, transportation | To amend section 5 of the Department of Transportation Act to authorize the National Transportation Safety Board to employ 5,000 investigators to carry out its powers and duties under that act. |
| slda(user) | -0.36 | gas, purpose, greenhouse, wheat, red, cheese, cheddar, operate, exist, standards | To provide that the rules of the Environmental Protection Agency entitled National Emission Standards for Hazardous Air Pollutants for Reciprocating Internal Combustion Engines… |
| slda(user) | -0.31 | gram, trans, drugs, deadline, intervention, temple, manatees, plains, ombudsman, leaseholder | To direct the Commissioner of Food and Drugs to revise the Federal regulations applicable to the declaration of the trans fat content of a food on the label and in the labeling of the food when such content is less than 0.5 gram. |