Electronic structure and physical properties of candidate topological material GdAgGe
Abstract
We grew needle-shaped single crystals of GdAgGe, which crystallizes in a noncentrosymmetric hexagonal crystal structure with space group P2m (189). The magnetic susceptibility data for H c reveal two pronounced antiferromagnetic transitions at TN1 = 20 K and TN2 = 14.5 K. The magnetic susceptibility anomalies are less prominent for H c. The transition at TN1 is accompanied by a pronounced heat capacity anomaly confirming the bulk nature of the magnetic transition. Below TN1, the electrical resistivity data follows a T3/2 dependence. In the magnetically ordered state, GdAgGe shows positive transverse magnetoresistance, which increases with decreasing temperature and increasing field, reaching a value of 27% at 9 T and 10 K. The Hall resistivity data and electronic band structure calculations suggest that both the hole and electron charge carriers contribute to the transport properties. The electronic band structure displays linear band crossings near the Fermi level. The calculations reveal that GdAgGe has a nodal line with drumhead surface states coupled with a nonzero Berry phase, making it a nontrivial nodal-line semimetal.
I Introduction
Rare-earth based intermetallic compounds are well known for their complex and wide range of physical properties such as quantum critical point, field induced first order to second order phase transition, non-Fermi liquid behavior, crystal electric field interaction, spin and charge ordering, valence fluctuation, heavy-fermion (Kondo) behavior, charge density wave, superconductivity, etc. Paramanik et al. (2014, 2016); Schmiedeshoff et al. (2011); Das et al. (2014); Bonville et al. (2007); Malick et al. (2022); Nakamura et al. (2015). Recently the interest has burgeoned in the rare-earth compounds due to the observation of nontrivial topological states. A special interest is in those materials which show interplay between topology and magnetism. In these materials, the topological states are protected by certain crystalline or point or space group symmetry as they have either broken time-reversal symmetry (TRS) or inversion symmetry (IS) or both Liu et al. (2017). It was reported that broken TRS in combination with strong spin orbit coupling (SOC) leads to a large anomalous Hall effect (AHE) in antiferromagnetic Weyl semimetal GdPtBi Suzuki et al. (2016). Interestingly, besides AHE, another type of Hall effect, i.e. topological Hall effect (THE) arises in some topological magnetic materials with a noncoplanar magnetization texture, defined by their nontrivial topology coupled with local magnetization Puphal et al. (2020). It was theoretically predicted that THE can occur solely from Berry phase in absence of SOC as opposed to SOC induced AHE and it is favorable for those systems having low carrier density, and large spin splitting and exchange interactions Bruno et al. (2004). However, THE can also occur in higher carrier density ferromagnetic (FM) and antiferromagnetic (AFM) materials crystallizing in different lattice structures and is sensitive to several factors such as geometrical frustrations, spin chirality and thermal fluctuations, antisymmetric Dzyaloshinskii-Moriya interaction, correlation effects, and magnetic anisotropy Wang et al. (2019); Neubauer et al. (2009); Kanazawa et al. (2011); Sürgers et al. (2014); Vistoli et al. (2019); Laha et al. (2021); Puphal et al. (2020). Several different families of materials such as VxSb2Te3 Wang et al. (2019), MnSi Neubauer et al. (2009), MnGe Kanazawa et al. (2011), Mn5Si3 Sürgers et al. (2014), Ca1-xCexMnO3 Vistoli et al. (2019), EuAgAs Laha et al. (2021), EuO Ohuchi et al. (2015), and Pr2Ir2O7 Machida et al. (2007) were reported to display THE.
The rare-earth based equiatomic ternary germanide compounds can be very exciting from the perspective of topological, magnetic and transport properties due to their tunable magnetic behavior, which could be manipulated by number of 4f electrons and external magnetic fields Puphal et al. (2020); Pöttgen et al. (1998); Baran et al. (1998); Morosan et al. (2004); Goddard et al. (2007). Recently, type–I and type-II Weyl semimetal states were theoretically predicted in some of the rare-earth based aluminium germanides, where the type of topological state can be tuned by choice of rare-earth element by breaking IS or TRS Chang et al. (2018). The theoretical predictions made in ref. Chang et al. (2018) were later confirmed by the experimental results in PrAlGe Destraz et al. (2020); Sanchez et al. (2020), and CeAlGe Hodovanets et al. (2018). Interestingly, both tetragonal compounds were found to show anomalous transport associated with nontrivial Berry phase for magnetic fields along the crystallographic c-axis Meng et al. (2019); Destraz et al. (2020). PrAlGe exhibits large AHE with conductivity value 680 cm-1 Meng et al. (2019) and CeAlGe shows THE in field range 0.4-1.5 T at low temperatures Puphal et al. (2020). PrAlGe was also reported to show enhanced AHE due to large Berry curvature generated by Weyl nodes, when small magnetic fields polarize Pr local moments along the c-axis Sanchez et al. (2020). YbAgGe is another interesting compound, which exhibits field induced quantum criticality, non-Fermi liquid behavior and anisotropic Hall effect Bud’ko et al. (2004, 2005); Tokiwa et al. (2013). All these interesting observations motivated us to further explore the equiatomic ternary rare-earth silver germanide systems in context of their magnetic, thermodynamic, transport and topological properties.
Here, we describe the results of our study of GdAgGe that crystallizes in hexagonal crystal structure with space group P2m (189) and orders antiferromagnetically below the Néel temperature, TN 15.6 K as determined for polycrystalline samples Baran et al. (1998). We grew the GdAgGe single crystals and investigated their physical properties by means of magnetic susceptibility, heat capacity, electrical resistivity, Hall effect, and magnetoresistance measurements as well as electronic band structure calculations.
II Experimental details and methods
Single crystals of GdAgGe were grown using Pb flux. High purity elements Gd (Alfa Aesar, 99.9%), Ag (Alfa Aesar, 99.99%), Ge (Alfa Aesar, 99.999%), and Pb (Alfa Aesar, 99.99%) were weighed in a 1:1:1:10 molar ratio and put into alumina crucible. Then, the crucible was sealed inside a quartz tube under argon atmosphere. Next, the whole assembly was put into a furnace and subjected to heat treatment at 1100 ∘C for 10 hours. Subsequently, the furnace was slowly cooled down to 700 ∘C at a rate 2 ∘C/h and at this temperature flux was removed by centrifugation. The process resulted in needle-like shiny single crystals with typical dimensions of 3 0.3 0.4 mm3.
The crystal structure and chemical composition of the grown crystals were checked by X-ray diffraction (XRD) on a PANalytical X’Pert PRO diffractometer with Cu-Kα1 radiation, and energy-dispersive X-ray spectroscopy (EDS) performed in a JEOL JSM-6010LA scanning electron microscope. Transport measurements were carried out in a Quantum Design Physical Property Measurement System (PPMS) using standard four-probe method. Heat capacity measurements were performed using conventional relaxation method in the same PPMS platform. Magnetization measurements were carried out employing a Quantum Design Magnetic Property Measurement System (MPMS).
The first-principles calculations were performed based on the density functional theory (DFT) Hohenberg and Kohn (1964); Kohn and Sham (1965) with the projector augmented wave (PAW) Blöchl (1994) method as implemented in Vienna ab initio simulation package (VASP) Kresse and Furthmüller (1996); Kresse and Joubert (1999). To account for exchange-correlation effects, the generalised gradient approximation (GGA) with the Perdew-Burke-Ernzerhof (PBE) Perdew et al. (1996) parametrization was used. The significant correlation effects of Gd-f states were handled by using a Hubbard U parameter (GGA+U) of 6 eV Petersen et al. (2006); Li et al. (2015). All calculations were done with a plane wave energy cutoff of 600 eV, and the energy convergence criterion was chosen to be 10-6 eV. The geometry optimization calculations were performed with 2 2 2 supercell using dense k-mesh as per the Monkhorst-Pack technique Monkhorst and Pack (1976). For surface state calculations, the WANNIER90 package Pizzi et al. (2020) was employed to create a tight-binding Hamiltonian based on maximally localised Wannier functions. The iterative Green’s function approach, which is implemented in the WANNIERTOOLS package, was used to study topological features of the compound based on the tight-binding model Wu et al. (2018); Sancho et al. (1985).
III Results and discussion
III.1 Crystal structure
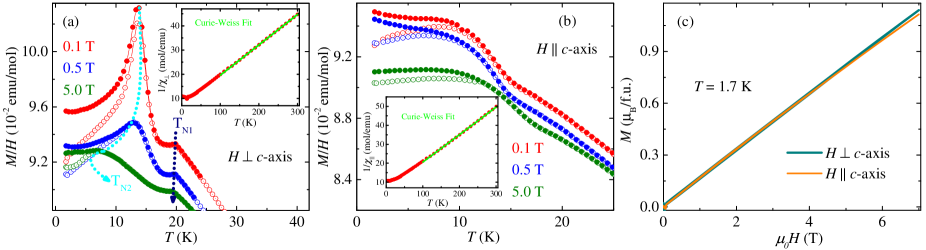
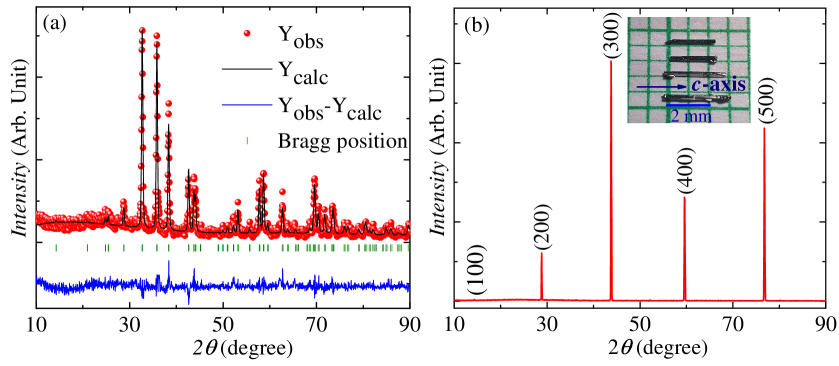
Fig. 1(a) shows the powder XRD pattern of crushed single crystals of GdAgGe recorded at room temperature. It reveals the single phase growth of GdAgGe crystals. Further, we carried out Rietveld refinement of the powder XRD data using the FULLPROF software. The refinement yielded the hexagonal structure with space group P2m (189) and the lattice parameters a = b = 7.170 Å, and c = 4.241 Å, close to those reported in the literature Pöttgen et al. (1998). The single crystal XRD pattern measured on a flat surface of needle-shaped crystal is shown in Fig. 1(b). The presence of (00) peaks in the diffraction pattern indicates that a needle axis of the crystal coincides with the crystallographic c-axis as shown in the inset of Fig. 1(b). The chemical composition of needle-shaped crystals was found to be very close to the ideal equiatomic stoichiometry.
III.2 Magnetic properties
Figs. 2(a) and 2(b) show the dc magnetization (M) as a function of temperature (T) for various external fields (H) applied perpendicular and parallel to the crystallographic -axis. The data was taken in zero-field cooled (ZFC) and field cooled (FC) modes and it is plotted as M(T)/H curves. For H c, M/H curve shows two very sharp peaks at TN1 = 20 K and TN2 = 14.5 K, clearly indicating the AFM ordering in the compound. It is worthy to mention here that for polycrystalline sample, only one AFM transition was observed at 15.6 K Baran et al. (1998). As is evident from Fig. 2(a), an increase in field from 0.1 to 5 T shifts the peaks towards lower temperatures, which is consistent with the usual behavior exhibited by an antiferromagnet Kosaka et al. (2020); Bud’ko et al. (1999). Further, with the change in field direction from H c to H c, the observed sharp peaks become quite broad and less pronounced. The magnetization values observed for H c and H c do not differ significantly, suggesting small magnetic anisotropy. For both configurations, ZFC and FC curves show bifurcation below TN2. This feature hints at the possibility that the order-to-order magnetic phase transition in GdAgGe involves small canting of the AFM moments.
The temperature dependencies of the inverse magnetic susceptibility ( = M/H) measured in magnetic field H = 0.1 T with H c and H c are shown in insets of Figs. 2(a) and 2(b), respectively. Above 100 K, the data were fitted to the Curie-Weiss equation , where and are the Curie constant and the paramagnetic Curie temperature, respectively. The fit yields the values -56.4 K and -42.0 K for H c and H c, respectively. The negative value of conforms to the AFM order in the compound. The frustration parameter f (=/TN) estimated for our crystal is 2.82 (3.89) for TN1 (TN2), which lies in moderate range Ramirez (1994). The f value for GdAgGe crystal is much smaller than reported for strongly frustrated germanide YbAgGe (26) Umeo et al. , but larger than for polycrystalline GdAgGe (1.77) and ErAgGe (0.30) compounds Gibson et al. (1996). The effective magnetic moment, estimated from the Curie constant for H c (H c) is 7.99 (7.42) , which compares well with the theoretical value of 7.94 for Gd3+ ion.
Fig. 2(c) shows the isothermal magnetization, M(H) of GdAgGe measured at 1.7 K for H c and H c configurations. M increases linearly with H up to 7 T for both field orientations. This kind of behavior is expected for AFM systems with metamagnetic transition occurring in stronger fields and reported before for other Gd based ternary antiferromagnets such as GdPtBi, GdAuGe and GdAuIn Suzuki et al. (2016); Pöttgen et al. (1998).
III.3 Heat capacity and entropy
The temperature dependence of the heat capacity () at constant pressure is shown in Fig. 3. A clear lambda-shaped anomaly near 20 K is observed, which confirms the AFM ordering at TN1 revealed in our magnetization measurements. The other AFM transition, clearly visible at TN2 = 14.5 K in the magnetic susceptibility data, does not manifest itself in , however its weak signature is visible in the temperature derivative of the heat capacity (see the inset to Fig. 3). With application of magnetic field, the anomaly at TN1 is slightly shifted towards lower temperatures with increasing field (not shown here), as observed in the magnetic susceptibility data. In the paramagnetic state, increases continuously until it gets saturated at a value of 72.11 J mol-1 K-1 at the room temperature. This value is close to the limit set by Dulong-Petit law ( = 3nR = 74.84 J mol-1 K-1, where n is the number of atoms in the formula units, and R is the universal gas constant). The temperature variation of above TN1 can be well described by a sum of electronic (T), Debye (), and Einstein () contributions with the expression
| (1) |
where is the weight factor and is the Sommerfeld coefficient. (T) and (T) are defined as
| (2) |
and
| (3) |
where and are the Debye and Einstein temperatures, respectively. The obtained values of the fitting parameters are = 0.47 mJ mol-1 K-2, = 164 K, = 288 K, and = 0.66. The large value of suggests the contribution of high frequency optical modes to the heat capacity of GdAgGe.
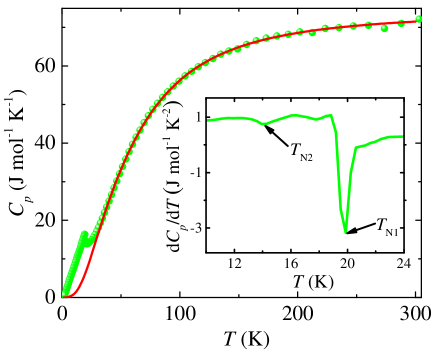
By subtracting the phonon contribution to (T), determined from Eq. (1), the magnetic part of the heat capacity was derived and used to estimate the magnetic entropy according to the formula . The magnitude of is 11.5 J mol-1 K-1 at TN1 = 20 K and saturates above 30 K around 14.5 J mol-1 K-1, which is about 84 % of the value Rln8 expected for S = 7/2.
III.4 Magnetotransport
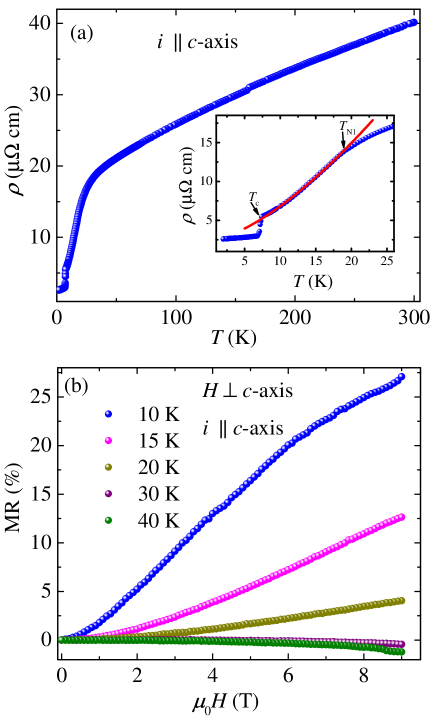
Fig. 4(a) shows the temperature dependence of the electrical resistivity of GdAgGe single crystal measured along the c-axis in zero magnetic field. The resistivity decreases monotonically with decreasing T in a metallic manner and its magnitude is similar to those reported for GdPdSn and GdPdGe Talik et al. (2006). Below 30 K, the resistivity decreases more rapidly. The AFM transition at TN1 manifests itself as a knee in (T) and a clear minimum in the temperature derivative of this curve (not shown here). This feature can be associated with suppression of spin-disorder scattering in the magnetically ordered state. Remarkably, (T) does not exhibit any clear anomaly at TN2 = 14.5 K, as displayed in the inset to Fig. 4(a). The measured resistivity was found to drop suddenly near 7 K. This feature is likely extrinsic to GdAgGe and originates due to Pb flux residues trapped on the random sites of crystal surface Matthias et al. (1963), which become superconducting at this temperature. The extrinsic character of the superconductivity is confirmed by the absence of any corresponding anomaly in the heat capacity data. To determine the dominant scattering mechanism in the AFM range (8 K T 17 K), the low temperature resistivity data were fitted with the expression (T) = + AT, where and A represent the residual resistivity and the scattering coefficient, respectively and m is the exponent representing the scattering mechanism. Usually, in the AFM regime, where conduction electrons are scattered by AFM magnons, the exponent, m = 3 is expected Rossiter (1987). In the present case, we found m = 3/2, predicted by Moriya et al. to occur due to AFM spin fluctuations Moriya and Takimoto (1995). Similar kind of (T) behavior at low temperatures was reported in the literature for RPdSi (R = Gd, Tb, Dy) compounds Mukhopadhyay et al. (2021).
The isothermal transverse magnetoresistance (H i) of GdAgGe is shown in Fig. 4(b), where MR is defined as MR = [(H) (0)]/(0). In the ordered state, MR is positive and increases with increasing field, reflecting the generic feature of an antiferromagnet. The maximum MR value is 27% at 9 T and 10 K. At the boundary of AFM to paramagnetic phase transition i.e. at 20 K, MR magnitude sharply decreases to 4% at 9 T, and becomes nearly zero in weak magnetic fields. With further increase in temperature (T TN), MR is very small in small fields and becomes negative in strong fields, which can be attributed to field-induced alignment of the Gd magnetic moments in the paramagnetic phase.
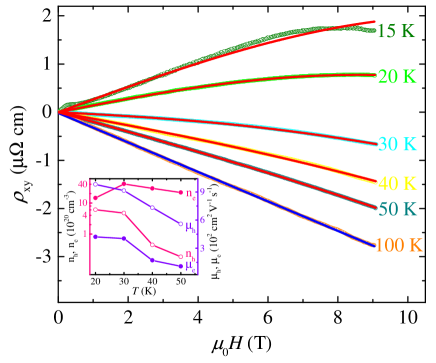
Fig. 5 shows the field dependence of Hall resistivity () in the temperature range 15-100 K. It is clearly observed that at low temperatures (T 100 K), shows the nonlinear field dependence, indicating the multi-band character of electronic transport. However, the sign of is positive below 30 K, which suggests that the holes are the dominating charge carriers. At somewhat higher temperatures (30 T 100 K), the nonlinear behavior of persists with the electrons dominating charge transport. For T = 100 K, the becomes linear with complete dominance of electrons. The slope of linear fit provides the Hall coefficient , which is used to estimate electron carrier concentration (n), and the Hall mobility () by using the relations n = 1/(e) and = /(H = 0). The estimated value of n and is 2.04 1021 cm-3 and 118 cm2 V-1 s-1, respectively. To further extract information about the charge carriers and their mobilities at low temperatures (T 100 K), we use the semi-classical two-band model, where the Hall resistivity is given by the expression
| (4) |
The two-band model fit in the temperature range 15-50 K is shown in Fig. 5. It is clearly evident that the two-band model nicely fits the Hall data above 20 K. However, at 15 K, the quality of fit is rather poor due to the magnetic ordering effects on the . From the fitting, we estimate the carrier density of 1019-1021 cm-3 in the temperature range 15-50 K. The details of different charge carrier densities and their mobilities are shown in inset of Fig. 5. The estimated carrier densities in GdAgGe are significantly higher than that of typical Dirac/Weyl semimetals (n 1017-1019 cm-3), but comparable to that reported in several nodal-line semimetals Hu et al. (2016); Sankar et al. (2017); Laha et al. (2019); Roy et al. (2021). We do not observe the signature of THE down to 15 K. This could be due to the fact that the Dirac node is not precisely located at the Fermi level, and hence the contribution of Dirac fermions is probably masked by the dominating conventional charge carriers.
III.5 Electronic structure
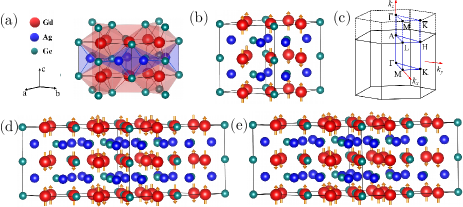
GdAgGe crystallizes in a hexagonal system with noncentrosymmetric space group P2m (189), which is structurally identical to ZrNiAl, a ternary ordered form of Fe2P as illustrated in Fig. 6(a). The space group has a threefold rotational axis (C3z) and a horizontal mirror plane m001, but lacks inversion symmetry. Our DFT calculations describe the crystal structure with the lattice parameters a = b = 7.24 Å, c = 4.26 Å, in good agreement to those determined experimentally. Gd and Ag atoms are positioned at the pyramidal (3g) and tetrahedral (3f) sites, respectively. From Fig. 6(a), it can be seen that Gd + Ge and Ag + Ge atoms form the layers that are separated along the c-axis. According to the experimental results, GdAgGe is an AFM system. Thus, we used the 2 2 2 supercell to compute the ground state energy for non-magnetic (NM), FM and AFM configurations to gain a better understanding of the magnetic characteristics. The possible AFM configurations are shown in Figs. 6(d) and 6(e). Here, AFM1 configuration contains the AFM coupling of magnetic moments in- and out of plane, whereas AFM2 (A-type AFM) configuration exhibit FM coupling in the ab-plane and AFM interactions along the c-axis. The calculated energy differences among the different magnetic orderings are tabulated in Table 1. As evident from Table 1, AFM1 has lowest ground state energy among the calculated structures and it is consistent with our experimental data. It should be noted that the energy difference between AFM1 and AFM2 is very small and computed electronic band structures as well as the topological features for both cases show no significant differences at the Fermi level [see Figs. 7(a) and 7(b)]. To further check the spin orientations of moments in AFM1 structure (which explain our experimental data), we have calculated the ground state energies for [001], [010], [100], [011], [101], [110] and [111] configurations. The calculated energy differences are given in Table 2, which shows minimum ground state energy for the [001] configuration.
| Configuration | NM | FM | AFM1 | AFM2 |
|---|---|---|---|---|
| Energy (meV) | 680 | 35.10 | 0 | 1.92 |
| Configuration | [001] | [010] | [100] | [011] | [101] | [110] | [111] |
|---|---|---|---|---|---|---|---|
| Energy (eV) | 0.0 | 26.09 | 25.13 | 13.40 | 12.85 | 21.96 | 14.93 |
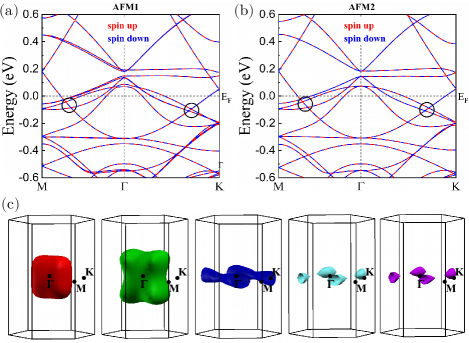
As explained above, the energy difference between AFM1 and AFM2 is very minimal, and the calculated electronic band structures for both configurations look alike as shown in Figs. 7(a) and 7(b). Moreover, we have calculated the Fermi surfaces for AFM1 configuration, which are depicted in Fig. 7(c). We can see that the electron and hole pockets are present at the Fermi level, which is in good agreement with the experimentally observed Hall resistivity. The investigated compound’s electronic band structure displays the band crossings in kz = 0 plane and it gives us a hint towards the topological features. To further explore the topological features, we have performed the electronic bands as well as the surface analysis for lower cell (1 1 2) of AFM configuration [as shown in Fig. 6(b)] and such type of calculations for bigger cell is beyond the scope of our work.
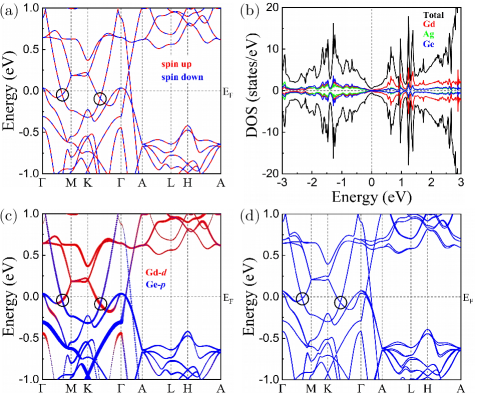
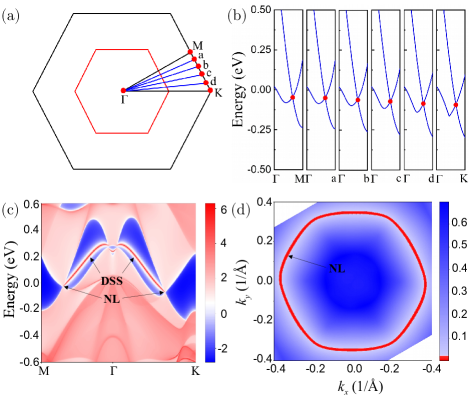
In the next step, we have proceeded with 1 1 2 supercell of AFM configuration. Fig. 8(a) shows the band structure of GdAgGe with the spin-up (in red color) and the spin-down (in blue color) channel. The examined compound’s electronic properties demonstrate the semi-metallic nature. Fig. 8(b) displays the total density of states (DOS) along with atomic projected density of states. The DOS values in both the conduction and valence band region around the Fermi level are almost same, which reflects the semi-metallic nature of the compound. Interestingly, the conduction and valence bands cross each other in a linear manner along the kz = 0 plane (marked in Fig. 8(a)). These Dirac-like crossings hint toward the presence of nodal line, which is protected by mirror symmetry located in the xy-plane. To check for possible nontrivial nature of bands, we calculated the orbital decomposed band structure (Fig. 8(c)), which infers that Gd-d and Ge-p states are main contributors to the bands forming nodal line. Close inspections revealed the Gd-d and Ge-p band inversion together with opposite mirror eigenvalues +1 and -1, respectively, at the point. To analyse these band crossings, we carefully examined the band structure along equally spaced paths between M and K, which is shown in Fig. 9(a). It can be seen that the band crossings appear along -M/a/b/c/d/K paths, which infers that a -centered nodal line should occur in the kz = 0 plane. To demonstrate the topological features in GdAgGe, we calculated the surface states in the (001) direction using the WANNIER package. Fig. 9(c) illustrates the nodal line dispersions from bulk bands and emergent drumhead surface states in the (001) projected surface state. In addition, the energy gap plane and the Fermi surface corresponding to the bands crossings also confirm the occurrence of nodal line in GdAgGe, which is illustrated in Fig. 9(d). The topological invariant, i.e., the Berry phase (a Z2-type invariant) along a closed path encircling the nodal line, usually protects the nodal line structure of a topological nodal-line semimetal Hyart et al. (2018). To confirm this point we have calculated the Berry phase and found a nonzero quantized Berry phase, which confirms GdAgGe to be a nontrivial nodal-line semimetal.
The presence of band inversion without SOC and nodal line in kz = 0 plane further lead us to include the SOC effects here. The electronic band structure with SOC is shown in Fig. 8(d), which reflects that the band crossings are nearly unaffected. However, the inclusion of SOC opens a negligible band gap of 5.7 meV and 5.9 meV along the -M and K- path, respectively. These gap values are quite smaller than those found in other reported nodal-line semimetals Laha et al. (2019, 2020); Emmanouilidou et al. (2017).
IV Conclusions
We studied the physical properties of GdAgGe single crystals by measuring the magnetic susceptibility, heat capacity, magnetoresistance, Hall effect, and by computing the electronic band structure. The magnetic susceptibility measurements in GdAgGe showed the two successive AFM transitions at TN1 = 20 K and TN2 = 14.5 K, which are most prominent for fields perpendicular to the crystallographic c-axis. In the heat capacity data, a clear lambda-shaped anomaly confirms the bulk character of AFM transition observed at TN1 = 20 K. The electrical resistivity shows a sharp drop below TN1 and T3/2 dependence in the AFM state. The transverse magnetoresistance is positive for T TN1, and becomes negative in the paramagnetic region. It increases with increasing field and reaches 27% at 9 T and 10 K. The Hall resistivity data show the multi-band character of the compound, where hole carriers are dominating at low temperatures and electron carriers at high temperatures. The electronic band structure calculations reveal the presence of a nodal line with drumhead surface states in kz = 0 plane, which is protected by the reflection symmetry.
V Acknowledgment
We acknowledge IIT Kanpur and the Department of Science and Technology, India, [Order No. DST/NM/TUE/QM-06/2019 (G)] for financial support. VK acknowledges IIT Hyderabad for its computational facility. JS was supported through CSIR scholarship. ZH acknowledges financial support from the Polish National Agency for Academic Exchange under Ulam fellowship. DK acknowledges financial support by the National Science Centre (Poland) under research grant 2021/41/B/ST3/01141.
References
- Paramanik et al. (2014) U. B. Paramanik, P. L. Paulose, S. Ramakrishnan, A. K. Nigam, C. Geibel, and Z. Hossain, Superconductor Science and Technology 27, 075012 (2014).
- Paramanik et al. (2016) U. B. Paramanik, A. Bar, D. Das, N. Caroca-Canales, R. Prasad, C. Geibel, and Z. Hossain, Journal of Physics: Condensed Matter 28, 166001 (2016).
- Schmiedeshoff et al. (2011) G. M. Schmiedeshoff, E. D. Mun, A. W. Lounsbury, S. J. Tracy, E. C. Palm, S. T. Hannahs, J.-H. Park, T. P. Murphy, S. L. Bud’ko, and P. C. Canfield, Phys. Rev. B 83, 180408 (2011).
- Das et al. (2014) D. Das, T. Gruner, H. Pfau, U. B. Paramanik, U. Burkhardt, C. Geibel, and Z. Hossain, Journal of Physics: Condensed Matter 26, 106001 (2014).
- Bonville et al. (2007) P. Bonville, M. Rams, K. Królas, J.-P. Sanchez, P. C. Canfield, O. Trovarelli, and C. Geibel, The European Physical Journal B 55, 77 (2007).
- Malick et al. (2022) S. Malick, J. Singh, A. Laha, V. Kanchana, Z. Hossain, and D. Kaczorowski, Phys. Rev. B 105, 045103 (2022).
- Nakamura et al. (2015) A. Nakamura, T. Uejo, F. Honda, T. Takeuchi, H. Harima, E. Yamamoto, Y. Haga, K. Matsubayashi, Y. Uwatoko, M. Hedo, T. Nakama, and Y. Ōnuki, Journal of the Physical Society of Japan 84, 124711 (2015).
- Liu et al. (2017) J. Y. Liu, J. Hu, Q. Zhang, D. Graf, H. B. Cao, S. M. A. Radmanesh, D. J. Adams, Y. L. Zhu, G. . F. Cheng, X. Liu, W. A. Phelan, J. Wei, M. Jaime, F. Balakirev, D. A. Tennant, J. F. DiTusa, I. Chiorescu, L. Spinu, and Z. Q. Mao, Nature Materials 16, 905 (2017).
- Suzuki et al. (2016) T. Suzuki, R. Chisnell, A. Devarakonda, Y.-T. Liu, W. Feng, D. Xiao, J. . W. Lynn, and J. . G. Checkelsky, Nature Physics 12, 1119 (2016).
- Puphal et al. (2020) P. Puphal, V. Pomjakushin, N. Kanazawa, V. Ukleev, D. J. Gawryluk, J. Ma, M. Naamneh, N. C. Plumb, L. Keller, R. Cubitt, E. Pomjakushina, and J. S. White, Phys. Rev. Lett. 124, 017202 (2020).
- Bruno et al. (2004) P. Bruno, V. K. Dugaev, and M. Taillefumier, Phys. Rev. Lett. 93, 096806 (2004).
- Wang et al. (2019) W. Wang, M. W. Daniels, Z. Liao, Y. Zhao, J. Wang, G. Koster, G. Rijnders, C.-Z. Chang, D. Xiao, and W. Wu, Nature Materials 18, 1054 (2019).
- Neubauer et al. (2009) A. Neubauer, C. Pfleiderer, B. Binz, A. Rosch, R. Ritz, P. G. Niklowitz, and P. Böni, Phys. Rev. Lett. 102, 186602 (2009).
- Kanazawa et al. (2011) N. Kanazawa, Y. Onose, T. Arima, D. Okuyama, K. Ohoyama, S. Wakimoto, K. Kakurai, S. Ishiwata, and Y. Tokura, Phys. Rev. Lett. 106, 156603 (2011).
- Sürgers et al. (2014) C. Sürgers, G. Fischer, P. Winkel, and H. v. Löhneysen, Nature Communications 5, 3400 (2014).
- Vistoli et al. (2019) L. Vistoli, W. Wang, A. Sander, Q. Zhu, B. Casals, R. Cichelero, A. Barthélémy, S. Fusil, G. Herranz, S. Valencia, R. Abrudan, E. Weschke, K. Nakazawa, H. Kohno, J. Santamaria, W. Wu, V. Garcia, and M. Bibes, Nature Physics 15, 67 (2019).
- Laha et al. (2021) A. Laha, R. Singha, S. Mardanya, B. Singh, A. Agarwal, P. Mandal, and Z. Hossain, Phys. Rev. B 103, L241112 (2021).
- Ohuchi et al. (2015) Y. Ohuchi, Y. Kozuka, M. Uchida, K. Ueno, A. Tsukazaki, and M. Kawasaki, Phys. Rev. B 91, 245115 (2015).
- Machida et al. (2007) Y. Machida, S. Nakatsuji, Y. Maeno, T. Tayama, T. Sakakibara, and S. Onoda, Phys. Rev. Lett. 98, 057203 (2007).
- Pöttgen et al. (1998) R. Pöttgen, G. Kotzyba, and E. A. Görlich, Journal of Solid State Chemistry 141, 352 (1998).
- Baran et al. (1998) S. Baran, M. Hofmann, J. Leciejewicz, B. Penc, M. Ślaski, and A. Szytuła, Journal of Alloys and Compounds 281, 92 (1998).
- Morosan et al. (2004) E. Morosan, S. Bud’ko, P. Canfield, M. Torikachvili, and A. Lacerda, Journal of Magnetism and Magnetic Materials 277, 298 (2004).
- Goddard et al. (2007) P. A. Goddard, J. Singleton, A. L. Lima Sharma, E. Morosan, S. J. Blundell, S. L. Bud’ko, and P. C. Canfield, Phys. Rev. B 75, 094426 (2007).
- Chang et al. (2018) G. Chang, B. Singh, S.-Y. Xu, G. Bian, S.-M. Huang, C.-H. Hsu, I. Belopolski, N. Alidoust, D. S. Sanchez, H. Zheng, H. Lu, X. Zhang, Y. Bian, T.-R. Chang, H.-T. Jeng, A. Bansil, H. Hsu, S. Jia, T. Neupert, H. Lin, and M. Z. Hasan, Phys. Rev. B 97, 041104 (2018).
- Destraz et al. (2020) D. Destraz, L. Das, S. S. Tsirkin, Y. Xu, T. Neupert, J. Chang, A. Schilling, A. G. Grushin, J. Kohlbrecher, L. Keller, P. Puphal, E. Pomjakushina, and J. S. White, npj Quantum Materials 5, 5 (2020).
- Sanchez et al. (2020) D. S. Sanchez, G. Chang, I. Belopolski, H. Lu, J.-X. Yin, N. Alidoust, X. Xu, T. A. Cochran, X. Zhang, Y. Bian, S. S. Zhang, Y.-Y. Liu, J. Ma, G. Bian, H. Lin, S.-Y. Xu, S. Jia, and M. Z. Hasan, Nature Communications 11, 3356 (2020).
- Hodovanets et al. (2018) H. Hodovanets, C. J. Eckberg, P. Y. Zavalij, H. Kim, W.-C. Lin, M. Zic, D. J. Campbell, J. S. Higgins, and J. Paglione, Phys. Rev. B 98, 245132 (2018).
- Meng et al. (2019) B. Meng, H. Wu, Y. Qiu, C. Wang, Y. Liu, Z. Xia, S. Yuan, H. Chang, and Z. Tian, APL Materials 7, 051110 (2019).
- Bud’ko et al. (2004) S. L. Bud’ko, E. Morosan, and P. C. Canfield, Phys. Rev. B 69, 014415 (2004).
- Bud’ko et al. (2005) S. L. Bud’ko, E. Morosan, and P. C. Canfield, Phys. Rev. B 71, 054408 (2005).
- Tokiwa et al. (2013) Y. Tokiwa, M. Garst, P. Gegenwart, S. L. Bud’ko, and P. C. Canfield, Phys. Rev. Lett. 111, 116401 (2013).
- Hohenberg and Kohn (1964) P. Hohenberg and W. Kohn, Phys. Rev. 136, B864 (1964).
- Kohn and Sham (1965) W. Kohn and L. J. Sham, Phys. Rev. 140, A1133 (1965).
- Blöchl (1994) P. E. Blöchl, Phys. Rev. B 50, 17953 (1994).
- Kresse and Furthmüller (1996) G. Kresse and J. Furthmüller, Phys. Rev. B 54, 11169 (1996).
- Kresse and Joubert (1999) G. Kresse and D. Joubert, Phys. Rev. B 59, 1758 (1999).
- Perdew et al. (1996) J. P. Perdew, K. Burke, and M. Ernzerhof, Phys. Rev. Lett. 77, 3865 (1996).
- Petersen et al. (2006) M. Petersen, J. Hafner, and M. Marsman, Journal of Physics: Condensed Matter 18, 7021 (2006).
- Li et al. (2015) Z. Li, H. Su, X. Yang, and J. Zhang, Phys. Rev. B 91, 235128 (2015).
- Monkhorst and Pack (1976) H. J. Monkhorst and J. D. Pack, Phys. Rev. B 13, 5188 (1976).
- Pizzi et al. (2020) G. Pizzi, V. Vitale, R. Arita, S. Blügel, F. Freimuth, G. Géranton, M. Gibertini, D. Gresch, C. Johnson, T. Koretsune, J. Ibañez-Azpiroz, H. Lee, J.-M. Lihm, D. Marchand, A. Marrazzo, Y. Mokrousov, J. I. Mustafa, Y. Nohara, Y. Nomura, L. Paulatto, S. Poncé, T. Ponweiser, J. Qiao, F. Thöle, S. S. Tsirkin, M. Wierzbowska, N. Marzari, D. Vanderbilt, I. Souza, A. A. Mostofi, and J. R. Yates, Journal of Physics: Condensed Matter 32, 165902 (2020).
- Wu et al. (2018) Q. Wu, S. Zhang, H.-F. Song, M. Troyer, and A. A. Soluyanov, Computer Physics Communications 224, 405 (2018).
- Sancho et al. (1985) M. P. L. Sancho, J. M. L. Sancho, J. M. L. Sancho, and J. Rubio, Journal of Physics F: Metal Physics 15, 851 (1985).
- Kosaka et al. (2020) M. Kosaka, S. Michimura, H. Hirabayashi, R. Numakura, R. Iizuka, K. Kuwahara, and Y. Uwatoko, Journal of the Physical Society of Japan 89, 054704 (2020).
- Bud’ko et al. (1999) S. Bud’ko, Z. Islam, T. Wiener, I. Fisher, A. Lacerda, and P. Canfield, Journal of Magnetism and Magnetic Materials 205, 53 (1999).
- Ramirez (1994) A. P. Ramirez, Annual Review of Materials Research 24, 453 (1994).
- (47) K. Umeo, H. Kubo, T. Onimaru, K. Katoh, and T. Takabatake, in Proceedings of the International Conference on Strongly Correlated Electron Systems (SCES2013).
- Gibson et al. (1996) B. Gibson, R. Pöttgen, R. K. Kremer, A. Simon, and K. R. Ziebeck, Journal of Alloys and Compounds 239, 34 (1996).
- Talik et al. (2006) E. Talik, J. Kusz, W. Hofmeister, M. Matlak, M. Skutecka, and M. Klimczak, Journal of Alloys and Compounds 423, 47 (2006).
- Matthias et al. (1963) B. T. Matthias, T. H. Geballe, and V. B. Compton, Rev. Mod. Phys. 35, 1 (1963).
- Rossiter (1987) P. L. Rossiter, The Electrical Resistivity of Metals and Alloys, Cambridge Solid State Science Series (Cambridge University Press, 1987).
- Moriya and Takimoto (1995) T. Moriya and T. Takimoto, Journal of the Physical Society of Japan 64, 960 (1995).
- Mukhopadhyay et al. (2021) A. Mukhopadhyay, K. Singh, S. Sen, K. Mukherjee, A. K. Nayak, and N. Mohapatra, Journal of Physics: Condensed Matter 33, 435804 (2021).
- Hu et al. (2016) J. Hu, Z. Tang, J. Liu, X. Liu, Y. Zhu, D. Graf, K. Myhro, S. Tran, C. N. Lau, J. Wei, and Z. Mao, Phys. Rev. Lett. 117, 016602 (2016).
- Sankar et al. (2017) R. Sankar, G. Peramaiyan, I. P. Muthuselvam, C. J. Butler, K. Dimitri, M. Neupane, G. N. Rao, M.-T. Lin, and F. C. Chou, Scientific Reports 7, 40603 (2017).
- Laha et al. (2019) A. Laha, S. Malick, R. Singha, P. Mandal, P. Rambabu, V. Kanchana, and Z. Hossain, Phys. Rev. B 99, 241102 (2019).
- Roy et al. (2021) S. Roy, R. Singha, A. Ghosh, and P. Mandal, Phys. Rev. Materials 5, 064203 (2021).
- Hyart et al. (2018) T. Hyart, R. Ojajärvi, and T. T. Heikkilä, Journal of Low Temperature Physics 191, 35 (2018).
- Laha et al. (2020) A. Laha, P. Rambabu, V. Kanchana, L. Petit, Z. Szotek, and Z. Hossain, Phys. Rev. B 102, 235135 (2020).
- Emmanouilidou et al. (2017) E. Emmanouilidou, B. Shen, X. Deng, T.-R. Chang, A. Shi, G. Kotliar, S.-Y. Xu, and N. Ni, Phys. Rev. B 95, 245113 (2017).