Effects of non-condensable gas on laser-induced cavitation bubbles
Abstract
This study presents experimental observations of single laser-induced cavitation bubbles collapsing in water with different levels of air saturation. The average trends of the bubble size reveal a clear yet little dependence of the energy dissipation at collapse on the water gas content. Similarly, the observed trend of luminescence energy at collapse varies within the investigated range of air saturation levels, in agreement with findings in similar works. We argue that perturbations in bubble shape may amplify with decreasing air saturation, consequently affecting light emission.
The presence of dissolved gas in flowing liquids lowers their tensile strength and significantly influences cavitation occurrence Brennen (1995); Blander and Katz (1975); Plesset (1949); Amini et al. (2019). However, our understanding of the effect of the gas on cavitation bubble dynamics, the gas composition inside the bubbles, and the behaviour of the gas at the bubble-liquid interface, remains limited. Moreover, cavitation bubbles likely contain a mixture of condensable and non-condensable components, increasing the complexity for their investigation. To date, owing to the small scale both in time and space, direct probing of the bubble contents remains unrealistic, making only indirect measurements possible Brenner, Hilgenfeldt, and Lohse (2002); Flannigan et al. (2006); Akhatov et al. (2001); Keller and Miksis (1980). A comprehensive understanding of the effect of the gaseous content on cavitation bubble collapse is essential for the development of innovative cavitation-based technologies Suslick, Mdleleni, and Ries (1997), as well as for the improvement of advanced numerical models.
The role of dissolved gases on cavitation bubbles sparked considerable interest in the nineties, particularly in relation to studies on single bubble sonoluminescence. Several researches highlighted the importance of the nature and composition of the gaseous phase on the light emission from periodically-driven gas bubbles trapped in an acoustic field Barber et al. (1994); Gaitan et al. (1992); Hiller et al. (1994); Brujan et al. (2005); Gompf et al. (1997); Krefting, Mettin, and Lauterborn (2003); Young (1976); Toegel et al. (2000); Flannigan and Suslick (2005). However, the investigation of these bubbles is constrained to a limited parameter space, involving a narrow range of dissolved gas concentrations Brenner, Hilgenfeldt, and Lohse (2002); Wolfrum et al. (2001). Moreover, these bubbles allow long time scale phenomena, such as mass diffusion of dissolved gases, to become dominant Lohse et al. (1997); Baghdassarian, Tabbert, and Williams (1999). Here, the study of single transient cavitation bubbles, besides overcoming these challenges, is better suited for comparison with bubbles in cavitating flows Wolfrum et al. (2001); Ohl (2002).
Several numerical models have been proposed to elucidate the composition and behaviour of the gaseous phase within cavitation bubbles. Fujikawa and Akamatsu Fujikawa and Akamatsu (1980), who modeled the dynamics of single laser-induced bubbles, evidenced the effect of non-equilibrium condensation on the bubble dynamics due to the interaction of condensable vapour and non-condensable gas within the bubble. A similar model was also proposed by Akhatov et al. Akhatov et al. (2001), who reported that a small amount of non-condensable gas could significantly impact the bubble dynamics by hindering the condensation of vapours at the bubble-liquid interface. Similar numerical models have also been developed more recently Magaletti, Marino, and Casciola (2015); Fuster and Montel (2015); Hao, Zhang, and Prosperetti (2017); Szeri et al. (2003). Differently, experimental investigation performed by Baghdassarian, Tabbert, and Williams Baghdassarian, Tabbert, and Williams (1999) revealed no significant effects of the gas nature and concentration on the light emission at the collapse of single laser-induced bubbles. Successively, Wolfrum et al. Wolfrum et al. (2001) came also to the same conclusion. However, despite these findings, this facet has been largely overlooked in experimental studies Supponen et al. (2017), and knowledge in this area remains limited Liu et al. (2023).
This Letter aims to contribute to the ongoing discussion regarding the influence of non-condensable gases on the collapse of transient cavitation bubbles. We present experimental results of the dynamics of single laser-generated cavitation bubbles in water, in which we systematically varied the saturation level of dissolved air. Additionally, we collect and analyze the light emitted at the collapse of the bubbles. The main message of this Letter is that, despite observing some minor effects, the dissolved gas at the concentrations investigated exerts a virtually negligible effect on the bubble dynamics.
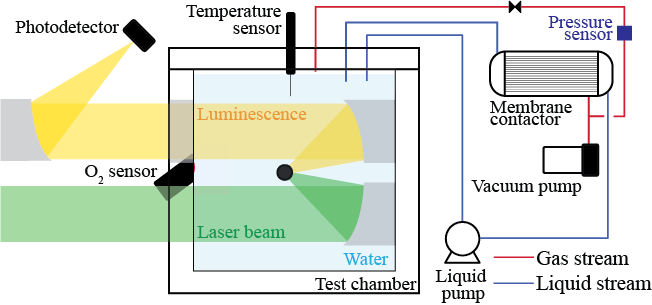
Our experimental setup, schematically illustrated in Figure 1, generates highly-spherical laser-induced cavitation bubbles using an immersed parabolic mirror Obreschkow et al. (2013); Supponen et al. (2019); Sieber, Preso, and Farhat (2022, 2023). The maximum bubble radius is approximately mm, with a variation of % due to natural laser energy oscillation. Such bubbles are weakly influenced by the hydrostatic pressure gradient and nearby solid surfaces, with an anisotropy parameter value of , and thus their collapse is largely spherical. Details about can be found in Obreschkow et al. Obreschkow et al. (2011) and Supponen et al. Supponen et al. (2016). The bubble is generated at the center of a transparent cubic test chamber, whose volume is large enough not to affect the bubble dynamics. The gas-tight test chamber is filled with distilled water and connected to a degassing system that controls the air saturation level in the water in a closed-loop configuration. The system includes a pump that recirculates water through the lumenside of a membrane contactor (3M Liqui-Cel Series), permeable by gases via a pressure-driven process. The pressure in the shellside of the contactor is adjusted with a vacuum pump and controlled with a pressure sensor. At equilibrium, the saturation level of water, expressed in molar concentration (moles of air per unit volume of water), is proportional with according to Henry’s law. The saturation level of water is monitored with a temperature-compensated oxygen meter (PreSens Fibox 3), whose sensor is placed in the test chamber at the same height as the bubble spot. During degassing operations, the pressure of the test chamber is reduced to limit diffusion of gas back into the water. Ambient pressure is only restored during the experimental timeframe, which remains short enough to prevent back-diffusion of air from the free surface down to the bubble location. Owing to the similar permeability of \ceO2 and \ceN2 through the membrane, we assume that the degassing rate of oxygen in the water is similar to the one of air. In this case, we can monitor the air saturation level by measuring the oxygen concentration in the water. In any case, after reaching oxygen equilibrium concentration, we extend the degassing process to ensure equilibrium for \ceN2 as well. The temperature of the water is maintained relatively constant, fluctuating between 24.6 and .
We resolve the bubble dynamics from shadowgrams captured at a rate of frames s-1 and an exposure time of ns with a high-speed camera (Shimadzu HPV-X2). We define the potential energy of the bubble as
| (1) |
where is the liquid pressure at rest, which equals the ambient pressure of 96.6 kPa, and the water vapour partial within the bubble, assumed equivalent to the vapour pressure of the water . The latter is obtained from tabulated values Green and Perry (2008). Likewise, we define the potential energy of the first rebound bubble as , where is the maximum radius of the rebound bubble.
We also capture luminescence signals at bubble generation and collapse using a photodetector (ThorLabs, DET10A/M Silicon Detector, 200-1100 nm wavelength, 1 ns rise time). The light emitted is collected by a second immersed parabolic mirror, and transmitted through a fused silica window onto a third parabolic mirror outside the test chamber, which focuses the light onto the photodetector. The silica window enhances ultraviolet transparency. This procedure is detailed elsewhere Supponen et al. (2017). Owing to the small size of the bubbles and the ensuing value of , we neglect the upward bubble displacement effect, omitting it for photodetector signal correction Supponen et al.. The light emitted at bubble generation and collapse provides an accurate measure of the bubble’s lifetime. Additionally, we compute the energy of the luminescence signal at collapse as
| (2) |
where is the electric signal obtained from the photodetector, and is a calibration constant which is not available for our experimental setup. Consequently, is reported in arbitrary units. Assuming a uniform light emission in the solid angle 4 sr, is multiplied by a constant as the parabolic mirror collects only around 6.7% of the total emitted light.
We utilize the Keller-Miksis model Keller and Miksis (1980) to fit the experimental data of the bubble oscillation up to the first rebound and estimate the bubble’s internal pressure . The latter is described as , where is the bubble radius, is the non-condensable gas partial pressure within the bubble at maximum expansion, and its heat capacity ratio. A detailed explanation on fitting the bubble pressure from experimental data with the Keller-Miksis model is available elsewhere Preso et al. (2024).
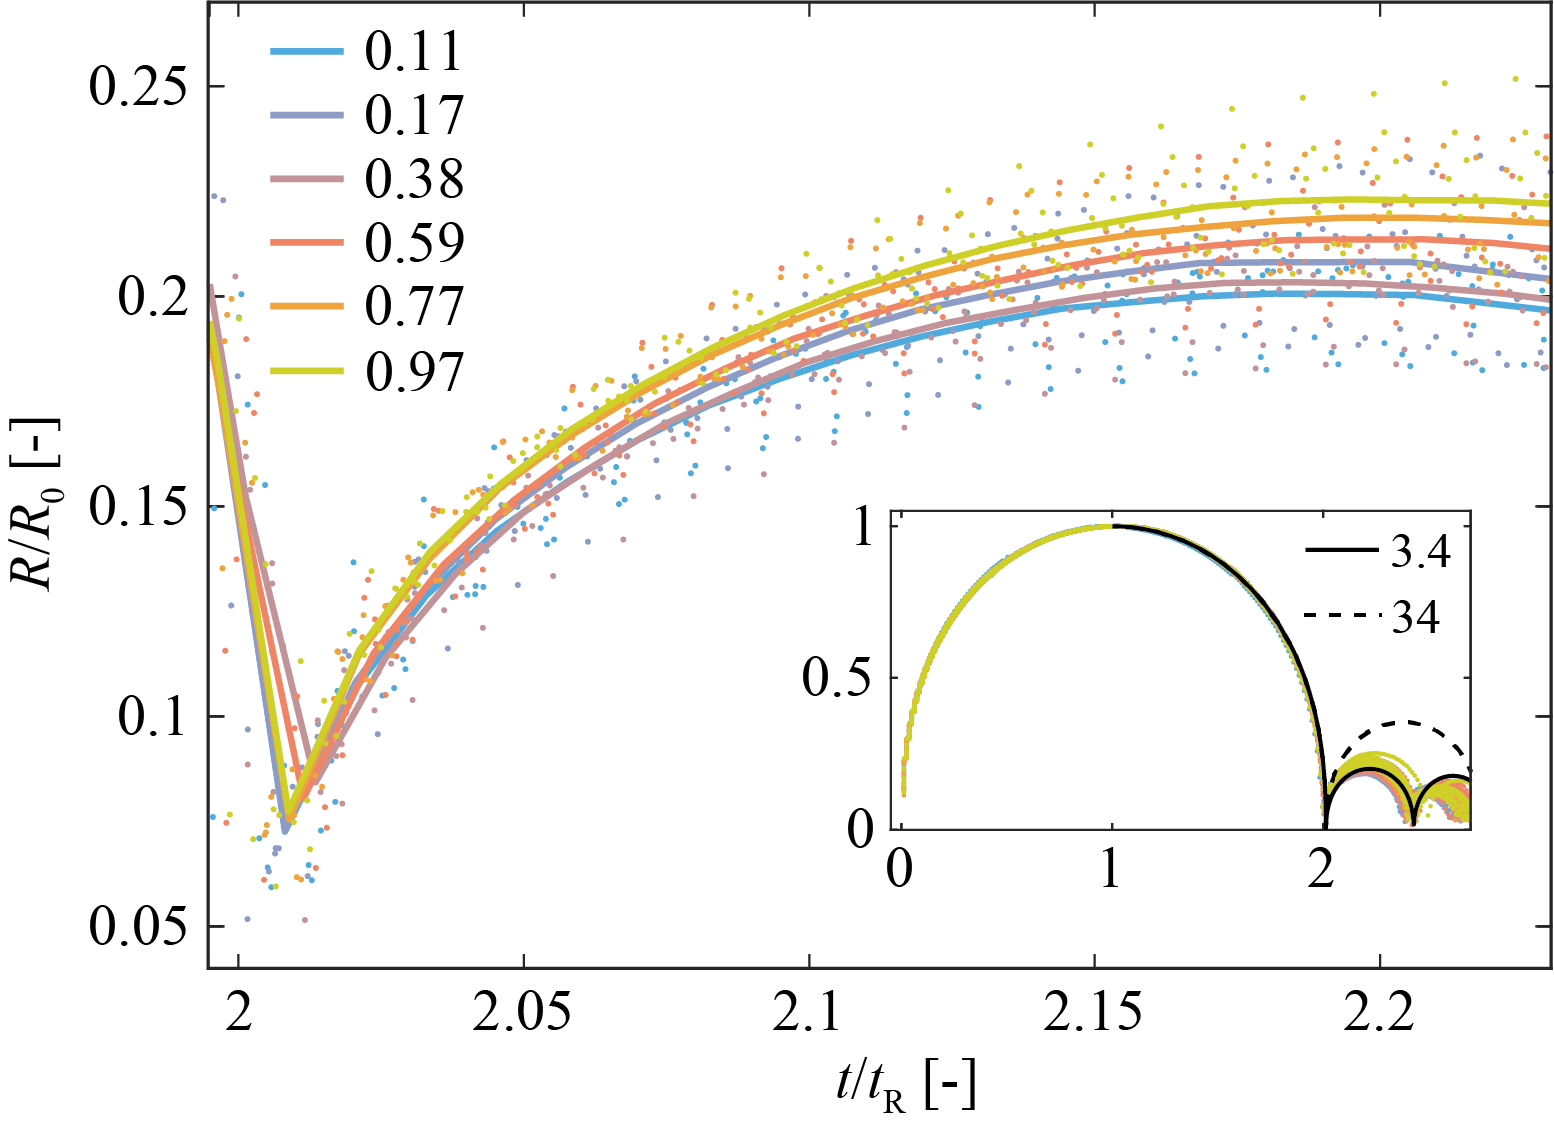
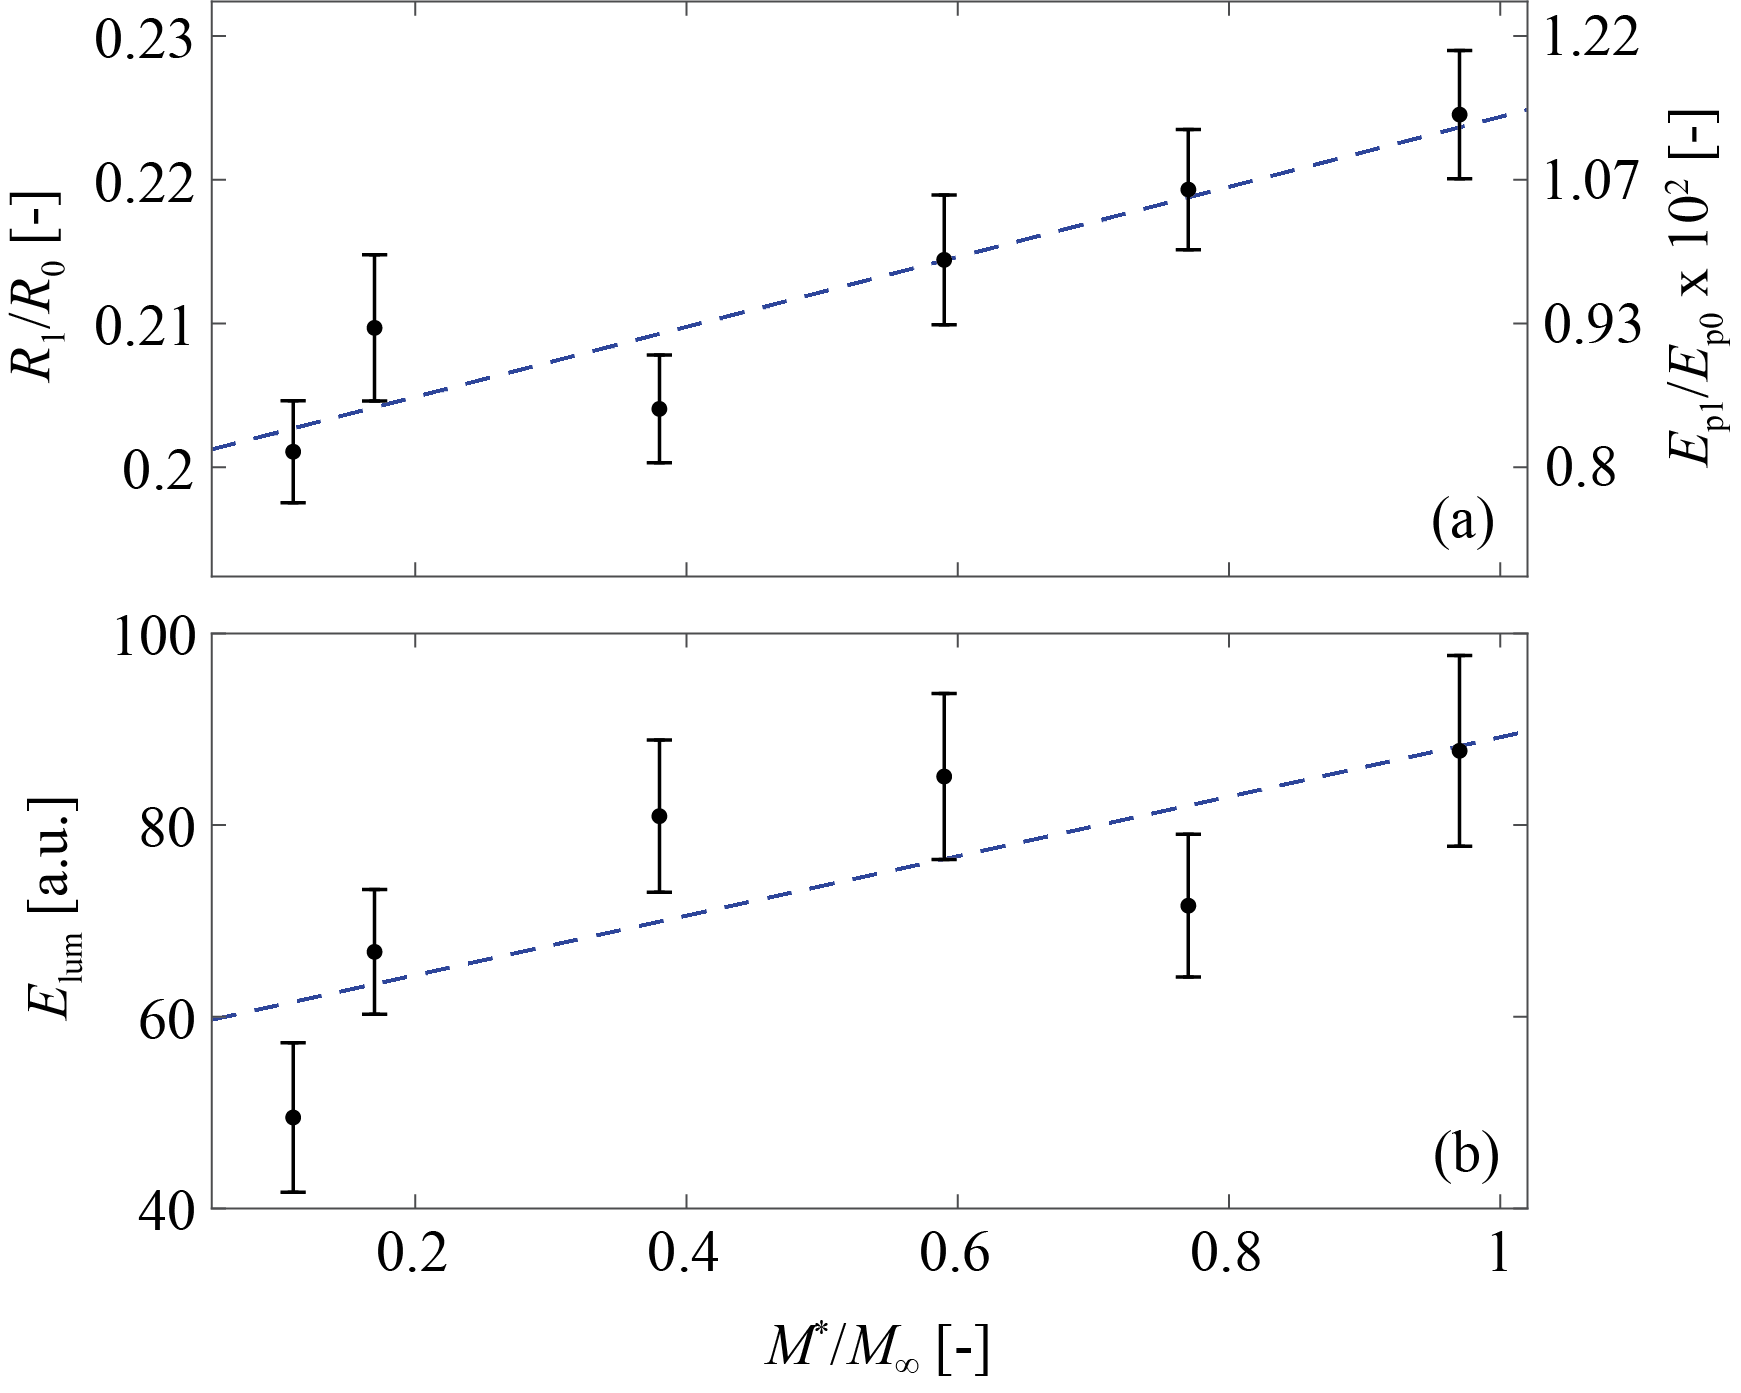
Figure 2 shows, in normalized coordinates, the temporal evolution of the radius of cavitation bubbles generated in water at different air saturation , where is the saturation at equilibrium at and . Here, is the Rayleigh collapse time for a single empty cavitation bubble Rayleigh (1917), with representing the water density. The inset plot in Figure 2 provides an overview of the bubble growth, collapse, and rebounds, while the main plot zooms in on the final stage of the collapse and the first rebound. As displayed, the collapse appears nearly identical among all bubbles (10 measurements for each saturation level), although data of rebound bubbles are very disperse. Nonetheless, the averaged radial evolution, depicted by the solid lines, reveals small differences of the rebound size depending on the air saturation level of the water. From to , the average maximum radius of the rebound bubble progressively increases by approximately 12%. This trend is more clearly represented in Figure 3(a), which illustrates the normalized maximum radius of the rebound bubble as a function of . In terms of energy, the variation in rebound size is insignificant. On average, bubbles generated in water at received only 0.3% more than those at .
Regarding the collapse time, we observe no significant impact of the air saturation of the water, despite the accuracy of the photodetector.
Fitting the bubble’s internal pressure from the experimental results with the Keller-Miksis model reveals that varies on average between 3.4 and 5.4 Pa from the least to the most saturated water investigated. Under the model’s assumption, these results demonstrate that a tenfold augmentation in dissolved gas in the water does not translate into the same increase for . This is also evident in the inset plot in Figure 2, where we plotted the Keller-Miksis model predictions with Pa alongside the solution at 34 Pa.
Although luminescence data are also considerably dispersed, the average luminescence signal energy also increases with rising air saturation level. The trend is illustrated in Figure 3(b), where, on average, strongly increases from the lowest to the highest explored.
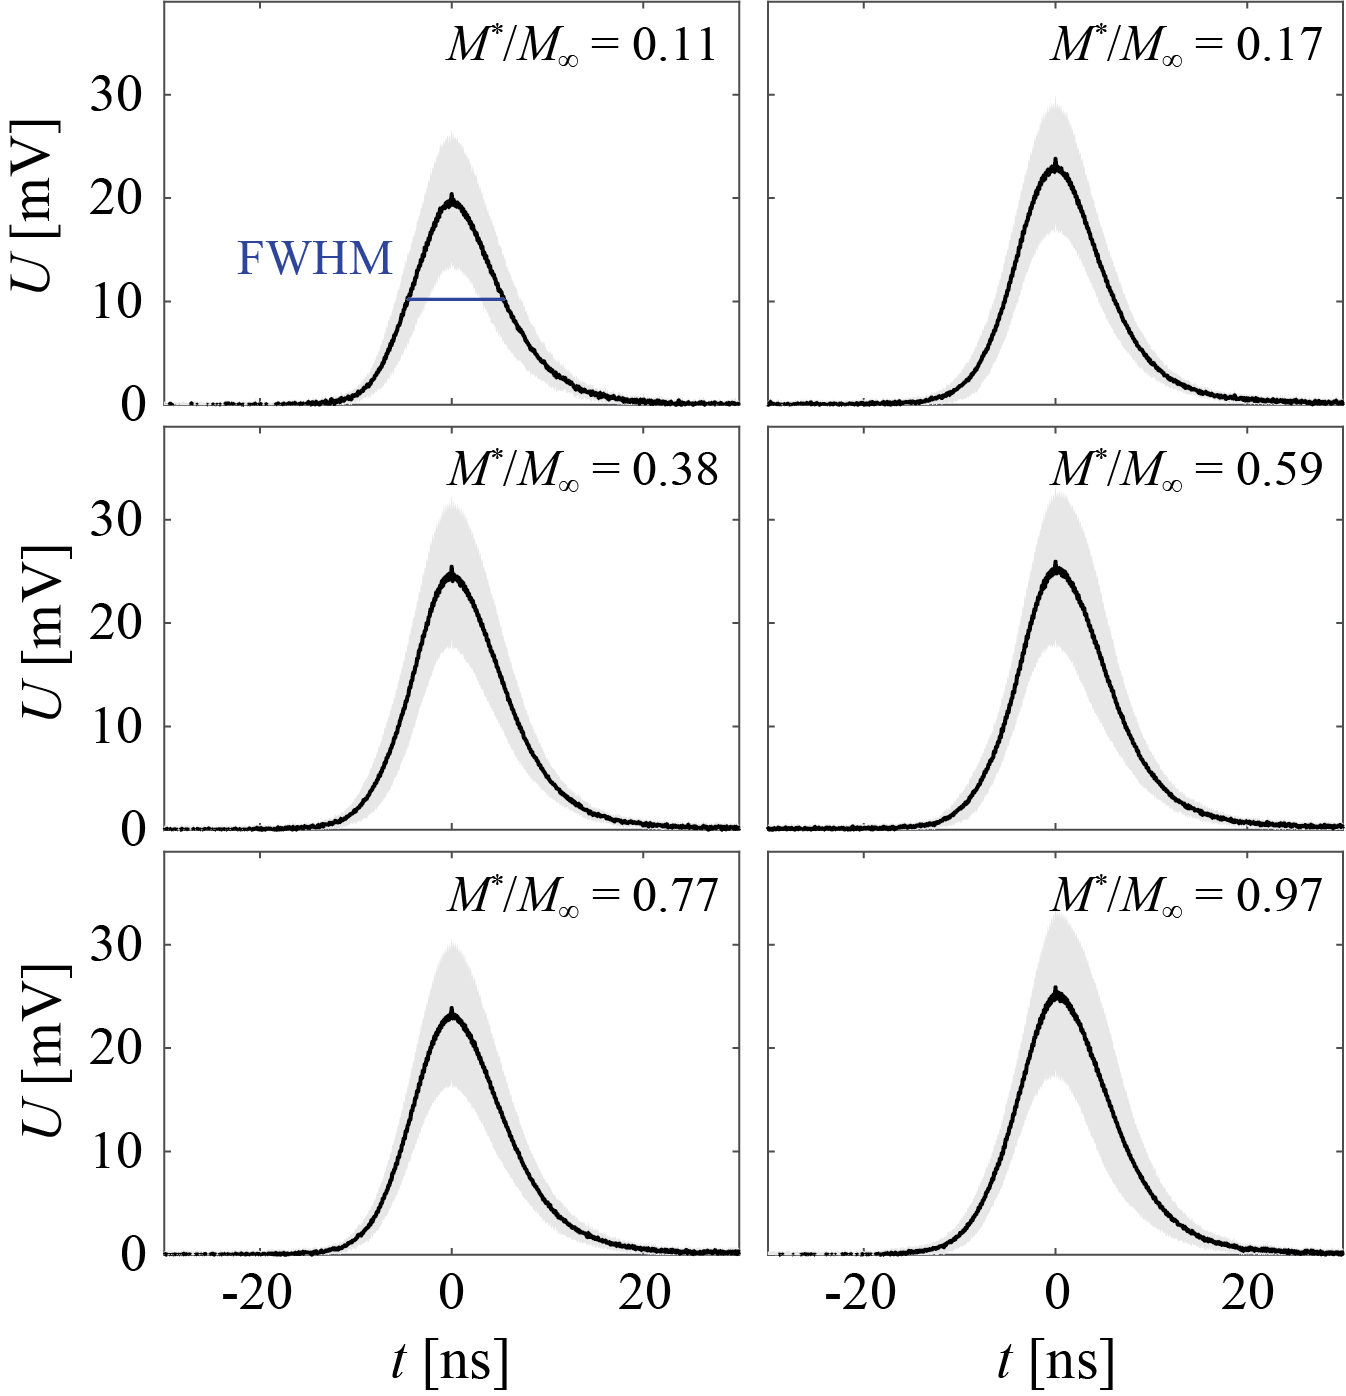
Raw luminescence signals collected by the photodetector are presented in Figure 4. The averages of the photodetector signals at different air saturation levels are consistent with signals from similar bubbles reported in previous works Supponen et al. (2017); Baghdassarian, Tabbert, and Williams (1999), with a full width at half-maximum of approximately 10 ns. A noteworthy observation is the detection of a single peak for every bubble, indicating a highly spherical collapse and light radiation from a single emission region Ohl (2002); Supponen et al. (2017); Sukovich et al. (2012). Moreover, it is interesting to observe the neat bell-like shape of the signal, also synonymous with spherical collapse. Supponen et al. Supponen et al. (2017) observed multiple peaks in the luminescence signal for deformed bubbles.
The significant scatter observed in rebound size and light emission at collapse (Figure 2 and 3) is likely due to the poorly repeatable phenomena occurring in the last stage of the collapse. This phenomena are probably influenced by variable absorbed energy at bubble generation, initial plasma anisotropies, bubble asymmetries, liquid impurities, and bubble shape perturbations. However, the average maximum rebound size and luminescence energy were found to be dependent on . The observed trends are most likely due to the variation of the partial pressure of non-condensable gas within the bubble, resulting from (i) vaporization of dissolved gas at initial plasma generation, (ii) plasma recombination, and (iii) gas diffusion from the liquid Supponen et al. (2017); Liang et al. (2022). Gas generated from plasma recombination is proportional to the laser energy deposited at bubble generation Supponen, Obreschkow, and Farhat (2018); Sato et al. (2013) and we assume no variation with the gas saturation of the water. In a study by Sato et al. Sato et al. (2013), who investigated bubbles similar in size to those reported in this work, hydrogen resulting from plasma recombination was observed to be in the order of grams. The initiation plasma, on the other hand, vaporizes approximately to grams of air in water at ranging from around 0.1 to 1 using the approach of Baghdassarian, Tabbert, and Williams Baghdassarian, Tabbert, and Williams (1999). Estimation of gas due to diffusion from the liquid into the bubbles suggests a total mass inflow in the order of grams, which does not appreciably alter the bubble content Baghdassarian, Tabbert, and Williams (1999); Plesset (1949); Brenner, Hilgenfeldt, and Lohse (2002). Therefore, contributions from (i) and (ii) are likely to be preponderant. Moreover, these calculations show that a tenfold increase of air saturation in the water is synonym with approximately a ten times augmentation of the non-condensable gas partial pressure within the bubble. Interestingly, these values do not match the bubble’s internal pressure returned by the Keller-Miksis model Keller and Miksis (1980), which predicts a 60% increase of from the least to the most saturated water exploited.
Although we cannot rule out the possibility that the differences in rebound size are simply a minimal damping effect of the non-condensable gas partial pressure within the bubble, we have reasons to consider an alternative scenario. During the experiments, the vapour pressure of the water randomly varied by approximately 56 Pa, as a consequence of the water temperature variation of 0.3 degrees. Although we could expect variations in the dissolved gas for the same reason, we assume them to be negligible in this range. The effect of the non-condensable gas appears then to be dominant, as a relatively big augmentation of the vapour pressure with respect to the non-condensable gas partial pressure did not alter the observed trend in bubble dynamics. These results align with predictions from the models proposed by Fujikawa and Akamatsu Fujikawa and Akamatsu (1980) and Akhatov et al. Akhatov et al. (2001), who suggested that a small fraction of non-condensable gas in the bubble could hinder the vapour condensation during the collapse, playing a major role in the bubble dynamics. Consequently, a small increment of the non-condensable gas may result in a larger rebound bubble compared to the one resulting from a relatively large increase of vapour.
Furthermore, while one might expect a decreasing luminescence signal energy with increasing gas content due to the gas cushioning effect on the collapse, and the possible entrainment of more vapor during collapse Akhatov et al. (2001), leading to a larger partial vapor pressure that could quench the bubble collapse and decrease Brenner, Hilgenfeldt, and Lohse (2002); Moss et al. (1999), our results align with the observations of Hiller et al. Hiller et al. (1994) and Gompf et al. Gompf et al. (1997) on sonoluminescence. They reported that light emission decreased with decreasing air saturation. On the contrary, this is in contrast to the aforementioned works of Baghdassarian, Tabbert, and Williams Baghdassarian, Tabbert, and Williams (1999) and Wolfrum et al. Wolfrum et al. (2001), who did not find any clear trend of luminescence with gas concentration. However, it is important to note that they did not perform a statistical analysis of the collected data, as was done in this work. One of the possible explanations worth considering is related to the growth of surface perturbations around the bubble Brennen (2002); Plesset (1949); Supponen et al. (2017). These perturbations may diminish the light emission in single transient cavitation bubbles, similarly to what occurs in single bubble sonoluminescence Brenner, Hilgenfeldt, and Lohse (2002). A smaller non-condensable gas partial pressure, which may imply a smaller vapour partial pressure, allows for greater shrinkage of the bubble at collapse, promoting a larger deviation from sphericity in the final collapse stage Plesset (1949). Consequently, this may lead to a less efficient compression of the bubble contents, particularly affecting the more sensitive luminescence phenomena.
In conclusion, the observed variation in the average dynamics of cavitation bubbles in water at typical air saturation levels is limited. However, even minor alterations in the behavior of one single bubble could have a pronounced impact on applications susceptible to cavitation, such as cavitation erosion, which deserve more investigation. Furthermore, these findings may help improving sonochemical applications, given the increased luminescence energy observed at bubble collapse in more saturated solutions. Finally, these results could also be valuable for the development of more sophisticated numerical tools.
Acknowledgements.
We acknowledge support by the MSCA-ITN of the EU Horizon 2020 Research and Innovation program (Grant Agreement No. 813766) and by the Swiss National Science Foundation (Grant No. 179018).Conflict of Interest
The authors have no conflicts to disclose.
Author Contributions
Davide Bernardo Preso: Conceptualization; Formal analysis; Investigation; Methodology; Validation; Visualization; Writing - original draft. Daniel Fuster: Conceptualization; Formal analysis; Methodology; Supervision; Writing - review & editing. Armand Baptiste Sieber: Investigation; Methodology; Visualization; Writing - review & editing. Mohamed Farhat: Conceptualization; Formal analysis; Funding acquisition; Project administration; Supervision; Writing - review & editing.
Data Availability Statement
The data that support the findings of this study are available from the corresponding author upon reasonable request.
References
- Brennen (1995) C. E. Brennen, Cavitation and Bubble Dynamics (Oxford University Press, 1995).
- Blander and Katz (1975) M. Blander and J. L. Katz, “Bubble nucleation in liquids,” AIChE Journal 21(5) (1975).
- Plesset (1949) M. S. Plesset, “The dynamics of cavitation bubbles,” Journal of Applied Mechanics 16, 277–282 (1949).
- Amini et al. (2019) A. Amini, M. Reclari, T. Sano, M. Iino, M. Dreyer, and M. Farhat, “On the physical mechanism of tip vortex cavitation hysteresis,” Experiments in Fluids 60, 118 (2019).
- Brenner, Hilgenfeldt, and Lohse (2002) M. P. Brenner, S. Hilgenfeldt, and D. Lohse, “Single-bubble sonoluminescence,” Reviews of Modern Physics 74, 425–484 (2002).
- Flannigan et al. (2006) D. J. Flannigan, S. D. Hopkins, C. G. Camara, S. J. Putterman, and K. S. Suslick, “Measurement of pressure and density inside a single sonoluminescing bubble,” Physical Review Letters 96, 204301 (2006).
- Akhatov et al. (2001) I. Akhatov, O. Lindau, A. Topolnikov, R. Mettin, N. Vakhitova, and W. Lauterborn, “Collapse and rebound of a laser-induced cavitation bubble,” Physics of Fluids 13, 2805 (2001).
- Keller and Miksis (1980) J. B. Keller and M. Miksis, “Bubble oscillations of large amplitude,” The Journal of the Acoustical Society of America 68, 628–633 (1980).
- Suslick, Mdleleni, and Ries (1997) K. S. Suslick, M. M. Mdleleni, and J. T. Ries, “Chemistry induced by hydrodynamic cavitation,” Journal of the American Chemical Society 119, 9303–9304 (1997).
- Barber et al. (1994) B. P. Barber, C. C. Wu, R. Löfsted, P. H. Roberts, and S. J. Putterman, “Sensitivity of sonoluminescence to experimental parameters,” Physical Review Letters 72, 1380–1383 (1994).
- Gaitan et al. (1992) D. F. Gaitan, L. A. Crum, C. C. Church, and R. A. Roy, “Sonoluminescence and bubble dynamics for a single, stable, cavitation bubble,” The Journal of the Acoustical Society of America 91, 3166–3183 (1992).
- Hiller et al. (1994) R. Hiller, K. Weninger, S. J. Putterman, and B. P. Barber, “Effect of noble gas doping in single-bubble sonoluminescence,” Science 266, 248–250 (1994).
- Brujan et al. (2005) E. A. Brujan, D. S. Hecht, F. Lee, and G. A. Williams, “Properties of luminescence from laser-created bubbles in pressurized water,” Physical Review E 72, 066310 (2005).
- Gompf et al. (1997) B. Gompf, R. Günther, G. Nick, R. Pecha, and W. Eisenmenger, “Resolving sonoluminescence pulse width with time-correlated single photon counting,” Physical Review Letters 79, 1405–1408 (1997).
- Krefting, Mettin, and Lauterborn (2003) D. Krefting, R. Mettin, and W. Lauterborn, “Single-bubble sonoluminescence in air-saturated water,” Physical Review Letters 91, 174301 (2003).
- Young (1976) F. R. Young, “Sonoluminescence from water containing dissolved gases,” The Journal of the Acoustical Society of America 60, 100 (1976).
- Toegel et al. (2000) R. Toegel, B. Gompf, R. Pecha, and D. Lohse, “Does water vapor prevent upscaling sonoluminescence?” Physical Review Letters 85, 3165–3168 (2000).
- Flannigan and Suslick (2005) D. J. Flannigan and K. S. Suslick, “Plasma formation and temperature measurement during single-bubble cavitation,” Nature 434, 52–55 (2005).
- Wolfrum et al. (2001) B. Wolfrum, T. Kurz, O. Lindau, and W. Lauterborn, “Luminescence of transient bubbles at elevated ambient pressures,” Physical Review E 64, 046306 (2001).
- Lohse et al. (1997) D. Lohse, M. P. Brenner, T. F. Dupont, S. Hilgenfeldt, and B. Johnston, “Sonoluminescing air bubbles rectify argon,” Physical Review Letters 78, 1359–1362 (1997).
- Baghdassarian, Tabbert, and Williams (1999) O. Baghdassarian, B. Tabbert, and G. A. Williams, “Luminescence characteristics of laser-induced bubbles in water,” Physical Review Letters 83, 2437 (1999).
- Ohl (2002) C.-D. Ohl, “Probing luminescence from nonspherical bubble collapse,” Physics of Fluids 14, 2700 (2002).
- Fujikawa and Akamatsu (1980) S. Fujikawa and T. Akamatsu, “Effects of the non-equilibrium condensation of vapour on the pressure wave produced by the collapse of a bubble in a liquid,” Journal of Fluid Mechanics 97, 481–512 (1980).
- Magaletti, Marino, and Casciola (2015) F. Magaletti, L. Marino, and C. M. Casciola, “Shock wave formation in the collapse of a vapor nanobubble,” Physical Review Letter 114, 064501 (2015).
- Fuster and Montel (2015) D. Fuster and F. Montel, “Mass transfer effects on linear wave propagation in diluted bubbly liquids,” Journal of Fluid Mechanics 779, 598–621 (2015).
- Hao, Zhang, and Prosperetti (2017) Y. Hao, Y. Zhang, and A. Prosperetti, “Mechanics of gas-vapor bubbles,” Physical Review Fluids 2, 034303 (2017).
- Szeri et al. (2003) J. A. Szeri, B. D. Storey, A. Pearson, and J. R. Blake, “Heat and mass transfer during the violent collapse of nonspherical bubbles,” Physics of Fluids 15, 2576 (2003).
- Supponen et al. (2017) O. Supponen, D. Obreschkow, P. Kobel, and M. Farhat, “Luminescence from cavitation bubbles deformed in uniform pressure gradients,” Physical Review E 96, 033114 (2017).
- Liu et al. (2023) S. Liu, K. Nitto, O. Supponen, S. Kamata, T. Nakajima, M. Farhat, and T. Sato, “Plasma-based identification of gases in a laser-induced cavitation bubble,” Applied Physics Letters 123, 094102 (2023).
- Obreschkow et al. (2013) D. Obreschkow, M. Tinguely, N. Dorsaz, P. Kobel, A. de Bosset, and M. Farhat, “The quest for the most spherical bubble: experimental setup and data overview,” Experiments in Fluids 54(1503) (2013).
- Supponen et al. (2019) O. Supponen, D. Obreschkow, P. Kobel, N. Dorsaz, and M. Farhat, “Detailed experiments on weakly deformed cavitation bubbles,” Experiments in Fluids 60, 33 (2019).
- Sieber, Preso, and Farhat (2022) A. B. Sieber, D. B. Preso, and M. Farhat, “Dynamics of cavitation bubbles near granular boundaries,” Journal of Fluid Mechanics 947, A39 (2022).
- Sieber, Preso, and Farhat (2023) A. B. Sieber, D. B. Preso, and M. Farhat, “Cavitation bubble dynamics and microjet atomization near tissue-mimicking materials,” Physics of Fluids 35, 027101 (2023).
- Obreschkow et al. (2011) D. Obreschkow, M. Tinguely, N. Dorsaz, P. Kobel, A. de Bosset, and M. Farhat, “Universal scaling law for jets of collapsing bubbles,” Physical Review Letters 107, 204501 (2011).
- Supponen et al. (2016) O. Supponen, D. Obreschkow, M. Tinguely, P. Kobel, N. Dorsaz, and M. Farhat, “Scaling laws for jets of single cavitation bubbles,” Journal of Fluid Mechanics 802, 263–293 (2016).
- Green and Perry (2008) D. W. Green and R. H. Perry, Perry’s Chemical Engineers’ Handbook, 8 edition (McGraw-Hill, 2008).
- Preso et al. (2024) D. B. Preso, D. Fuster, A. B. Sieber, D. Obreschkow, and M. Farhat, “On the vapour compression in cavitation bubbles,” arXiv:2401.14253 (2024).
- Rayleigh (1917) L. Rayleigh, “On the pressure developed in a liquid during the collapse of a spherical cavity,” The London, Edinburgh, and Dublin Philosophical Magazine and Journal of Science 34:200, 94–98 (1917).
- Sukovich et al. (2012) J. R. Sukovich, A. Sampathkumar, P. A. Anderson, R. G. Holt, Y. A. Pishchalnikov, and D. F. Gaitan, “Temporally and spatially resolved imaging of laser-nucleated bubble cloud sonoluminescence,” Physical Review E 85, 056605 (2012).
- Liang et al. (2022) X.-X. Liang, N. Linz, S. Freidank, G. Paltauf, and A. Vogel, “Comprehensive analysis of spherical bubble oscillations and shock wave emission in laser-induced cavitation,” Journal of Fluid Mechanics 940, A5 (2022).
- Supponen, Obreschkow, and Farhat (2018) O. Supponen, D. Obreschkow, and M. Farhat, “Rebounds of deformed cavitation bubbles,” Physical Review Fluids 3, 103604 (2018).
- Sato et al. (2013) T. Sato, M. Tinguely, M. Oizumi, and M. Farhat, “Evidence for hydrogen generation in laser- or spark-induced cavitation bubbles,” Applied Physics Letters 102, 074105 (2013).
- Moss et al. (1999) W. C. Moss, D. A. Young, J. A. Harte, J. L. Levatin, B. F. Rozsnyai, G. B. Zimmerman, and I. H. Zimmerman, “Computed optical emissions from a sonoluminescing bubble,” Physical Review E 59, 2986–2992 (1999).
- Brennen (2002) C. E. Brennen, “Fission of collapsing cavitation bubbles,” Journal of Fluid Mechanics 472, 153–166 (2002).
- Akhatov et al. (2002) I. Akhatov, N. Vakhitova, A. Topolnikov, K. Zarikov, B. Wolfrum, T. Kurz, O. Lindau, R. Mettin, and W. Lauterborn, “Dynamics of laser-induced cavitation bubbles,” Experimental Thermal and Fluid Science 26, 731–737 (2002).
- Barber et al. (1997) B. P. Barber, R. A. Hiller, R. Löfsted, S. J. Putterman, and K. R. Weninger, “Defining the unknowns of sonoluminescence,” Physics Reports 281, 65–143 (1997).
- Hilgenfeldt, Grossmann, and Lohse (1999) S. Hilgenfeldt, S. Grossmann, and D. Lohse, “Sonoluminescence light emission,” Physics of Fluids 11, 1318 (1999).
- Ohl, Lindau, and Lauterborn (1998) C.-D. Ohl, O. Lindau, and W. Lauterborn, “Luminescence from spherically and aspherically collapsing laser induced bubbles,” Physical Review Letters 80, 393–396 (1998).
- Hiller, Putterman, and Weninger (1998) R. A. Hiller, S. J. Putterman, and K. R. Weninger, “Time-resolved spectra of sonoluminescence,” Physical Review Letters 80, 1090–1093 (1998).
- Sinibaldi et al. (2019) G. Sinibaldi, A. Occhicone, F. Alves Pereira, D. Caprini, L. Marino, F. Michelotti, and C. M. Casciola, “Laser induced cavitation: Plasma generation and breakdown shockwave,” Physics of Fluids 31, 103302 (2019).
- Hilgenfeldt, Lohse, and Brenner (1996) S. Hilgenfeldt, D. Lohse, and M. P. Brenner, “Phase diagrams for sonoluminescing bubbles,” Physics of Fluids 8, 2008 (1996).
- Vazquez and Putterman (2000) G. E. Vazquez and S. J. Putterman, “Temperature and pressure dependence of sonoluminescence,” Physical Review Letters 85, 3037–3040 (2000).