Understanding tip leakage noise
Abstract
The present study aims at advancing our understanding of the noise generated by tip leakage flow past a stationary aerofoil. To achieve this goal, aeroacoustic measurements using synchronized PIV and far-field microphone probes were conducted to establish the link between near-field velocity disturbances and far-field acoustic pressure. To aid in the correlation analysis, the wall boundary condition on the pressure side of the aerofoil was modified by introducing surface roughness.
For tip-leakage flows without roughness elements, the far-field acoustic spectra show peaks in the acoustic auto-spectra. These peaks are present regardless of the flow speed studied. The findings reveal that tones associated with tip-gap extend beyond previous measurements (3.5 kHz) to 16.5 kHz in a low-noise facility. Roughness alters cross-flow velocity along the aerofoil chord, influencing acoustics at matched Reynolds and Mach numbers. Roughness induces cancellation of spectral peaks and changes in correlation between far-field microphones. Modal shapes confirm the presence of coherent structures in the tip-gap region, with smooth surfaces exhibiting confined flow instabilities and quadrupolar noise sources around and beyond 10 kHz. These peaks cannot be uniquely attributed to coherent structures in the tip-gap region. In contrast, coherence between aerofoil sides is required for noise peaks, stressing the importance of the diffraction on the aerofoil pressure side. Acoustic peaks around 3.5 kHz, observed in various experiments, pose challenges for attribution solely to acoustics or aerodynamics.
keywords:
Authors should not enter keywords on the manuscript, as these must be chosen by the author during the online submission process and will then be added during the typesetting process (see Keyword PDF for the full list). Other classifications will be added at the same time.MSC Codes (Optional) Please enter your MSC Codes here
1 Introduction.
One of the main contributors to fan broadband noise is tip noise, which is generated through the interaction between tip vortices, the casing boundary layer, and the blade tip [Moreau, 2019]. The noise generated by the fan has become a major source of noise in modern ultra-high bypass ratio turbofans for civilian aircraft propulsion, due in part to the shorter nacelles on these systems, which have less surface area available for acoustic treatments [Moreau & Roger, 2018]. Furthermore, if the tangential velocity of these vortices is smaller than the local entrainment velocity, they may interact periodically with the blade yielding large subharmonic humps, as has been observed in low-speed fans [Moreau & Sanjosé, 2016]. Although tip leakage flow (TLF) has been extensively studied from an aerodynamic perspective, the mechanism by which it generates noise is still poorly understood [Saraceno et al., 2022]. Current analytical models do not provide accurate estimates of the far-field noise produced by TLF, indicating a lack of knowledge about its aero-acoustic noise generation. Therefore, present manuscript aims to further our understanding on the generation of tip leakage noise.
To optimize lifting devices sustainably, it is necessary to consider not only aerodynamic factors, but also the negative impact of aerodynamic noise on human health and comfort. Our limited understanding of TLF noise partly stems from the difficulty of distinguishing individual noise sources in a representative fan rig. To address this issue, Grilliat et al. [2007] proposed a mock-up consisting of a stationary, cambered aerofoil with a tip gap, to study its noise-generating mechanisms. Although the range of tip gaps studied to date may not be representative of a real turbofan, the mechanisms by which aerodynamic perturbations are converted into sound should be similar [Grilliat et al., 2007]. Using this setup, Grilliat et al. [2007] and Jacob et al. [2016] measured peaks in the acoustic far-field autospectra, while Saraceno et al. [2022] reported the presence of acoustic humps. While these differences may be due to variations in the frequency resolution used to calculate the autospectra of the far-field pressure, yet the origin of these peaks or humps in the acoustic far-field spectra is unclear. Are these peaks or humps caused by coherent structures related to some flow instability in the tip gap?
Saraceno et al. [2022] and Jacob et al. [2016] have noted that tip gap noise operates within the range of kHz. However, due to high background noise in their facilities, it was not possible to make acoustic measurements beyond kHz. While no Direct Numerical Simulation (DNS) has yet been performed for this case, Zonal Large-Eddy Simulations (ZLES) by Boudet et al. [2016] and Large-Eddy Simulations (LES) by Koch et al. [2021] have achieved good agreement with experiments. The latter also suggested that both the tip leakage vortex and the tip separation vortex contribute to tip noise generation. However, these simulations rely on the use of acoustic analogies to estimate far-field noise, and with a LES resolution, high-frequency source terms cannot be fully resolved. Therefore, it is unclear whether tip noise operates only within the kHz range or whether it can contribute to noise at higher frequencies?
Therefore, the objective of the present study is two-fold:
1) Explore the range in which the tip noise operates.
2) Provide experimental evidence on the genesis of humps or tones in the acoustic spectra.
To this end, aeroacoustic measurements were performed in the anechoic flow facility at Université de Sherbrooke. In particular, planar PIV measurements at the tip gap and pressure measurements at an acoustic far-field location were performed in a synchronised manner. Lastly, all previous studies have been conducted at a high angle of attack, which does not reflect the actual TLF induced by a fan operating at its design condition. Therefore, in the present study measurements are performed at a fixed geometric angle of attack of for the controlled diffusion (CD) aerofoil, which corresponds to an on-design flow conditions for this specific aerofoil geometry used in multiple turbomachinery applications (both low-speed and high-speed fans and compressors).
2 Experimental Set-up and Instrumentation:
All the measurements were performed in the anechoic wind tunnel at Université de Sherbrooke (UdeS). The anechoic wind tunnel consists of an anechoic room, which is about m3 in dimension and is coupled with an open-jet with a nozzle size of cm2. The maximum turbulence intensity of the facility is less than .
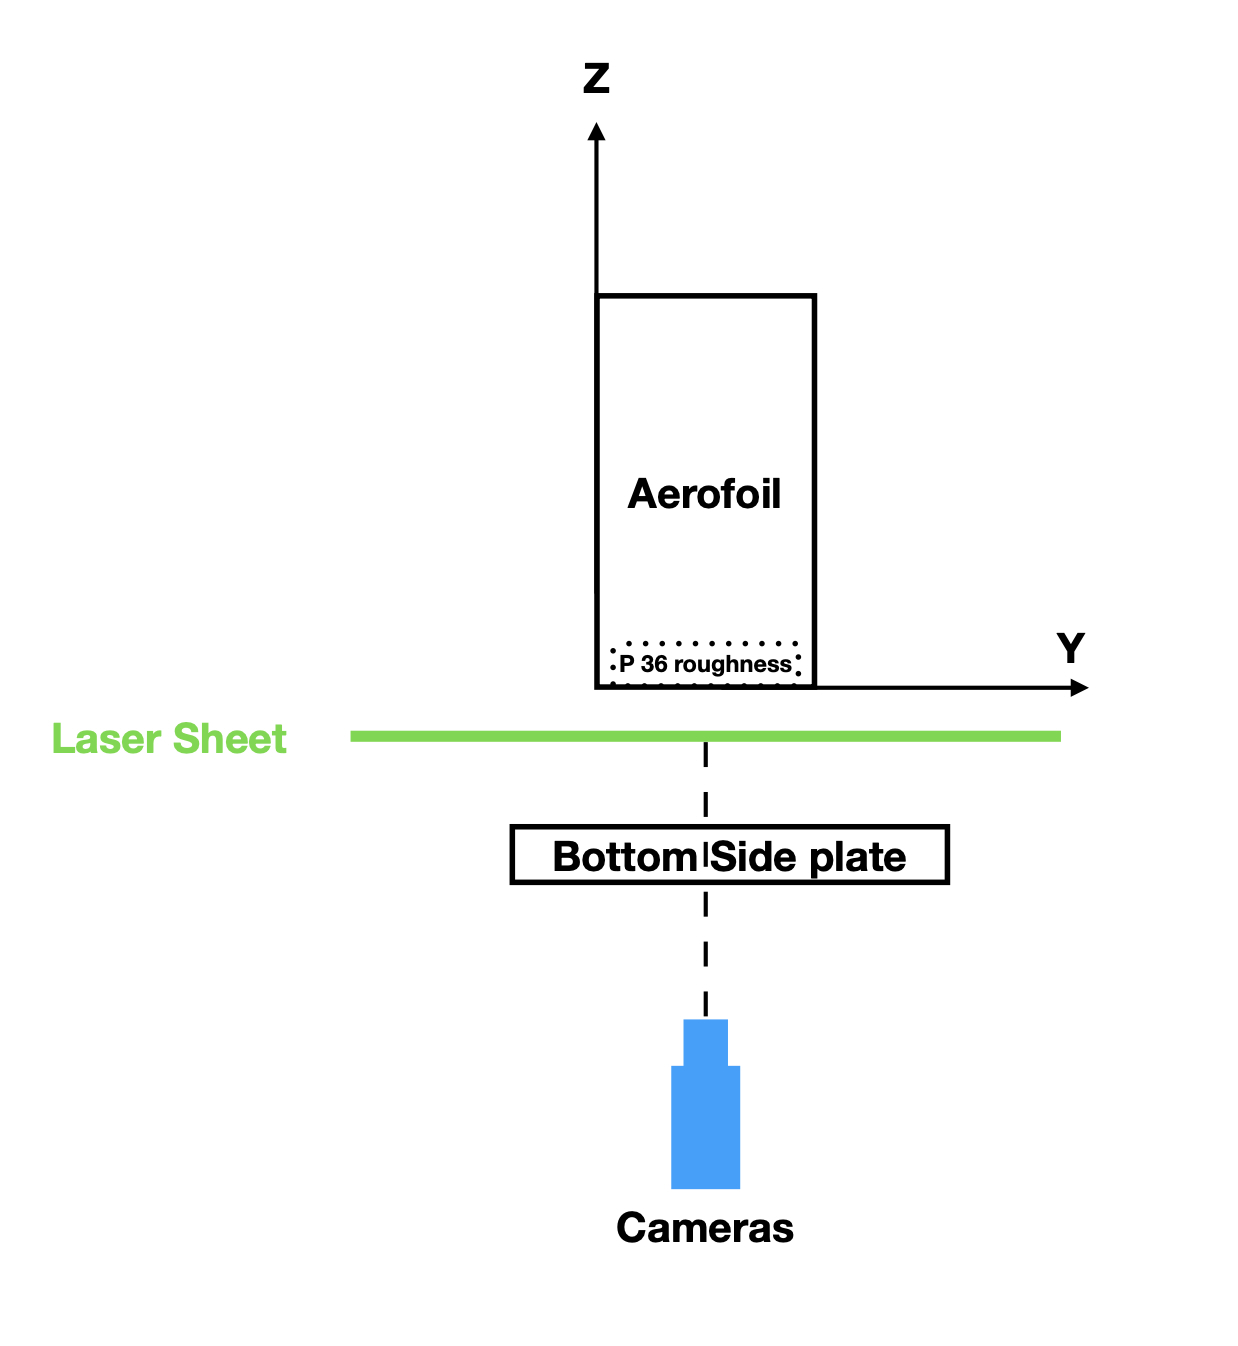
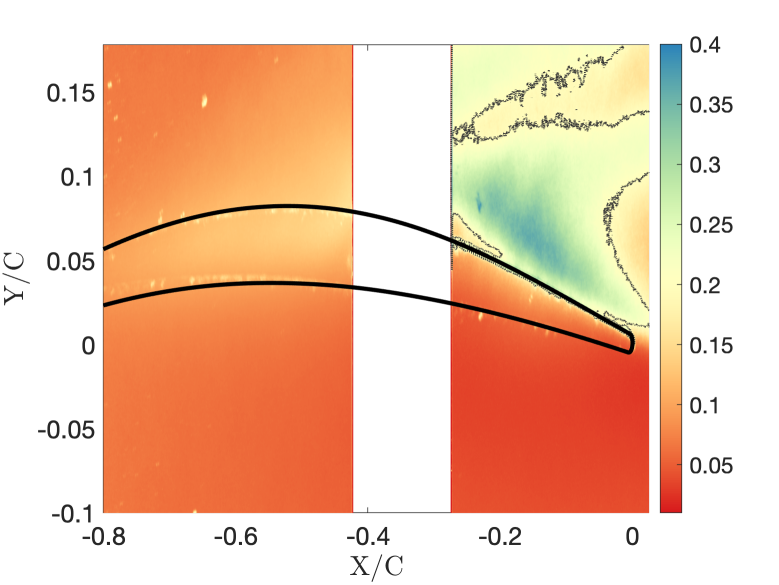
The mock-up consists of a CD aerofoil placed at a geometric angle of attack with the help of plexiglass plates of thickness 4.25 mm laser cut to reduce uncertainty in angle of attack while placing the aerofoil and at the same time giving good optical access. A 8 mm tip gap was made between the aerofoil and the bottom plate to study the impact of tip noise, as shown in figure 1. Furthermore, additional tests were performed by covering about 10 of the aerofoil span with a P36 roughness on the pressure side of the aerofoil. The strip of roughness was placed between , where is the aerofoil chord length as shown in figure 1.
All the measurements were achieved at a free-stream velocity of 16 m/s and 28 m/s, which corresponds to Reynolds numbers based on the aerofoil chord length of and respectively.
2.1 Planar PIV measurements setup
Two-dimensional planar PIV measurements were performed in the tip gap region, about mm below the aerofoil, as shown in figure 1. Two sCMOS cameras, each with megapixel sensors, were used to acquire images in a dual frame mode. A ND:YAG dual pulsed laser was used for illumination. A thin ( mm) light sheet was generated with a set of spherical lenses and a divergent cylindrical lens. Tracer particles of about 1 m were generated to seed the flow. In total, more than images were recorded for each case at an acquisition frequency of 4 Hz. The maximum mean particle image displacement was more than 20 pixels, which ensures the relative error is within for the estimation of particle image displacement. The data collected were processed using Lavision’s Davis 8. For vector calculations, an iterative multigrid scheme was used, with a final window size of pixels and an overlap of 75 %. For the first camera, placed in the leading edge region, the final window size was about mm2. In comparison, for the second camera, which was placed in the trailing edge region, the final window size was approximately mm2.
2.2 Acoustic measurements
Far-field acoustic pressure measurements were performed with two inch Integrated Circuit Piezoelectric (ICP) microphones, placed on the suction and pressure sides of the aerofoil. These microphones were placed perpendicular to the trailing edge of the aerofoil and placed at a distance of m, which is about 10 times the aerofoil chord length, to ensure that they are in an acoustic far-field location. The microphones were calibrated using a B&K piston-phone, which ensures that the calibration uncertainty is within 0.2 dB. For noise measurements, a long time signal (3 min) was used, which yielded an uncertainty of dB ( confidence) in the estimation of acoustic spectra [Bendat, 1978].
2.3 Synchronized measurements
The PIV and far-field acoustic measurements mentioned above were performed in a synchronized manner. While the far-field pressure measurements are time resolved, PIV measurements have a limited time resolution. As such, to synchronize these two measurements, the acquisition frequency for all the measurements performed are set to powers of two. In particular, the PIV measurements were performed at 4 Hz while the far-field pressure were recorded at an acquisition frequency of 65536 Hz (or Hz). The signal from laser is used as a trigger to initiate the measurements.
3 Results
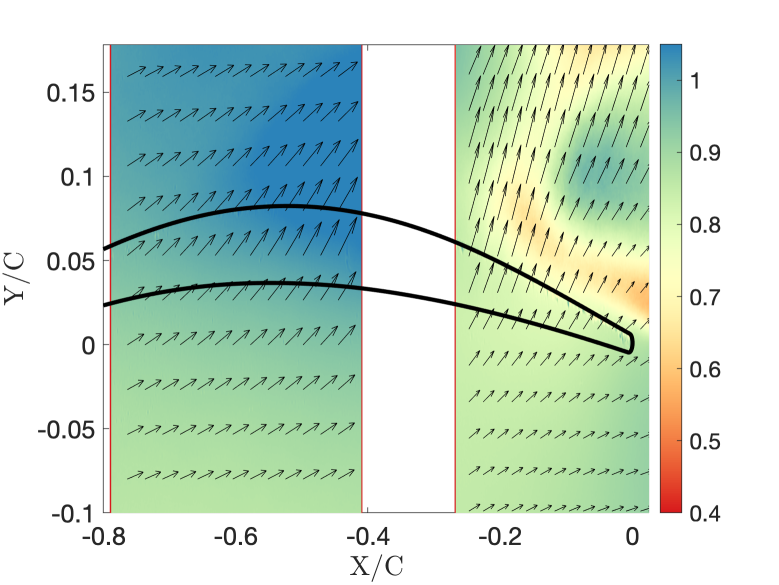
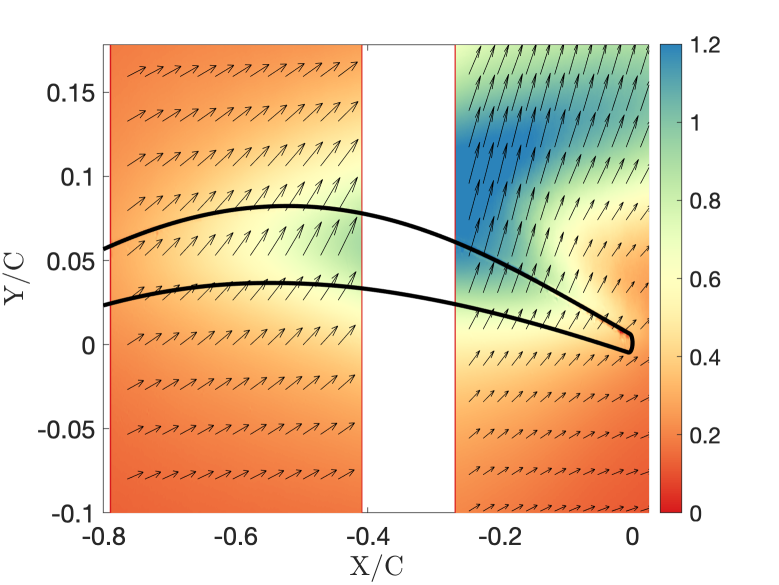
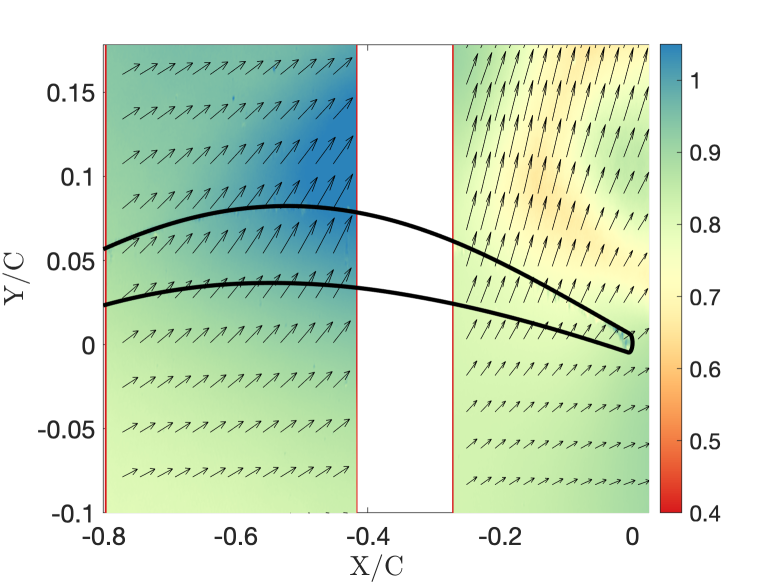
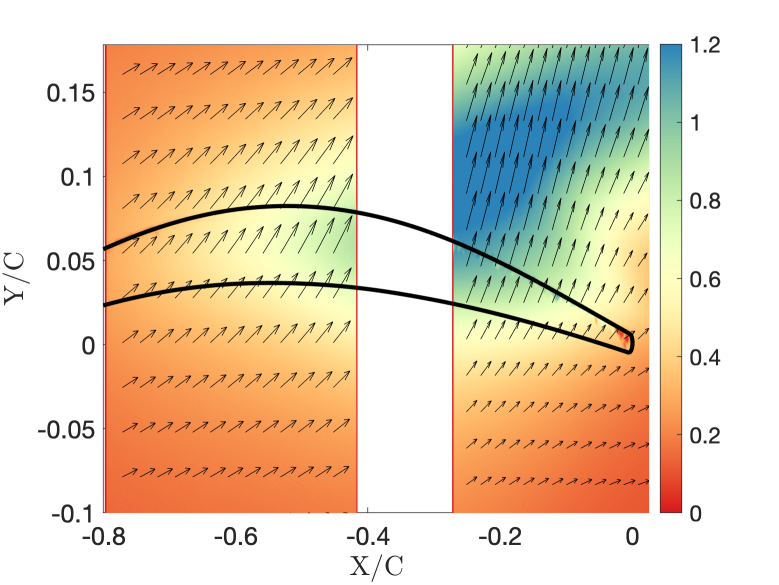
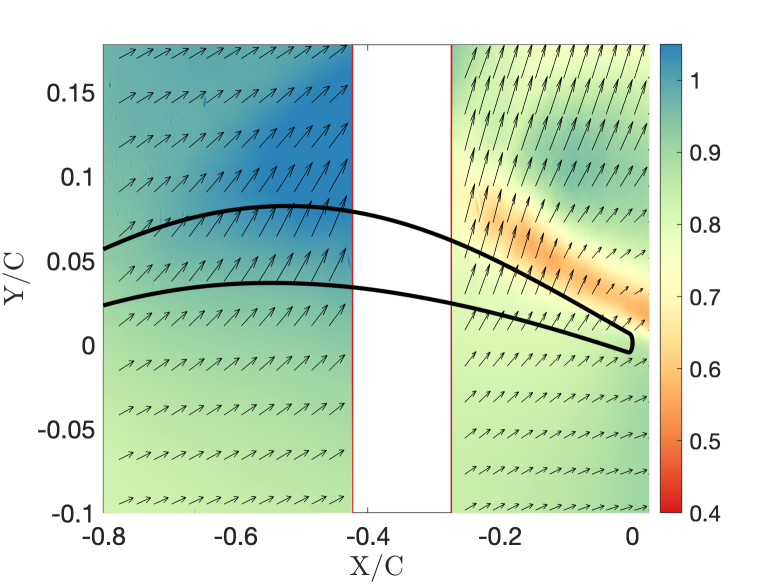
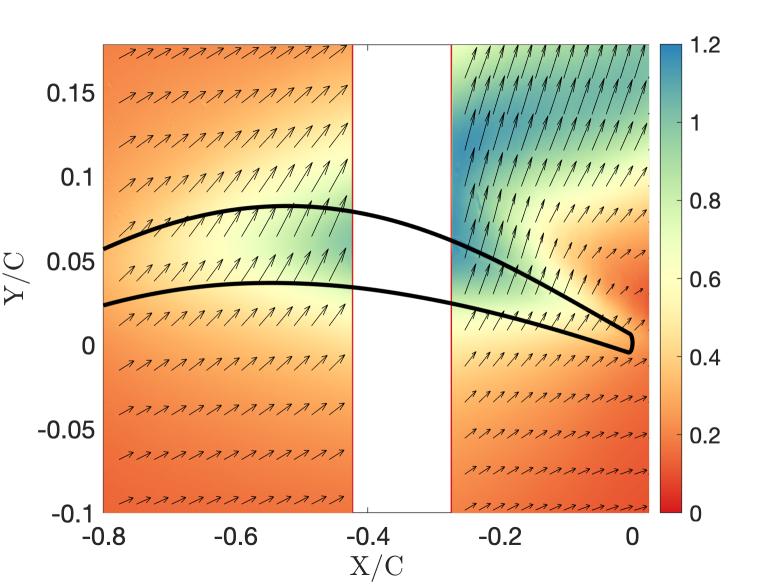
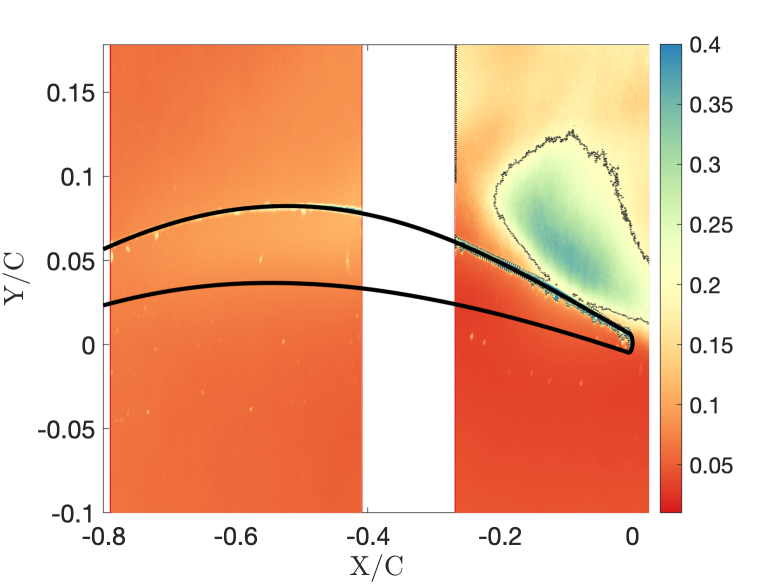
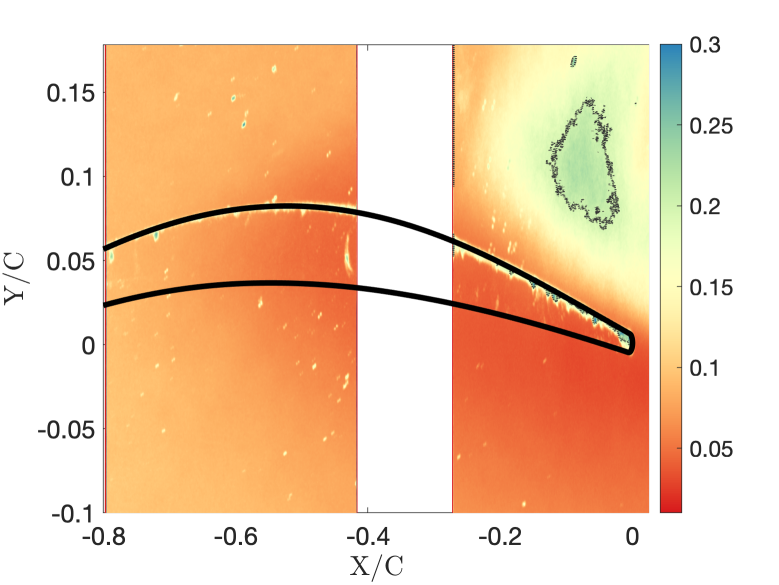
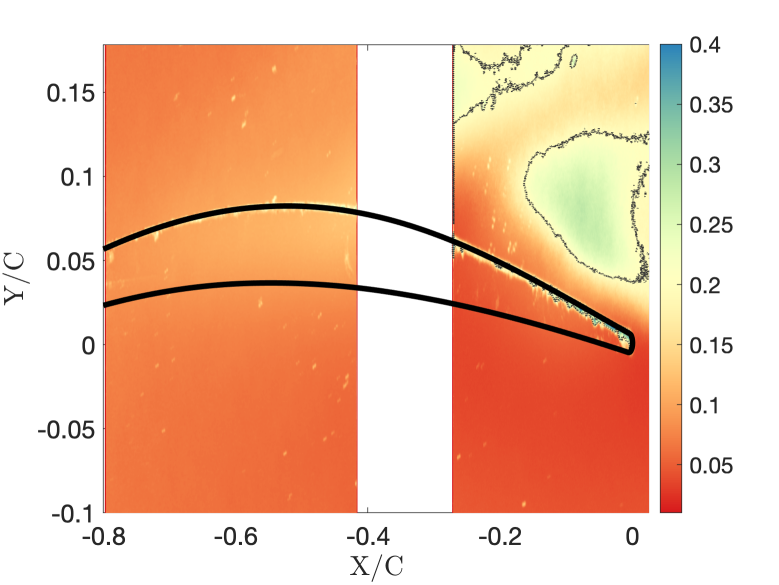
Figure 2 shows the mean velocity in the coordinate system aligned with the wind tunnel for three test cases; 16 m/s (smooth), 30 m/s (smooth), 30 m/s (rough). No measurements were possible between due to measurement constraints. The velocity fields have been normalized by the incoming free-stream velocity in order to compare the velocity maps. The velocity maps for the cases with no-roughness (Figures 2 (a)-(d)) yield similar velocity fields, and are comparable despite differences in the Reynolds numbers. In contrast, the velocity fields are visibly different in the trailing-edge region for the rough case performed at 30 m/s. In particular, a significant reduction in cross-stream velocity (Figure 2 (f) versus (d)) can be seen. Furthermore, in the rough case, the cross flow velocity () shows a marginal increase close to the mid-chord location (Figure 2 (f)), while there is a significant increase in the streamwise direction (Figure 2 (e)).
 (a) (a)
|
 (b) (b)
|
 (c) (c)
|
 (d) (d)
|
 (e) (e)
|
 (f) (f)
|
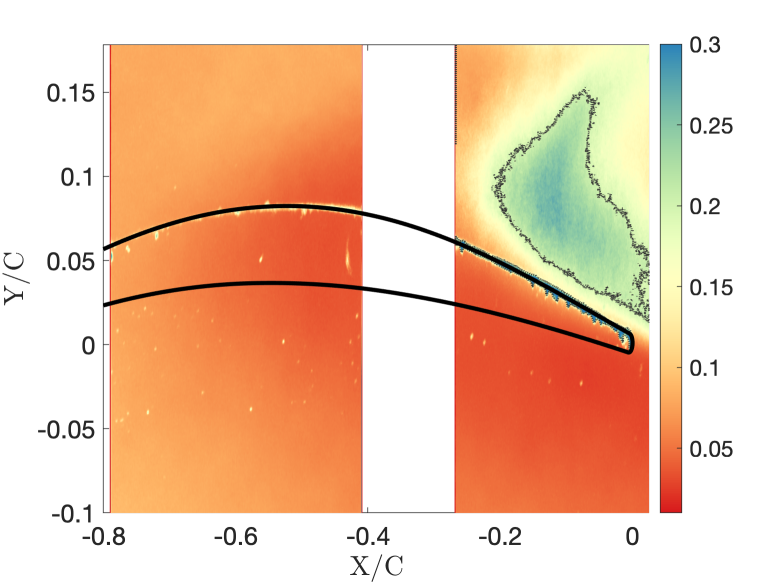
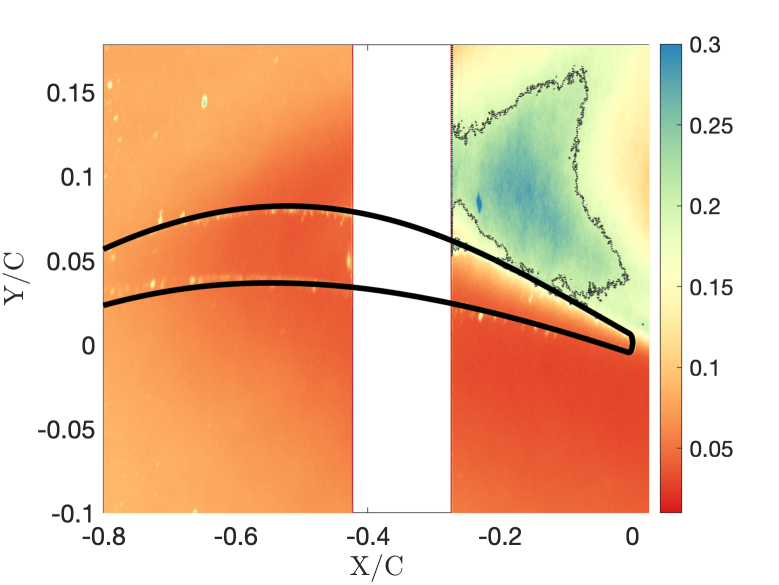
Figure 3 shows the standard deviation velocity fluctuations normalized by the incoming mean free-stream velocity for the three test cases. The contours of the standard deviation of the velocity fluctuations suggest that the flow remains largely laminar, near the leading edge region, which is in agreement with previous studies [Grilliat et al., 2007; Saraceno et al., 2022]. Despite a significant reduction in cross-stream velocity (Figure 2 (f)) the standard deviation velocity fluctuations and are visible closer to the trailing edge of the aerofoil for the rough case. Although the overall magnitude of the standard deviation velocity fluctuations are comparable between the three test cases, the latter are localised differently. For both components, the regions of high fluctuations move further downstream and away from the wall with increasing Reynolds number (Figures 3 (a) and (b) versus (c) and (d)). The clear difference between the rough and smooth cases is that for the latter the regions of elevated velocity disturbance are smaller, more localised compared to the rough wall case. Furthermore, the disturbance field for the rough wall case extends further upstream and closer to the wall (Figures 3 (e) and (f)).
 (a) (a)
|
 (b) (b)
|
 (c) (c)
|
 (d) (d)
|
 (e) (e)
|
 (f) (f)
|
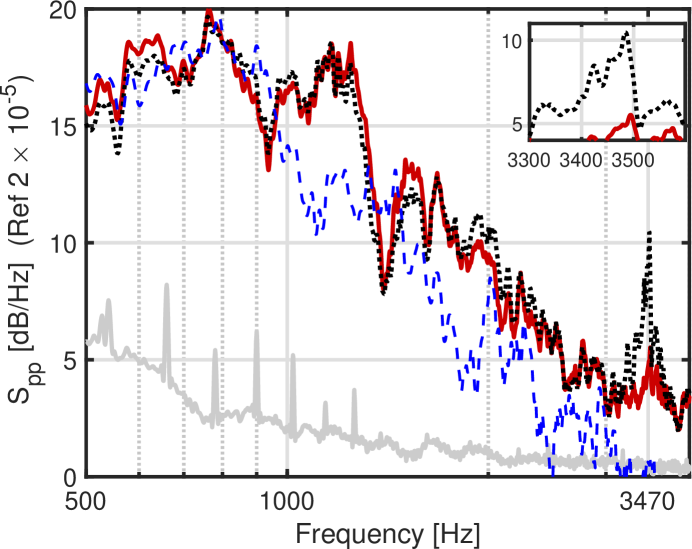
The Sound Pressure Level (SPL), , measured by a single microphone placed on the pressure side of the aerofoil is shown in figure 4. The microphone was placed at a distance of 1.35 m from the edge of the trailing edge of the aerofoil. SPL was calculated from the time series using Welch’s method. In order to accurately estimate spectral properties, a Kaiser window was used with a 75 overlap. The window size was restricted to , where is the sampling frequency. Furthermore, zero padding was performed in order to obtain a spectral resolution of 1 Hz. All measurements with the aerofoil are clearly above the background jet noise. The SPL show that the noise generated by the introduction of aerofoil tip is dominant above 1 kHz. More importantly, for the first time SPL measurements up to 20 kHz were achieved due to the UdeS low-noise facility. A tonal peak at 3500 Hz is observed in the SPL, for the cases without roughness elements, as previously reported by Jacob et al. [2016], who did these measurement for similar tip gap size but at very different Mach and Reynolds numbers. For m/s, two additional peaks, at 10045 and 16387 Hz can be seen for the first time, which also disappear with roughness suggesting that the latter removes the diffraction from the aerofoil pressure side.
 (a) (a)
|
 (b) (b)
|
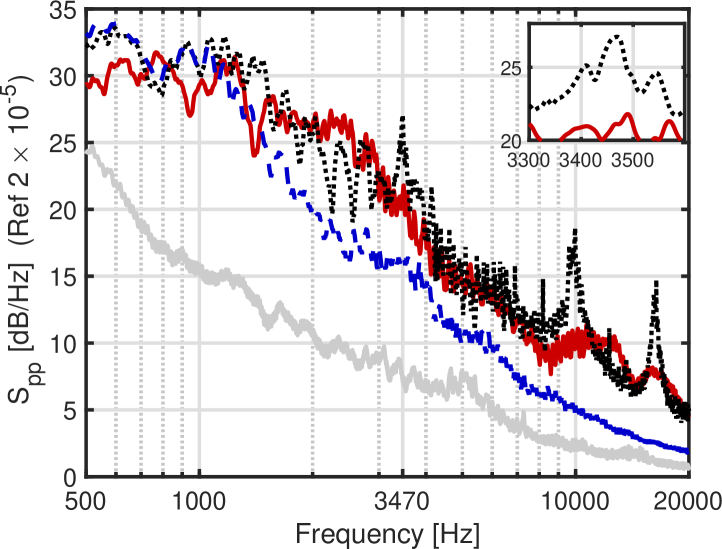

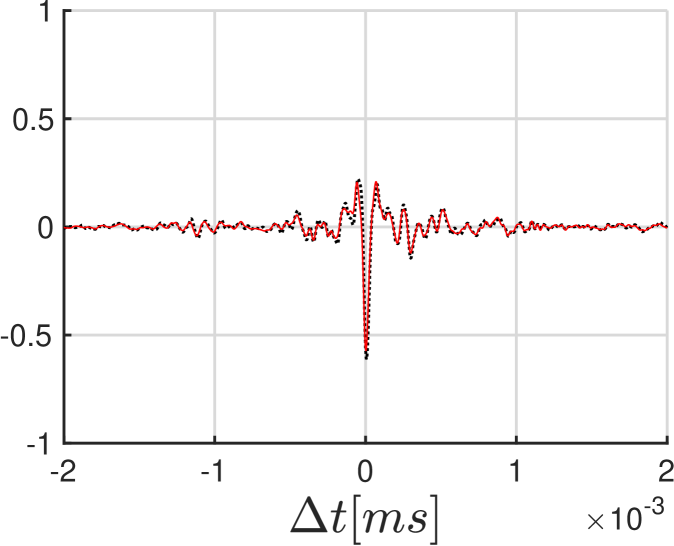
Figure 5 shows the band-passed correlation between the two opposing far-field microphones for two different frequency bands. In the low-frequency band (1000 to 4000 Hz) a clear phase opposition for all cases (negative ) decisively demonstrates that the dominant noise source is dipolar in nature [Yu & Tam, 1978]. However, at the higher frequency band (9000 and 11000 Hz), the pattern in correlation can be explained by a quadrupolar noise source. Similar observations were made by Grilliat et al. [2007] based on scaling arguments for sound pressure levels.
 (a) (a)
|
 (b) (b)
|
 (a) (a)
|
 (b) (b)
|

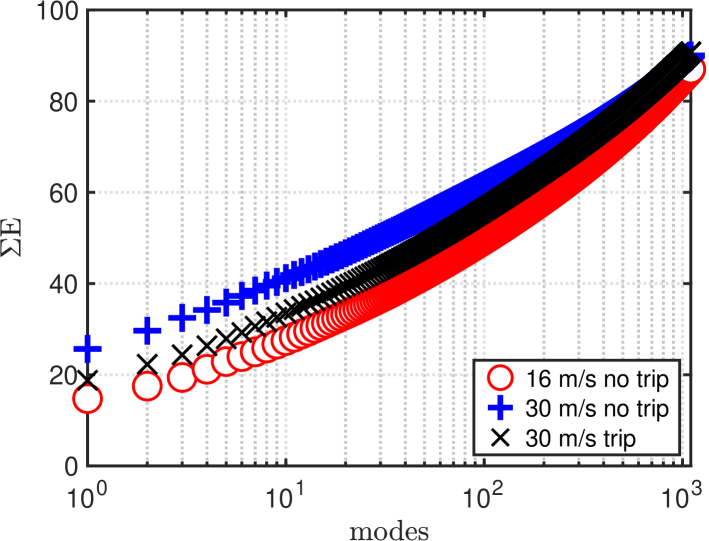
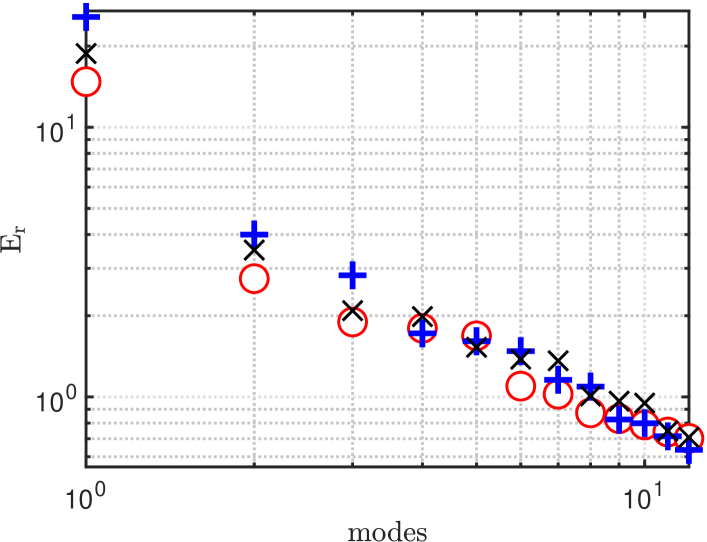
To unravel the modes in the velocity disturbance field, a Proper Orthogonal Decomposition (POD) was achieved using the snapshot approach developed by Sirovich [1987]. Since, turbulence intensity in the leading-edge region is close to zero, the POD analysis was performed only in the trailing-edge region of the aerofoil. The resulting distribution of energy, e.g. the eigenvalues of the POD analysis, is shown in Figure 6. A large part of the total kinetic energy is present within a small number of modes, typical of flows with convective coherent structures. For the rough case, modes 7 and 8 constitute a modal pair, while for the smooth-wall case, modes 8 and 9 comprise a modal pair. Since, the differences between the two smooth cases, at 16 and 30 m/s, are minor no further comparative analysis will be performed between the two cases.
 (a) (a)
|
 (b) (b)
|


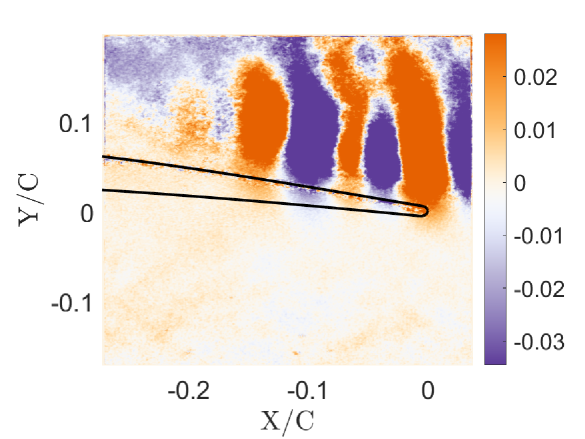
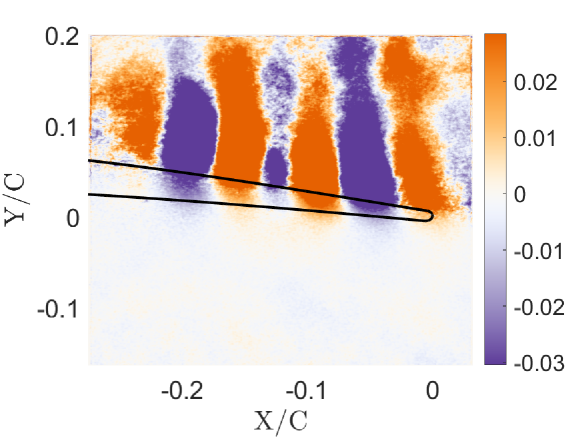
Figure 7 shows the spatial mode 8 of the vertical velocity disturbance field for m/s. The spatial modes correspond to the spatial organization of the velocity disturbance field in space, i.e. coherent structures. The spatial organization of this particular mode is distributed across the trailing-edge for the rough case, while in the smooth case the modal disturbance of coherent structure is more localized away from the aerofoil, which is consistent with our observations on the standard deviation of velocity. These modes are predominantly located on the suction side of the aerofoil and have been shown to be associated with tip leakage noise and flow instability by Saraceno et al. [2022] and Koch [2021].
 (a) (a)
|
 (b) (b)
|
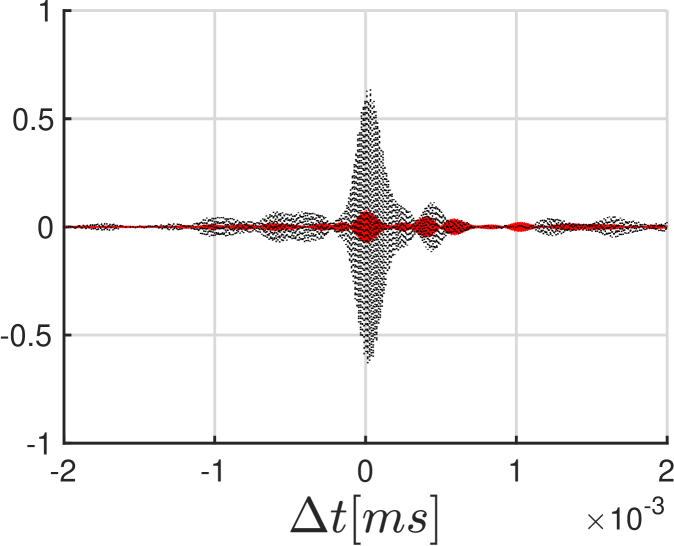
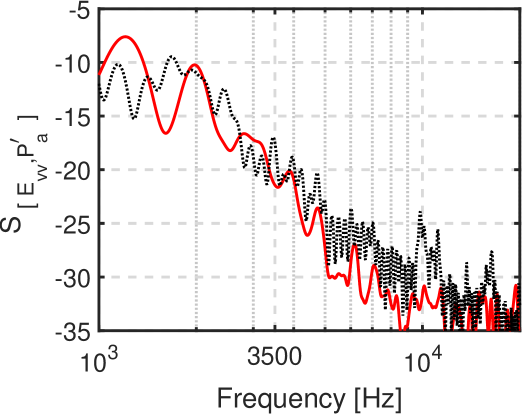
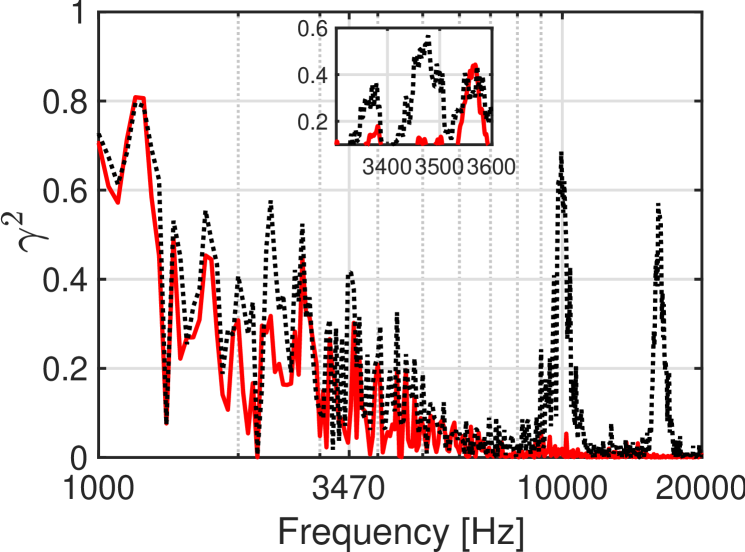
Previous studies [Camussi et al., 2010; Saraceno et al., 2022] have tried to establish a causal link between these flow instabilities and acoustics through correlation; ultimately, causality can be more reasonably linked through interventions [Pearl et al., 2000]. Therefore, the correlations between acoustics and near-field flow disturbances, with and without roughness, are compared because roughness acts as an intervention in far-field tonal noise. The cross-correlation between mode 8 and far-field acoustics was computed. Subsequently, from the cross-correlation the auto-spectral density was estimated and is shown in figure 8 (a) for the two cases. Distinct peaks at about 2500, 3500, 10000 and 16000 Hz can be seen for the case with no roughness, which confirms that mode 8 of the smooth-wall case does indeed carry information on the acoustic spectral peaks observed in the noise measurements. In fact, the additional peak ( Hz) emerges from the magnitude-squared coherence between two microphones placed on either side of the aerofoil in figure 8 (b). Moreover, strong coherence is also seen for the two newly observed humps at high frequencies. This further strengthens the observations made in figure 8 (a). As in the SPL in figure 4, all theses peaks disappear with roughness.
4 Discussion and Conclusions
Velocity and noise measurements for tip-leakage flows over a fixed aerofoil have been conducted, exploring the influence of roughness on the pressure side. Two research questions have guided this study: 1) What is the operational range of tip-gap noise? 2) What is the origin of humps or tones in the acoustic spectra, and can they be solely attributed to coherent structures in the tip-gap region?
The present study reveals for the first time that tones associated with tip gap extend beyond previously reported frequencies, that is, 3.5 kHz [Jacob et al., 2016; Saraceno et al., 2022]. In a low-noise facility, tip-leakage noise is found to have two peaks and humps at high frequencies, around 10 and 16.5 kHz, which have been measured for the first time. These peaks have not been reported in previous measurements, perhaps because the current set of measurements is performed at lower Mach numbers compared to previous studies [Camussi et al., 2010; Jacob et al., 2016; Saraceno et al., 2022; Palleja-Cabre et al., 2022], where the background jet noise could have masked the contributions of tip noise, or because these studies were performed at very high angles of attack, where flow separation is expected on the suction side of the aerofoil. As such, frequencies and tones beyond this range are also possible depending on the angle of attack and flow velocity.
Introducing roughness on the pressure side alters cross flow velocity, with increased cross-stream velocity near the mid-chord and decreased velocity close to the trailing edge. These differences most likely result from secondary flows over the pressure side due to surface roughness [see Chung et al., 2018, for instance]. This allows us to compare differences in far-field acoustics due to weaker cross flow () at matched Reynolds and Mach numbers.
Modal shapes confirm that instabilities in the tip-gap region for the rough-wall case start upstream compared to the smooth case, consistent with a more localized region of elevated cross flow velocity for the smooth-wall case. Coherent structures are more confined for the smooth-wall case, carrying information associated with far-field noise peaks absent in the rough-wall case. Importantly, while negative correlation between far-field microphones at low and mid-frequencies indicates dipolar character of the noise sources, at higher frequencies (e.g. beyond 10 kHz), the noise sources exhibit more of a quadrupolar nature [as also evidenced by scaling shown by Grilliat et al., 2007].
Although modal shapes and the cross-spectral density between modes and far-field acoustics can imply that coherent structures associated with flow instabilities can cause tip leakage noise [Camussi et al., 2010; Saraceno et al., 2022], correlation alone does not imply causation, and this is demonstrated by the fact that these coherent structures are present in either case. If the intervention route is taken and the effects of roughness on noise are compared, roughness on the pressure side is seen to lead to cancellation of spectral peaks and a drop in the cross-spectral density at the frequencies of tones. This stresses the importance of the diffraction on the aerofoil pressure side. The origin of acoustic peaks is then linked to coherence between the aerofoil sides near the tip. For the porous wall boundary condition, Palleja-Cabre et al. [2022] have reported the absence of coherence between the wall pressure and the far field. As porous walls can be considered rough [Jaiswal & Ganapathisubramani, 2024], the absence of coherence between the two sides of the aerofoil through the introduction of roughness elements or roughness induced by porous surfaces can suppress these peaks in tip leakage noise. Therefore, coherence between either side of the aerofoil is required for the existence of tones in the acoustic spectra. It is important to note that the causal link between noise peaks and wall boundary conditions is established here not by correlations, but instead through intervention [Pearl et al., 2000]. Here, the reader is cautioned that the existence of a smooth wall boundary condition on either side of the aerofoil tip may still not be a sufficient condition for the existence of these tones.
Remarkably, several experiments, including ours, have shown the existence of acoustic peaks around 3.5 kHz. Given differences in Reynolds and Mach numbers and key geometry differences (aerofoil, and side plate height), these peaks cannot be linked to acoustics or aerodynamics alone because the existence of flow instabilities alone does not ensure frequency selection of these tones. Furthermore, roughness-induced turbulence at the aerofoil tip does not lead to an increase in the amplitude tones; on the contrary, a reduction was observed. In the present set of experiments, only the temperature (hence the speed of sound) and the aerofoil geometry were kept constant. Therefore, it is possible that the aerofoil thickness and speed of sound play an important role in the frequency selection process of these peaks. The added requirement of coherence between the pressure and suction sides of the aerofoil implies that acoustic feedback (acoustic back reaction) or a cross-communication could potentially explain this frequency selection process, which is removed by roughness introduced on the pressure-side edge [Moreau et al., 2016]. However, future studies in this direction are needed to further understand these withstanding issues.
[Funding]PJ acknowledges the financial support from UK Research and Innovation (UKRI) under the UK government’s Horizon Europe funding guarantee [grant number EP/X032590/1)].
[Declaration of interests]The authors report no conflict of interest.
[Data availability statement]Derived data supporting the findings of this study are available from the first author upon reasonable request.
References
- Bendat [1978] Bendat, J. S. 1978 Statistical errors in measurement of coherence functions and input/output quantities. Journal of Sound and Vibration 59 (3), 405–421.
- Boudet et al. [2016] Boudet, Jérôme, Caro, Joëlle, Li, Bo, Jondeau, Emmanuel & Jacob, Marc C 2016 Zonal large-eddy simulation of a tip leakage flow. International Journal of Aeroacoustics 15 (6-7), 646–661.
- Camussi et al. [2010] Camussi, R, Grilliat, Julien, Caputi-Gennaro, G & Jacob, Marc C 2010 Experimental study of a tip leakage flow: wavelet analysis of pressure fluctuations. Journal of fluid mechanics 660, 87–113.
- Chung et al. [2018] Chung, D, Monty, Jason P & Hutchins, Nicholas 2018 Similarity and structure of wall turbulence with lateral wall shear stress variations. Journal of Fluid Mechanics 847, 591–613.
- Grilliat et al. [2007] Grilliat, J., Jacob, M. C., Camussi, R. & Caputi-Gennaro, G. 2007 Tip leakage experiment - Part one: Aerodynamic and acoustic measurements. 13th AIAA/CEAS Aeroacoustics Conference (28th AIAA Aeroacoustics Conference), paper pp. 1–21.
- Jacob et al. [2016] Jacob, Marc C, Jondeau, Emmanuel & Li, Bo 2016 Time-resolved piv measurements of a tip leakage flow. International Journal of Aeroacoustics 15 (6-7), 662–685.
- Jaiswal & Ganapathisubramani [2024] Jaiswal, Prateek & Ganapathisubramani, Bharathram 2024 Effects of porous substrates on the structure of turbulent boundary layers. Accepted for publication in Journal of fluid mechanics , arXiv: https://doi.org/10.48550/arXiv.2301.04102.
- Koch [2021] Koch, R. 2021 Identification des sources de bruit aérodynamique liées aux écoulements de jeu en tête de pale de soufflante de turboréacteur. PhD thesis, University of Sherbrooke, ”https://savoirs.usherbrooke.ca/handle/11143/18703”.
- Koch et al. [2021] Koch, Régis, Sanjosé, Marlène & Moreau, Stéphane 2021 Large-eddy simulation of a single airfoil tip-leakage flow. AIAA Journal 59 (7), 2546–2557.
- Moreau [2019] Moreau, Stéphane 2019 Turbomachinery noise predictions: present and future. Acoustics 1 (1), 92–116.
- Moreau et al. [2016] Moreau, S., Laffay, P., Idier, A. & Atalla, N. 2016 Several noise controls of the trailing-edge noise of a Controlled-Diffusion airfoil. In 22nd AIAA/CEAS Aeroacoustics Conference.
- Moreau & Roger [2018] Moreau, Stéphane & Roger, Michel 2018 Advanced noise modeling for future propulsion systems. International Journal of Aeroacoustics 17 (6-8), 576–599.
- Moreau & Sanjosé [2016] Moreau, S. & Sanjosé, M. 2016 Sub-harmonic broadband humps and tip noise in low-speed ring fans. J. Acoust. Soc. Am. 139 (1), 118–127.
- Palleja-Cabre et al. [2022] Palleja-Cabre, Sergi, Saraceno, Ivan, Paruchuri, Chaitanya C & Joseph, Phillip 2022 Reduction of tip-leakage noise by using porosity. 28th AIAA/CEAS Aeroacoustics 2022 Conference, Paper number 3061 .
- Pearl et al. [2000] Pearl, Judea & others 2000 Models, reasoning and inference, , vol. 19, p. 386. Cambridge, UK: Cambridge University Press.
- Saraceno et al. [2022] Saraceno, Ivan, Palleja-Cabre, Sergi, Jaiswal, Prateek, Paruchuri, Chaitanya C & Ganapathisubramani, Bharath 2022 On the tip leakage noise generating mechanisms of single-fixed aerofoil. 28th AIAA/CEAS Aeroacoustics 2022 Conference, Paper number 2881 .
- Sirovich [1987] Sirovich, L. 1987 Turbulence and the dynamics of coherent structures. i. coherent structures. Quarterly of applied mathematics 45 (3), 561–571.
- Yu & Tam [1978] Yu, JC & Tam, CKW 1978 Experimental investigation of the trailing edge noise mechanism. AIAA Journal 16 (10), 1046–1052.