SCANIA Component X Dataset: A Real-World Multivariate Time Series Dataset for Predictive Maintenance
Abstract
This paper presents a description of a real-world, multivariate time series dataset collected from an anonymized engine component (called Component X) of a fleet of trucks from SCANIA, Sweden. This dataset includes diverse variables capturing detailed operational data, repair records, and specifications of trucks while maintaining confidentiality by anonymization. It is well-suited for a range of machine learning applications, such as classification, regression, survival analysis, and anomaly detection, particularly when applied to predictive maintenance scenarios. The large population size and variety of features in the format of histograms and numerical counters, along with the inclusion of temporal information, make this real-world dataset unique in the field. The objective of releasing this dataset is to give a broad range of researchers the possibility of working with real-world data from an internationally well-known company and introduce a standard benchmark to the predictive maintenance field, fostering reproducible research.
1 Background & Summary
In an era marked by technological advancement and data-driven decision-making, the automotive industry is undergoing a transformative shift, particularly in the realm of vehicle maintenance. Predictive maintenance (PdM), has emerged as a key player in revolutionizing how we care for and optimize the performance of vehicles. This innovative methodology harnesses the power of advanced analytics, sensor technology, and machine learning to predict when vehicle components are likely to fail, allowing for timely and cost-effective maintenance interventions. PdM is paramount for critical components in trucks. This proactive approach to maintenance involves using data, analytics, and monitoring systems to estimate the components’ health state.
One of the significant challenges in PdM is the shortage of public real-world datasets. The reason is that Original Equipment Manufacturers (OEMs) tend to keep the data to themselves and do not share it with anyone outside their company. Exceptions are research or development partners who can access the data when working with companies for PdM solutions. Reasons for keeping the data hidden are that it is sensitive as it contains failure frequencies, what type of sensor is available, etc. However, real-world datasets are crucial for developing the methodology to create robust models for foreseeing real industry equipment failures. The lack of data makes researchers in the field use simulated datasets that mimic real conditions like C-MAPSS from NASA [1]. Synthetic datasets usually lack the complexity of real-world data and overlook many common challenges, such as imbalanced labels, censored readouts, noise, and intricate relations between signals.
The newly released real-world dataset from SCANIA is an exception to the typical practice of companies not releasing data publicly and holds significant potential for advancing the field of PdM. Another advantage inherent in this dataset that makes it unique is its consideration of temporal information, demonstrating gradual degradation in equipment in the form of time series readouts. This multi-variate time series dataset is likely rich in diverse information collected from SCANIA trucks and can be used for various tasks in PdM, such as classification, regression, forecasting, anomaly detection, and survival analysis. The proposed dataset is introduced for the ongoing Industrial Challenge 2024 at the International Symposium on Intelligent Data Analysis (IDA) (link) with the title of Developing an Effective Predictive Model for Imminent Component X Failures in Heavy-Duty SCANIA Trucks at Stockholm University, Sweden. The setting of this industrial challenge served as a nexus for collaboration, fostering a unique synergy between academia and industry. The proposed dataset opens the door to various opportunities for advancing research and optimizing PdM methodologies. The dataset is publically published and is accessible on (link)[2]. This dataset includes operational data, truck specifications, and the repair records of an anonymized truck engine component called component X. The name of the component has been anonymized for proprietary reasons. The wealth of information in the dataset empowers decision-makers to make informed choices regarding maintenance strategies, resource allocation, and fleet management. This dataset has been used in one of our research on PdM previously, like [3].
Another comparable dataset also comes from SCANIA, it was concerned with Air Pressure System (APS) [4] of trucks and was disclosed in a preceding industrial challenge 2016 at the 15th International Symposium on Intelligent Data Analysis (IDA), Stockholm University. The APS dataset is also suitable for many machine learning tasks in PdM field and has been used in various researches, such as [5, 6, 7, 8, 9, 10, 11, 12, 13, 14, 15, 16, 17]. Although the APS dataset is rich in the field, it does not capture the temporal information of variables.
2 Methods
2.1 Data collection
The proposed dataset includes three sources of information encompassing important aspects of truck information. The first part comprises operational data. The second source contains repair records obtained from workshops. The last one incorporates the specifications of trucks. Collecting such informations from a fleet of trucks operating every day in different situations involves several challenges and potential errors. Below, we explain how the data is collected and also mention some of the possible errors during data collection. Finally, we explain what considerations have been made to protect the confidentiality of data for publishing.
2.1.1 Operational data
For collecting operational data of this dataset, trucks’ onboard sensors are utilized to monitor and collect crucial parameters like real-time data on the truck’s condition and performance. This data is stored inside the vehicle control units and is accessible remotely or using plugin cables in visiting workshops. One challenge in compiling operational data is losing connection with devices that collect data. One example of this error happens with Electronic Control Units (ECUs), like the engine control unit; sometimes, when the ECU software is updated, the data collection counters could be reset, i.e., start again from the beginning. This type of problem with data is handled through post-processing of the data when it has been downloaded from the truck. The post-processing does cover the majority of the possible types of corrupt data when collecting information but it might not cover all cases.
2.1.2 Repair records
Repair records collected from trucks include information about maintenance, repairs, and servicing performed on the vehicles. This information is usually collected from invoices and work orders, including crucial information about services rendered, replaced parts, labor costs, and other expenses incurred during the workshop visits. If the components have been changed or marked as repaired, they will be considered as failed and labeled as such in the dataset. Otherwise, it will be considered as healthy. Here, the challenge is that SCANIA can receive information only from its own network and official workshops. Therefore, we limited the population of the vehicles to those with a complete service history.
2.1.3 Specifications of trucks
Specification data is collected with the production system. Where they provide detailed specifications for each truck’s model the company has produced, this includes information about the engine type, weight capacities, dimensions, and other technical details. One possible challenge in collecting such data is, in very rare cases, when the truck is rebuilt and no longer matches the original specification.
Some of the mentioned errors are handled or addressed using quality control measures and regular equipment maintenance. Also, collaboration between data scientists, engineers, and domain experts has been done as a crucial step for developing effective strategies to handle data collection challenges in PdM.
2.2 Preserving Data Privacy
After collecting data, some modifications have been made to protect the confidentiality of data for publishing. Regarding temporal representation description, relative times are reported instead of the original timestamps. This is done to capture temporal patterns without revealing specific dates or time points. Repair frequencies and readout frequencies may have been modified and are not necessarily representative of actual truck usage. Moreover, variable names have been omitted for privacy and proprietary reasons, presenting a subset of all available operational and specification data. Also, the dataset comprises a random subset of vehicles visiting SCANIA workshops, and real vehicle identity numbers are not disclosed and are reported as anonymous IDs. The chosen subset is representative of SCANIA workshop visits for Component X analysis. In addition to these considerations, some perturbations like scaling have been made on operational data and repair rates. It is worth noting that the perturbed data still maintains its utility for predictive modeling. To evaluate the robustness of the model, a sensitivity analysis is conducted, assessing how changes in perturbation levels impact the model’s performance. This allowed us to observe model effectiveness variations under different perturbation conditions. Furthermore, it is validated that perturbations do not compromise the predictive model’s accuracy.
3 Data Records
The proposed dataset is available on the webpage for the industrial challenge of Symposium on Intelligent Data Analysis (IDA 2024) with the link. The dataset is split into three parts: train, validation, and test. Each of these parts comprises multiple files, with detailed descriptions provided for each file in this section.
3.1 Train set
The training set contains three files including "train_operational_readouts.csv", "train_tte.csv", and "train_specifications.csv," where each is explained below.
3.1.1 train_operational_readouts.csv
Operational data from Component X in SCANIA trucks is collected in a file named "train_operational_readouts.csv". This data file comprises of readouts collected at different times from a variety of features for a fleet of vehicles, yielding a multi-variate time series. These readouts, found in each row, offer unique insights into the operational status of these vehicles. Each readout encapsulates a distinct set of variables gathered between two points in time, such as and . In summary, it consists of 1122452 observations or instances from 23550 unique vehicles and 107 columns, including vehicle_id and time_step. The column time_step acts as a gauge, measuring the duration in time_step that each vehicle has been utilizing Component X during its operational lifespan. Note that vehicles do not necessarily follow the same sampling frequency in the time_step column. It is also worth noting that this dataset does not encompass the entire available operational data but rather represents a carefully selected subset. Experts have specifically curated this subset, handpicking data they believe is most relevant.
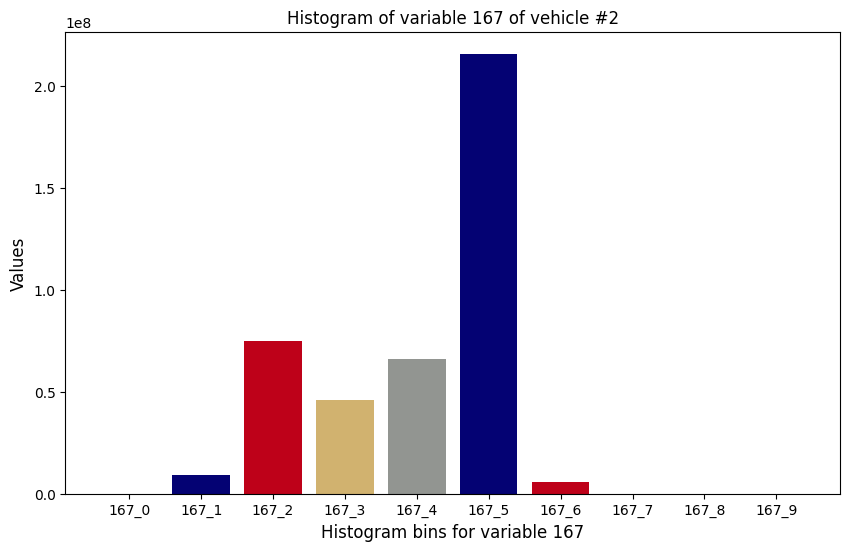
Ultimately, 14 attributes are selected and anonymized in the operational data, offering a broad spectrum of information without divulging specifics about the nature of Component X. These variables are organized into single numerical counters and histograms with several bins to make this data more manageable and insightful. In a histogram structure, each bin represents certain conditions linked to the values observed within the measured features. For instance, imagine a histogram linked to the variable distance_driven with four bins representing ambient temperature. This histogram shows the distribution of distance driven, organized into bins with different temperature ranges . Each bar of this histogram shows a temperature range, and the height of each bar represents the frequency of distance_driven within that temperature range. Histogram variables use the following indexing format: variableid_binindex. Where the "variableid" represents the ID of an anonymized variable or feature, and "binindex" shows the bin numbers. As an example, the variable with "variableid" 167 is a multi-dimensional histogram that has ten bins, "167_0", "167_1",…, and "167_9".
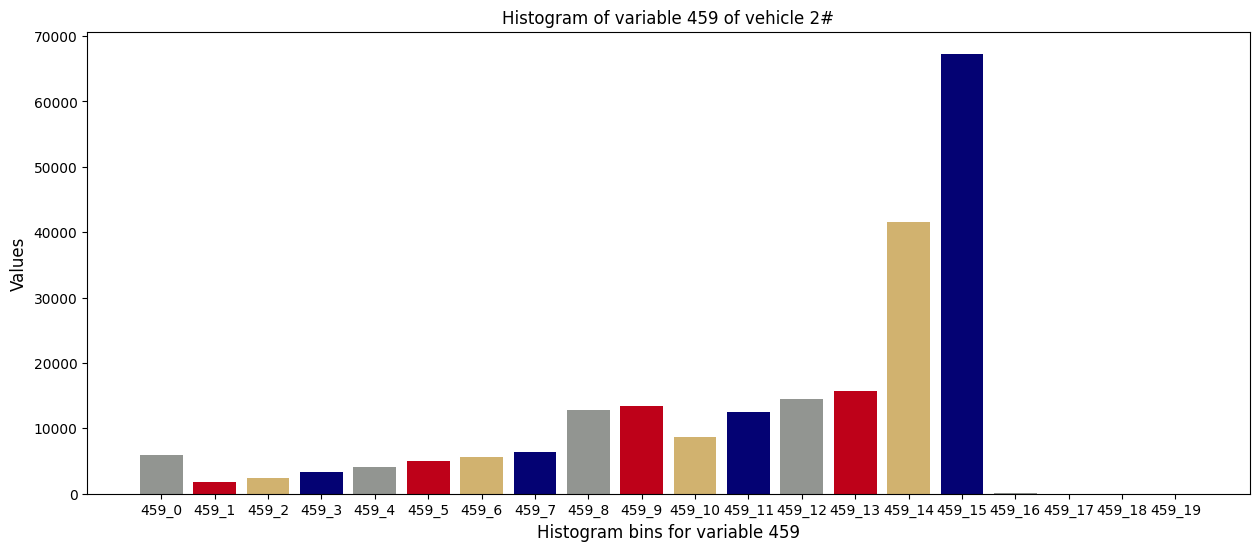
In summary, six out of 14 variables are organized into six histograms with variable IDs: "167", "272", "291", "158", "459", and "397," with 10, 10, 11, 10, 20, and 36 bins, respectively. Figure 1 illustrates two histogram features of variables 167 (see Fig. 1(a)) and 459 (see Fig. 1(b)) from an arbitrary vehicle at its last readout. Moreover, the eight rest of the variables named "171_0", "666_0", "427_0", "837_0", "309_0", "835_0", "370_0", "100_0"] are numerical counters. These features are accumulative and are suitable for the representation of trends over time. Figure 2 visualizes these numerical counters in more detail. An example of these features for an arbitrary vehicle in this dataset is depicted in Fig. 2(a).
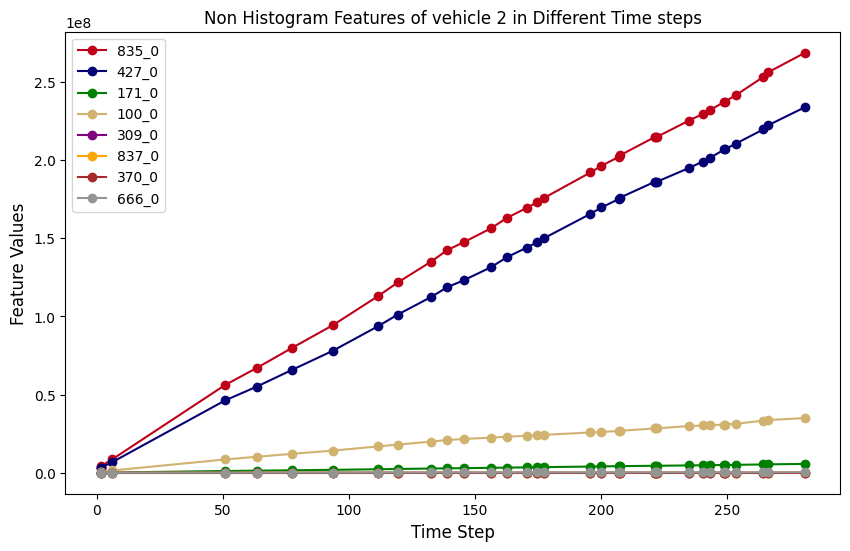
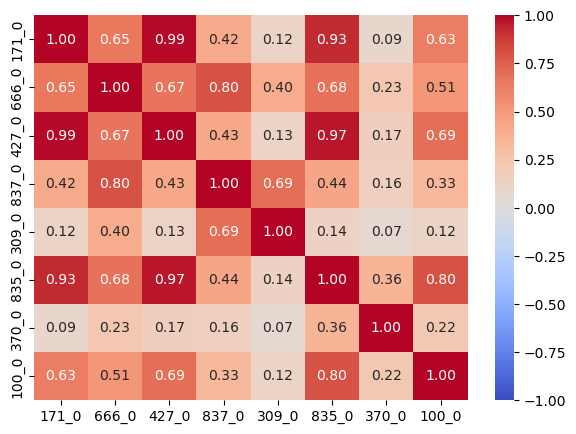
Additionally, the correlation between these non-histogram features (numerical counters) is calculated considering all readouts of vehicles and illustrated in Fig. 2(b). As can be seen, all the features are positively correlated, and no negative correlation exists between them. i.e., if the value of one feature increases, the value of the other feature also tends to increase.
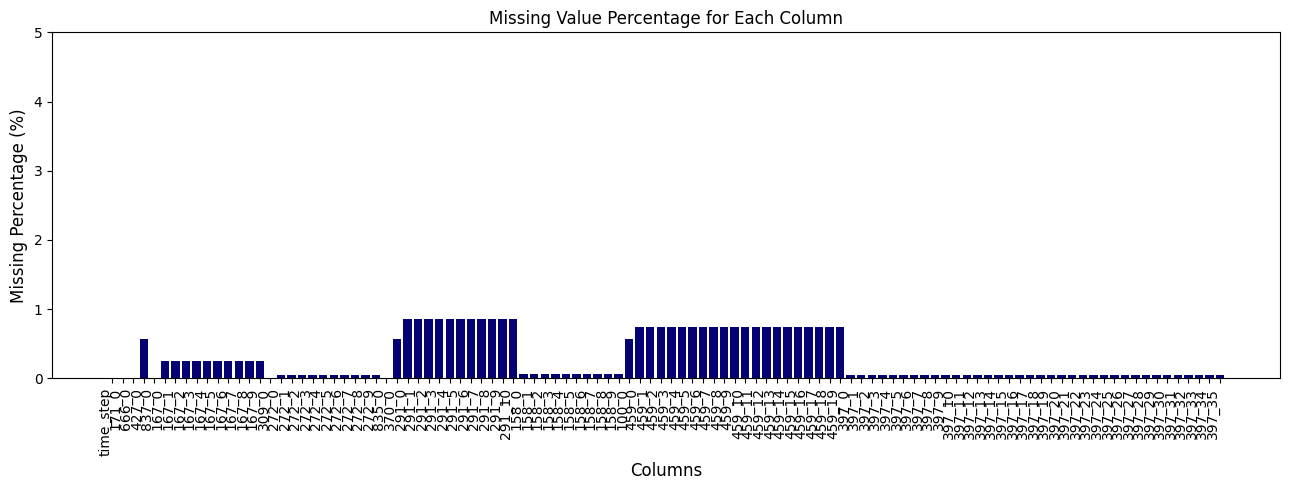
The distribution of missing values in train_operational_readouts.csv is shown in Fig. 3. This data file includes a minimal amount of missing values with less than 1 percent missingness per feature/column. Given the low percentage of missing values, the dataset’s integrity remains relatively intact, allowing various machine learning tasks with minimal preprocessing.
3.1.2 train_tte.csv
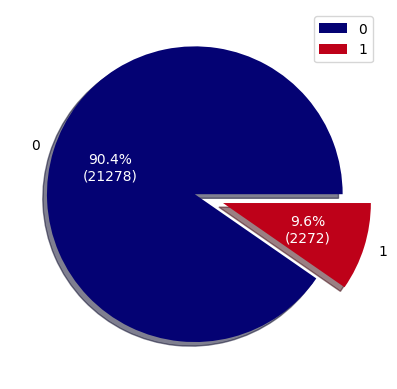
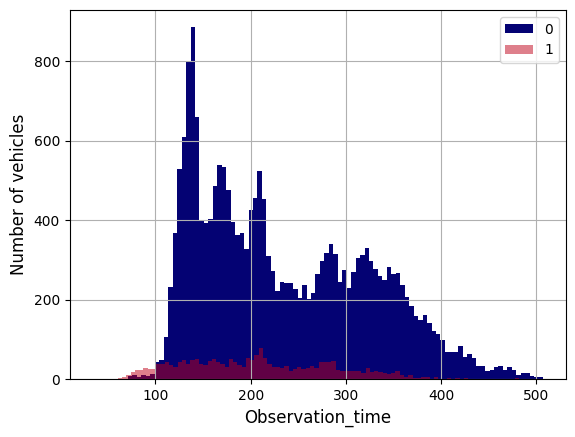
The file with the name "train_tte.csv" contains the repair records of Component X collected from each vehicle, indicating the time_to_event (tte), i.e., the replacement time for Component X during the study period. This data file includes 23550 number of rows and two columns: "length_of_study_time_step" and "in_study_repair," where the former indicates the number of operation time steps after Component X started working. The latter is the class label, where it’s set to 1 if Component X was repaired at the time equal to its corresponding length_of_study_time_step, or it can take the value of zero in case no failure or repair event occurs during the first length_of_study_time_step of operation. It is good to mention that the "train_tte.csv" data is imbalanced with 21278 occurrences of label 0 and 2272 instances of label 1. In other words, it is skewed toward label 0. Figure 4(a) compares the number of healthy and repaired components in the train set in general. Moreover, Fig. 4(b) shows the distribution of healthy and repaired components in their corresponding observation time during the data collection, i.e., the time between the last and first readout for each vehicle. Furthermore, there are no missing values (shown by NaN) in this data file.
3.1.3 train_specifications.csv
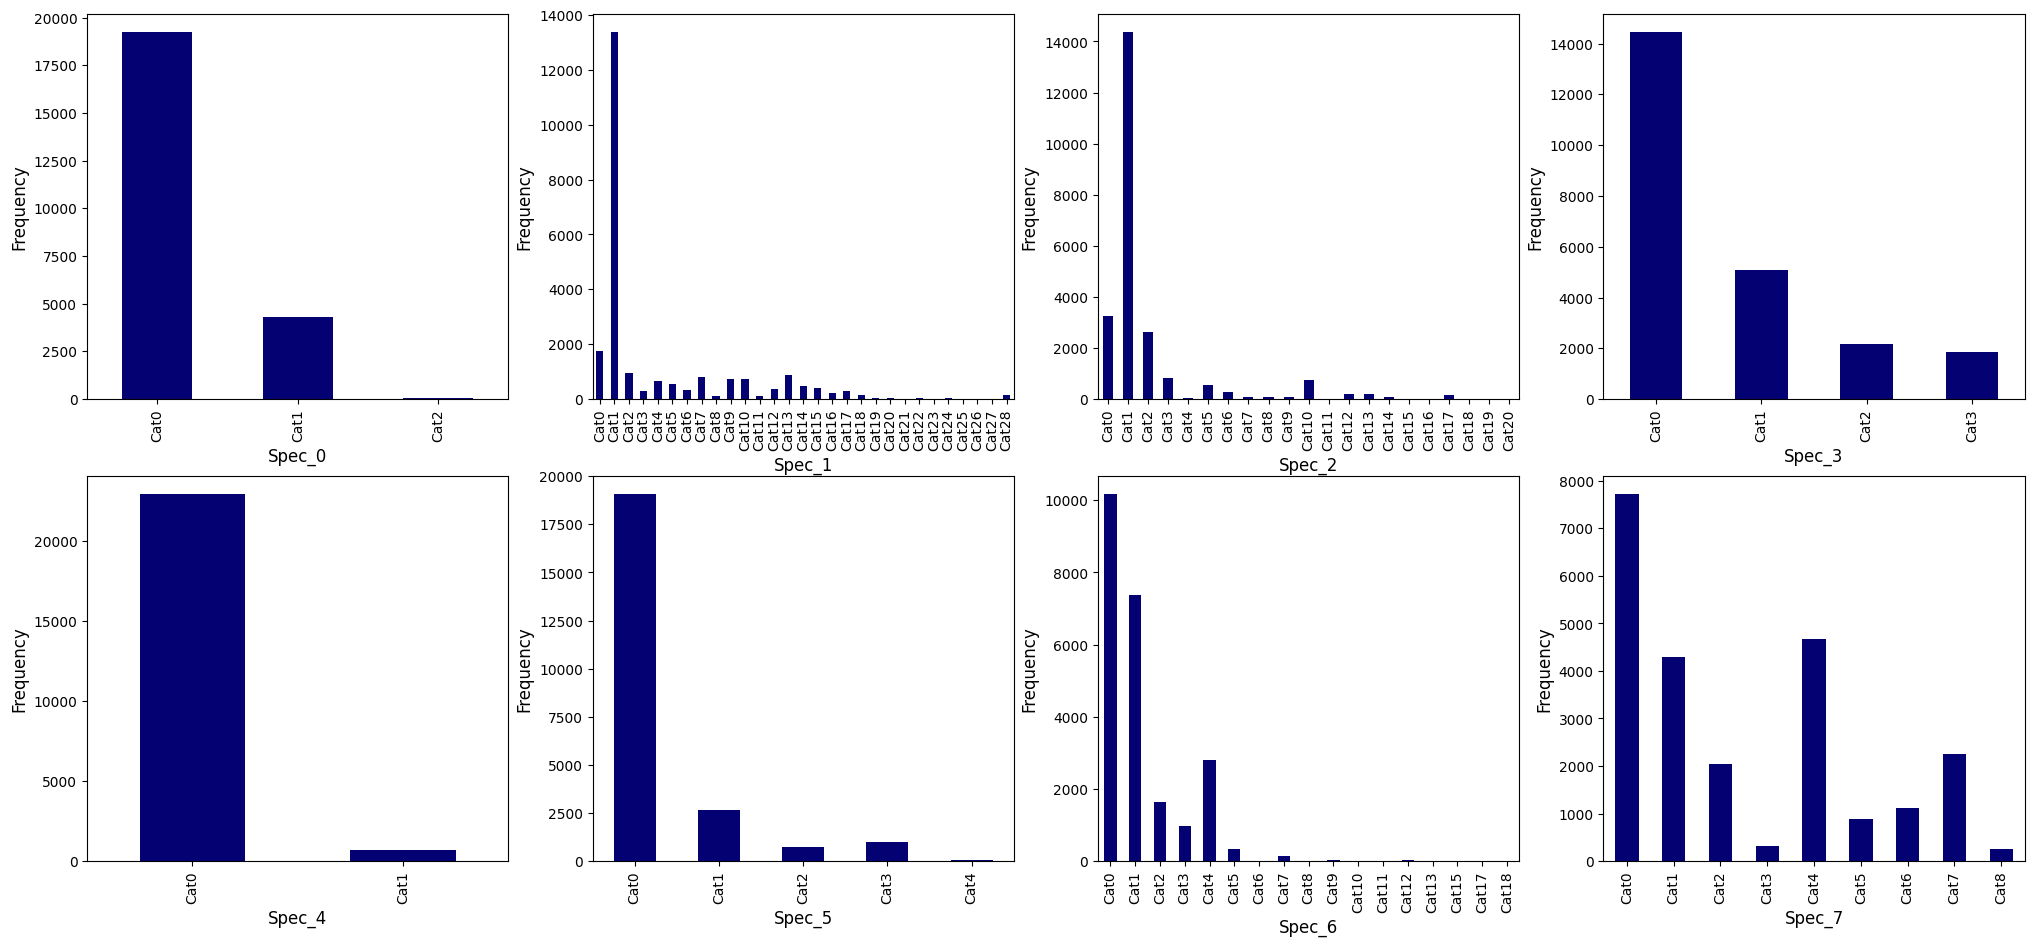
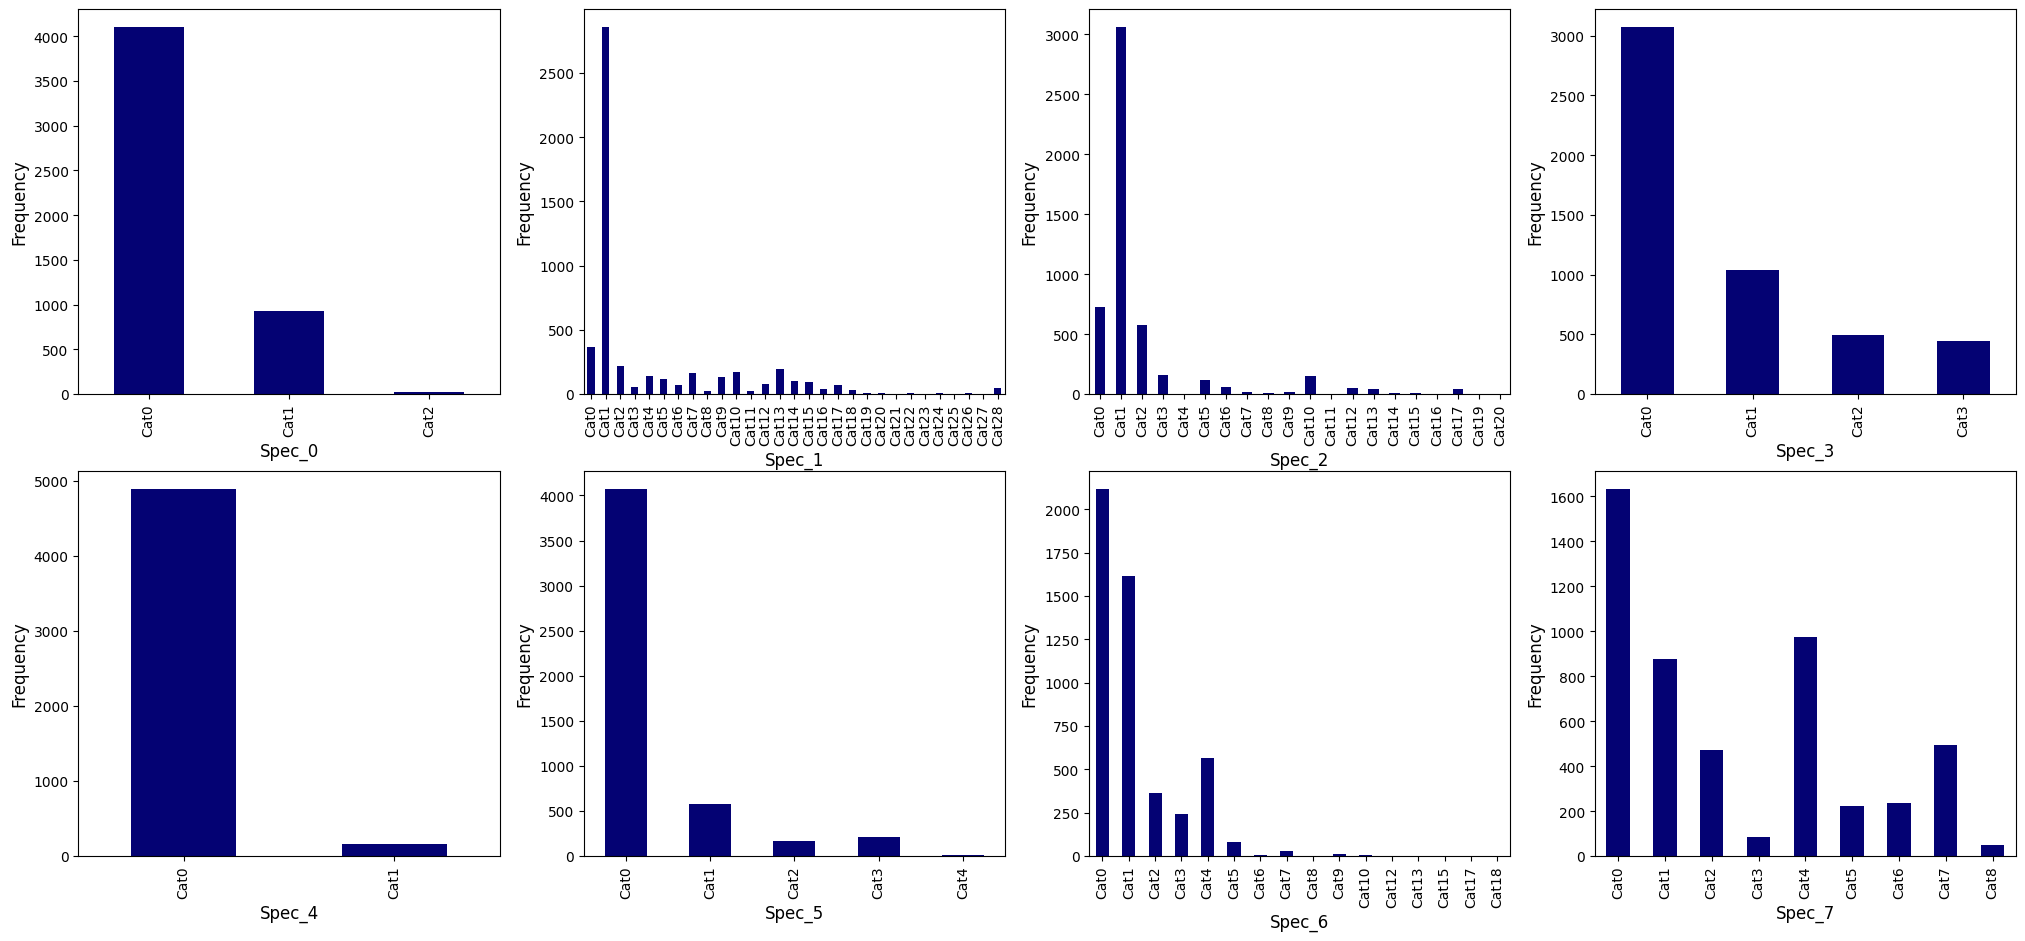
The last file in the training set is called "train_specifications.csv," which contains information about the specifications of the vehicles, such as their engine type and wheel configuration. In total, there are 23550 observations and eight categorical features for all vehicles. The features in train_specifications.csv are anonymized, each can take categories in Cat0, Cat1, …, Cat8. Figure 5 illustrates the categories of each feature in the train_specifications.csv file. Moreover, this data file has no missing value.
3.2 Validation set
The validation set consists of three files called "validation_labels.csv", "validation_operational_readouts.csv", and "validation_specification.csv".
3.2.1 validation_operational_readouts.csv
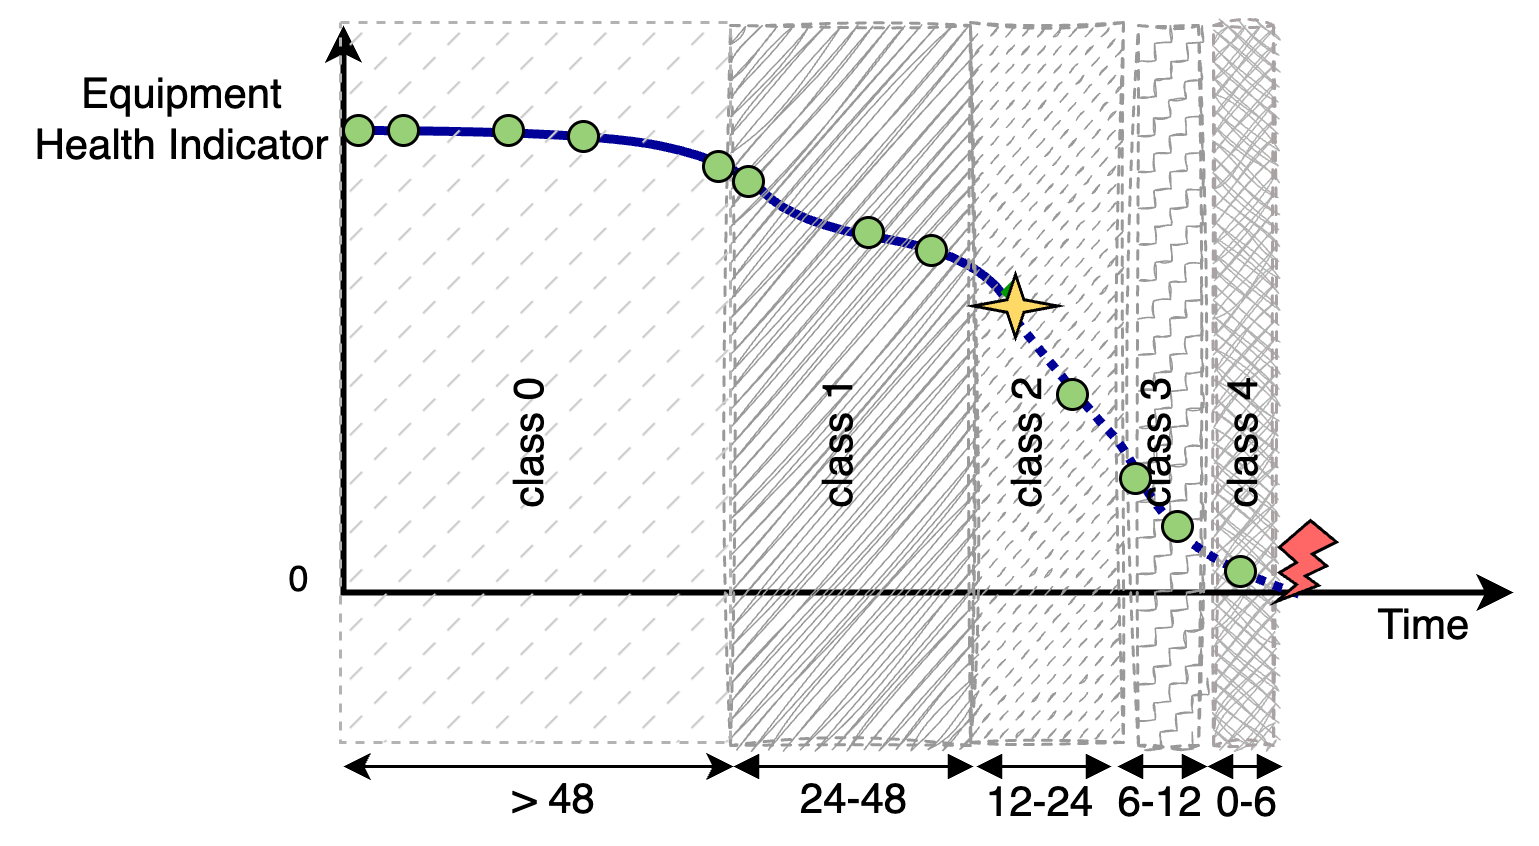
In general, the validation_operational_readouts.csv has the same description as the train_operational_readouts.csv except for the fact that in validation_operational_readouts.csv, the operational data is incomplete. Only a subset of the whole observations of each vehicle is provided where it extends only up to a randomly selected readout. As a result, it lacks details about the entire lifespan of a vehicle. This is done to simulate the usage of a prediction model in a realistic scenario when it only has information about a vehicle up until the present time. Figure 6 illustrates an example of a hypothetical health indicator or degradation model of component X installed on a vehicle in the validation set. Green dots are recorded readouts during the time from the start of its operation, and the yellow star represents the last simulated readout for this vehicle that is randomly selected among all possible readouts. This means that we only have information up to that readout, and the rest of the information is not given.
Overall, it includes 196227 observations/rows showing the number of instances from 5046 vehicles and includes 107 columns. Moreover, similar to train_operational_readouts.csv, it contains a minimal missing value (less than one percent for each feature).
3.2.2 validation_labels.csv
The validation_labels.csv file has 5046 rows, which is equal to the number of vehicles contributed to the operational data of the validation set. It includes a column named class_label, corresponding to the class for the last readout of each vehicle.
As mentioned in subsection validation_operational_readouts.csv, the last readout for the validation set is selected randomly among all readouts for each vehicle. The temporal placement of this final simulated readout is categorized into five classes denoted by 0, 1, 2, 3, 4 where they are related to readouts within a time window of: (more than 48), (48 to 24), (24 to 12), (12 to 6), and (6 to 0) time_step before the failure, respectively. These classes show the time windows in which the last readouts for each vehicle are randomly selected. For instance, in Fig. 6, the last simulated readout is given in the time window of class 2.
This data set is also imbalanced and is skewed toward class 0. Table 1 shows number of vehicles with the last readout assigned to each of these five classes.
| Label | Readouts |
|---|---|
| 0 | 4910 |
| 1 | 16 |
| 2 | 14 |
| 3 | 30 |
| 4 | 76 |
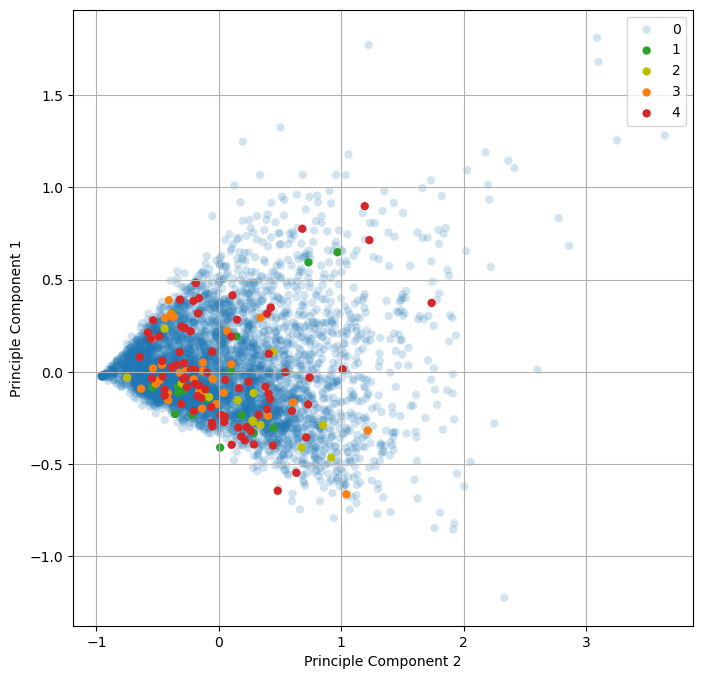
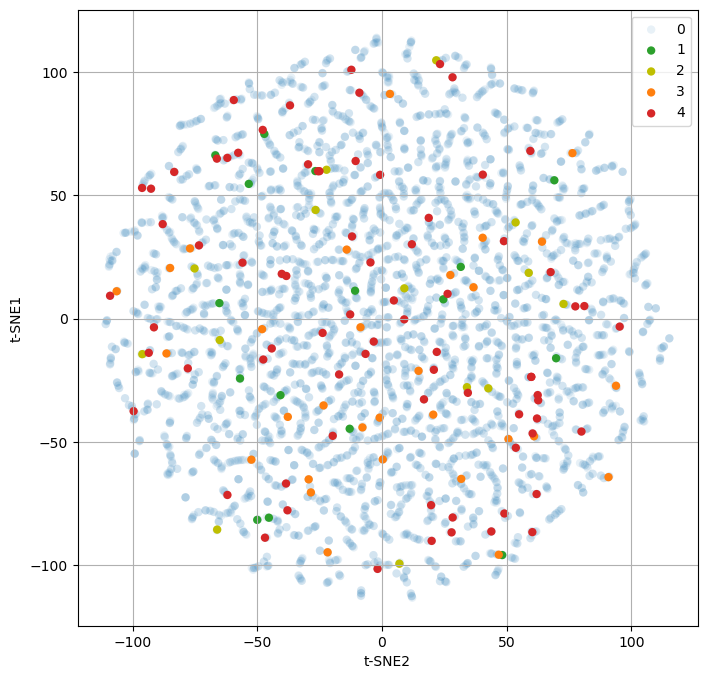
For better visualization of the validation data, two techniques for dimensionality reduction, called Principal Component Analysis (PCA) and t-distributed Stochastic Neighbor Embedding (t-SNE), are performed on the last readout from each vehicle in the validation set. Figure 7(a) and Fig. 7(b) show the dataset when its dimension is reduced into two, using PCA and t-SNE techniques, respectively. Vehicles belonging to each class are shown in different colors. As can be seen, the five classes of the dataset are scrambled in the two-dimensional space both for PCA and t-SNE. This demonstrates the complexity of the problem when the features are projected into two dimensions.
3.2.3 validation_specification.csv
The file validation_specification.csv has a similar structure as train_specifications.csv except the data is collected from 5046 vehicles in the validation set. Details of categorical values of each feature are shown in Fig. 8. Additionally, it has no missing values.
3.3 Test set
The test set contains two files "test_operational_readouts.csv", and "test_specifications.csv." Compared to the training and validation set, this part of the data does not include information about the failure time or label for Component X since the goal is to predict the label or the component’s lifetime in the industrial challenge of the IDA 2024 conference. Once the 2024 IDA Industrial Challenge is over the true class labels of the test set will be revealed.
3.3.1 test_operational_readouts.csv
Similar to validation_operational_readouts.csv, for the test_operational_readouts.csv, the last readouts of vehicles are randomly selected from the larger sequences observed during the study period (see Fig. 6) to emulates real-life situations. In summary, this file contains 198140 number of readouts from 14 variables (107 columns) gathered from 5045 unique vehicles. Similar to validation_operational_readouts.csv and train_operational_readouts.csv, the percentage of missing values in this file is less than one percent for each feature.
3.3.2 test_specifications.csv
Specification information of 5045 test vehicles is collected in test_specifications.csv file containing categorical values varying between Cat0, Cat1,…, and Cat8. Furthermore, this file has no missing values.
4 Technical Validation
OEMs usually hesitate to share their device operational data for many reasons, such as GDPR compliance, confidentiality agreements (NDAs), ownership of data, device failure rates, etc. As a result, many works on data-driven PdM are limited to private datasets [18, 19, 20, 21, 22, 23]. This prevents researchers who worked with real data comparing their methods performances with each other. The newly shared dataset by SCANIA can serve as a benchmark in the field, making it easier for future researchers to compare their methods and generate reproducible results.
The proposed dataset is highly conducive to various machine learning tasks like regression, anomaly detection, survival analysis, and classification, in the PdM field. This merit arises from two supreme characteristics: being a real-world dataset collected from actual trucks and exhibiting a multi-variate time series structure. In regression tasks, this dataset is valuable for estimating components’ remaining useful life or predicting the time until the next repair. Leveraging historical and time-to-event data, regression models can provide insightful estimates. Survival analysis is a powerful technique that predicts the survival function and the probability of an event happening at a specific time while considering censored data in the training phase. The blue vehicle populations in Fig 4 are referred to as censored data. The temporal structure of the dataset is crucial for the effective application of survival analysis. Furthermore, for classification tasks, using time series data, the model can classify whether a vehicle is going to fail within a specific time window or not.
To evaluate the performance of the aforementioned models, a cost function is suggested by experts of the company, which is defined by the sum of the different “Cost_n_m” multiplied by the number of instances, resulting in a summarized cost (Total_cost).
| (1) |
Equation 1 calculates the total cost function, where n shows the actual class, and m shows the predicted class, while n, m {0,1,2,3,4}. In general, when n<m, the Cost_n_m indicates a cost for a false positive error, and if n>m, it indicates a cost for a false negative error. It should be emphasized that the cost of false negative prediction is much higher than that of false positive prediction. Table 2 demonstrates the different values of Cost_n_m according to different values of actual and predicted class prediction. In this table, the term "Cost_0_{1,2,3,4}" denotes the cost incurred when a mechanic conducts an unnecessary check at a workshop. On the other hand, "Cost_{1,2,3,4}_m" represents the cost associated with the possibility of missing a faulty truck or triggering an alarm too late. This delay could lead to a breakdown or necessitate costly adjustments to the transportation plan for the customer.
| Predicted: 0 | Predicted: 1 | Predicted: 2 | Predicted: 3 | Predicted: 4 | |
| Actual: 0 | Cost_0_1=7 | Cost_0_2=8 | Cost_0_3=9 | Cost_0_4=10 | |
| Actual: 1 | Cost_1_0=200 | Cost_1_2=7 | Cost_1_3=8 | Cost_1_4=9 | |
| Actual: 2 | Cost_2_0=300 | Cost_2_1=200 | Cost_2_3=7 | Cost_2_4=8 | |
| Actual: 3 | Cost_3_0=400 | Cost_3_1=300 | Cost_3_2=200 | Cost_3_4=7 | |
| Actual: 4 | Cost_4_0=500 | Cost_4_1=400 | Cost_4_2=300 | Cost_4_3=200 |
5 Data availability
The proposed dataset collected from component X of SCANIA trucks is publicly available and licensed under CC BY 4.0[24]. This dataset consists of seven individual data files, all in CSV (Comma-Separated Values) format. Please note that the data file containing the labels for the test set is currently unavailable since this dataset was released for the ongoing IDA 2024 industrial challenge. The goal is to estimate these labels for the test set, and the corresponding data file will be published when the industrial challenge is concluded.
6 Acknowledgements
This work has been funded by Scania CV AB and the Vinnova Program for Strategic Vehicle Research and Innovation (FFI).
References
- [1] Turbofan Engine Degradation Simulation Data Set. NASA Prognostics Data Repository, NASA Ames Research Center, Moffett Field, CA (2008). Https://www.nasa.gov/content/diagnostics-prognostics.
- [2] SCANIA component dataset X for predictive maintenance. The 22nd International Symposium on Intelligent Data Analysis (IDA 2024) Industrial Challenge Repository, https://ida2024.org/industrial-challenge/ (2024).
- [3] Lindgren, T. & Steinert, O. Low dimensional synthetic data generation for improving data driven prognostic models. In 2022 IEEE International Conference on Prognostics and Health Management (ICPHM), 173–182 (IEEE, 2022).
- [4] APS Failure at Scania Trucks. UCI Machine Learning Repository, {DOI}:https://doi.org/10.24432/C51S51 (2017).
- [5] Huang, Z., Wu, Y., Tempini, N., Lin, H. & Yin, H. An energy-efficient and trustworthy unsupervised anomaly detection framework (eatu) for iiot. \JournalTitleACM Transactions on Sensor Networks 18, 1–18 (2022).
- [6] Abidi, M. H., Umer, U., Mohammed, M. K., Aboudaif, M. K. & Alkhalefah, H. Automated maintenance data classification using recurrent neural network: Enhancement by spotted hyena-based whale optimization. \JournalTitleMathematics 8, 2008 (2020).
- [7] Selvi, K. T., Praveena, N., Pratheksha, K., Ragunanthan, S. & Thamilselvan, R. Air pressure system failure prediction and classification in scania trucks using machine learning. In 2022 Second International Conference on Artificial Intelligence and Smart Energy (ICAIS), 220–227 (IEEE, 2022).
- [8] Lokesh, Y., Nikhil, K. S. S., Kumar, E. V. & Mohan, B. G. K. Truck aps failure detection using machine learning. In 2020 4th International Conference on Intelligent Computing and Control Systems (ICICCS), 307–310 (IEEE, 2020).
- [9] Ranasinghe, G. D., Lindgren, T., Girolami, M. & Parlikad, A. K. A methodology for prognostics under the conditions of limited failure data availability. \JournalTitleIEEE Access 7, 183996–184007 (2019).
- [10] Oh, E. & Lee, H. Quantum mechanics-based missing value estimation framework for industrial data. \JournalTitleExpert Systems with Applications 236, 121385 (2024).
- [11] Ke, Q., Siłka, J., Wieczorek, M., Bai, Z. & Woźniak, M. Deep neural network heuristic hierarchization for cooperative intelligent transportation fleet management. \JournalTitleIEEE Transactions on Intelligent Transportation Systems 23, 16752–16762 (2022).
- [12] Sun, K., Magnússon, S., Steinert, O. & Lindgren, T. Robust contrastive learning and multi-shot voting for high-dimensional multivariate data-driven prognostics. In 2023 IEEE International Conference on Prognostics and Health Management (ICPHM), 53–60 (IEEE, 2023).
- [13] Akarte, M. M. & Hemachandra, N. Predictive maintenance of air pressure system using boosting trees: A machine learning approach. In ORSI (2018).
- [14] Rafsunjani, S., Safa, R. S., Al Imran, A., Rahim, M. S. & Nandi, D. An empirical comparison of missing value imputation techniques on aps failure prediction. \JournalTitleInternational Journal of Information Technology and Computer Science 2, 21–29 (2019).
- [15] Syed, M. N., Hassan, M. R., Ahmad, I., Hassan, M. M. & De Albuquerque, V. H. C. A novel linear classifier for class imbalance data arising in failure-prone air pressure systems. \JournalTitleIEEE Access 9, 4211–4222 (2020).
- [16] Taghandiki, K. & DallakehNejad, M. Minimizing the repair cost of the air pressure system of scania trucks using a deep learning algorithm. \JournalTitleTechRxiv (2023).
- [17] Beikmohammadi, A. et al. A cost-sensitive transformer model for prognostics under highly imbalanced industrial data. \JournalTitlearXiv preprint arXiv:2401.08115 (2024).
- [18] Moat, G. & Coleman, S. Survival analysis and predictive maintenance models for non-sensored assets in facilities management. In 2021 IEEE international conference on big data (Big Data), 4026–4034 (IEEE, 2021).
- [19] Rahat, M., Kharazian, Z., Mashhadi, P. S., Rögnvaldsson, T. & Choudhury, S. Bridging the gap: A comparative analysis of regressive remaining useful life prediction and survival analysis methods for predictive maintenance. In PHM Society Asia-Pacific Conference, vol. 4 (2023).
- [20] Hoffmann, M. A. & Lasch, R. Roadmap for a successful implementation of a predictive maintenance strategy. \JournalTitleSmart and Sustainable Supply Chain and Logistics–Trends, Challenges, Methods and Best Practices: Volume 1 423–439 (2020).
- [21] Rahat, M., Pashami, S., Nowaczyk, S. & Kharazian, Z. Modeling turbocharger failures using markov process for predictive maintenance. In 30th European Safety and Reliability Conference (ESREL2020) & 15th Probabilistic Safety Assessment and Management Conference (PSAM15), Venice, Italy, 1-5 November, 2020 (European Safety and Reliability Association, 2020).
- [22] Bouabdallaoui, Y., Lafhaj, Z., Yim, P., Ducoulombier, L. & Bennadji, B. Predictive maintenance in building facilities: A machine learning-based approach. \JournalTitleSensors 21, 1044 (2021).
- [23] Rahat, M. et al. Domain adaptation in predicting turbocharger failures using vehicle’s sensor measurements. In PHM Society European Conference, vol. 7, 432–439 (2022).
- [24] Licence. Https://creativecommons.org/licenses/by/4.0/.