MaNGA AGN dwarf galaxies (MAD) - I. A new sample of AGN in dwarf galaxies with spatially resolved spectroscopy
Abstract
The finding of active galactic nuclei (AGN) in dwarf galaxies has important implications for galaxy evolution and supermassive black hole formation models. Yet, how AGN in dwarf galaxies form is still debated, in part due to scant demographics. We make use of the MaNGA survey, comprising 10,000 galaxies at z 0.15, to identify AGN dwarf galaxies using a spaxel by spaxel classification in three spatially-resolved emission line diagnostic diagrams (the [NII-, [SII]- and [OI]-BPT) and the WHAN diagram. This yields a sample of 664 AGN dwarf galaxies, the largest to date, and an AGN fraction of that is significantly larger than that of single-fiber-spectroscopy studies (i.e. ). This can be explained by the lower bolometric luminosity ( erg s-1) and accretion rate (sub-Eddington) of the MaNGA AGN dwarf galaxies. We additionally identify 1,176 SF-AGN (classified as star-forming in the [NII]-BPT but as AGN in the [SII]- and [OI]-BPT), 122 Composite, and 173 LINER sources. The offset between the optical center of the galaxy and the median position of the AGN spaxels is more than 3 arcsec for 62% of the AGN, suggesting that some could be off-nuclear. We also identify seven new broad-line AGN with log = 5.0 - 5.9 . Our results show how integral-field spectroscopy is a powerful tool for uncovering faint and low-accretion AGN and better constraining the demographics of AGN in dwarf galaxies.
keywords:
Galaxies: dwarf, active, accretion1 Introduction
The investigation of active galactic nuclei (AGN) in dwarf galaxies (stellar mass M⊙) has become of major importance for studies of black hole (BH) formation and galaxy evolution. On one hand, dwarf galaxies have low mass, low metallicity, and a presumably modest merger history, hence they are thought to resemble the first galaxies formed in the early Universe. On the other hand, these primordial dwarf galaxies are candidate to host BHs of mass M M⊙ (also called intermediate-mass BHs, IMBHs; e.g., Mezcua 2017; Greene et al. 2020) formed even earlier on (at redshifts z 10) and that are the seeds of the supermassive BHs (SMBHs; M⊙) detected at z6-7 (e.g., Wang et al. 2021) and even at z10 thanks to the superb sensitivity of the James Webb Space Telescope (e.g., Maiolino et al. 2023). Those seed BHs that did not become supermassive should be found in today’s dwarf galaxies as relic IMBHs if dwarf galaxies are regulated by supernova feedback, which expels the gas from the center via stellar winds and prevents BH growth (e.g., van Wassenhove et al. 2010; Habouzit et al. 2017). In this scenario, deriving the AGN occupation fraction (as proxy of BH occupation fraction) and luminosity function in dwarf galaxies can provide important constraints on the formation mechanisms of the high-z seed BHs (e.g., Volonteri et al. 2008; Ricarte & Natarajan 2018; Burke et al. 2022; Beckmann et al. 2023).
A BH occupation fraction of 100% is expected for dwarf galaxies of log M⊙ if seed BHs of up to 1,000 M⊙ formed from the death of the first generation of Population III stars (‘light’ seeds; e.g., Madau & Rees 2001; Bromm & Larson 2004; see review by e.g., Woods et al. 2019). A lower BH occupation fraction of 50% is instead expected in the case of ‘heavy’ seeds of up to M⊙ formed from direct collapse of pristine gas (e.g., Loeb & Rasio 1994; Bromm & Loeb 2003; Latif et al. 2022). The predicted BH occupation fraction is however strongly dependent on the modelling of cosmological simulations (e.g., Haidar et al. 2022), and distinguishing between light and heavy seeds becomes blurry if heavy BHs are formed at later epochs in nuclear stellar clusters (e.g., Natarajan 2021; Fragione et al. 2022; Baldassare et al. 2022), seed BH growth is significantly impacted by galaxy mergers and AGN feedback (e.g., Deason et al. 2014; Mezcua 2019, 2021), BHs are off-nuclear (e.g., Bellovary et al. 2019; Ricarte et al. 2021; Burke et al. 2023), or other possible seed BH formation mechanisms are considered (e.g., Bonoli et al. 2014; Carr & Kühnel 2020; Latif et al. 2020; Schleicher et al. 2022).
Multiple studies have yet focused on identifying AGN in dwarf galaxies (see reviews by Mezcua 2017; Greene et al. 2020; Reines 2022), deriving their AGN fraction (e.g., Pardo et al. 2016; Mezcua et al. 2018; Birchall et al. 2020; Bykov et al. 2024), and probing the impact of AGN feedback both from an observational (e.g., Bradford et al. 2018; Manzano-King et al. 2019; Mezcua et al. 2019; Liu et al. 2020; Bohn et al. 2021; Davis et al. 2022; Schutte & Reines 2022) and theoretical perspective (e.g., Dashyan et al. 2018; Barai & de Gouveia Dal Pino 2019; Sharma et al. 2022; Koudmani et al. 2021, 2022). Most searches are based on the use of optical emission line diagnostic diagrams (e.g., [OIII]5007/H versus [NII]6583/H, from now on [NII]-BPT111Baldwin et al. (1981) - BPT- diagrams, and [OIII]5007/H versus [SII]6717,6731/H, from now on [SII]-BPT) to distinguish between AGN and star-formation ionisation, and the detection of broad Balmer lines to measure a BH mass M⊙ consistent with that of IMBHs (e.g., Filippenko & Sargent 1989; Barth et al. 2004; Greene & Ho 2004, 2007; Reines et al. 2013; Moran et al. 2014; Baldassare et al. 2015; Marleau et al. 2017; Chilingarian et al. 2018). While having provided hundreds of low-mass AGN, these methods are biased towards i) nearby (z0.3; but see Halevi et al. 2019; Harikane et al. 2023; Kocevski et al. 2023; Mezcua et al. 2023; Siudek et al. 2023; Übler et al. 2023 for higher z) dwarf galaxies with solar to super-solar metallicities (as low-metallicity galaxies have low [NII]/H values and thus move to the star-forming region of the [NII]-BPT; e.g., Groves et al. 2006; Cann et al. 2019), and ii) central AGN with high luminosities (e.g., Greene et al. 2020). These biases can be circumvented by the addition of the [OIII]5007/H versus [OI]6300 diagram (from now on [OI]-BPT), which is insensitive to metallicity (e.g., Polimera et al. 2022), and the use of X-ray observations (e.g., Schramm et al. 2013; Lemons et al. 2015; Pardo et al. 2016; Mezcua et al. 2016, 2018; Chen et al. 2017; Birchall et al. 2020; Birchall et al. 2022), radio observations (e.g., Mezcua et al. 2019; Reines et al. 2020; Davis et al. 2022), optical and infrared variability (e.g., Baldassare et al. 2018, 2020; Martínez-Palomera et al. 2020; Secrest & Satyapal 2020; Ward et al. 2022), or coronal lines (e.g., Satyapal et al. 2007; Cann et al. 2018; Cann et al. 2020, 2021; Molina et al. 2021; Salehirad et al. 2022; Reefe et al. 2023) to identify AGN. X-ray observations offer, in addition, the possibility to derive an AGN fraction corrected for completeness and out to intermediate redshifts (e.g., Mezcua et al. 2018; Birchall et al. 2020; Birchall et al. 2022; Bykov et al. 2024), which can then be contrasted to predictions of cosmological simulations (e.g., Haidar et al. 2022).
Both X-ray and radio observations are moreover excellent tools for identifying AGN that are wandering the dwarf galaxy body rather than being central (e.g., Mezcua et al. 2018; Reines et al. 2020), as predicted by seed BH formation models (e.g., Bellovary et al. 2019; Pfister et al. 2019). However, both X-ray and radio campaigns are observationally expensive and thus limited in sky coverage. Moreover, only 10% of AGN are radio-emitters. In the optical, such wandering or off-nuclear AGN can be identified with the use of integral field unit (IFU) spectroscopy (e.g., Comerford et al. 2022). Mezcua & Domínguez Sánchez (2020, MDS+2020 from now on) used the SDSS222Sloan Digital Sky Survey, https://www.sdss.org/MaNGA (Mapping NearbyGalaxies at APO; Bundy et al. 2015) survey Data Release333http://www.sdss.org/surveys/manga 15 to search for AGN in dwarf galaxies. Out of 1609 dwarves, they found 37 AGN based on spatially-resolved emission line diagnostic diagrams. Most of these 37 AGN dwarf galaxies were offset from the optical center of the galaxy - probably due to the AGN being off-nuclear or switched off or the central emission being dominated by star formation - and hence had been missed by previous searches using single-fiber SDSS spectroscopy.
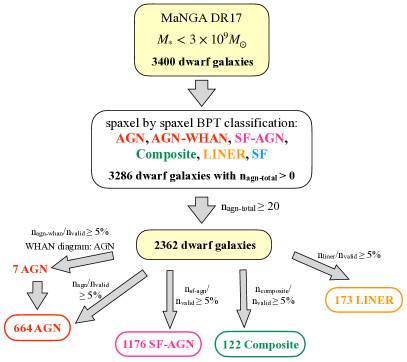
We note that all previous searches for AGN using MaNGA data have used the [NII]- and [SII]-BPT only, in many cases in combination with the WHAN diagram. This biases the identification of AGN towards galaxies with solar to super-solar metallicities, missing a large fraction of low-metallicity galaxies hosting AGN (e.g., Polimera et al. 2022). In addition, many searches have made use of integrated spectra within a (usually 3-arcsec radius) central aperture (e.g., Rembold et al. 2017; Sánchez et al. 2018; Cortes-Suárez et al. 2022) or the MaNGA field-of-view of the galaxy (e.g., Cano-Díaz et al. 2022). Those works using the spatially resolved information provided by the MaNGA IFU identify AGN using a certain AGN/LINER spaxel fraction and the distance between the AGN and star-formation demarcation line as an AGN metric (e.g., Wylezalek et al. 2018; Comerford et al. 2022) or a certain number of AGN/LINER spaxels classified as such by the [NII]- and [SII]-BPT (MDS+2020). This yields AGN fractions in dwarf galaxies of % (MDS+2020), much smaller than the 16%-30% obtained by Polimera et al. (2022) when using integrated spectra but considering both the [NII]-, [SII]-, and [OI]-BPT in order not to miss AGN in low-metallicity galaxies. Yet, the bolometric luminosity of the AGN in the MDS+2020 dwarf galaxy sample was erg s-1, the faintest among those found in previous optical, X-ray or radio searches, and the MaNGA data allowed to reveal a new type 1 AGN with log M M⊙. Given the power of IFU spectroscopy for revealing hidden and faint AGN in dwarf galaxies, in this paper we expand the work of MDS+2020 to the final MaNGA data release (DR17444https://www.sdss.org/dr17/manga/) and perform a thorough identification of AGN using a pioneering spaxel by spaxel classification based on three spatially resolved emission line diagnostic diagrams ([NII]-, [SII]-, and [OI]-BPT; e.g., Polimera et al. 2022) together with the WHAN diagram. As a result we obtain a sample of 664 AGN dwarf galaxies, the largest so far found in searches for AGN in dwarf galaxies, and which will be used as a benchmark for subsequent studies of the stellar population properties, AGN outflows, and merger activity in dwarf galaxies.
2 Sample and analysis
The MaNGA DR17 is the final data release that contains all the observations and science data products for the complete survey, which includes over 10,000 galaxies at redshift z 0.15. MaNGA uses 17 IFUs, each composed by bundles of 19 to 127 fibers with a diameter of 2 arcsec, to cover a wavelength range of 3,600-10,300 Å across 1.5 to 2.5 effective radii () at a spectral resolution R 2,000 and instrumental velocity dispersion of 70 km s-1 (1 ; Law et al. 2021). The MaNGA data-analysis pipeline555https://www.sdss.org/dr17/manga/manga-analysis-pipeline/ (DAP) performs a stellar-continuum modeling and provides emission line measurements and 2D maps of measured properties. The size of the square spaxels in the maps are of 0.5 arcsec thanks to a dithering observational strategy (Law et al. 2015). In this paper we make use of the HYB10-MILESHC-MASTARHC2 maps 666The choice of HYB10-MILESHC-MASTARHC2 maps against other spectral fitting provided by DR17 is motivated by the more realistic H/H ratios obtained with that methodology (see Figure 5 in Bernardi et al. 2023., in which a Voronoi binning algorithm (Cappellari & Copin 2003) has been used to bin the spaxels to a signal-to-noise ratio (SNR) 10 for the kinematic analysis but the emission-line measurements have been performed on the individual spaxels. This provides greater spatial resolution for emission-line analysis, with a median Full Width Half Maximum (FWHM) of 2.5 arcsec, while avoiding the limitations of tying the analysis to the SNR of the broadband continuum. We also take from the MaNGA DAP the total star-formation rate (SFR) estimated from the Gaussian-fitted H flux within the IFU field-of-view. The RA and DEC (from now on referred to as ‘optical center’ of the galaxy), redshift () and are taken from the NASA-Sloan Atlas (NSA catalog) version v1_0_1, which is the one used by MaNGA for its targeting777https://www.sdss.org/dr17/manga/manga-target-selection/nsa/.
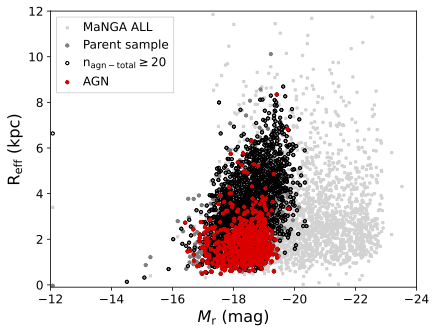
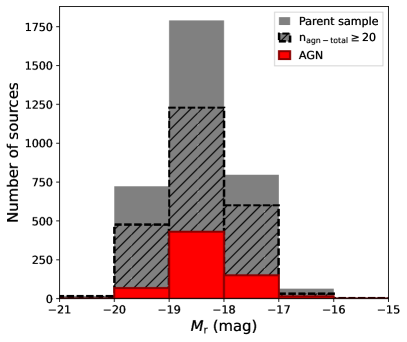
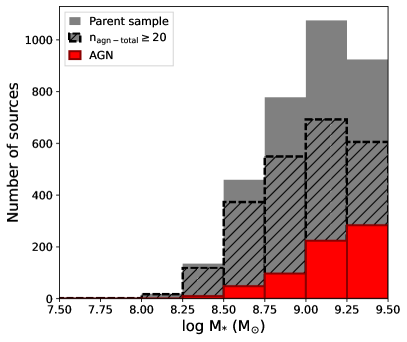
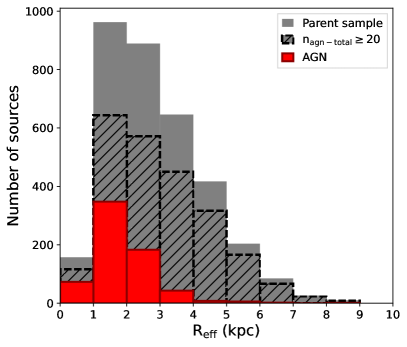
We draw our sample of dwarf galaxies as in MDS+2020: we consider only those galaxies with Petrosian and Sérsic NSA stellar masses consistent within 0.5 dex (Secrest & Satyapal 2020) and then select dwarf galaxies as having M⊙ (similar to that of the Large Magellanic Cloud and typically considered in searches for AGN in dwarf galaxies, e.g., Reines et al. 2013; Reines et al. 2020; Mezcua et al. 2018; Mezcua et al. 2019). To avoid biases towards galaxy type we do not apply any magnitude cut (e.g., Reines et al. 2013). Yet, all the dwarves have absolute r-band magnitude (see Fig. 1). The stellar mass cut yields an initial sample of 3436 dwarf galaxies, of which 3,400 are unique galaxies888The DR17 sample contains a number of galaxies that have been observed more than once, either deliberately for data quality assessment purposes or due to early issues with targeting and/or plate drilling. according to the DUPL_GR parameter from the MaNGA Deep Learning Morphology catalogue (Domínguez Sánchez et al. 2022, see also Fischer et al. 2019; see Fig. 2).
2.1 Emission line diagnostic classification of individual spaxels
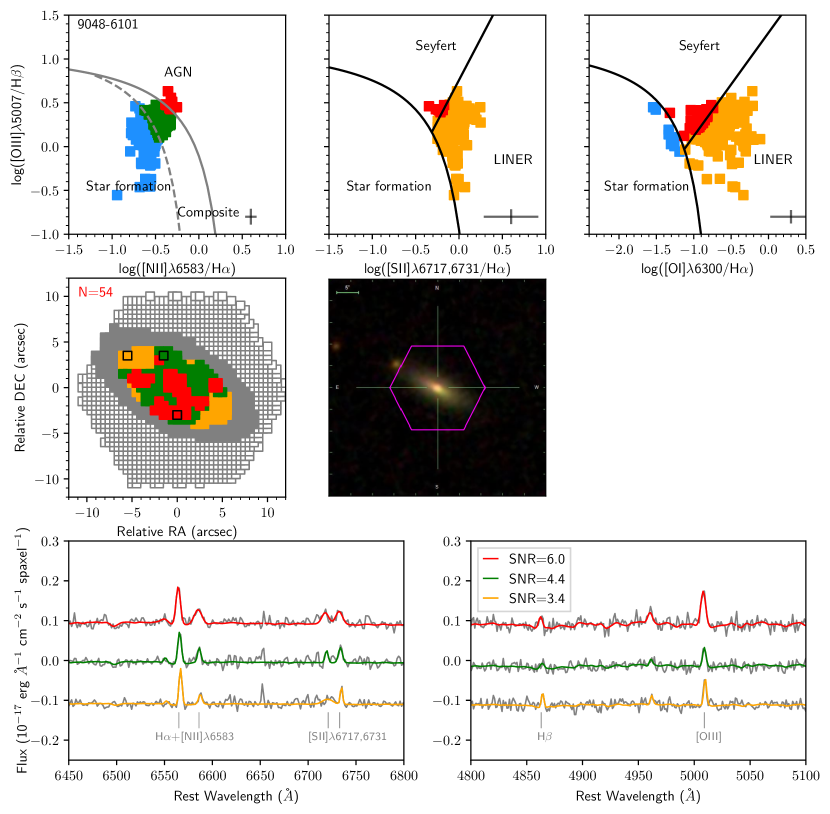
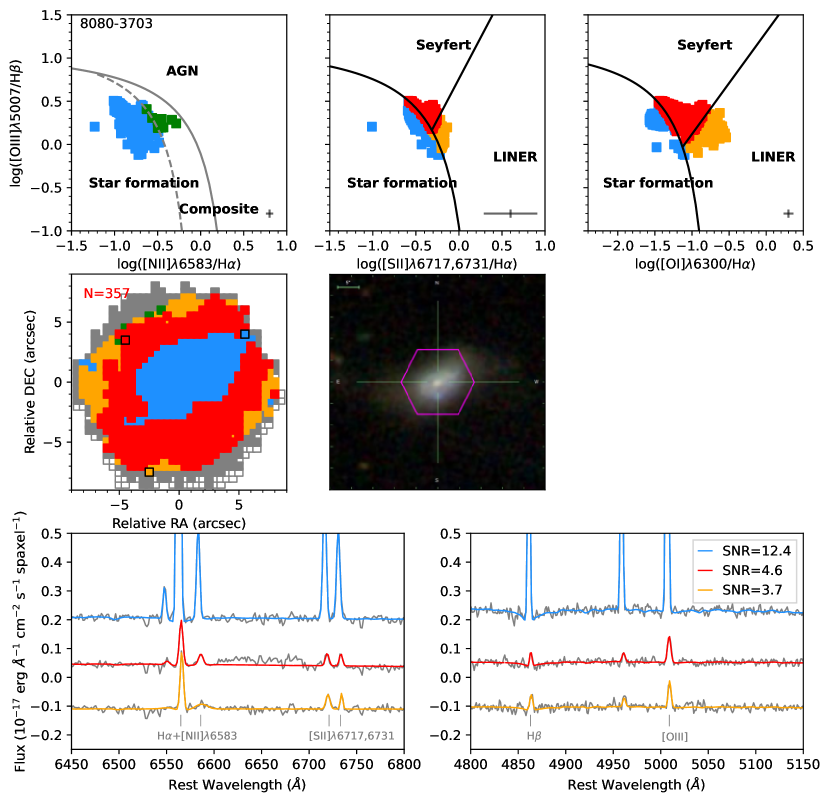
To identify AGN among the sample of dwarf galaxies we use three optical emission line diagnostic diagrams: the [NII]-BPT, the [SII]-BPT, and the [OI]-BPT. We use the Kewley et al. (2001, 2006) and Kauffmann et al. (2003) demarcation lines to differentiate between AGN, star-formation (SF), and Composite (mixture of AGN and SF) ionisation in the [NII]-BPT, and between Seyfert, SF, and LINER ionisation in the [SII]-BPT and [OI]-BPT. Hot old (post-AGB) stars can mimic LINER emission line ratios and are characterized by an H equivalent width (EW) 3Å. Hence, we additionally make use of the WHAN diagram (Cid Fernandes et al. 2010) to differentiate between true AGN (EW(H) 3Å and flux ratio log [NII]/H -0.4) and SF.
Based on these diagnostics, each spaxel is classified as follows:
- •
- •
- •
- •
- •
- •
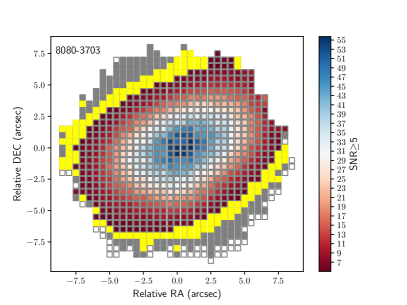
We only consider those spaxels with SNR3 for the emission lines used in each BPT (H, H, [NII]6583, [SII]6718+[SII]6732, [OIII]5007, [OI]6300) and with an unmasked stellar velocity and stellar velocity dispersion (to ensure that continuum subtraction in that spaxel is correct). Examples of how the fits to these lines vary with SNR are shown in Figs. 6-7. A discussion on the effects of the SNR threshold selection can be found in Appendix A.
For each galaxy we then compute the total number of spaxels classified as either AGN, AGN-WHAN, or SF-AGN (), as well as the total number of spaxels that are valid, this is, with SNR3 and unmasked stellar velocity and stellar velocity dispersion ().
Applying the above criteria, 3,286 out of the 3,400 dwarf galaxies are found to have at least one AGN, AGN-WHAN or SF-AGN spaxel (this is, ).
2.2 Emission line diagnostic classification of each galaxy
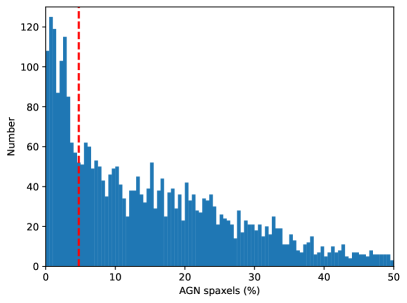
After performing a spaxel by spaxel classification, we plot a histogram of the fraction of AGN + AGN-WHAN + SF-AGN spaxels that are valid (/; see Figure 3) for the sample of 3,286 dwarf galaxies. We then select as threshold the percentage at which there is a significant drop of the main population. We chose a percentage of 5%, and perform a final classification of each galaxy as follows:
-
•
AGN: if the ratio of AGN spaxels to valid spaxels (/) 5%.
-
•
AGN-WHAN: if the ratio of AGN-WHAN spaxels to valid spaxels (/) 5% and the galaxy is not AGN. WHAN diagram to be applied.
-
•
SF-AGN: if the ratio of SF-AGN spaxels to valid spaxels (/) 5% and the galaxy is not AGN nor AGN-WHAN.
-
•
Composite: if the ratio of Composite spaxels to valid spaxels (/) 5% and the galaxy is not AGN nor AGN-WHAN nor SF-AGN.
-
•
LINER: if the ratio of LINER spaxels to valid spaxels (/) 5% and the galaxy is not AGN nor AGN-WHAN nor SF-AGN nor Composite.
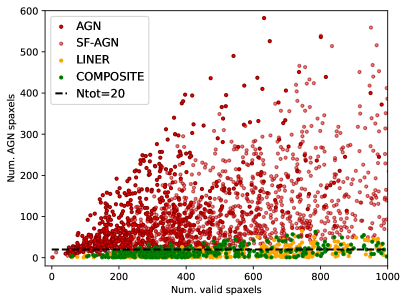
This results in 698 AGN, 337 AGN-WHAN, 1,203 SF-AGN, 445 Composite, and 552 LINER dwarf galaxies. Applying the WHAN diagram to the 337 AGN-WHAN we obtain that seven of the galaxies are classified as AGN. Including these seven AGN-WHAN that are AGN according to the WHAN diagram, we have that out of 3,286 dwarves there are 705 AGN. The number of vs. spaxels for these 705 AGN, 1203 SF-AGN, 445 Composite and 552 LINER dwarf galaxies is plotted in Fig. 4. At = 20 a clear separation can be observed between AGN and LINER/Composite galaxies. To be conservative and define an AGN sample as robust as possible, we thus apply a further cut to select only sources with 20. This removes 323 Composite and 379 LINER galaxies from our sample, but only 27 SF-AGN and 41 AGN, none of which are AGN based on other diagnostics (integrated SDSS emission line classification, radio emission, X-ray emission, or infrared emission; see Sects. 3.1 and 3.2). We find that this cut is the most balanced one between number of AGN and Composite/LINER galaxies excluded. For instance, using a threshold of = 10 we would only miss 2 AGN but include still hundreds of Composite and LINER dwarf galaxies. Increasing the threshold to = 50, we would miss 1,720 sources, of which 254 are AGN. Five of these AGN are also classified as such based on radio and infrared diagnostics. Therefore, our final sample is selected by applying a cut at 20. This reduces the sample of 3,286 dwarf galaxies with some indication of AGN ionisation (i.e. 0) to 2,362 galaxies with strong indication of AGN ionisation ( 20), of which 664 are AGN, 1,176 SF-AGN, 122 Composite, and 173 LINERs (see Fig. 5). The 664 AGN constitute our primary sample of AGN dwarf galaxies. Examples of the spatially-resolved spaxel by spaxel emission line diagnostic classification for an AGN and a SF-AGN dwarf galaxy are shown in Figs. 6-7.
3 Results and Discussion
The application of the above emission line diagnostic criteria to the parent sample of 3,400 dwarf galaxies results in 2,362 galaxies with strong AGN ionisation features ( 20), among which 664 AGN, 1,176 SF-AGN, 122 Composite, and 173 LINERs are identified. The properties of ten of these sources are provided in Table 1, while the full catalogue can be found in the online version of the paper. To investigate whether these sources are identified as AGN by single-fiber integrated emission line diagnostics, we use their SDSS emission line ratios and crossmatch with catalogues of type 1 AGN. We also check whether they are included in previous MaNGA samples of AGN and whether they have counterparts at other wavelengths (infrared, X-rays, radio) indicating an AGN nature.
| MaNGA | MaNGA | RA (J2000) | DEC (J2000) | log | SFR | Type | Other | |
|---|---|---|---|---|---|---|---|---|
| plateifu | ID | (deg) | (deg) | (M⊙) | (M⊙ yr-1) | |||
| (1) | (2) | (3) | (4) | (5) | (6) | (7) | (8) | (9) |
| 9886-3701 | 1-594067 | 237.785510 | 25.722870 | 0.022 | 8.3 | 0.002264 | AGN | – |
| 9886-3702 | 1-317589 | 238.020919 | 26.074462 | 0.021 | 8.5 | 0.035987 | SF-AGN | – |
| 9886-6102 | 1-317060 | 237.961673 | 25.937835 | 0.022 | 8.4 | 0.021797 | SF-AGN | – |
| 9886-9101 | 1-375801 | 237.371264 | 24.876893 | 0.024 | 8.9 | 0.046428 | SF-AGN | – |
| 9889-1902 | 1-440292 | 234.858600 | 24.943569 | 0.023 | 9.2 | 0.188022 | AGN | RADIO |
| 9889-6102 | 1-440301 | 234.789840 | 24.830893 | 0.016 | 8.7 | 0.045221 | SF-AGN | – |
| 9890-12705 | 1-316607 | 233.520461 | 29.906882 | 0.037 | 8.9 | 0.072680 | SF-AGN | – |
| 9891-12703 | 1-593748 | 229.324480 | 29.400540 | 0.018 | 8.7 | 0.008508 | SF-AGN | – |
| 9891-1901 | 1-593648 | 227.177572 | 28.171156 | 0.026 | 9.4 | 0.218527 | AGN | – |
| 9892-9102 | 1-295128 | 248.989901 | 24.104075 | 0.037 | 8.8 | 0.039987 | SF-AGN | – |
Column designation: (1) MaNGA plateifu; (2) MaNGA ID; (3,4) RA, DEC coordinates of the optical center of the galaxy or IFU center; (5) galaxy redshift; (6) galaxy stellar mass; (7) galaxy star-formation rate within the IFU FoV as provided by the MaNGA DAP (i.e. based on the H flux and uncorrected for extinction); (8) MaNGA BPT classification; (9) AGN in other diagnostics (radio, X-rays, mid-infrared –MIR–, or coronal lines –CL–). The full catalogue can be found in the online version of the paper.
3.1 SDSS emission line diagnostics
We crossmatch the sample of 2,362 dwarf galaxies with the emission-line catalogue of the Portsmouth Group999https://www.sdss.org/dr12/spectro/galaxy_portsmouth/, which includes emission-line measurements of the SDSS DR12, and select only those sources with SNR3 in the emission lines used in each BPT. This results in 1,575 dwarf galaxies with reliable SDSS emission line measurements. Among these 1,575 dwarf galaxies, there are 284 of our MaNGA AGN. However, of these 284 AGN only 52 are classified as AGN when using the SDSS emission line measurements and applying our same criteria as for the MaNGA sample (i.e. AGN or LINER in the [NII]-BPT, AGN in the [SII]-BPT, or AGN in the [OI]-BPT). Because type 1 AGN do not have emission-line measurements in the Portsmouth Group catalogue, we also crossmatch our sample of 2,362 dwarf galaxies with a) the type 1 AGN catalogue of Liu et al. (2019), which includes 14,584 broad-line AGN at z0.35 drawn from SDSS DR7, and b) the 305 IMBH candidates with broad H emission of Chilingarian et al. (2018), also drawn from SDSS DR7 using an automated data mining workflow. This results in five and three, respectively, broad-line AGN (see Sect. 3.7), all of which are classified as AGN when using MaNGA data. Of the five broad-line AGN from Liu et al. (2019), two are already included in the sample of 52 AGN identified by the BPT using the SDSS emission lines. Hence the total number of AGN classified as such when using SDSS emission line measurements is of 58 (out of the 284 that are AGN in MaNGA). The use of integrated SDSS spectra thus implies missing 80% of our sample of AGN.
The numbers are even more dramatic for the SF-AGN. There are 1,041 of our MaNGA SF-AGN among the 1,575 dwarves with reliable Portsmouth emission line measurements. Of these, only seven are classified as SF-AGN (i.e. SF in the [NII]-BPT and AGN in the [SII]- or [OI]-BPT) when using the SDSS fluxes. Nearly all of the SF-AGN MaNGA dwarf galaxies would thus be missed when using SDSS spectroscopy to search for SF-AGN (see also Polimera et al. 2022).
We also check how many of the dwarf galaxies are identified as AGN based on the SDSS emission line fluxes derived by Hviding et al. (2022), who apply the spectroscopic fitting package GELATO to 416,288 SDSS galaxies. Their sample includes 1,322 of our 2,362 dwarf galaxies, and all have SNR3 in the emission lines used in the [NII]-, [SII]-, and [OI]-BPTs. There are 308 of our AGN among the 1,322 dwarves, of which only 43 are classified as AGN based on the SDSS emission line fluxes of Hviding et al. (2022). This implies that 86% of the AGN are not identified as AGN when using integrated spectra, similarly to what was found when using the Portsmouth Group emission line measurements. In the case of SF-AGN, there are 736 of our SF-AGN among the 1,322 dwarves from Hviding et al. (2022). However, none of them are identified as such when using the SDSS measurements from Hviding et al. (2022). Hence all of the SF-AGN MaNGA dwarf galaxies with Hviding’s emission lines fluxes are missed when using SDSS integrated spectroscopy.
3.2 AGN diagnostics at other wavelengths
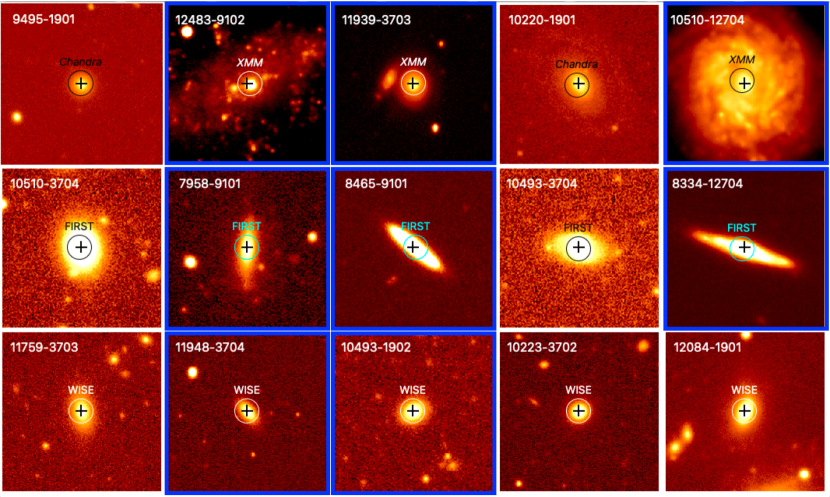
To further investigate the AGN nature of the sample of 2,362 dwarf galaxies we look for counterparts in the infrared, radio, and X-ray bands. All the galaxies are found to have a Wide-field Infrared Survey Explorer (WISE; Wright et al. 2010) mid-infrared counterpart within 10 arcsec; however, only 15 of them qualify as AGN according to the Jarrett et al. (2011) or Stern et al. (2012) criteria. Using the theoretical AGN cut of Satyapal et al. (2018), we find that six additional sources qualify as AGN. We also apply the most recent and stringent cuts from Hviding et al. (2022), finding 13 AGN already classified as such by the Jarrett et al. (2011), Stern et al. (2012), or Satyapal et al. (2018) criteria. Of the in total 21 (15+6) AGN dwarf galaxies according to WISE, 17 are classified as AGN, three as SF-AGN, and one as Composite by our emission line diagnostic classification. (Sect. 2.2).
In the radio, we find that out of the 2,362 dwarf galaxies, 55 have a Faint Images of the Radio Sky at Twenty Centimeters (FIRST; Becker et al. 1995) counterpart and 22 a 1.4GHz NRAO VLA Sky Survey (NVSS; Condon et al. 1998) counterpart within 5 arcsec. Of the 22 NVSS counterparts, 17 sources have also a FIRST counterpart, so for these we consider the FIRST radio fluxes rather than the NVSS fluxes in the radio analysis. The total number of FIRST/NVSS radio counterparts (excluding duplicates) is thus of 60. The integrated radio emission ranges from 0.7 to 31.6 mJy and is resolved in 35 (53%) of the sources. We use the SFR within the IFU FoV and the correlations from Filho et al. (2019, see Mezcua et al. 2019) to compute the expected (thermal and non-thermal) contribution from star formation to the radio emission. The SFR is corrected for extinction using the Calzetti et al. (2000) extinction law and the total integrated flux of the H and H emission lines within the full MaNGA FoV to compute the Balmer decrement (H/H) and color excess [E(B-V)]. To derive the maximum luminosity expected from a supernova remnant and supernova and the total luminosity expected from a population of supernova remnants and supernovae we use equations 5 and 6, respectively, in Reines et al. (2020). We find that in 27% (16 out of 60) of the detections the radio emission is above that expected from stellar processes and thus consistent with AGN. Among the 16 radio AGN, 69% are AGN and 19% SF-AGNs according to our MaNGA emission line diagnostic classification. Three of these sources are also classified as AGN according to the WISE diagnostics.
In the X-rays, we search for counterparts in the Chandra Source Catalog (Evans et al. 2010) Version 2 (CSC 2.0), whose sky coverage totals 560 deg2. Out of 2,362 dwarves, 177 have been observed by Chandra and are within the CSC footprint. Of these, there are 162 non-detections and 15 detections. For the detections, we get from the Master Source Catalog101010https://cxc.harvard.edu/csc/columns/master.html the aperture-corrected net energy flux inferred from the source region aperture, averaged over all contributing observations, in the ACIS broad (0.5-7.0 keV) energy band. The corresponding X-ray luminosities range from = 7.2 1038 erg s-1 to 4.5 1042 erg s-1. To investigate the origin of this X-ray emission we derive the 2-10 keV X-ray luminosity expected from X-ray binaries () using the relation between , , and SFR from Lehmer et al. (2010). We convert the CSC 0.5-7 keV to the 2-10 keV band applying a conversion factor of 7.207 10-16 erg cm-2 s-1 for an unabsorbed flux of 10-15 erg cm-2 s-1, found with PIMMS111111https://cxc.harvard.edu/toolkit/pimms.jsp assuming gamma=1.8. Ten out of the 15 CSC detections are found to have X-ray luminosities more than 3 above that expected from X-ray binaries and are thus consistent with being X-ray AGN.
We also look for X-ray counterparts in the fourth XMM-Newton serendipitous source (4XMM-DR11) catalogue (Webb et al. 2020). Using a search radius of 5 arcsec, we find 18 counterparts with flag=0 or 1 (i.e. no spurious detection) among the 2,362 dwarf galaxies. Their 0.2-12 keV luminosities range from = 8.0 1039 erg s-1 to 3.9 1042 erg s-1, which we convert to 2-10 keV using PIMMS. The 2-10 keV luminosities are more then 3 above that expected from X-ray binaries for 17 out of the 18 sources, indicating an AGN origin of the X-ray emission. Six of the XMM AGN have also a CSC counterpart consistent with being X-ray AGN.
One additional X-ray AGN is found among the 2,362 dwarf galaxies when crossmatching with the eROSITA Final Equatorial Depth Survey (eFEDS) main catalogue (Brunner et al. 2022) using a radius of 3 arcsec, which is the nominal positional accuracy of eROSITA. The eFEDS catalog includes 27,910 X-ray sources detected in the 0.2-2.3 keV energy range. The 2.3-5 keV band luminosity of the source is 3.4 1040 erg s-1, which we convert to 2-10 keV using PIMMS. The resulting 2-10 keV luminosity is more than 5 times higher than that estimated for X-ray binaries using Lehmer et al. (2010).
In total, 26 out of the 2,362 dwarf galaxies are found to have X-ray emission, 88% of which are consistent with AGN. Using our emission line diagnostics (Sect. 2.2), 48% of these sources qualify as AGN, 17% as SF-AGN, 17% as Composite, and 9% as LINER. Of these, two sources are also classified as AGN based on WISE diagnostics.
The detection of coronal lines has been also often used to infer the presence of AGN in dwarf galaxies, both in the infrared (e.g., Satyapal et al. 2007; Cann et al. 2018; Cann et al. 2020) and, more recently, also in the optical (e.g., Molina et al. 2021; Salehirad et al. 2022) regimes. Negus et al. (2023) have recently performed a search for coronal lines ([NeV] 3347, 3427, [FeVII] 3586, 3760, 6086, and [FeX] 6374) to the latest MaNGA’s DR17, finding 71 galaxies with emission from at least one of the coronal lines. Six of these galaxies are included in our sample: one as AGN, four as SF-AGN, and one LINER. None of them is classified as AGN according to any of the other multiwavelength diagnostics.
Therefore, in total, out of the 2,362 dwarf galaxies 3% (61 sources) are classified as AGN according to either the radio, X-ray or mid-infrared emission or the detection of coronal lines. Of these, 35 are classified as AGN using our emission line diagnostics, 14 as SF-AGN, 5 as Composite and 3 LINER121212The remaining sources are classified as Quenched or Retired by the WHAN diagram. Cutouts from the Legacy Survey DR9 are shown in Fig. 8 for a representative sample of 15 of the AGN with a counterpart at X-ray, radio, or mid-infrared wavelengths. Follow-up X-ray and radio campaigns should be able to increase the statistics.
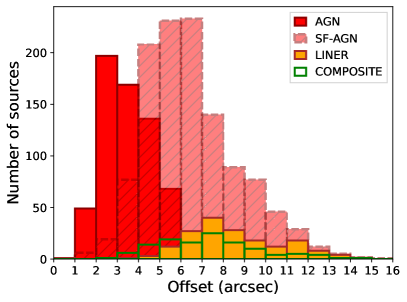
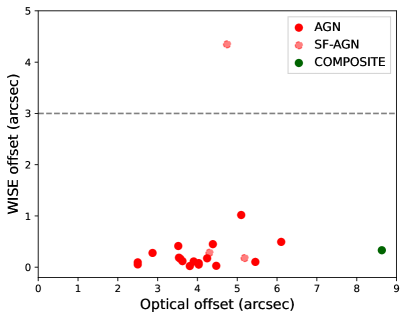
3.3 Off-nuclear AGN, obscuration, and AGN dilution
Most (80%) of the AGN and nearly all the SF-AGN in the sample of 2,362 dwarf galaxies are not identified as such based on SDSS emission line diagnostics (see Sect. 3.1). For some of them this might be due to star formation dominating the optical emission, specially in the central parts sampled by single-aperture spectroscopy, as inferred from the finding of AGN signatures in the radio and X-ray regimes (see Sect. 3.2). To further investigate whether the sources are off-nuclear AGN we derive the offset between the optical center of the galaxy and the median position of the AGN + AGN-WHAN + SF-AGN + LINER spaxels (from now on ‘optical offset’). The distribution of such offsets for the different sub-samples is shown in Fig. 9, top panel. The AGN sub-sample is the one with the major number of sources within 3 arcsec (250 out of 664, i.e. 38%) while only 2% of the SF-AGN have offsets within that radius, in agreement with the percentages of AGN and of SF-AGN identified with the SDSS (central spectroscopic fiber of 3 arcsec)131313We note there is a slight offset, of median value 0.13 arcsec, between the MaNGA optical center and the SDSS spectroscopic fiber position; however this does not impact our results.. The offset of the SF-AGN, Composite and LINER sub-samples is indeed found to be larger than that of the AGN, with median values of 6.1 arcsec 2.2 arcsec for the SF-AGN, 7.1 arcsec 2.4 arcsec for the Composite, 8.1 arcsec 2.2 arcsec for the LINERs, and of 3.5 arcsec 1.6 arcsec for the AGN. Applying a two-sample Kolmogorov-Smirnov test between the AGN and the SF-AGN/Composite/LINER sub-samples yields p-values smaller than 0.05 in all cases, rejecting the null hypothesis that the data are drawn from the same distribution when using a confidence level of 95%. The SF-AGN, Composite and LINER sources are thus more likely to be either nuclear AGN obscured by star formation, off-nuclear AGN wandering in the dwarf galaxy, or switched-off AGN for which we detect the relics of the last burst of ionisation (i.e. MDS+2020).
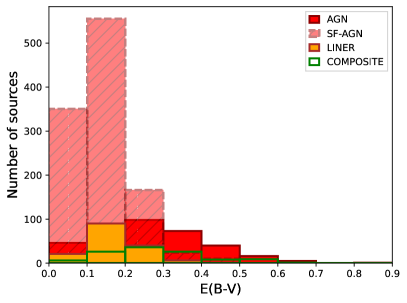
To distinguish between these scenarios we measure the Balmer decrement (H/H) within the central 3 arcsec of each galaxy (by taking the median value of all the spaxels within that radius) and then derive the color excess E(B-V) considering the Calzetti et al. (2000) dust attenuation curves. Despite the differences observed in terms of offsets and SDSS identification among the AGN, SF-AGN, Composite and LINER sub-samples, no significant differences are obtained in terms of E(B-V), with median values of 0.2 0.2 for the AGN, 0.1 0.1 for the SF-AGN, 0.3 0.1 for the Composite, and 0.2 0.1 for the LINERs (see Fig. 9, bottom panel). No differences in the color excess are found either when dividing the whole sample of 2,362 dwarf galaxies into ‘nuclear AGN’ (i.e. those with offsets 3 arcsec) and off-nuclear AGN (i.e. with offsets 3 arcsec), suggesting that obscuration is not the major driver of the AGN offset.
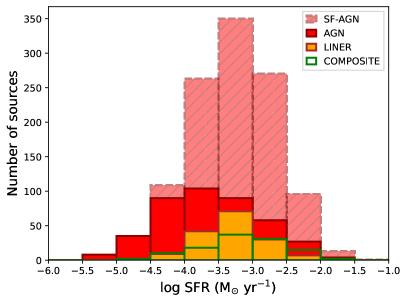
We next check whether dilution by star formation is responsible for the different offsets. We derive the SFR within the central 3 arcsec from the median of the H flux in that region, using the Kennicutt & Evans (2012) correlation (log SFR = log LHα - 41.27) as used by the MaNGA DAP to compute global SFRs, and correct if for extinction applying the Calzetti et al. (2000) dust attenuation curves. The distribution of SFRs within 3 arcsec for the AGN, SF-AGN, Composite and LINER sub-samples is shown in Fig. 10, top panel. The AGN are observed to have a lower SFR distribution while the SF-AGN, Composite and LINER sources present higher SFR values. Similar distributions were also found for the offsets in Fig. 9. This suggests that the AGN emission in the central region is more diluted by star formation in the SF-AGN, Composite and LINER sub-samples. The median of the central SFR for the AGN (log SFR = -3.6 0.7 M⊙ yr-1) is slightly larger than for the SF-AGN (-3.3 0.6 M⊙ yr-1), Composite (-3.1 0.6 M⊙ yr-1) and LINERs (-3.4 0.7 M⊙ yr-1), and applying a two-sample Kolmogorov-Smirnov test between the AGN and the SF-AGN/Composite/LINERs sub-samples yields p-values smaller than 0.05 in all cases, rejecting the null hypothesis that the data are drawn from the same distribution when using a confidence level of 95%.
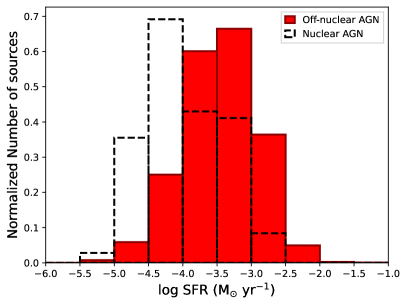
Similar results are found when checking if there are any differences in the central SFRs when dividing the sample into ‘nuclear’ and ‘off-nuclear’ AGN. As shown in Fig. 10, bottom panel, the nuclear sources tend to have lower values of SFRs, indicative of a lower AGN dilution. The median value for the nuclear AGN (log SFR = -3.9 0. M⊙ yr-1) is indeed lower than for the off-nuclear AGN (log SFR = -3.3 0.6 M⊙ yr-1), and a two-sample Kolmogorov-Smirnov test rejects the null hypothesis that the data are drawn from the same distribution with a p-value 0.05. This indicates that dilution by star formation can be one of the causes of the offsets observed in Fig. 9, though many of the sources could still be off-nuclear AGN or switched-off AGN.
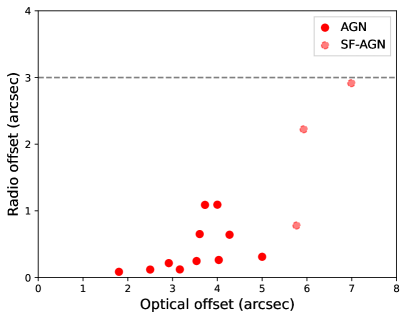
To look for off-nuclear AGN we make use of the radio, X-ray, and mid-infrared counterparts found in Sect. 3.2. We compute the offset between the optical center of the galaxy and the X-ray, radio, and infrared position for those AGN with an X-ray, radio, and mid-infrared counterpart, respectively. We show in Fig. 11, top panel, the optical versus X-ray offset for each of the four sub-samples. As it can be seen most of the X-ray offsets are of less than 3 arcsec, indicating that for these sources the AGN is indeed at the center and thus that the optical offset observed must be caused by AGN dilution in the optical regime (i.e. due to star formation). However, three of the X-ray AGN have both optical and X-ray offsets beyond the 3 arcsec fiber of the SDSS, suggesting these are off-nuclear AGN. Another off-nuclear source is also found in the mid-infrared (Fig. 11, bottom panel). All the radio AGN, on the contrary, have radio offsets within 3 arcsec, indicating that the optical offsets are an artifact of AGN dilution (Fig. 11, middle panel). The finding of off-nuclear AGN in MaNGA was already suggested by MDS+2020 and has been found in other works both at X-ray (e.g., Mezcua et al. 2018) and radio wavelengths (e.g., Reines et al. 2020), in agreement with simulations predicting that a vast population of IMBHs should be found as off-nuclear wanderers in dwarf galaxies (e.g., Bellovary et al. 2019; Pfister et al. 2019; Di Matteo et al. 2023).
Nuclear stellar clusters (NSCs) have also been often found to be offset from the dwarf galaxy photocenter (e.g., Côté et al. 2006; Poulain et al. 2021). In dwarf galaxies with M M⊙ the nucleation fraction is of 90% (Sánchez-Janssen et al. 2019) and the NSCs do not replace but coexist with the central BHs (e.g., Ferrarese et al. 2006; Seth et al. 2008). This could be also the case for the AGN dwarf galaxies here reported, for which the offset between the AGN and the optical center of the galaxy is in the same range as that of the offset between the NSC and the dwarf photocenter of Poulain et al. (2021, NSC offset= 0.01-7.26 arcsec with a median value of 0.74 arcsec).

3.4 Galaxy properties
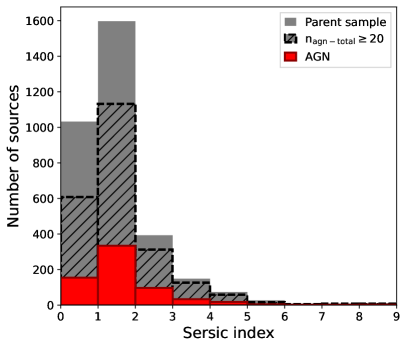
We retrieve the photometric and morphological properties of the dwarf galaxies from the MaNGA PyMorph photometric Value Added Catalogue (MPP-VAC-DR17) and the MaNGA Deep Learning Morphological Value Added Catalogue (MDLM-VAC-DR17) of Domínguez Sánchez et al. (2022). The MPP-VAC-DR17 provides Sérsic and Sérsic+Exponential fits to the 2D surface brightness profiles of the final MaNGA DR17 galaxy sample in the g, r, and i bands, while the MDLM-VAC-DR17 provides the morphological classifications based on Deep Learning for the same set of galaxies. Out of the 2,362 dwarf galaxies, 2,357 have photometric fits and morphological classifications available in the MPP-VAC-DR17 and MDLM-VAC-DR17 catalogues, respectively. Of these, 2,048 have T-Type 0 (consistent with a late-type classification) and 309 T-Type 0 (consistent with an early-type classification) in the MPP-VAC-DR17, thus 87% of the dwarves can be classified as late-type galaxies (LTGs). This fraction drops to 70% when using the complementary classification based on PLTG, the probability of being late-type rather than early-type, and setting PLTG > 0.5 as a threshold for selecting LTGs. This difference probably corresponds to faint and small galaxies for which the spiral features may not be so evident (see Figure 6 in Domínguez Sánchez et al. 2022).
A fit to the surface brightness profile is available for 2,280 of the dwarves, of which 1,844 (81%) are best fitted with a Sérsic profile of index 2 or with a Sérsic+Exponential profile (see Fig. 12, top panel), consistent with the morphological classification provided by the MDLM-VAC, according to which most of the galaxies in the sample are late-type.
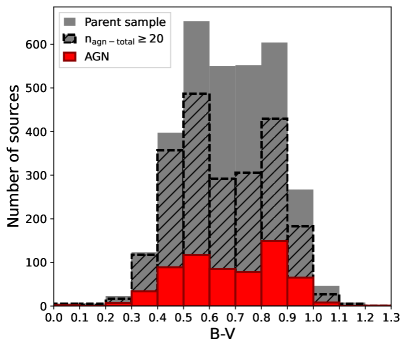
From the g- and r-band photometry provided in the MPP-VAC-DR17 catalogue we also derive the B-V color based on the Jester et al. (2005) transformations. We find a median value of <B-V> = 0.6 0.2 (see Fig. 12, bottom panel), fully consistent with that already found by MDS+2020 for their smaller sample of 37 AGN dwarf galaxies and redder than that of AGN dwarf galaxies identified from SDSS spectroscopy (e.g., Reines et al. 2013) or from X-ray and radio emission (e.g., Mezcua et al. 2018; Mezcua et al. 2019; Reines et al. 2020). The galaxy colors are still <B-V> = 0.6-0.7 when distinguishing between the AGN, the SF-AGN, Composite and LINERs, indicating no differences in galaxy type among these sub-samples.
3.5 AGN demographics
Albeit completeness, we derive the fraction of dwarf galaxies that host an AGN based on the classification scheme applied in Sect. 2.2. For this we use the initial sample of dwarf galaxies (3,436) but after removing the 36 duplicates, this is, 3,400 dwarf galaxies. Considering the sample of 664 AGN dwarf galaxies we obtain an AGN fraction of 20%. This is significantly larger than any previous studies using integrated spectra (AGN fraction 1%; e.g., Reines et al. 2013; Salehirad et al. 2022), MaNGA IFU (5%; e.g., Wylezalek et al. 2018; MDS+2020) or corrected for completeness in the X-rays (1%; e.g., Mezcua et al. 2018; Birchall et al. 2020; Birchall et al. 2022). The AGN fraction would double to 54% when considering both the AGN and the 1,176 SF-AGN, as found also by Polimera et al. (2022) (16-30% when they include their SF-AGN), disfavoring direct collapse as the predominant seed BH formation model. We note that adding the 122 Composite sources the AGN fraction would increase even more, to 58 %. We do not take the LINER sources into account given the possibility that their emission is caused by shocks, although we find that the median of the [OI]6300/H ratios are in general smaller than 0.1 (above which shocks are the main excitation mechanism of the [OI]6300 line, e.g., Riffel et al. 2021) and the [SII]6717,6731/H ratio is smaller than 0.4 (above which the ionisation can be caused by supernova remnant shocks, e.g., Dodorico et al. 1980).
We note that the AGN identification approach applied in this paper recovers most of the AGN dwarf galaxies found in previous works using MaNGA: The six AGN dwarves from Penny et al. (2018) are classified in our sample as AGN. Of the 48 AGN dwarves with M⊙ found by Wylezalek et al. (2018; see MDS+2020) we recover here 36 sources, classified according to our scheme as AGN (22), Composite (5), and SF-AGN (4). Five of the remaining AGN from Wylezalek et al. (2018) are classified by us as Retired when applying the WHAN diagram, while the remaining ones do not pass the threshold of 20 (see Fig. 5). Of the 37 AGN dwarf galaxies from MDS+2020 we recover 35 sources: 28 AGN, 5 Composite, and 1 SF-AGN, while the remaining one is here classified as Retired by the WHAN diagram. The remaining two sources do not have 20. Comerford et al. (2020) perform an AGN identification using multiwavelength (X-ray, radio, and infrared) diagnostics, rather than optical emission line ratios, of a sample of 6,261 MaNGA galaxies. They report 406 AGN, of which 28 are classified as dwarf galaxies and are included in our sample. Of these 28 sources in common, 11 qualify as AGN, six as SF-AGN, nine as Composite, and one as LINER according to our diagnostics. We thus recover most of the Comerford et al. (2020) AGN dwarf galaxies when using our spaxel by spaxel emission line ratio classification scheme.
3.6 AGN luminosity, black hole mass, and accretion rate
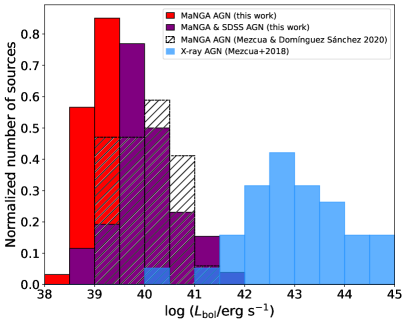
As we have seen in Sect. 3.1, the use of MaNGA IFU allows us to recover 80% more AGN than using integrated SDSS spectra, which can be partially explained by star-formation dilution. In this section we investigate any effects caused by the AGN bolometric luminosity and accretion rate. We derive the bolometric luminosity for the sub-sample of AGN from the median of the [OIII] luminosity of those spaxels classified as either AGN or Composite in the [NII]-BPT (e.g., MDS+2020) and assuming a bolometric correction factor of 1000 (Moran et al. 2014). In Fig. 13 we show the distribution of bolometric luminosities () for all the AGN (in red), only for the AGN classified also as AGN when using the SDSS spectra (in purple), and for a sample of X-ray selected AGN in dwarf galaxies from Mezcua et al. (2018, in blue). The AGN are found to have in all cases log erg s-1, consistent with low-luminosity AGN (e.g., Mezcua & Prieto 2014) and lower than those of X-ray selected (and also radio selected, see MDS+2020) AGN dwarves.
The distribution of for the whole sub-sample of AGN reaches, in addition, lower values than those AGN that are SDSS AGN, as already found by MDS+2020. Indeed, the ranges from log = 38.9 to 41.6 erg s-1 for those AGN that are also SDSS AGN, while log = 38.2 - 40.6 erg s-1 for those AGN missed by the SDSS. Those sources unidentified as AGN by the integrated SDSS spectra seem thus to be fainter AGN. To further investigate whether this is related with a lower BH accretion rate we derive the Eddington ratio () as . Since most of the AGN do not show broad emission lines (see next Section), we derive using the - correlation of AGN derived by Reines & Volonteri (2015). This yields a range of for the AGN of log = 4.5 - 5.9 (with a typical uncertainty of 0.5 dex), consistent with being IMBHs. Based on these BH masses, the Eddington ratio for the AGN that are also AGN in SDSS is found to range from to 2 while for those AGN missed by the SDSS. The use of MaNGA therefore allow us to identify a population of lower Eddington ratio sources than with SDSS. We note that deriving the BH mass from the - correlation of Martín-Navarro & Mezcua (2018) or Greene et al. (2020), where is the flux-weighted mean stellar velocity dispersion of all spaxels within 1 provided by the DAP, yields Eddington ratios that are in all cases below . Hence all the AGN dwarf galaxies identified by MaNGA are accreting at sub-Eddington rates.
| MaNGA | RA | DEC | log | Type | log | log | Ref. | ||
|---|---|---|---|---|---|---|---|---|---|
| plateifu | (J2000) | (J2000) | (M⊙) | (km s-1) | (erg s-1) | (M⊙) | |||
| (1) | (2) | (3) | (4) | (5) | (6) | (7) | (8) | (9) | (10) |
| 10223-3702 | 33.524643 | -0.276961 | 0.037 | 9.2 | AGN | 2223 241 | 38.2 0.1 | 5.5 | Thiswork |
| 10493-1902 | 124.327367 | 52.029915 | 0.039 | 9.2 | AGN | 1408 55 | 40.9 | 6.4 | Liu et al. (2019) |
| 11980-1901 | 255.494175 | 24.236424 | 0.041 | 9.3 | AGN | – | – | 5.0 | Chilingarian et al. (2018) |
| 12483-9102 | 186.453995 | 33.546902 | 0.001 | 8.8 | AGN | – | – | 5.0 | Chilingarian et al. (2018) |
| 12622-1902 | 202.331963 | 32.004722 | 0.024 | 9.3 | AGN | 2538 360 | 37.8 0.1 | 5.4 | Thiswork |
| 8252-1902 | 146.091838 | 47.459851 | 0.026 | 8.8 | AGN | – | – | 5.1 | Chilingarian et al. (2018) |
| 8442-1901 | 199.675905 | 32.918662 | 0.036 | 9.2 | AGN | 1131 377 | 38.6 0.2 | 5.1 | MDS+2020 |
| 8446-1901 | 205.753337 | 36.165656 | 0.024 | 9.2 | AGN | 1321 99 | 40.6 | 6.1 | Liu et al. (2019) |
| 8565-1902 | 241.033211 | 47.349658 | 0.042 | 9.4 | AGN | – | – | 8.6 | Li et al. (2008) |
| 8626-12704 | 263.755219 | 57.052433 | 0.047 | 8.4 | SF-AGN | 771 109 | 39.1 0.1 | 5.0 | Thiswork |
| 8982-3703† | 203.190094 | 26.580376 | 0.047 | 8.9 | AGN | 185452 | 39.12 0.02 | 5.8 | Thiswork |
| 8992-3702 | 171.657262 | 51.573041 | 0.026 | 9.5 | AGN | 1674 48 | 40.0 | 6.1 | Liu et al. (2019) |
| 9000-1901 | 171.400654 | 54.382574 | 0.021 | 9.3 | AGN | 3352 1101 | 41.3 | 7.3 | Liu et al. (2019) |
| 9048-6101 | 244.036041 | 24.079529 | 0.032 | 9.3 | AGN | 3252 681 | 37.9 0.1 | 5.7 | Thiswork |
| 9091-3704 | 241.944669 | 25.537511 | 0.041 | 9.4 | AGN | 1461 111 | 38.62 0.04 | 5.3 | Thiswork |
| 9190-1901 | 53.741686 | -5.814780 | 0.018 | 9.1 | AGN | 4648 135 | 39.9 | 7.0 | Liu et al. (2019) |
| 9891-1901 | 227.177572 | 28.171156 | 0.026 | 9.4 | AGN | 3778 570 | 38.0 0.1 | 5.9 | Thiswork |
Column designation: (1) MaNGA plateifu; (2,3) RA, DEC coordinates of the optical center of the galaxy or IFU center; (4) galaxy redshift; (5) galaxy stellar mass; (6) MaNGA BPT classification; (7, 8) FWHM and luminosity of the broad H emission line component; (9) BH mass derived from the broad H component; (10) Reference for columns 7, 8, 9. The typical uncertainties of the BH masses are of 0.5 dex. † This source has also been recently reported as a broad-line AGN by Fu et al. (2023).
3.7 Type 1 AGN
Eight of the AGN in the sample of 2,362 dwarf galaxies are found to have broad Balmer emission lines by Liu et al. (2019) and Chilingarian et al. (2018), see Table 2. Another source, 8442-1901, was found to be a hidden type 1 AGN by MDS+2020, showing broad H emission in the stacked spectrum of the AGN spaxels. We check whether any other hidden broad-line AGN are present among the sample of 2,362 dwarf galaxies by stacking the spectra of those spaxels classified as either AGN, AGN-WHAN or SF-AGN and fitting the resulting stacked spectrum with a multi-Gaussian Python routine. The details of the procedure can be found in MDS+2020 (Appendix A). In short, for each galaxy, we stack together all the spaxels belonging to the class AGN, AGN-WHAN or SF-AGN using the LOGCUBE-HYB10-MILESHC-MASTARHC2 from MaNGA DR17.141414This is a small variation with respect to MDS+2020, where we used the HYB10-GAU-MILESHC cubes.The stacked spectrum is the median value of the 3 clipped and normalized rest-framed flux at each wavelength, after removing masked regions or skylines. The H + [NII] emission line complex of the stacked AGN spectrum is fitted assuming the same width for the [NII]6583, [NII]6548, and narrow H emission line Gaussian components and allowing for a secondary broad H component. The flux ratio of the [NII] is set to the theoretical value of 3.06 and the relative separation between the centers of the narrow components is fixed to their theoretical wavelengths. Those sources best-modeled (i.e. lower 2) with a broad and narrow H emission line component are subject to visual inspection, based on which we confirm the good fit of the complex or remove ambiguous cases. This yields 8 broad-line sources. One of them (8565-1902) is reported to have broad H emission by Li et al. (2008). At the time of writing, Fu et al. (2023) reported a catalogue of type 1 AGN in the MaNGA survey. Four of their sources are among our sample of dwarf galaxies, three of which are already included in the Liu et al. (2019) sample. The forth one we report it here as a new broad-line AGN (8982-3703). The remaining 6 sources do not have (to the best of our knowledge) any broad Balmer emission reported in the literature and are thus reported here as new type 1 AGN in dwarf galaxies. The main properties of the in total new 7 sources (when including 8982-3703) are shown in Table 2. They are all AGN according to our emission line classification criteria except for 8626-12704, which is a SF-AGN. The FWHM of their broad H emission line component, corrected for instrumental resolution, thermal and natural broadening, ranges from 772 to 3,779 km s-1. Based on these FWHM and the luminosity of the broad H emission line component we derive a range of BH masses of log = 5.0 - 5.9 using eq. 5 in Reines et al. (2013), which favors an IMBH nature.
4 Conclusions
In this paper we have made use of the final MaNGA data release (DR17) to search for AGN in dwarf galaxies using a spaxel by spaxel classification scheme based on three spatially resolved emission line diagnostic diagrams ([NII]-, [SII]-, and [OI]-BPT) plus the WHAN diagram. This has resulted in a sample of 664 AGN, 122 Composite, and 173 LINERs among a parent sample of 3,400 dwarf galaxies. We additionally identify 1,176 SF-AGN, a classification recently introduced by Polimera et al. (2022) for those sources which are SF in the [NII]-BPT but AGN in the [SII]- and [OI]-BPT. Nearly all of these SF-AGN and 80% of the AGN are not identified as AGN when using single-fiber SDSS emission line diagnostics. This can be explained by the finding that the offset between the optical center of the galaxy and the median position of the AGN spaxels is larger than the 3-arcsec central fiber of the SDSS for 98% of the SF-AGN and 62% of the AGN. The offset of the SF-AGN, Composite and LINER sub-samples are in general found to be slightly larger than that of the AGN. Such differences can be in part attributed to dilution by star formation, though many of the sources could also be either switched-off AGN or off-nuclear AGN, specially those with optical offsets above 3 arcsec. Based on the offset between the X-ray, radio, or mid-infrared counterpart and the optical center of the galaxy, we are able to confirm the off-nuclear AGN nature for four sources (three SF-AGN and one Composite; see Sect. 3.2). This small fraction is largely caused by the reduced sky coverage and sensitivity of the multiwavelength surveys here used. A high fraction (50%) of off-nuclear AGN in dwarf galaxies is expected from simulations (e.g., Bellovary et al. 2019; Pfister et al. 2019), and several cases have been indeed already found observationally before (e.g., Mezcua et al. 2018; Reines et al. 2020). Further observations (e.g. in the X-ray regime) should increase the number of confirmed off-nuclear AGN.
When considering only the sub-sample of 664 AGN, we find that those that are not identified as AGN by SDSS spectroscopy have lower accretion rates than those that are AGN both in SDSS and MaNGA, indicating that with MaNGA we are able to identify a population of lower Eddington ratio AGN in dwarf galaxies than with SDSS. By stacking those spaxels classified as AGN, we are, in addition, able to identify seven new broad-line AGN not identified as such in previous SDSS studies. For these seven sources we derive the BH mass from the width and luminosity of the broad H component, while for the remaining broad-line AGN we use the - correlation of Reines & Volonteri (2015). We find a range of BH masses of log = 4.5 - 5.9 , consistent with IMBHs, and that all the sources are accreting a sub-Eddington rates.
Based only on the sub-sample of 664 AGN, the AGN fraction in dwarf galaxies is of 20%, which is significantly larger than that found in single-fiber spectroscopic studies and X-ray surveys (i.e. 1%; e.g., Reines et al. 2013; Mezcua et al. 2018; Birchall et al. 2020; Birchall et al. 2022; Salehirad et al. 2022). The use of IFU thus allows us to identify a large and so far hidden population of faint and low accretion rate AGN in dwarf galaxies, with BH masses in the IMBH regime. The addition of the SF-AGN would increase the AGN fraction to 54%, which can have strong implications for understanding which was the predominant seed BH formation mechanism in the early Universe.
Acknowledgments
The authors thank the anonymous referee for insightful comments. M.M. acknowledges support from the Spanish Ministry of Science and Innovation through the project PID2021-124243NB-C22. This work was partially supported by the program Unidad de Excelencia María de Maeztu CEX2020-001058-M. HDS acknowledges the financial support from the Spanish Ministry of Science and Innovation and the European Union - NextGenerationEU through the Recovery and Resilience Facility project ICTS-MRR-2021-03-CEFCA and financial support provided by the Governments of Spain and Aragón through their general budgets and the Fondo de Inversiones de Teruel.
Funding for the Sloan Digital Sky Survey IV has been provided by the Alfred P. Sloan Foundation, the U.S. Department of Energy Office of Science, and the Participating Institutions.
SDSS-IV acknowledges support and resources from the Center for High Performance Computing at the University of Utah. The SDSS website is www.sdss4.org.
SDSS-IV is managed by the Astrophysical Research Consortium for the Participating Institutions of the SDSS Collaboration including the Brazilian Participation Group, the Carnegie Institution for Science, Carnegie Mellon University, Center for Astrophysics | Harvard & Smithsonian, the Chilean Participation Group, the French Participation Group, Instituto de Astrofísica de Canarias, The Johns Hopkins University, Kavli Institute for the Physics and Mathematics of the Universe (IPMU) / University of Tokyo, the Korean Participation Group, Lawrence Berkeley National Laboratory, Leibniz Institut für Astrophysik Potsdam (AIP), Max-Planck-Institut für Astronomie (MPIA Heidelberg), Max-Planck-Institut für Astrophysik (MPA Garching), Max-Planck-Institut für Extraterrestrische Physik (MPE), National Astronomical Observatories of China, New Mexico State University, New York University, University of Notre Dame, Observatário Nacional / MCTI, The Ohio State University, Pennsylvania State University, Shanghai Astronomical Observatory, United Kingdom Participation Group, Universidad Nacional Autónoma de México, University of Arizona, University of Colorado Boulder, University of Oxford, University of Portsmouth, University of Utah, University of Virginia, University of Washington, University of Wisconsin, Vanderbilt University, and Yale University.
Data availability
The data underlying this article are available in the article and in its online supplementary material.
References
- Baldassare et al. (2015) Baldassare V. F., Reines A. E., Gallo E., Greene J. E., 2015, ApJ, 809, L14
- Baldassare et al. (2018) Baldassare V. F., Geha M., Greene J., 2018, ApJ, 868, 152
- Baldassare et al. (2020) Baldassare V. F., Geha M., Greene J., 2020, ApJ, 896, 10
- Baldassare et al. (2022) Baldassare V. F., Stone N. C., Foord A., Gallo E., Ostriker J. P., 2022, ApJ, 929, 84
- Baldwin et al. (1981) Baldwin J. A., Phillips M. M., Terlevich R., 1981, PASP, 93, 5
- Barai & de Gouveia Dal Pino (2019) Barai P., de Gouveia Dal Pino E. M., 2019, MNRAS, 487, 5549
- Barth et al. (2004) Barth A. J., Ho L. C., Rutledge R. E., Sargent W. L. W., 2004, ApJ, 607, 90
- Becker et al. (1995) Becker R. H., White R. L., Helfand D. J., 1995, ApJ, 450, 559
- Beckmann et al. (2023) Beckmann R. S., et al., 2023, MNRAS, 523, 5610
- Bellovary et al. (2019) Bellovary J. M., Cleary C. E., Munshi F., Tremmel M., Christensen C. R., Brooks A., Quinn T. R., 2019, MNRAS, 482, 2913
- Bernardi et al. (2023) Bernardi M., Domínguez Sánchez H., Sheth R. K., Brownstein J. R., Lane R. R., 2023, MNRAS, 518, 4713
- Birchall et al. (2020) Birchall K. L., Watson M. G., Aird J., 2020, MNRAS, 492, 2268
- Birchall et al. (2022) Birchall K. L., Watson M. G., Aird J., Starling R. L. C., 2022, MNRAS, 510, 4556
- Bohn et al. (2021) Bohn T., Canalizo G., Veilleux S., Liu W., 2021, ApJ, 911, 70
- Bonoli et al. (2014) Bonoli S., Mayer L., Callegari S., 2014, MNRAS, 437, 1576
- Bradford et al. (2018) Bradford J. D., Geha M. C., Greene J. E., Reines A. E., Dickey C. M., 2018, ApJ, 861, 50
- Bromm & Larson (2004) Bromm V., Larson R. B., 2004, ARA&A, 42, 79
- Bromm & Loeb (2003) Bromm V., Loeb A., 2003, ApJ, 596, 34
- Brunner et al. (2022) Brunner H., et al., 2022, A&A, 661, A1
- Bundy et al. (2015) Bundy K., et al., 2015, ApJ, 798, 7
- Burke et al. (2022) Burke C. J., et al., 2022, MNRAS, 516, 2736
- Burke et al. (2023) Burke C. J., Shen Y., Liu X., Natarajan P., Caplar N., Bellovary J. M., Wang Z. F., 2023, MNRAS, 518, 1880
- Bykov et al. (2024) Bykov S. D., Gilfanov M. R., Sunyaev R. A., 2024, MNRAS, 527, 1962
- Calzetti et al. (2000) Calzetti D., Armus L., Bohlin R. C., Kinney A. L., Koornneef J., Storchi-Bergmann T., 2000, ApJ, 533, 682
- Cann et al. (2018) Cann J. M., Satyapal S., Abel N. P., Ricci C., Secrest N. J., Blecha L., Gliozzi M., 2018, ApJ, 861, 142
- Cann et al. (2019) Cann J. M., Satyapal S., Abel N. P., Blecha L., Mushotzky R. F., Reynolds C. S., Secrest N. J., 2019, ApJ, 870, L2
- Cann et al. (2020) Cann J. M., et al., 2020, ApJ, 895, 147
- Cann et al. (2021) Cann J. M., et al., 2021, ApJ, 912, L2
- Cano-Díaz et al. (2022) Cano-Díaz M., et al., 2022, AJ, 164, 127
- Cappellari & Copin (2003) Cappellari M., Copin Y., 2003, MNRAS, 342, 345
- Carr & Kühnel (2020) Carr B., Kühnel F., 2020, Annual Review of Nuclear and Particle Science, 70, 355
- Chen et al. (2017) Chen C.-T. J., et al., 2017, ApJ, 837, 48
- Chilingarian et al. (2018) Chilingarian I. V., Katkov I. Y., Zolotukhin I. Y., Grishin K. A., Beletsky Y., Boutsia K., Osip D. J., 2018, ApJ, 863, 1
- Cid Fernandes et al. (2010) Cid Fernandes R., Stasińska G., Schlickmann M. S., Mateus A., Vale Asari N., Schoenell W., Sodré L., 2010, MNRAS, 403, 1036
- Comerford et al. (2020) Comerford J. M., et al., 2020, ApJ, 901, 159
- Comerford et al. (2022) Comerford J. M., Negus J., Barrows R. S., Wylezalek D., Greene J. E., Müller-Sánchez F., Nevin R., 2022, ApJ, 927, 23
- Condon et al. (1998) Condon J. J., Cotton W. D., Greisen E. W., Yin Q. F., Perley R. A., Taylor G. B., Broderick J. J., 1998, AJ, 115, 1693
- Cortes-Suárez et al. (2022) Cortes-Suárez E., Negrete C. A., Hernández-Toledo H. M., Ibarra-Medel H., Lacerna I., 2022, MNRAS, 514, 3626
- Côté et al. (2006) Côté P., et al., 2006, ApJS, 165, 57
- Dashyan et al. (2018) Dashyan G., Silk J., Mamon G. A., Dubois Y., Hartwig T., 2018, MNRAS, 473, 5698
- Davis et al. (2022) Davis F., et al., 2022, MNRAS, 511, 4109
- Deason et al. (2014) Deason A., Wetzel A., Garrison-Kimmel S., 2014, ApJ, 794, 115
- Di Matteo et al. (2023) Di Matteo T., Ni Y., Chen N., Croft R., Bird S., Pacucci F., Ricarte A., Tremmel M., 2023, MNRAS, 525, 1479
- Dodorico et al. (1980) Dodorico S., Dopita M. A., Benvenuti P., 1980, A&AS, 40, 67
- Domínguez Sánchez et al. (2022) Domínguez Sánchez H., Margalef B., Bernardi M., Huertas-Company M., 2022, MNRAS, 509, 4024
- Evans et al. (2010) Evans I. N., et al., 2010, ApJS, 189, 37
- Ferrarese et al. (2006) Ferrarese L., et al., 2006, ApJ, 644, L21
- Filho et al. (2019) Filho M. E., Tabatabaei F. S., Sánchez Almeida J., Muñoz-Tuñón C., Elmegreen B. G., 2019, MNRAS, 484, 543
- Filippenko & Sargent (1989) Filippenko A. V., Sargent W. L. W., 1989, ApJ, 342, L11
- Fischer et al. (2019) Fischer J. L., Domínguez Sánchez H., Bernardi M., 2019, MNRAS, 483, 2057
- Fragione et al. (2022) Fragione G., Kocsis B., Rasio F. A., Silk J., 2022, ApJ, 927, 231
- Fu et al. (2023) Fu Y., Cappellari M., Mao S., Lu S., Zhu K., Li R., 2023, MNRAS, 524, 5827
- Greene & Ho (2004) Greene J. E., Ho L. C., 2004, ApJ, 610, 722
- Greene & Ho (2007) Greene J. E., Ho L. C., 2007, ApJ, 670, 92
- Greene et al. (2020) Greene J. E., Strader J., Ho L. C., 2020, ARA&A, 58, 257
- Groves et al. (2006) Groves B. A., Heckman T. M., Kauffmann G., 2006, MNRAS, 371, 1559
- Habouzit et al. (2017) Habouzit M., Volonteri M., Dubois Y., 2017, MNRAS, 468, 3935
- Haidar et al. (2022) Haidar H., et al., 2022, MNRAS, 514, 4912
- Halevi et al. (2019) Halevi G., et al., 2019, ApJ, 885, L3
- Harikane et al. (2023) Harikane Y., et al., 2023, arXiv:2303.11946,
- Hviding et al. (2022) Hviding R. E., Hainline K. N., Rieke M., Juneau S., Lyu J., Pucha R., 2022, AJ, 163, 224
- Jarrett et al. (2011) Jarrett T. H., et al., 2011, ApJ, 735, 112
- Jester et al. (2005) Jester S., et al., 2005, AJ, 130, 873
- Johnston et al. (2023) Johnston V. D., et al., 2023, ApJ, 954, 77
- Kauffmann et al. (2003) Kauffmann G., et al., 2003, MNRAS, 346, 1055
- Kennicutt & Evans (2012) Kennicutt R. C., Evans N. J., 2012, ARA&A, 50, 531
- Kewley et al. (2001) Kewley L. J., Dopita M. A., Sutherland R. S., Heisler C. A., Trevena J., 2001, ApJ, 556, 121
- Kewley et al. (2006) Kewley L. J., Groves B., Kauffmann G., Heckman T., 2006, MNRAS, 372, 961
- Kocevski et al. (2023) Kocevski D. D., et al., 2023, ApJ, 954, L4
- Koudmani et al. (2021) Koudmani S., Henden N. A., Sijacki D., 2021, MNRAS, 503, 3568
- Koudmani et al. (2022) Koudmani S., Sijacki D., Smith M. C., 2022, MNRAS, 516, 2112
- Latif et al. (2020) Latif M. A., Khochfar S., Whalen D., 2020, ApJ, 892, L4
- Latif et al. (2022) Latif M. A., Whalen D. J., Khochfar S., Herrington N. P., Woods T. E., 2022, Nature, 607, 48
- Law et al. (2015) Law D. R., et al., 2015, AJ, 150, 19
- Law et al. (2021) Law D. R., et al., 2021, AJ, 161, 52
- Lehmer et al. (2010) Lehmer B. D., Alexander D. M., Bauer F. E., Brandt W. N., Goulding A. D., Jenkins L. P., Ptak A., Roberts T. P., 2010, ApJ, 724, 559
- Lemons et al. (2015) Lemons S. M., Reines A. E., Plotkin R. M., Gallo E., Greene J. E., 2015, ApJ, 805, 12
- Li et al. (2008) Li Z.-Y., Wu X.-B., Wang R., 2008, ApJ, 688, 826
- Liu et al. (2019) Liu H.-Y., Liu W.-J., Dong X.-B., Zhou H., Wang T., Lu H., Yuan W., 2019, ApJS, 243, 21
- Liu et al. (2020) Liu W., Veilleux S., Canalizo G., Rupke D. S. N., Manzano-King C. M., Bohn T., U V., 2020, ApJ, 905, 166
- Loeb & Rasio (1994) Loeb A., Rasio F. A., 1994, ApJ, 432, 52
- Madau & Rees (2001) Madau P., Rees M. J., 2001, ApJ, 551, L27
- Maiolino et al. (2023) Maiolino R., et al., 2023, arXiv:2305.12492,
- Manzano-King et al. (2019) Manzano-King C. M., Canalizo G., Sales L. V., 2019, ApJ, 884, 54
- Marleau et al. (2017) Marleau F. R., Clancy D., Habas R., Bianconi M., 2017, A&A, 602, A28
- Martín-Navarro & Mezcua (2018) Martín-Navarro I., Mezcua M., 2018, ApJ, 855, L20
- Martínez-Palomera et al. (2020) Martínez-Palomera J., Lira P., Bhalla-Ladd I., Förster F., Plotkin R. M., 2020, ApJ, 889, 113
- Mezcua (2017) Mezcua M., 2017, International Journal of Modern Physics D, 26, 1730021
- Mezcua (2019) Mezcua M., 2019, Nature Astronomy, 3, 6
- Mezcua (2021) Mezcua M., 2021, in Storchi Bergmann T., Forman W., Overzier R., Riffel R., eds, Vol. 359, Galaxy Evolution and Feedback across Different Environments. pp 238–242 (arXiv:2004.11911), doi:10.1017/S1743921320002240
- Mezcua & Domínguez Sánchez (2020) Mezcua M., Domínguez Sánchez H., 2020, ApJ, 898, L30
- Mezcua & Prieto (2014) Mezcua M., Prieto M. A., 2014, ApJ, 787, 62
- Mezcua et al. (2016) Mezcua M., Civano F., Fabbiano G., Miyaji T., Marchesi S., 2016, ApJ, 817, 20
- Mezcua et al. (2018) Mezcua M., Civano F., Marchesi S., Suh H., Fabbiano G., Volonteri M., 2018, MNRAS, 478, 2576
- Mezcua et al. (2019) Mezcua M., Suh H., Civano F., 2019, MNRAS, 488, 685
- Mezcua et al. (2023) Mezcua M., Siudek M., Suh H., Valiante R., Spinoso D., Bonoli S., 2023, ApJ, 943, L5
- Molina et al. (2021) Molina M., Reines A. E., Latimer L. J., Baldassare V., Salehirad S., 2021, ApJ, 922, 155
- Moran et al. (2014) Moran E. C., Shahinyan K., Sugarman H. R., Vélez D. O., Eracleous M., 2014, AJ, 148, 136
- Natarajan (2021) Natarajan P., 2021, MNRAS, 501, 1413
- Negus et al. (2023) Negus J., Comerford J. M., Sánchez F. M., Revalski M., Riffel R. A., Bundy K., Nevin R., Rembold S. B., 2023, ApJ, 945, 127
- Pardo et al. (2016) Pardo K., et al., 2016, ApJ, 831, 203
- Penny et al. (2018) Penny S. J., et al., 2018, MNRAS, 476, 979
- Pfister et al. (2019) Pfister H., Volonteri M., Dubois Y., Dotti M., Colpi M., 2019, MNRAS, 486, 101
- Polimera et al. (2022) Polimera M. S., et al., 2022, ApJ, 931, 44
- Poulain et al. (2021) Poulain M., et al., 2021, MNRAS, 506, 5494
- Reefe et al. (2023) Reefe M., et al., 2023, ApJ, 946, L38
- Reines (2022) Reines A. E., 2022, Nature Astronomy, 6, 26
- Reines & Volonteri (2015) Reines A. E., Volonteri M., 2015, ApJ, 813, 82
- Reines et al. (2013) Reines A. E., Greene J. E., Geha M., 2013, ApJ, 775, 116
- Reines et al. (2020) Reines A. E., Condon J. J., Darling J., Greene J. E., 2020, ApJ, 888, 36
- Rembold et al. (2017) Rembold S. B., et al., 2017, MNRAS, 472, 4382
- Ricarte & Natarajan (2018) Ricarte A., Natarajan P., 2018, MNRAS, 481, 3278
- Ricarte et al. (2021) Ricarte A., Tremmel M., Natarajan P., Zimmer C., Quinn T., 2021, MNRAS, 503, 6098
- Riffel et al. (2021) Riffel R. A., et al., 2021, MNRAS, 501, L54
- Salehirad et al. (2022) Salehirad S., Reines A. E., Molina M., 2022, ApJ, 937, 7
- Sánchez-Janssen et al. (2019) Sánchez-Janssen R., et al., 2019, ApJ, 878, 18
- Sánchez et al. (2018) Sánchez S. F., et al., 2018, Rev. Mexicana Astron. Astrofis., 54, 217
- Satyapal et al. (2007) Satyapal S., Vega D., Heckman T., O’Halloran B., Dudik R., 2007, ApJ, 663, L9
- Satyapal et al. (2018) Satyapal S., Abel N. P., Secrest N. J., 2018, ApJ, 858, 38
- Schleicher et al. (2022) Schleicher D. R. G., et al., 2022, MNRAS, 512, 6192
- Schramm et al. (2013) Schramm M., et al., 2013, ApJ, 773, 150
- Schutte & Reines (2022) Schutte Z., Reines A. E., 2022, Nature, 601, 329
- Secrest & Satyapal (2020) Secrest N. J., Satyapal S., 2020, ApJ, 900, 56
- Seth et al. (2008) Seth A., Agüeros M., Lee D., Basu-Zych A., 2008, ApJ, 678, 116
- Sharma et al. (2022) Sharma R. S., Brooks A. M., Tremmel M., Bellovary J., Ricarte A., Quinn T. R., 2022, ApJ, 936, 82
- Siudek et al. (2023) Siudek M., Mezcua M., Krywult J., 2023, MNRAS, 518, 724
- Stern et al. (2012) Stern D., et al., 2012, ApJ, 753, 30
- Übler et al. (2023) Übler H., et al., 2023, A&A, 677, A145
- Volonteri et al. (2008) Volonteri M., Lodato G., Natarajan P., 2008, MNRAS, 383, 1079
- Wang et al. (2021) Wang F., et al., 2021, ApJ, 907, L1
- Ward et al. (2022) Ward C., et al., 2022, ApJ, 936, 104
- Webb et al. (2020) Webb N. A., et al., 2020, A&A, 641, A136
- Woods et al. (2019) Woods T. E., et al., 2019, PASA, 36, e027
- Wright et al. (2010) Wright E. L., et al., 2010, AJ, 140, 1868
- Wylezalek et al. (2018) Wylezalek D., Zakamska N. L., Greene J. E., Riffel R. A., Drory N., Andrews B. H., Merloni A., Thomas D., 2018, MNRAS, 474, 1499
- Wylezalek et al. (2020) Wylezalek D., Flores A. M., Zakamska N. L., Greene J. E., Riffel R. A., 2020, MNRAS, 492, 4680
- van Wassenhove et al. (2010) van Wassenhove S., Volonteri M., Walker M. G., Gair J. R., 2010, MNRAS, 408, 1139
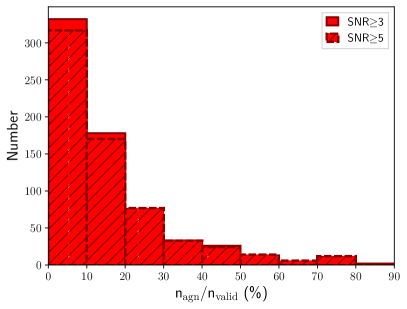
Appendix A Effects of SNR threshold selection
To perform the spaxel classification in Sect. 2.1 we have considered only those spaxels whose BPT emission lines (H, H, [NII]6583, [SII]6718+[SII]6732, [OIII]5007, [OI]6300) have SNR3, as commonly adopted in BPT studies (e.g., Reines et al. 2013 for SDSS; Wylezalek et al. 2020 for MaNGA; Salehirad et al. 2022 for GAMA; Johnston et al. 2023 for SAMI). In Figs. 6-7 we have shown that the MaNGA DAP modeling is able to identify and fit the main BPT emission lines down to SNR=3. Here we test whether the number of AGN sources and BPT flux ratios would change when increasing the SNR threshold from SNR3 to SNR5. Based on the number of / spaxels (defined in Sect. 2.2), when using SNR5 rather than SNR3 we still keep 99.7% of the sources classified as AGN (see Fig. 14). The numbers are similar for the SF-AGN (98% of the sources). This can be also seen in the SNR distribution (see Fig. 15) of the same two galaxies shown in Figs. 6-7, where it can be observed that the main bulk of spaxels used for the galaxy classification have SNR5. Based on the BPT flux ratios, when using SNR5 rather than SNR3 we still keep 96.6% of the sources classified as AGN. We thus conclude that increasing the SNR threshold from SNR3 to SNR5 would not yield significant differences in the results reported in the paper.