Probing the position-dependent optical energy fluence rate in 3D scattering samples
Abstract
The accurate determination of the position-dependent energy fluence rate of light is crucial for the understanding of transport in anisotropically scattering and absorbing samples, such as biological tissue, seawater, atmospheric turbulent layers, and light-emitting diodes. While Monte Carlo simulations are precise, their long computation time is not desirable. Common analytical approximations to the radiative transfer equation (RTE) fail to predict light transport, and could even give unphysical results. Here, we experimentally probe the position-dependent energy fluence rate of light inside scattering samples where the widely used and approximations to the RTE fail. We study samples that contain anisotropically scattering and absorbing spherical scatterers, namely microspheres ( m) with and without absorbing dye. To probe the position-dependent energy fluence rate, we detect the emission of quantum dots that are excited by the incident light and that are contained in a thin capillary. By scanning the sample using the capillary, we access the position dependence. We present a comprehensive analysis of experimental limitations and (systematic) errors. Our measured observations are compared to the results of analytical approximations of the solution of the radiative transfer equation and to Monte Carlo simulations. Our observations are found to agree well with the Monte Carlo simulations. The approximation with a correction for forward scattering also agrees with our observations, whereas the and the approximations deviate increasingly from our observations, ultimately even predicting unphysical negative energies.
I Introduction
For numerous applications such as light emitting diodes (LEDs) [1, 2, 3, 4, 5, 6, 7, 8], atmospheric aerosols [9], oceanography and remote sensing [10, 11, 12, 13, 14, 15, 16], and biophysics [17, 18, 19, 20], it is crucial to understand the light transport, hence, predict the position-dependent energy fluence rate. While Monte Carlo simulations are a powerful tool to study the energy distribution in scattering media [21, 22, 23, 24, 25, 26, 27, 28, 29], they come at the cost of extremely long computation times [30]. Analytical approximations to transport theory [31, 32, 33, 34, 35, 36, 37, 38] offer a much faster alternative, but they may not provide accurate results for samples that exhibit strong anisotropic scattering and absorption [39].
Experimental observations of the position-dependent energy fluence rate in real scattering samples are essential to identify reliable methods to model the light transport in real devices. Such in situ and in vitro measurements of light transport have been widely used in various research areas, including aerosols [40, 41], light-emitting diodes (LEDs) [42], and photodynamic therapy (PDT) [43, 44, 45].
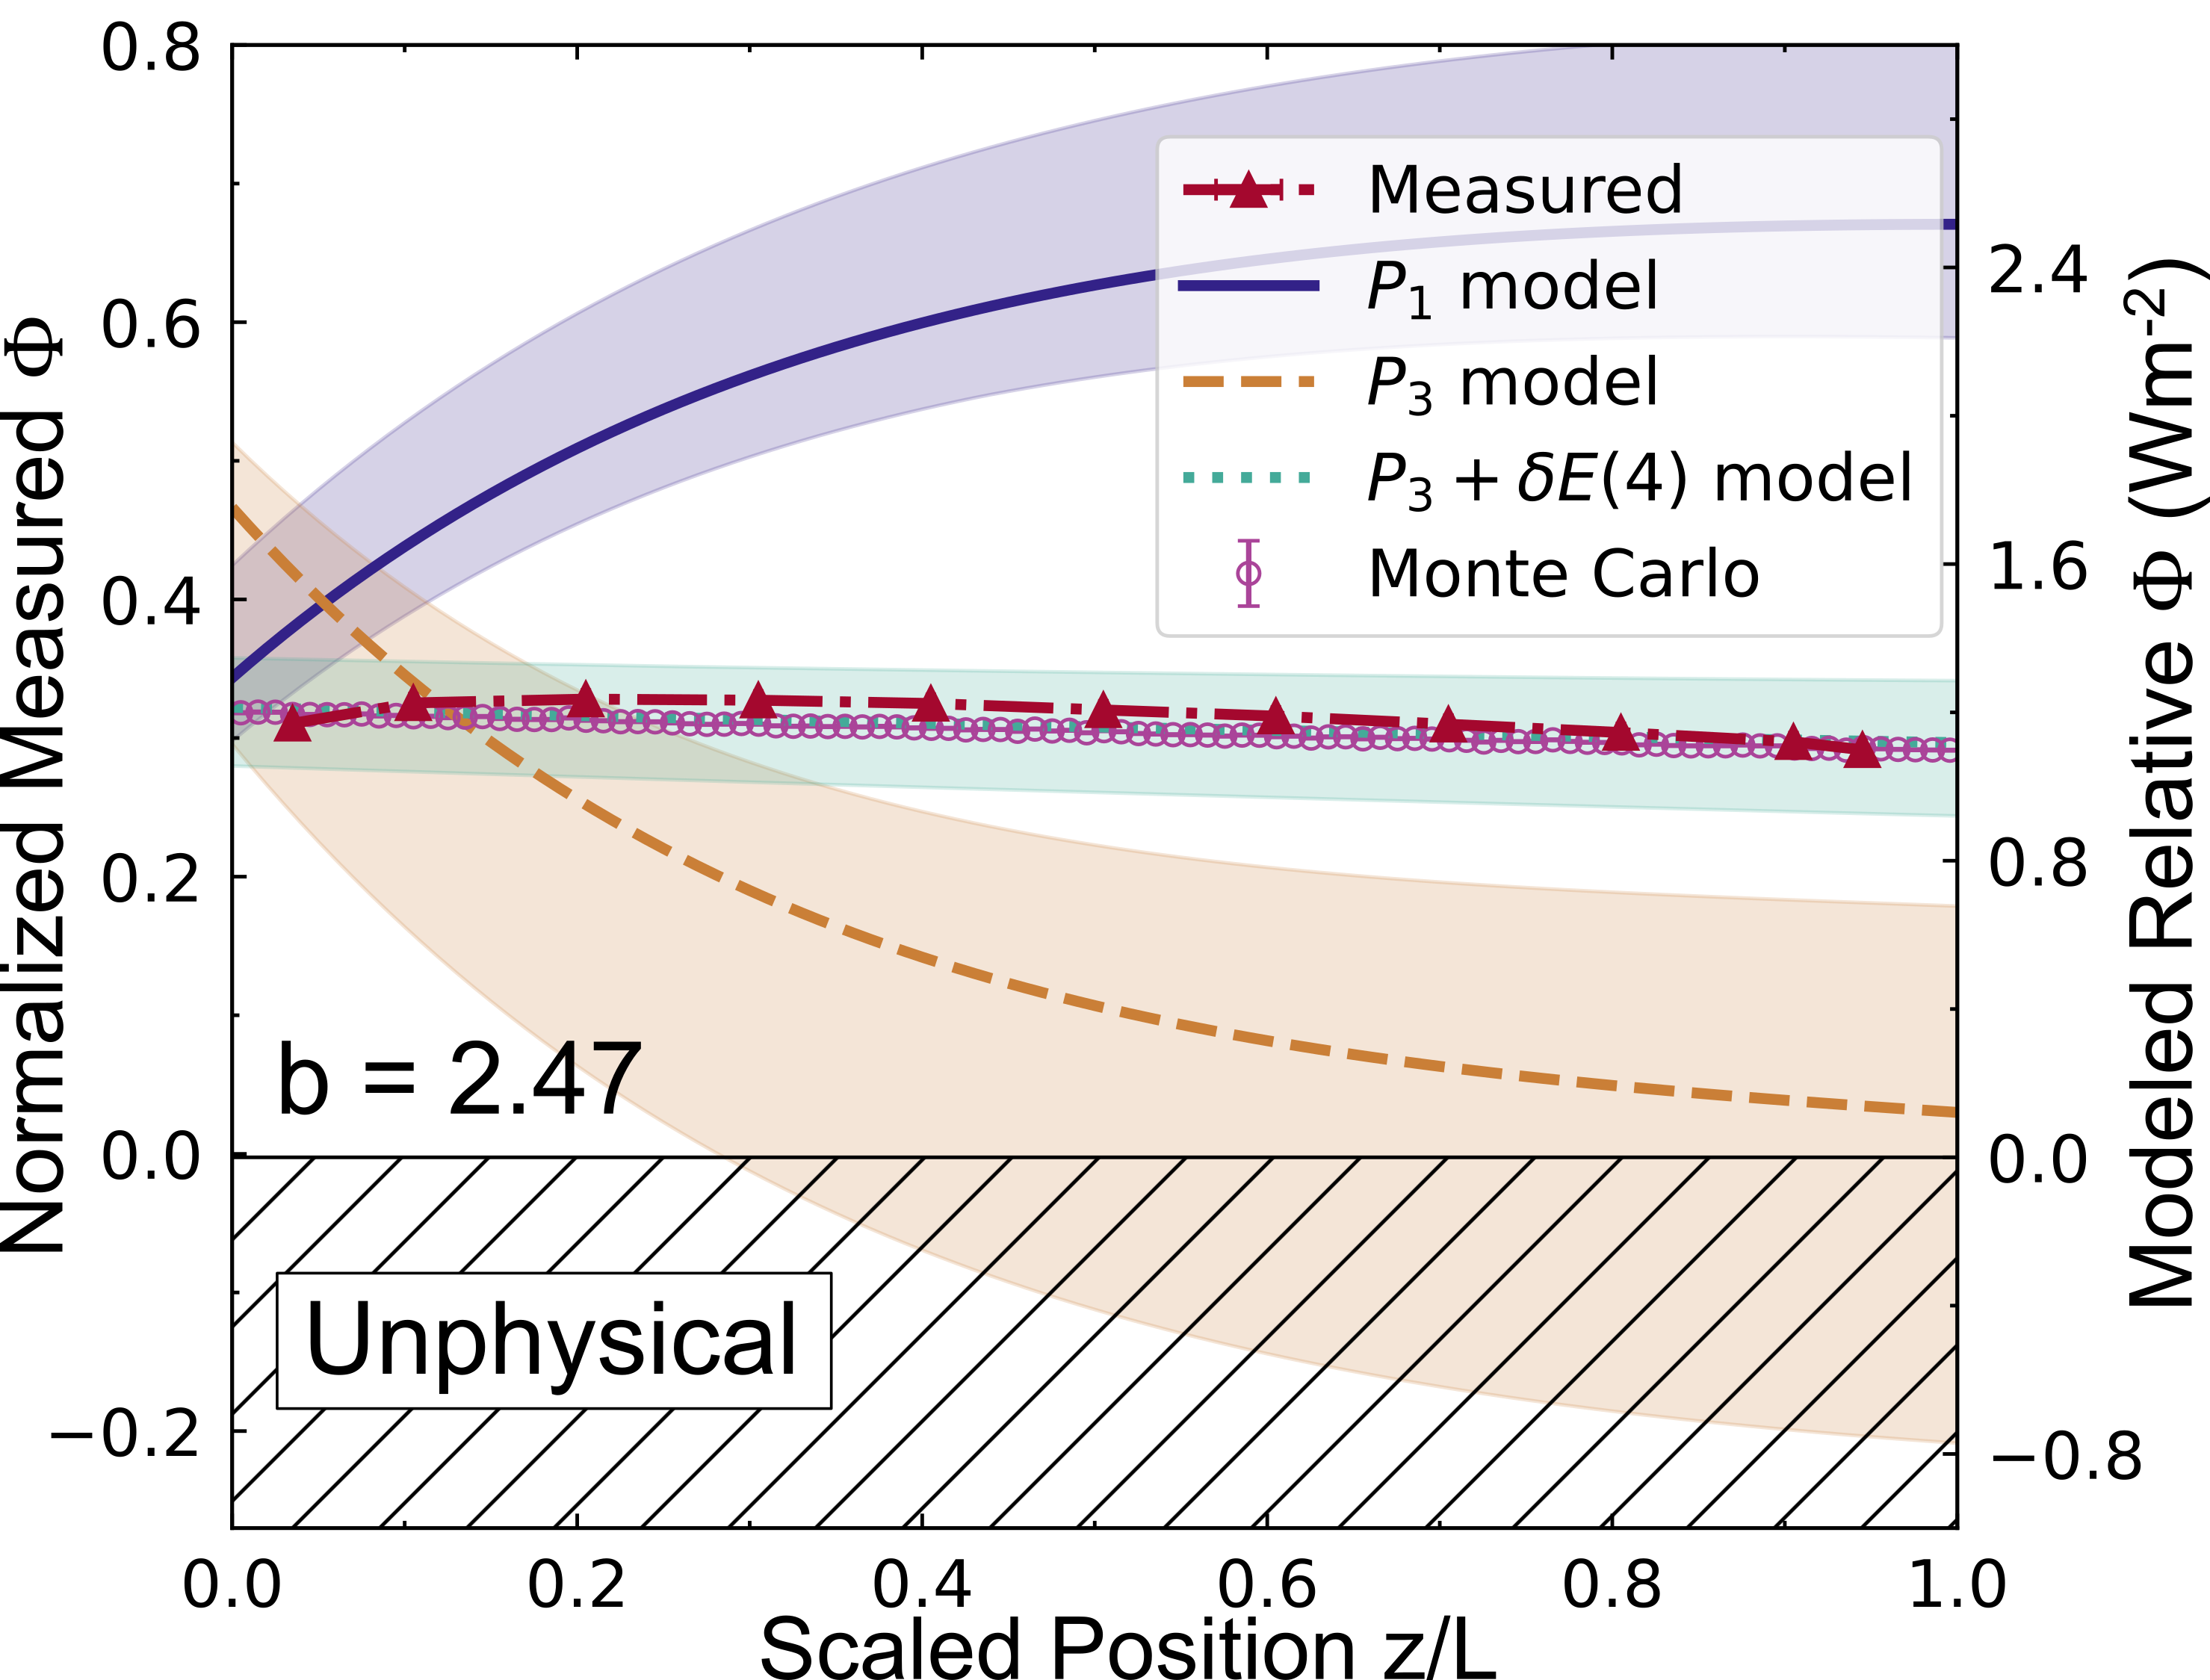
In Ref. [39], we have theoretically and numerically studied several analytic models of light transport, and presented their ranges of validity as well as their accuracies. As a next step, we decided to observe what happens in real samples where the analytic models break down. As an illustrative example, Figure 1 shows the measured and modeled energy fluence rate of a forward scattering and moderately absorbing sample, that lies in the unphysical range of the approximation to the radiative transfer equation. Naively one would solely trust Monte Carlo simulations, but it is important to note that even the best simulation cannot fully replicate experimental observations. For instance, Monte Carlo simulations of light transport rely on input parameters such as scattering and absorption coefficients, which are typically interpreted from other experiments that carry additional assumptions and errors. Hence, accurate experimental observations are ultimately indispensable for device applications in, for instance, semiconductor metrology, solid-state lighting, or space observation optics, all of which are actual applications of our research program [46].
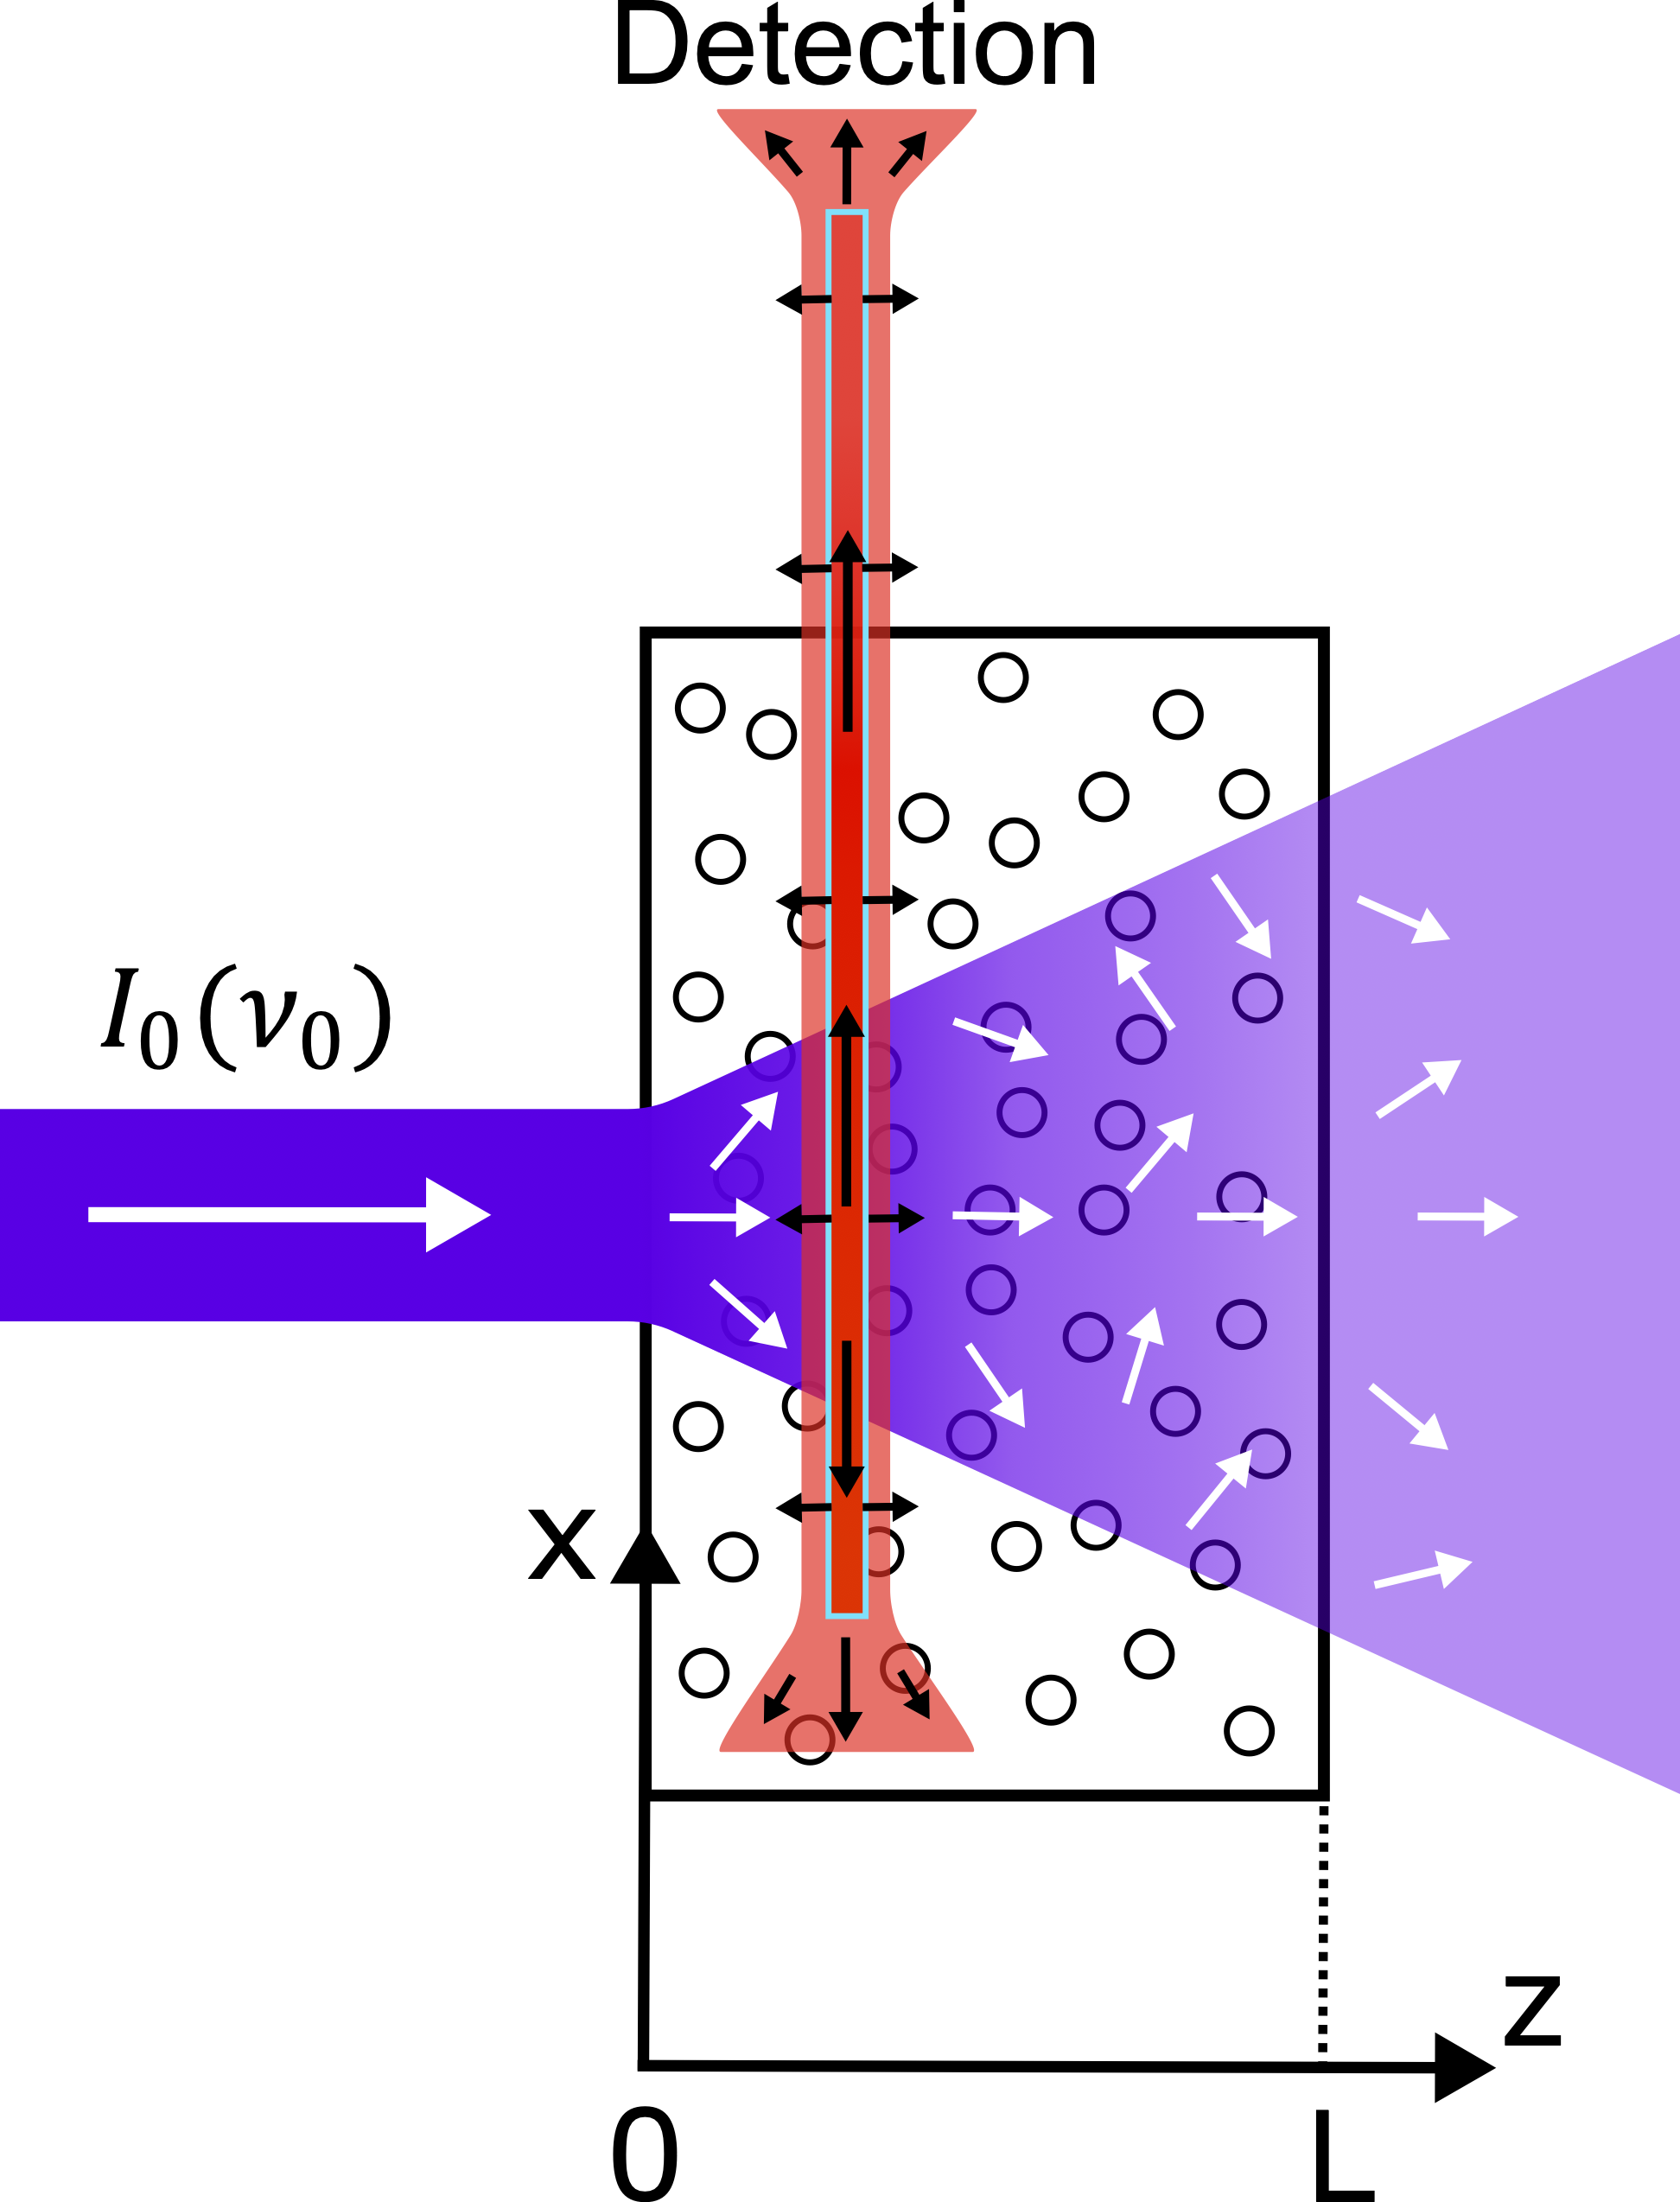
In this work, we report on experiments done in parameter ranges where most of the analytic approximations fail, to observe what happens and how well models pertain. The energy fluence rate , which is proportional to the energy density, represents the total optical power through a unit spherical area, with units . In this paper, we simplify the representation of the position to -direction by considering the total rate at -positions in a cross-section through a sample, see Fig. 2. Furthermore, for notational ease, we omit the frequency dependency to write the position-dependent energy fluence rate as , since our study is a nearly monochromatic one. We present our experiments on the in situ detection of the position-dependent fluence rate in both absorbing and non-absorbing, anisotropically scattering samples.
A schematic of our experimental method is shown in Figure 2, where a slab with spherical scatterers is illuminated from the () side by light with intensity . Light enters the sample and propagates inside, undergoing scattering and absorption by the spheres. A probe consisting of a thin cylindrical capillary, filled with quantum dots, is utilized to detect the intensity at known positions inside the sample. When the light reaches the probe from any direction, it excites the quantum dots, which subsequently emit light at a Stokes-shifted lower frequency . Part of the re-emitted light is then collected from the top of the probe, and the position-dependent energy fluence rate is inferred from this measurement. Our observations match well with physical and accurate models for these type of samples, and show a clear distinction from the ones that fail and predict unphysical negative energy fluence rate.
II Experimental details
The experiments are conducted on samples with strongly forward-scattering (anisotropy ) and absorbing (albedo ) scatterers, to be in the parameter range where common analytical approximations fail [39].
II.1 Sample preparation
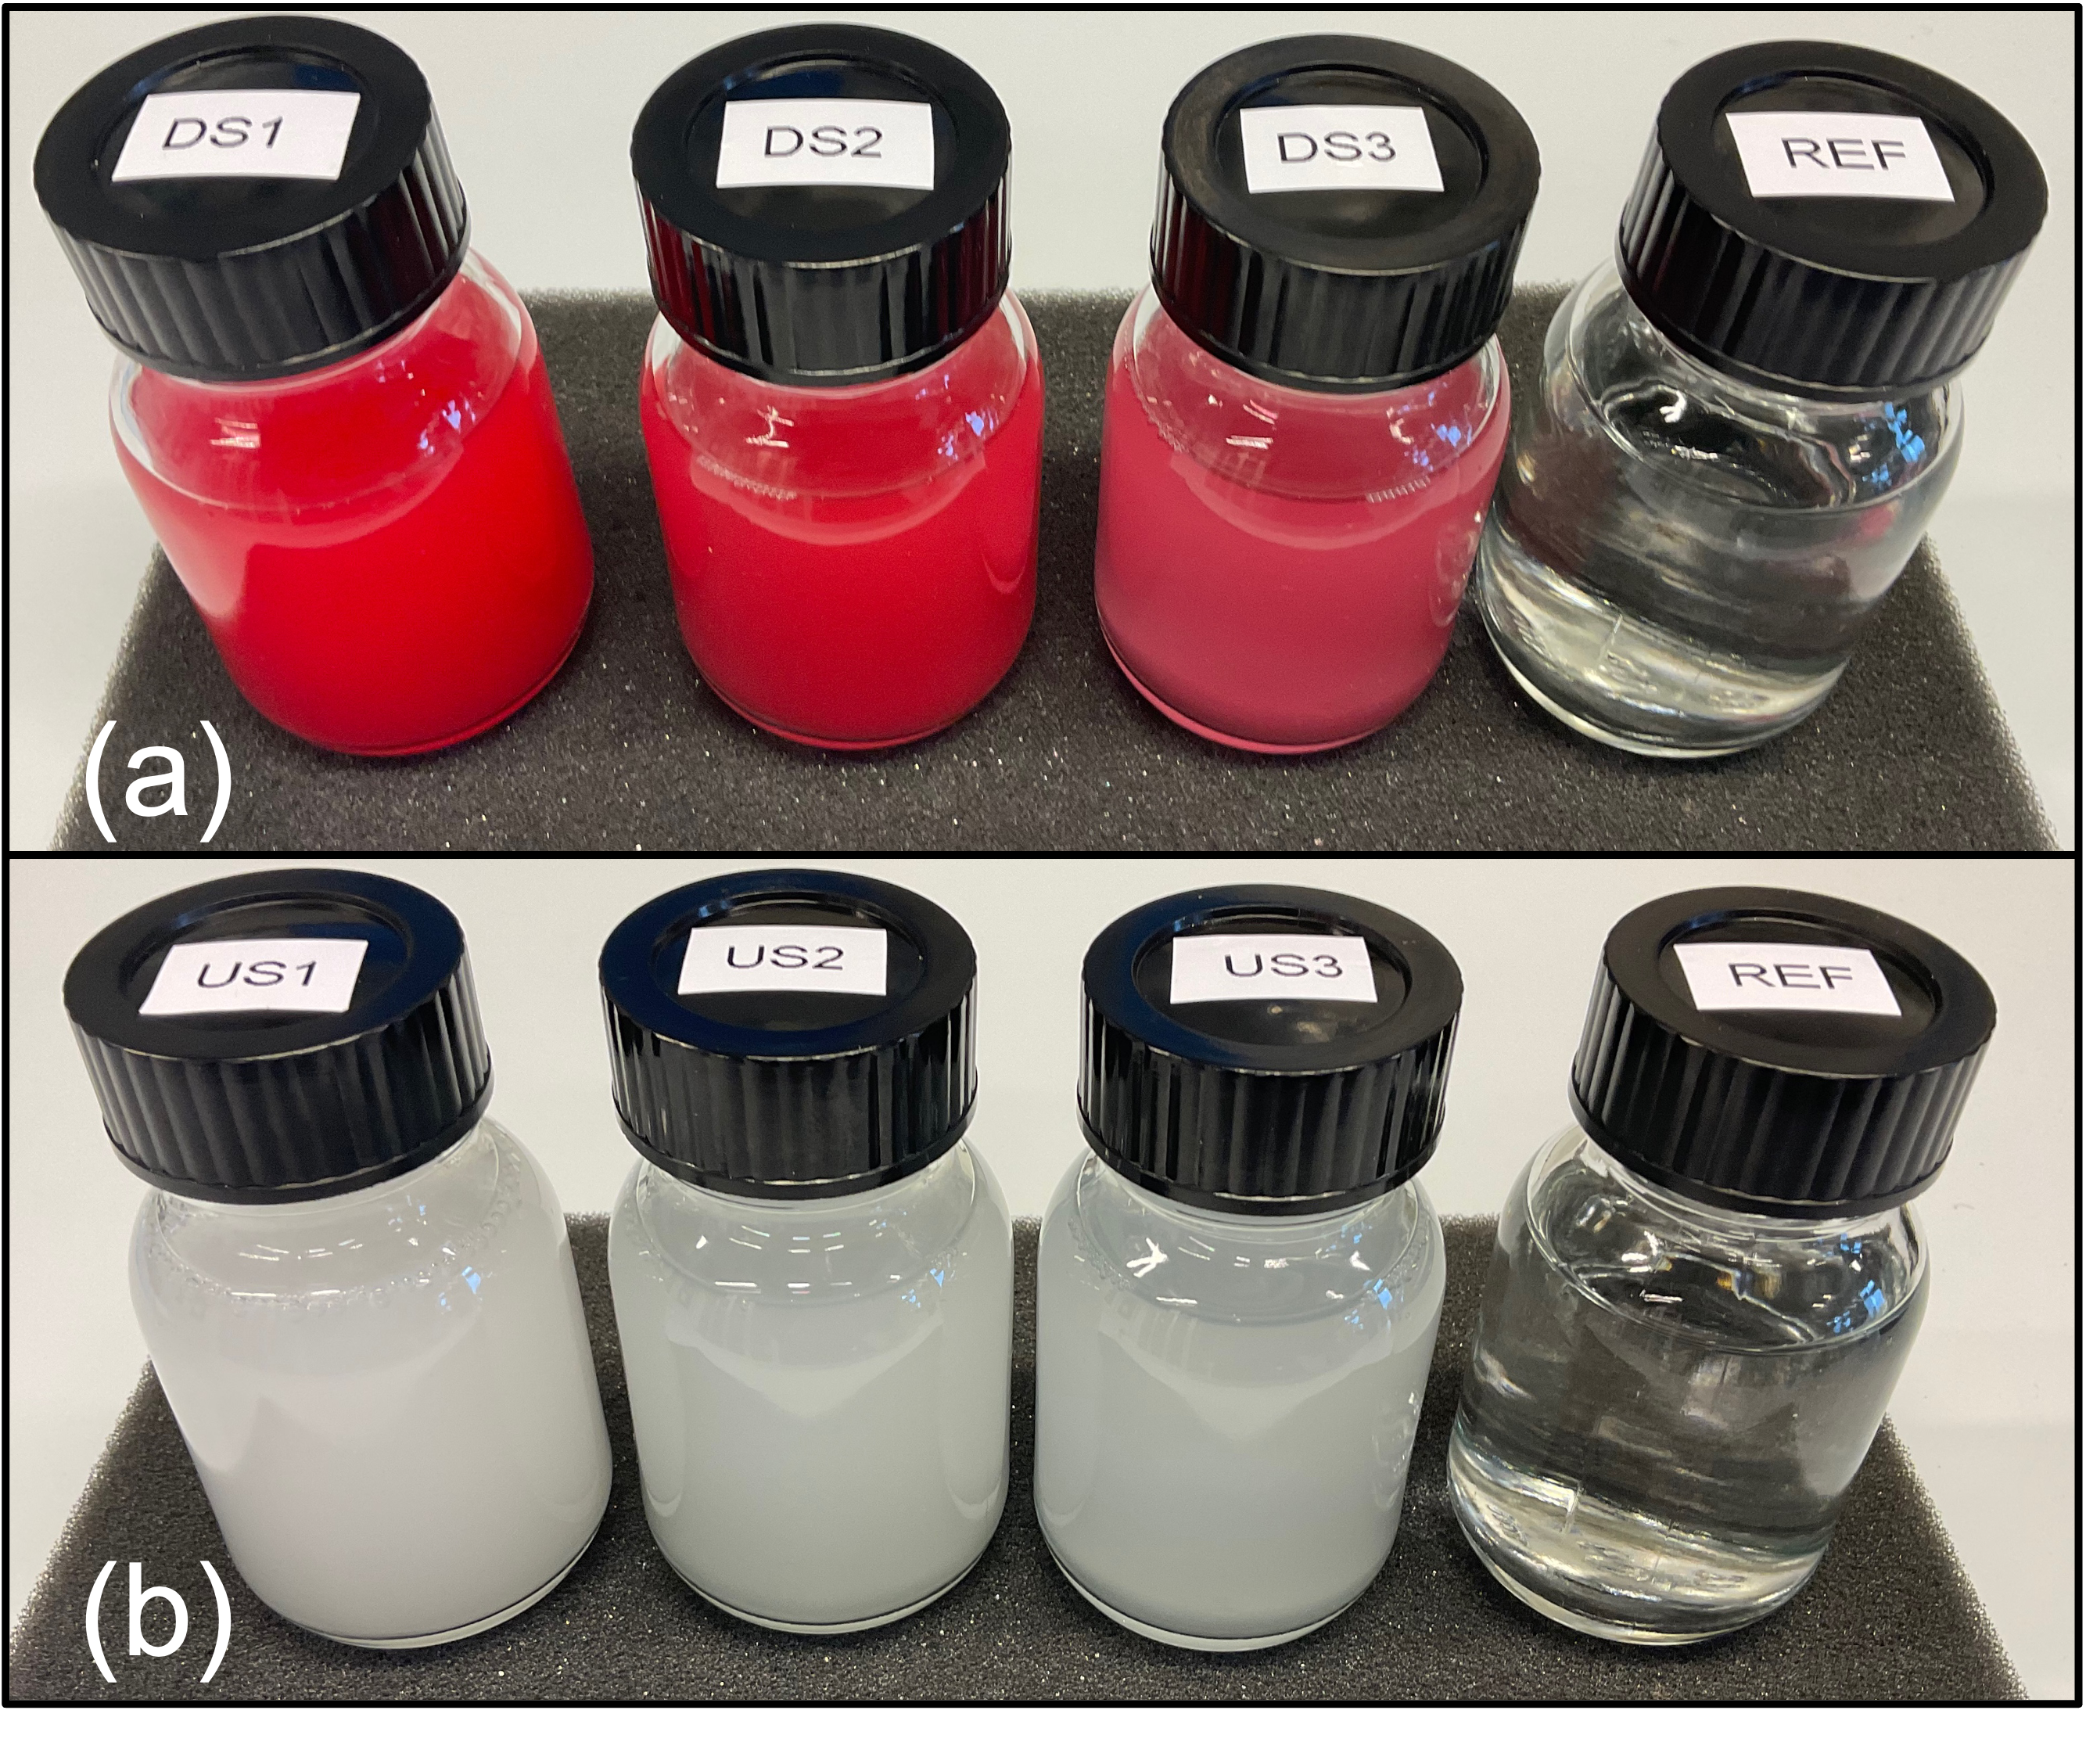
Samples are prepared by diluting commercially-bought polystyrene microsphere suspensions, with a reported particle radii . The microsphere suspensions used in our experiments are both plain and red-dyed Polybead® Polystyrene Microspheres from Polysciences for undyed and dyed sphere suspensions, respectively. A buffer solution is produced by mixing Sodium dodecyl sulfate (SDS) surfactant () with de-ionized (DI) water (). The samples with scatterers are then prepared by diluting their respective suspensions with the buffer solution. The use of SDS in the buffer solution serves to prevent agglomeration and rapid sedimentation of the scatterers. The samples prepared with this buffer solution are stable for approximately 24 hours, after which sedimentation is observed. Prior to subsequent use in experiments, the samples are carefully agitated to re-disperse the sediment, with attention paid to prevent the introduction of air bubbles. Dyed sphere samples are labelled DS, and plain (undyed) sphere samples are US. The contents and scatterer concentrations of prepared samples are listed in Table 1, and a photograph of the samples is shown in Figure 3, showing the different diffuse color appearance of the DS samples and different whiteness of the US samples.
Sample name Contents Ref DI water + SDS 0 DS1 dyed sphere + Ref DS2 dyed sphere + Ref DS3 dyed sphere + Ref US1 plain sphere + Ref US2 plain sphere + Ref US3 plain sphere + Ref
II.2 Experimental Setup
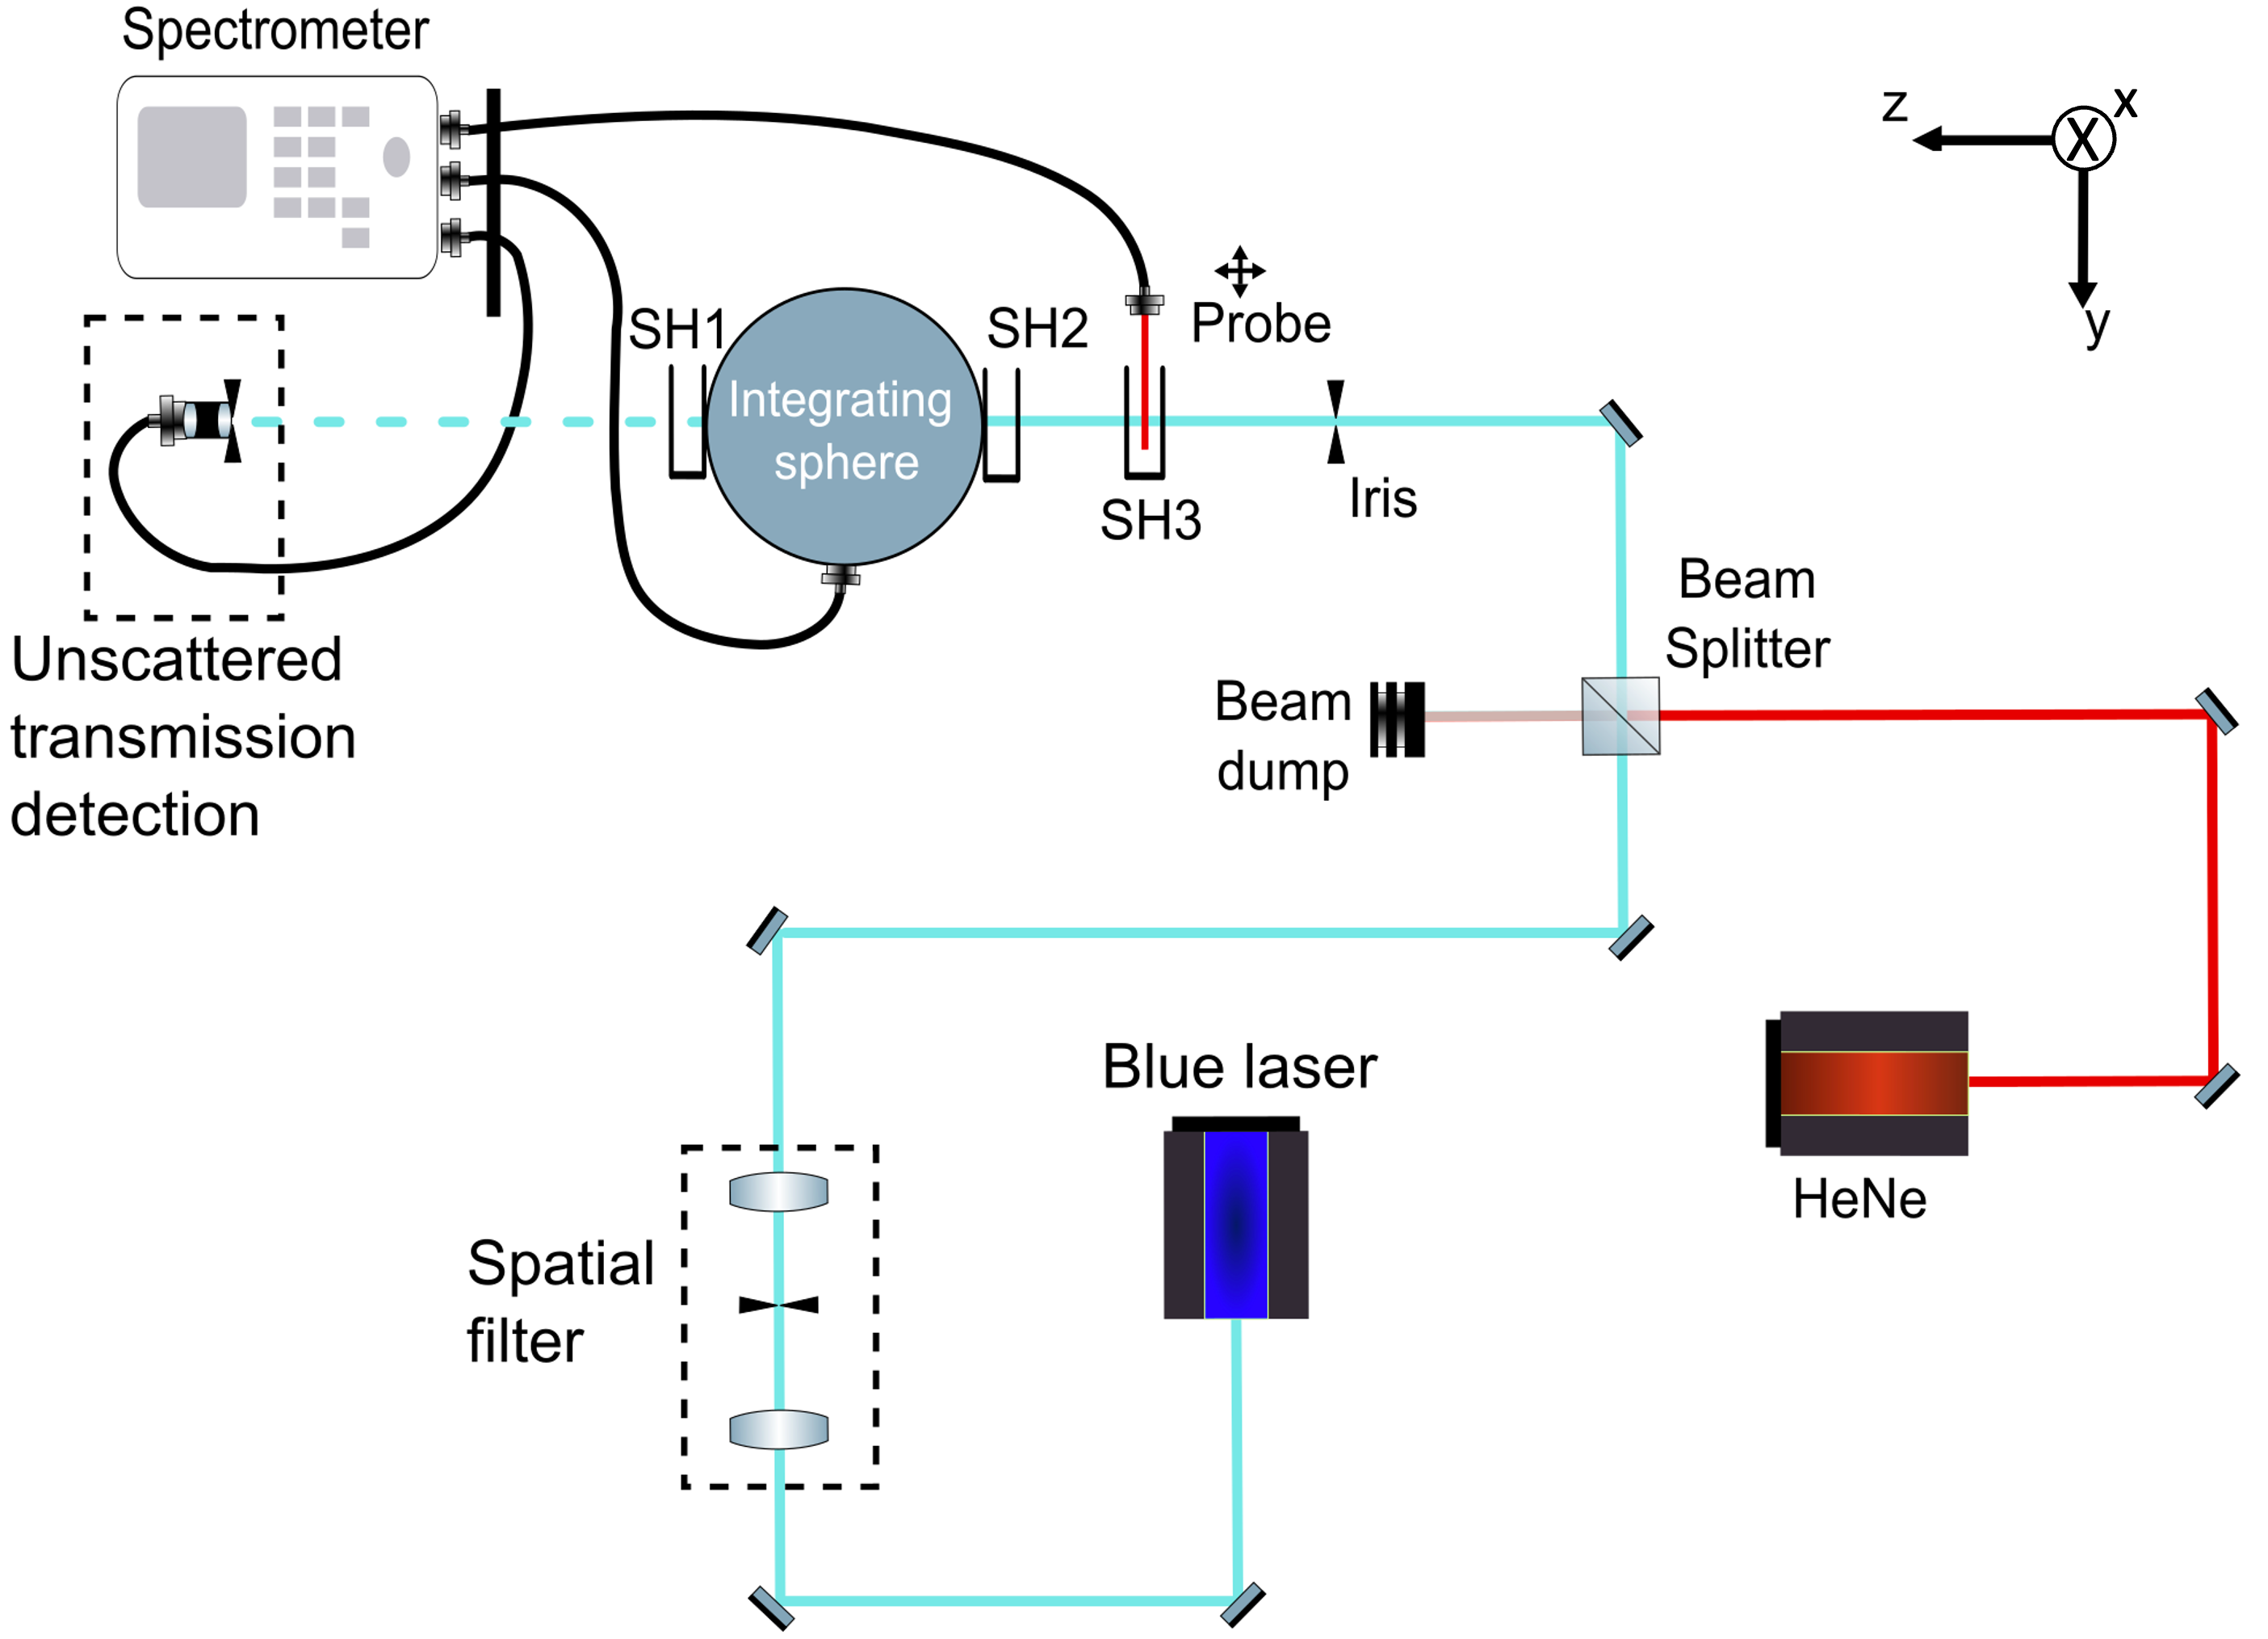
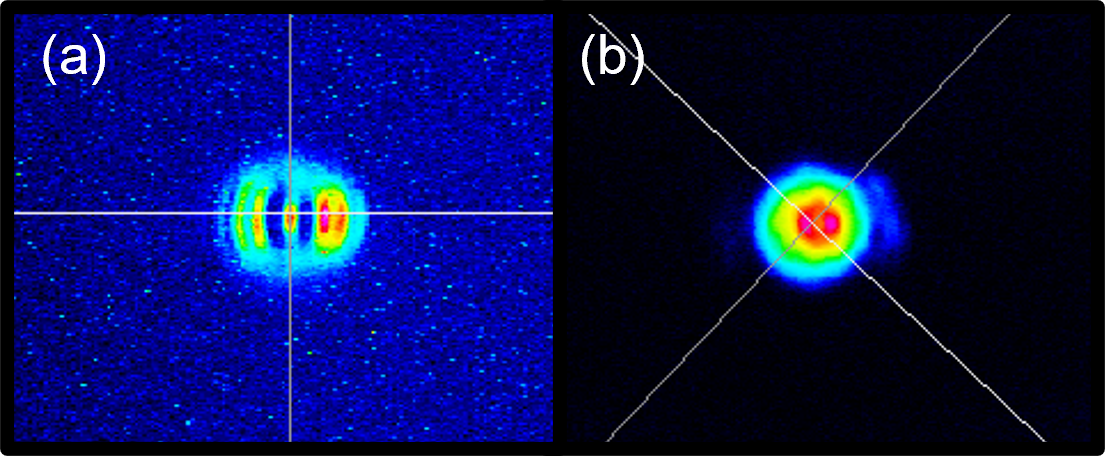
Figure 4 presents a schematic of the setup used in our experiments. A blue laser (Thorlabs NPL41B) is used as the primary light source (see appendix A.1). The laser beam is spatially filtered because multiple modes inside the laser cavity are not collimated as well as the fundamental mode, while they perturb the beam profile at the sample. The beam profiles at the sample position, before and after spatial filtering, are shown in Figure 5. A substantial improvement is observed upon spatial filtering, namely that the beam becomes much more cylindrical, which is convenient for the physical interpretation of the subsequent results.
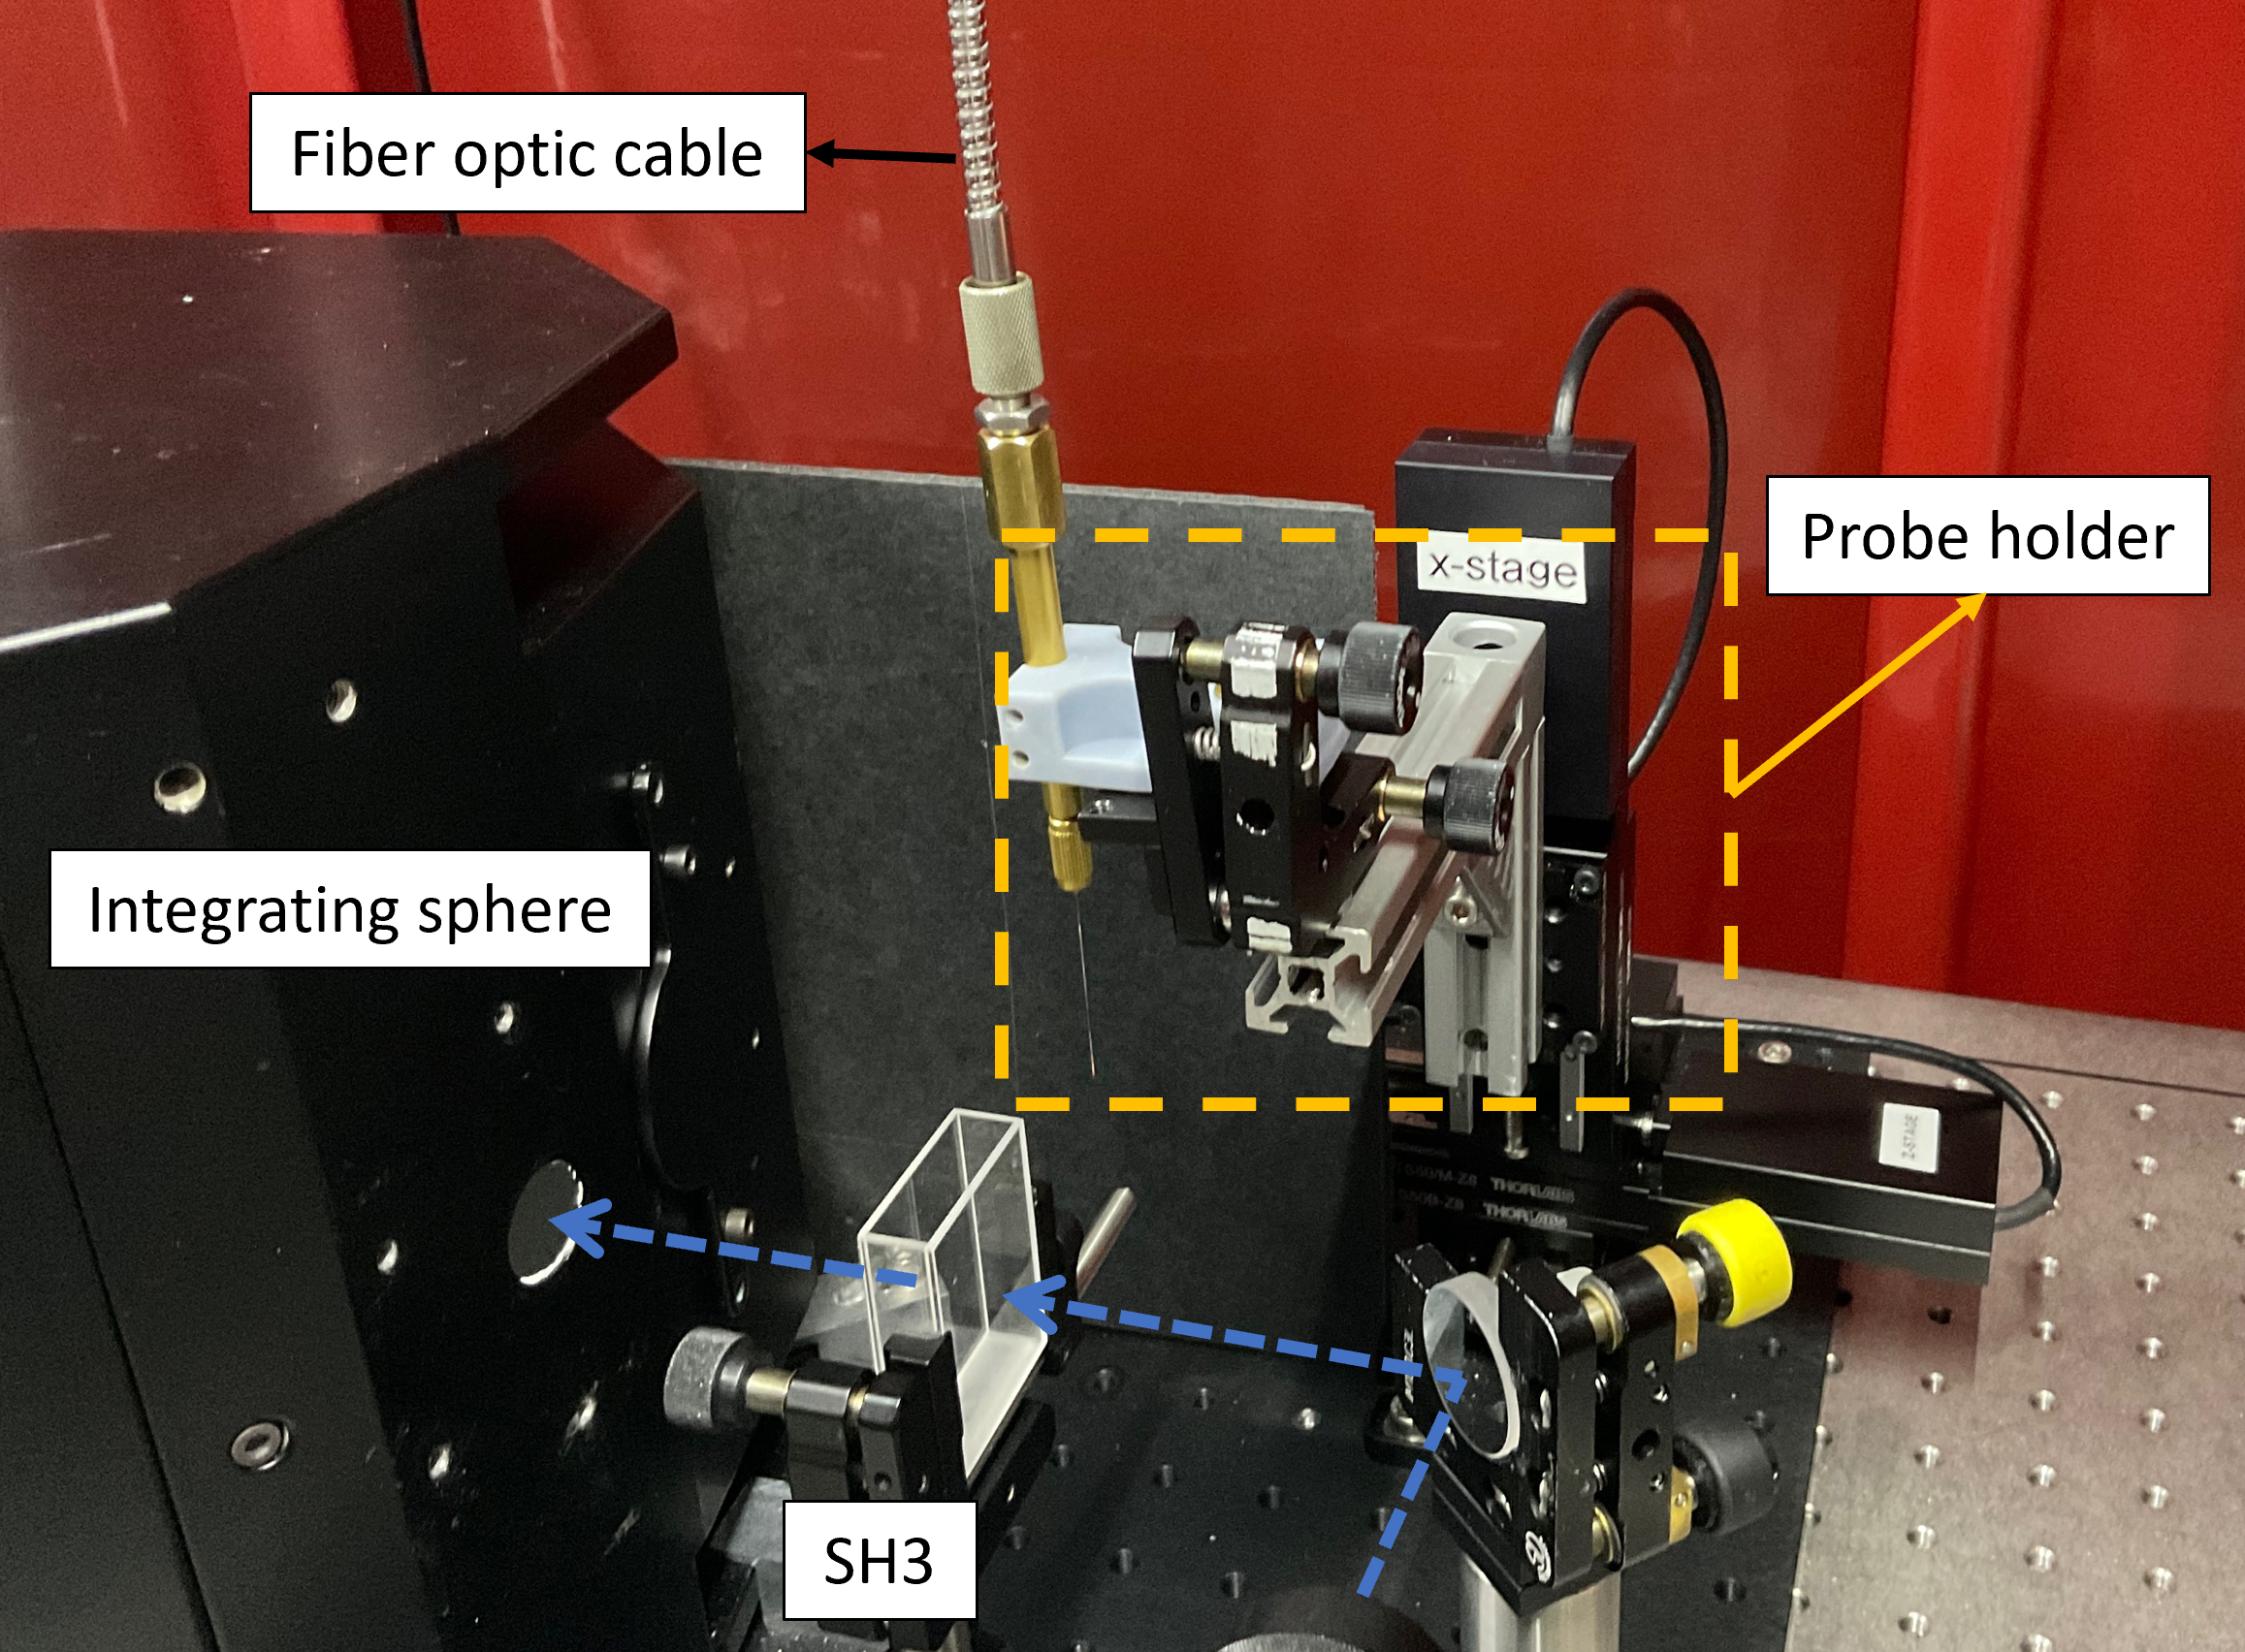
The sample holders SH1 and SH2, attached to the integrating sphere are 3D-printed in the University of Twente Design Lab, whereas the holder SH3 where the probe is immersed in (see Fig.4), is 3D-printed in the Rapid Prototyping Lab of the University of Twente. The probe is connected to a custom-built holder with 3D-printed and manually made parts, as shown in Figure 6. For details on the preparation of the probe, see appendix A.2. To detect the intensity emitted from the probe, a connector part is created in the workshop to connect the probe with a fiber-optic cable that is attached to a spectrometer (Avantes Starline, AvaSpec-2048L) on the other end. The holder is attached to an assembly of motorized translation stages (Thorlabs MTS50/M-Z8) that moves the probe to precise positions in 3 dimensions. In-house Python scripts are used to control the movement of the probe and detection with the spectrometer. The -direction movement is utilized to move the probe in and take it out of the sample, whereas the y and -direction movements are used to scan the sample and measure the intensity at specific positions. Total transmission and total reflection measurements are done with an integrating sphere (Opsira UKU240), with a port diameter for both transmission and reflection ports.
Before collecting data, each sample suspension is transferred to a wide quartz cuvette (outer dimensions ) with an inner thickness of along the -direction. These cuvettes are then placed in sample holders for measurements. Holder SH1 and SH2 are used for total reflection and total transmission measurements, respectively. Holder SH3 is used for measurements with the probe and unscattered transmission () measurements, as the distance between the fiber coupler of detection and SH3 is sufficiently long for this purpose [47].
III Results and discussion
In this section, the results of unscattered transmission, total transmission, total reflection, and probe measurements are discussed. In addition, the method to extract the albedo and the anisotropy of the samples is discussed.
III.1 Unscattered Transmission, Total Transmission and Total Reflection
The unscattered transmission represents the portion of the incident light that is transmitted through the sample without deviating from its initial direction of travel. In other words, it represents the light that survives extinction while maintaining its original direction. The Beer-Lambert-Bouguer’s law is used to express as
| (1) |
Here, is the intensity transmitted without changing its direction, is the incident intensity, is the number density, is the extinction cross-section, and is the sample thickness. Furthermore, the optical thickness is defined to be
| (2) |
where is the extinction coefficient.
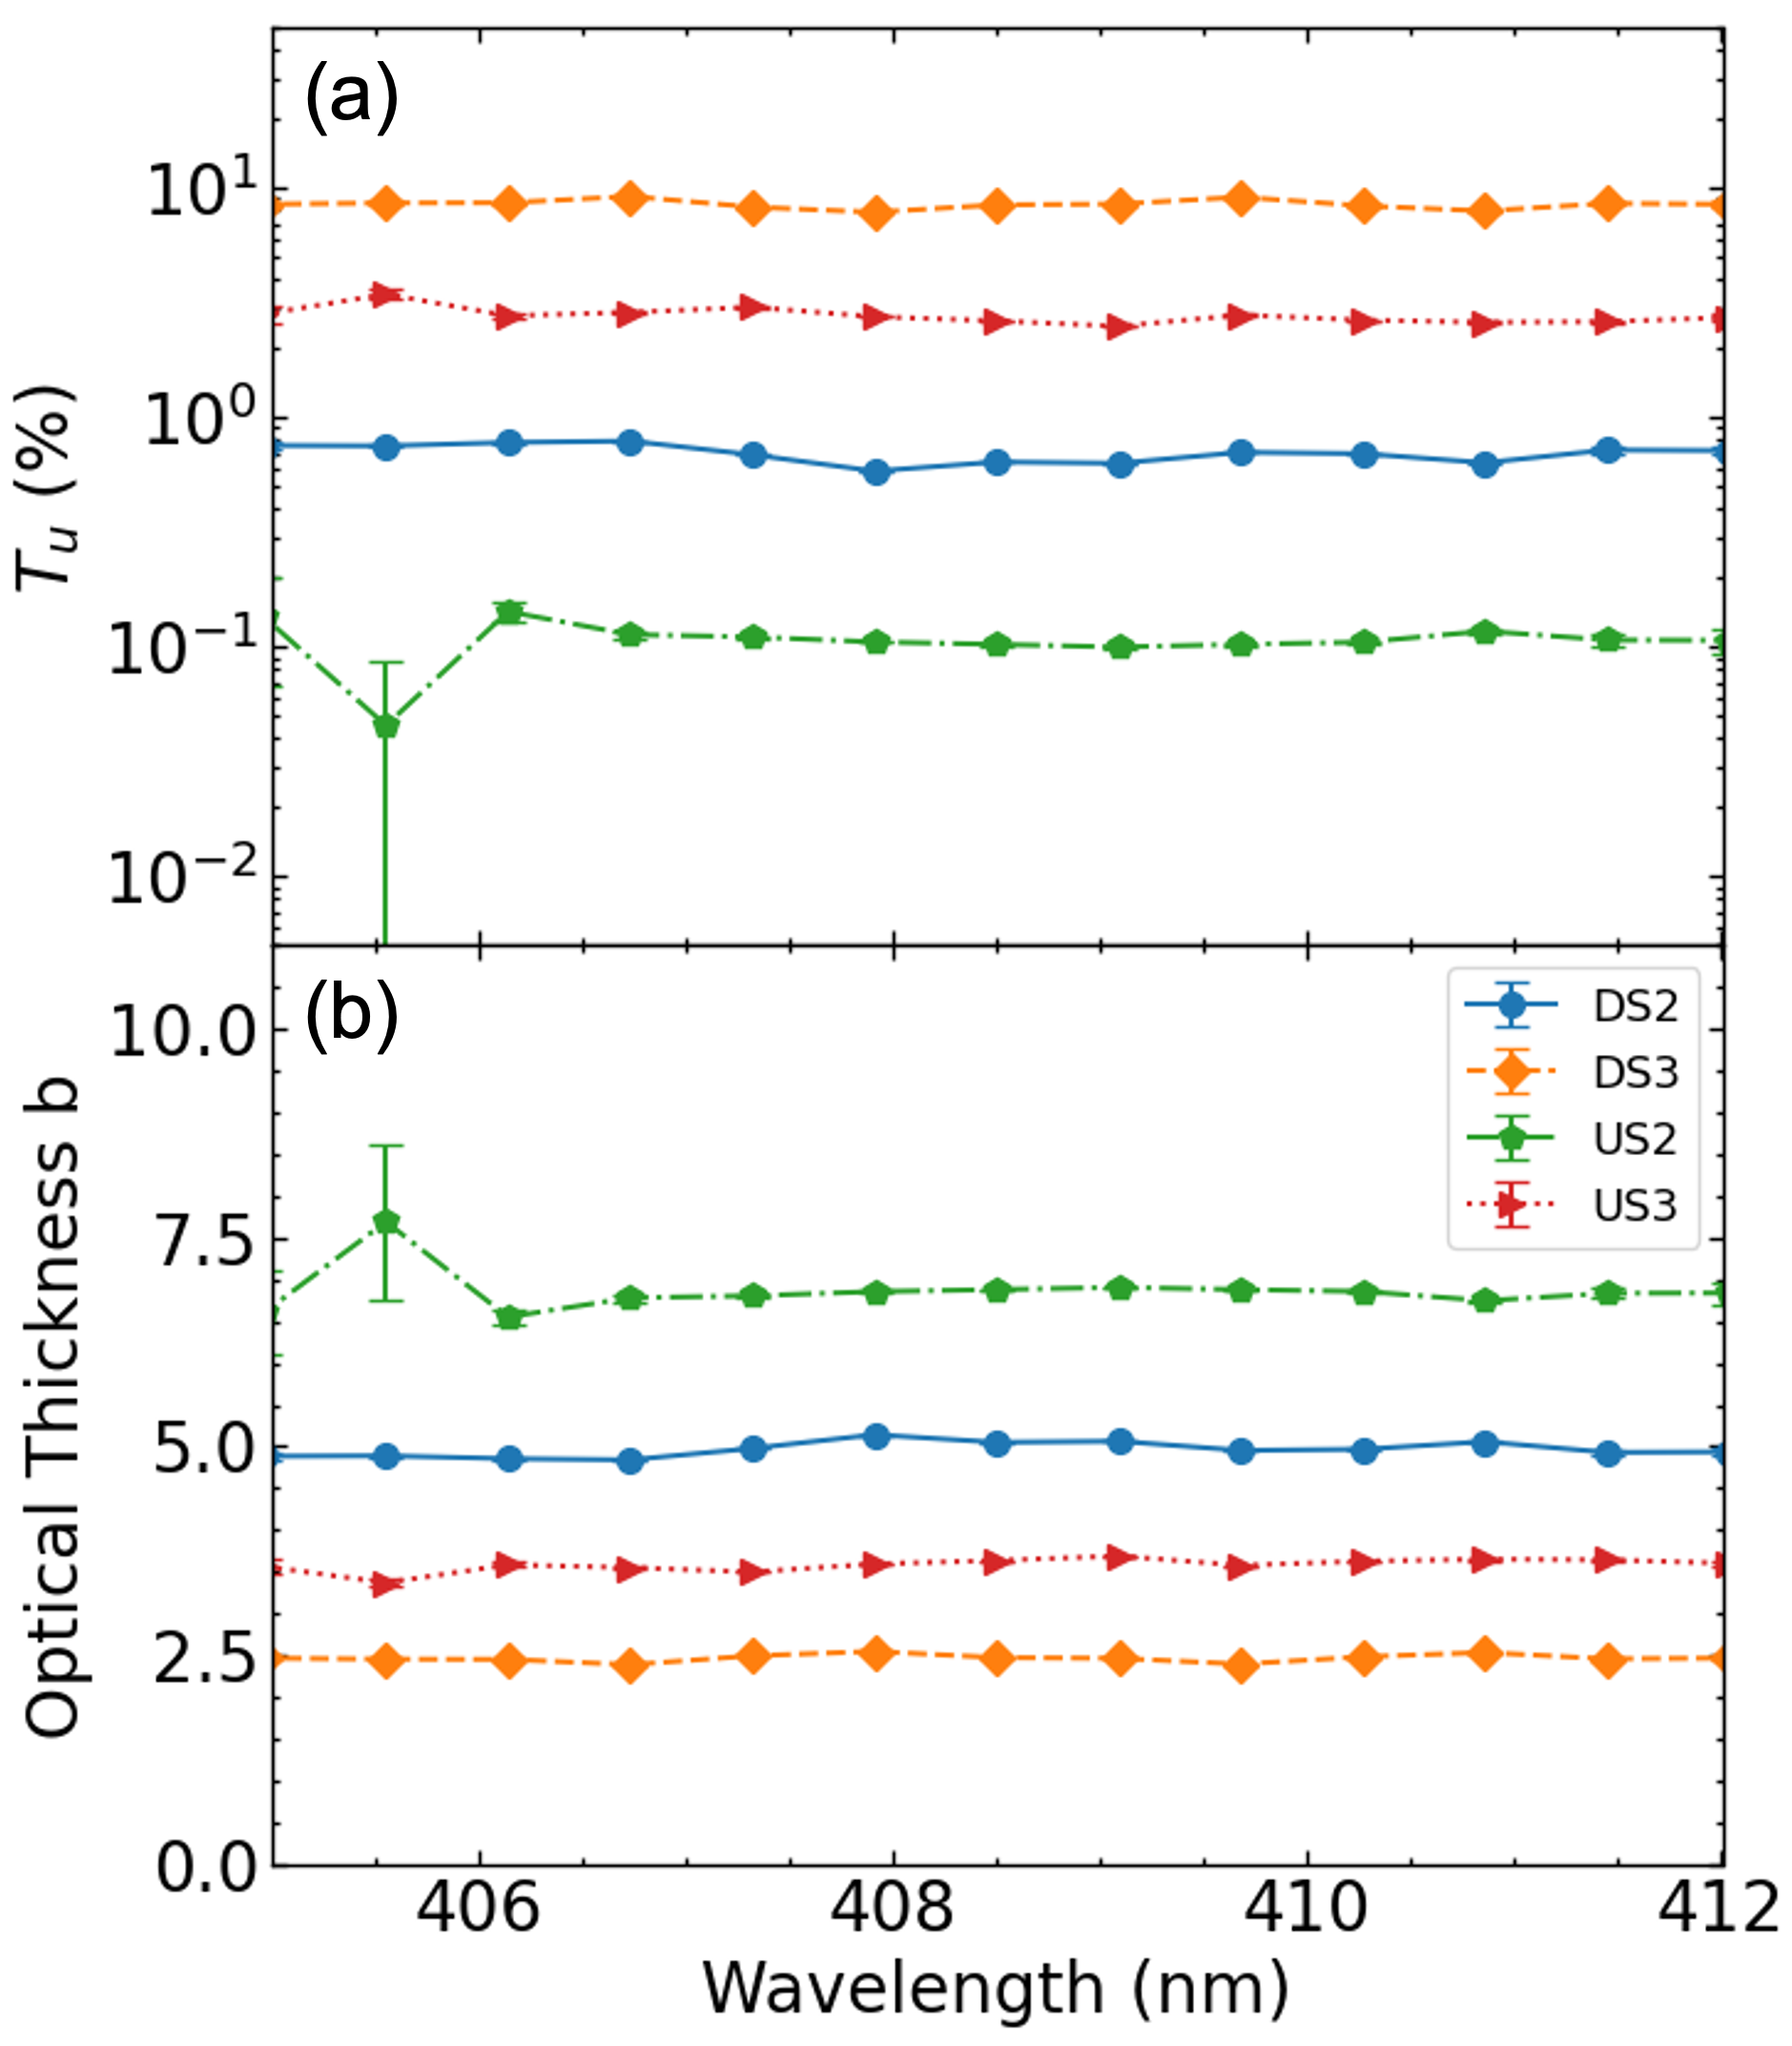
Figure 7(a) presents the measured unscattered transmission , and Figure 7(b) displays the extracted optical thickness of samples DS2, DS3, US2, and US3 throughout the bandwidth of the blue laser. The most dense samples DS1 and US1 have a vanishing transmission below our detection limit and are not shown. Therefore, the optical thickness of DS1 and US1 are calculated from the measurements of other samples, by appropriately scaling the density of scatterers. The results show a clear effect of the density of scatterers and the composition of the scatterers on the light transmission. Naively, one would expect dyed samples to be optically thicker than undyed samples with similar scatterer concentrations due to increased absorption, however, our measurements show the opposite. We attribute this interesting result to the presence of the unknown red dye inside the scatterers that alters the refractive index of the polystyrene spheres in DS2 and DS3. The dye likely makes the spheres more anisotropic, causing them to scatter light more in the forward direction. Consequently, the unscattered part of the transmitted light increases, which explains our observations in Figure 7.
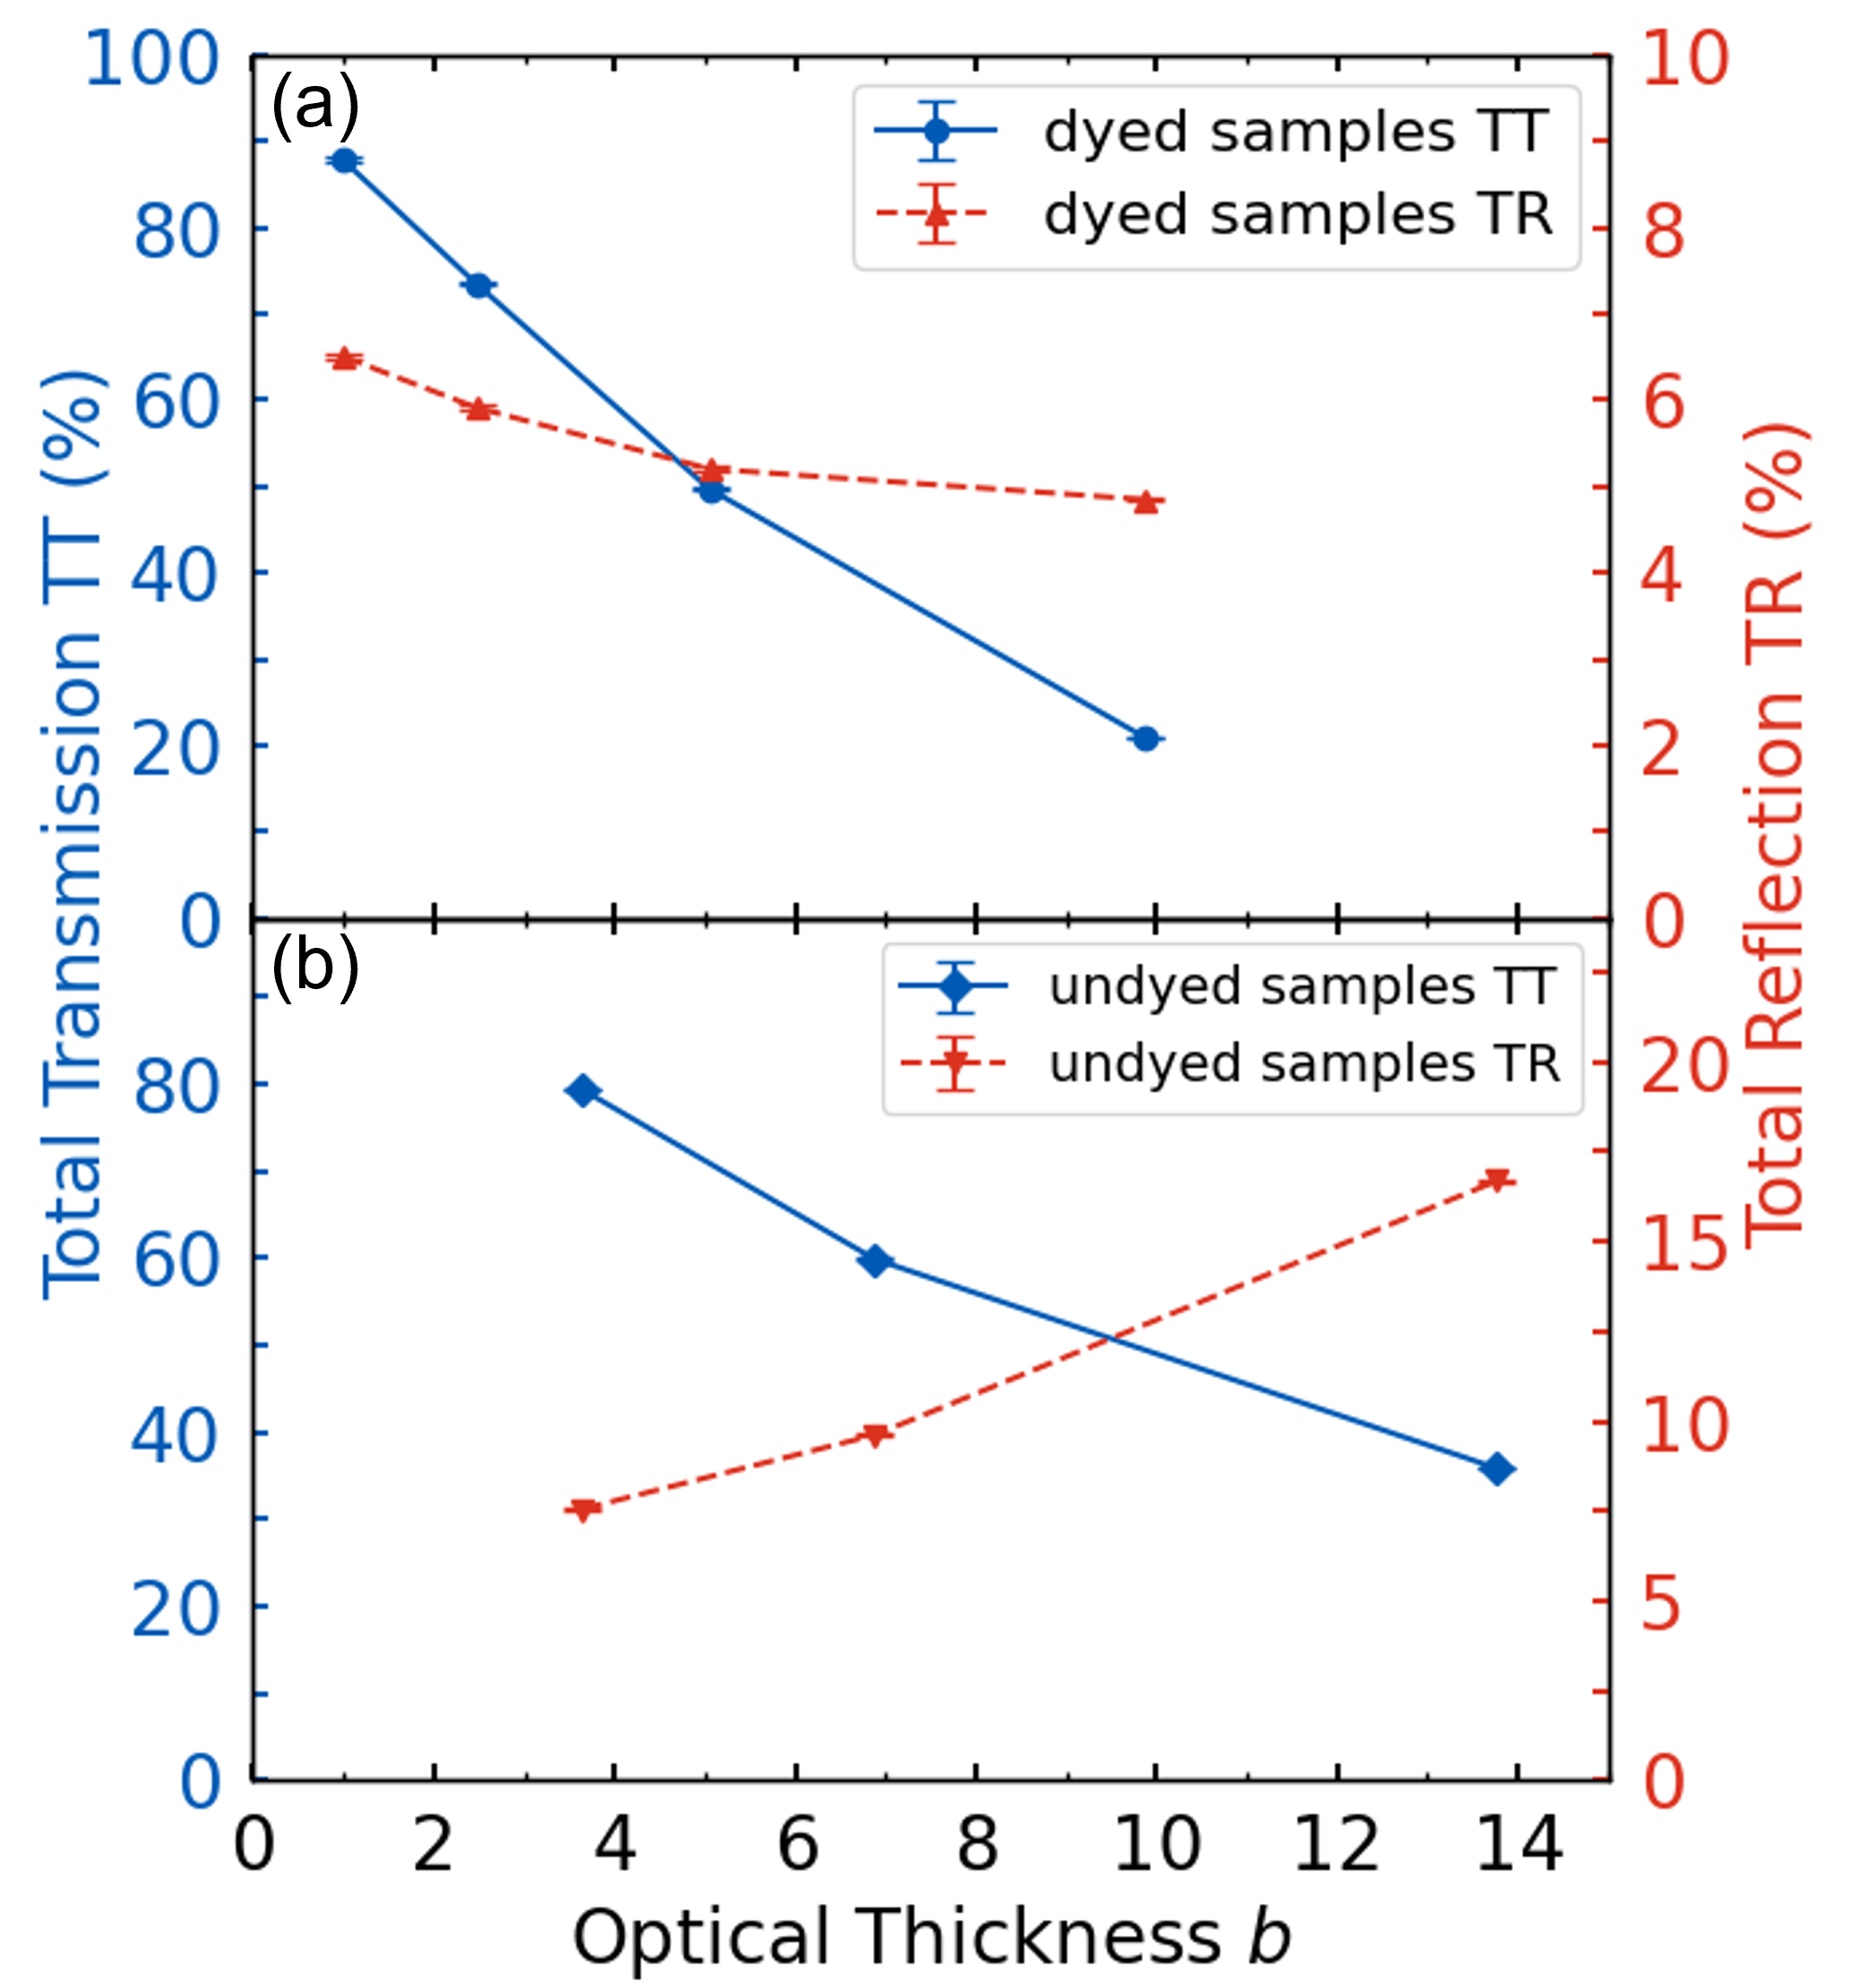
Total transmission (TT) and total reflection (TR) of dyed and undyed microsphere suspensions are displayed in Figure 8 as a function of their optical thicknesses at a wavelength of nm. As the optical thickness increases, both TT and TR decrease for the dyed microspheres. The decrease in TT matches with the increasing absorption, and the decrease in TR agrees with the increasing density of forward scattering scatterers and absorption as the suspension gets optically thicker. In contrast, for undyed sphere suspensions, the TR increases with increasing optical thickness due to the scatterers having negligible absorption. These measurements are necessary to determine the scattering parameters of the samples using models such as the diffusion approximation, approximations, and Monte Carlo simulations of light transport.
III.2 Determining parameters of the samples
Mie calculations provide the albedo and anisotropy of scatterers in a sample if the complex refractive index and size of the scatterers are known. Unfortunately, the scatterers in the dyed microsphere suspensions are filled with a red dye that is unknown to us, as the manufacturer was not able to share the information. Therefore, the albedo and anisotropy of dyed microsphere suspensions are determined by comparing TT and TR measurements to Monte Carlo simulations of light transport, using a brute-force approach. First, the optical thicknesses of the samples are extracted, and then Monte Carlo simulations of light transport are performed for a grid of pairs covering all possible albedos and anisotropies. We then use the relative cost function defined as
| (3) |
where the squared relative distances and are equal to
| (4) |
and where and are the total transmission and reflection from Monte Carlo simulations, and are measured, is the running coordinate in the albedo-anisotropy grid, and is the albedo-anisotropy pair of the sample that we want to extract. For the measured and quantities, represents the number of the sample name, given in Table 1.
Figure 9 shows the extracted parameters for sample DS3 () using the brute-force method explained above. In addition, Figure 9 shows the unphysical ranges of , , and approximations for the sample with optical thickness . The horizontal and vertical axes represent all possible albedo and anisotropy values, respectively. The minimum (the best fit) is found, as expected, in the strong forward scattering and moderately absorbing region of the grid, which is in the unphysical range of approximation 111The physical ranges do not imply better accuracy [39].. However, it is noteworthy that the best fit to our measurements is at , which is an extreme point and is realistically unattainable in real samples with scatterers 222As the extreme points are not physical, they are not considered in calculations.. This implies that errors in our measurements have a significant effect on the determination of the parameters of the samples. While the random errors in the measurements are negligible (see Figure 8), the systematic errors are significant and further discussed below. We attribute the systematic errors to the integrating sphere ports, which are not large enough to capture all the reflected and transmitted light.
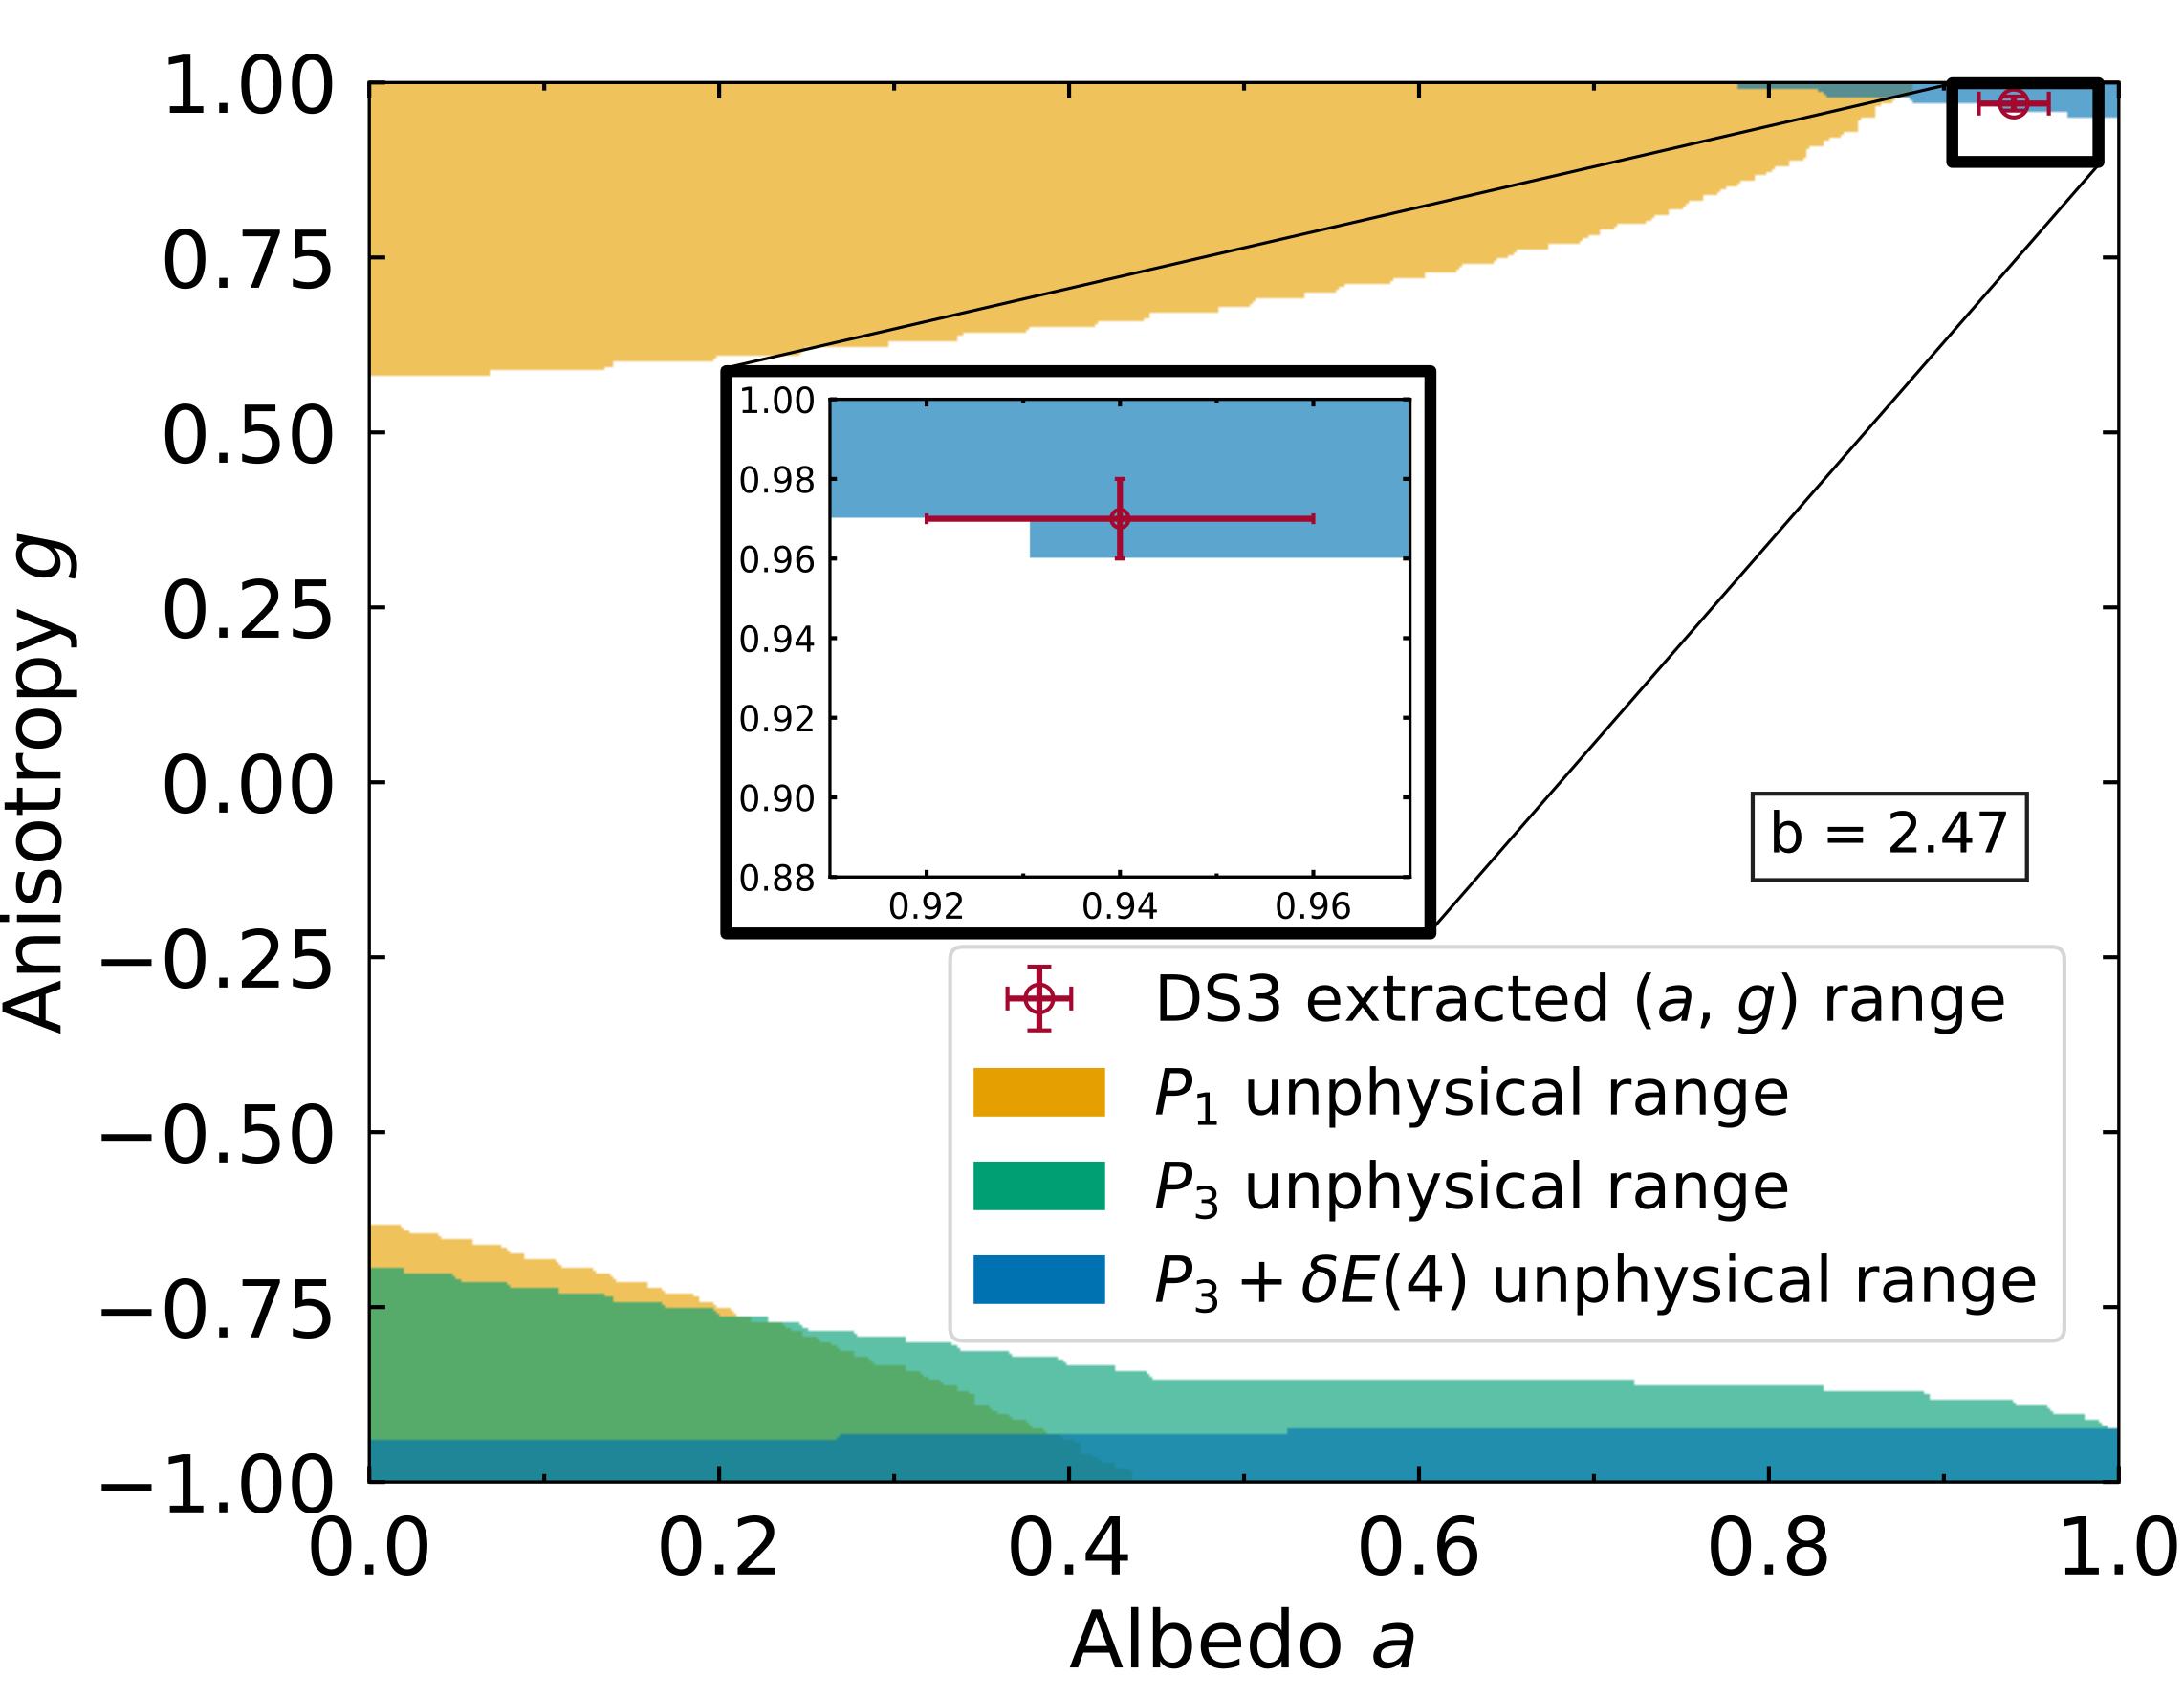
Systematic errors are more significant for samples with a lower density of scatterers, as the suspensions are held in quartz cuvettes, and light reflects from the cuvette walls multiple times before leaving the sample. This could cause the light to exit the sample at a wider angle than the integrating sphere can collect, especially for the total reflection measurements, as light is incident on the sample with a angle due to the integrating sphere design. If the absorption is high inside the sample, this is a minor issue as the internally reflected light diminishes quickly and the spread is not wide. We emphasize that these internal reflections are included in the Monte Carlo simulations to obtain results as close as possible to the actual measurements. Since errors are larger for lower densities and as we know that the reference sample has and , we estimate the maximum potential systematic errors of TT and TR for our measurements by comparing the measurements to the Monte Carlo simulations for the reference sample. This comparison gives us the maximum systematic error for the total transmission and for the total reflection . We utilize these errors to extract a range of possible parameters for each sample, and we take the average value of that range as the extracted pair. Additionally, we use the extracted range to model a dynamic range with the approximations, which are discussed in subsection III.3. The extracted parameters of the dyed microsphere suspension samples are given in Table 2, which shows that the dyed samples are highly forward scattering, and have moderate absorption.
| Sample name | Extracted | Extracted | ||
|---|---|---|---|---|
| DS1 | ||||
| DS2 | ||||
| DS3 |
The comparison of simulated and measured transmission and reflection signals is not necessary for the undyed microsphere suspensions, as their optical properties can be obtained directly from Mie calculations. The complex refractive index of polystyrene spheres at nm is taken from reference [48] to be , which yields non-absorbing and strong forward scattering for the undyed microspheres suspended in DI water. Additionally, Mie calculations provide the extinction cross-section , which we utilized together with the uncertainty of the scatterer radius to determine the uncertainty in the reported densities listed in Table 1. These extracted parameters for both dyed and undyed samples lie within the range where and approximations fail, whereas should give accurate results.
III.3 Position-dependent energy fluence rate of dyed microsphere suspensions
To determine the position-dependent energy fluence rate , the light intensity at specific points inside samples is measured using the experimental setup described in subsection II.2. The coordinate system adopted in this section is depicted in Figure 4. The objective is to infer from measurements of the emission of quantum dots inside the probe, which are excited by the blue light inside the sample, along from the left boundary at where the incident light enters, to the right boundary at mm. For the details of the probing procedure, see appendix A.3. The experimental data are compared to Monte Carlo simulations and analytical , , and approximations to the radiative transfer equation [39].
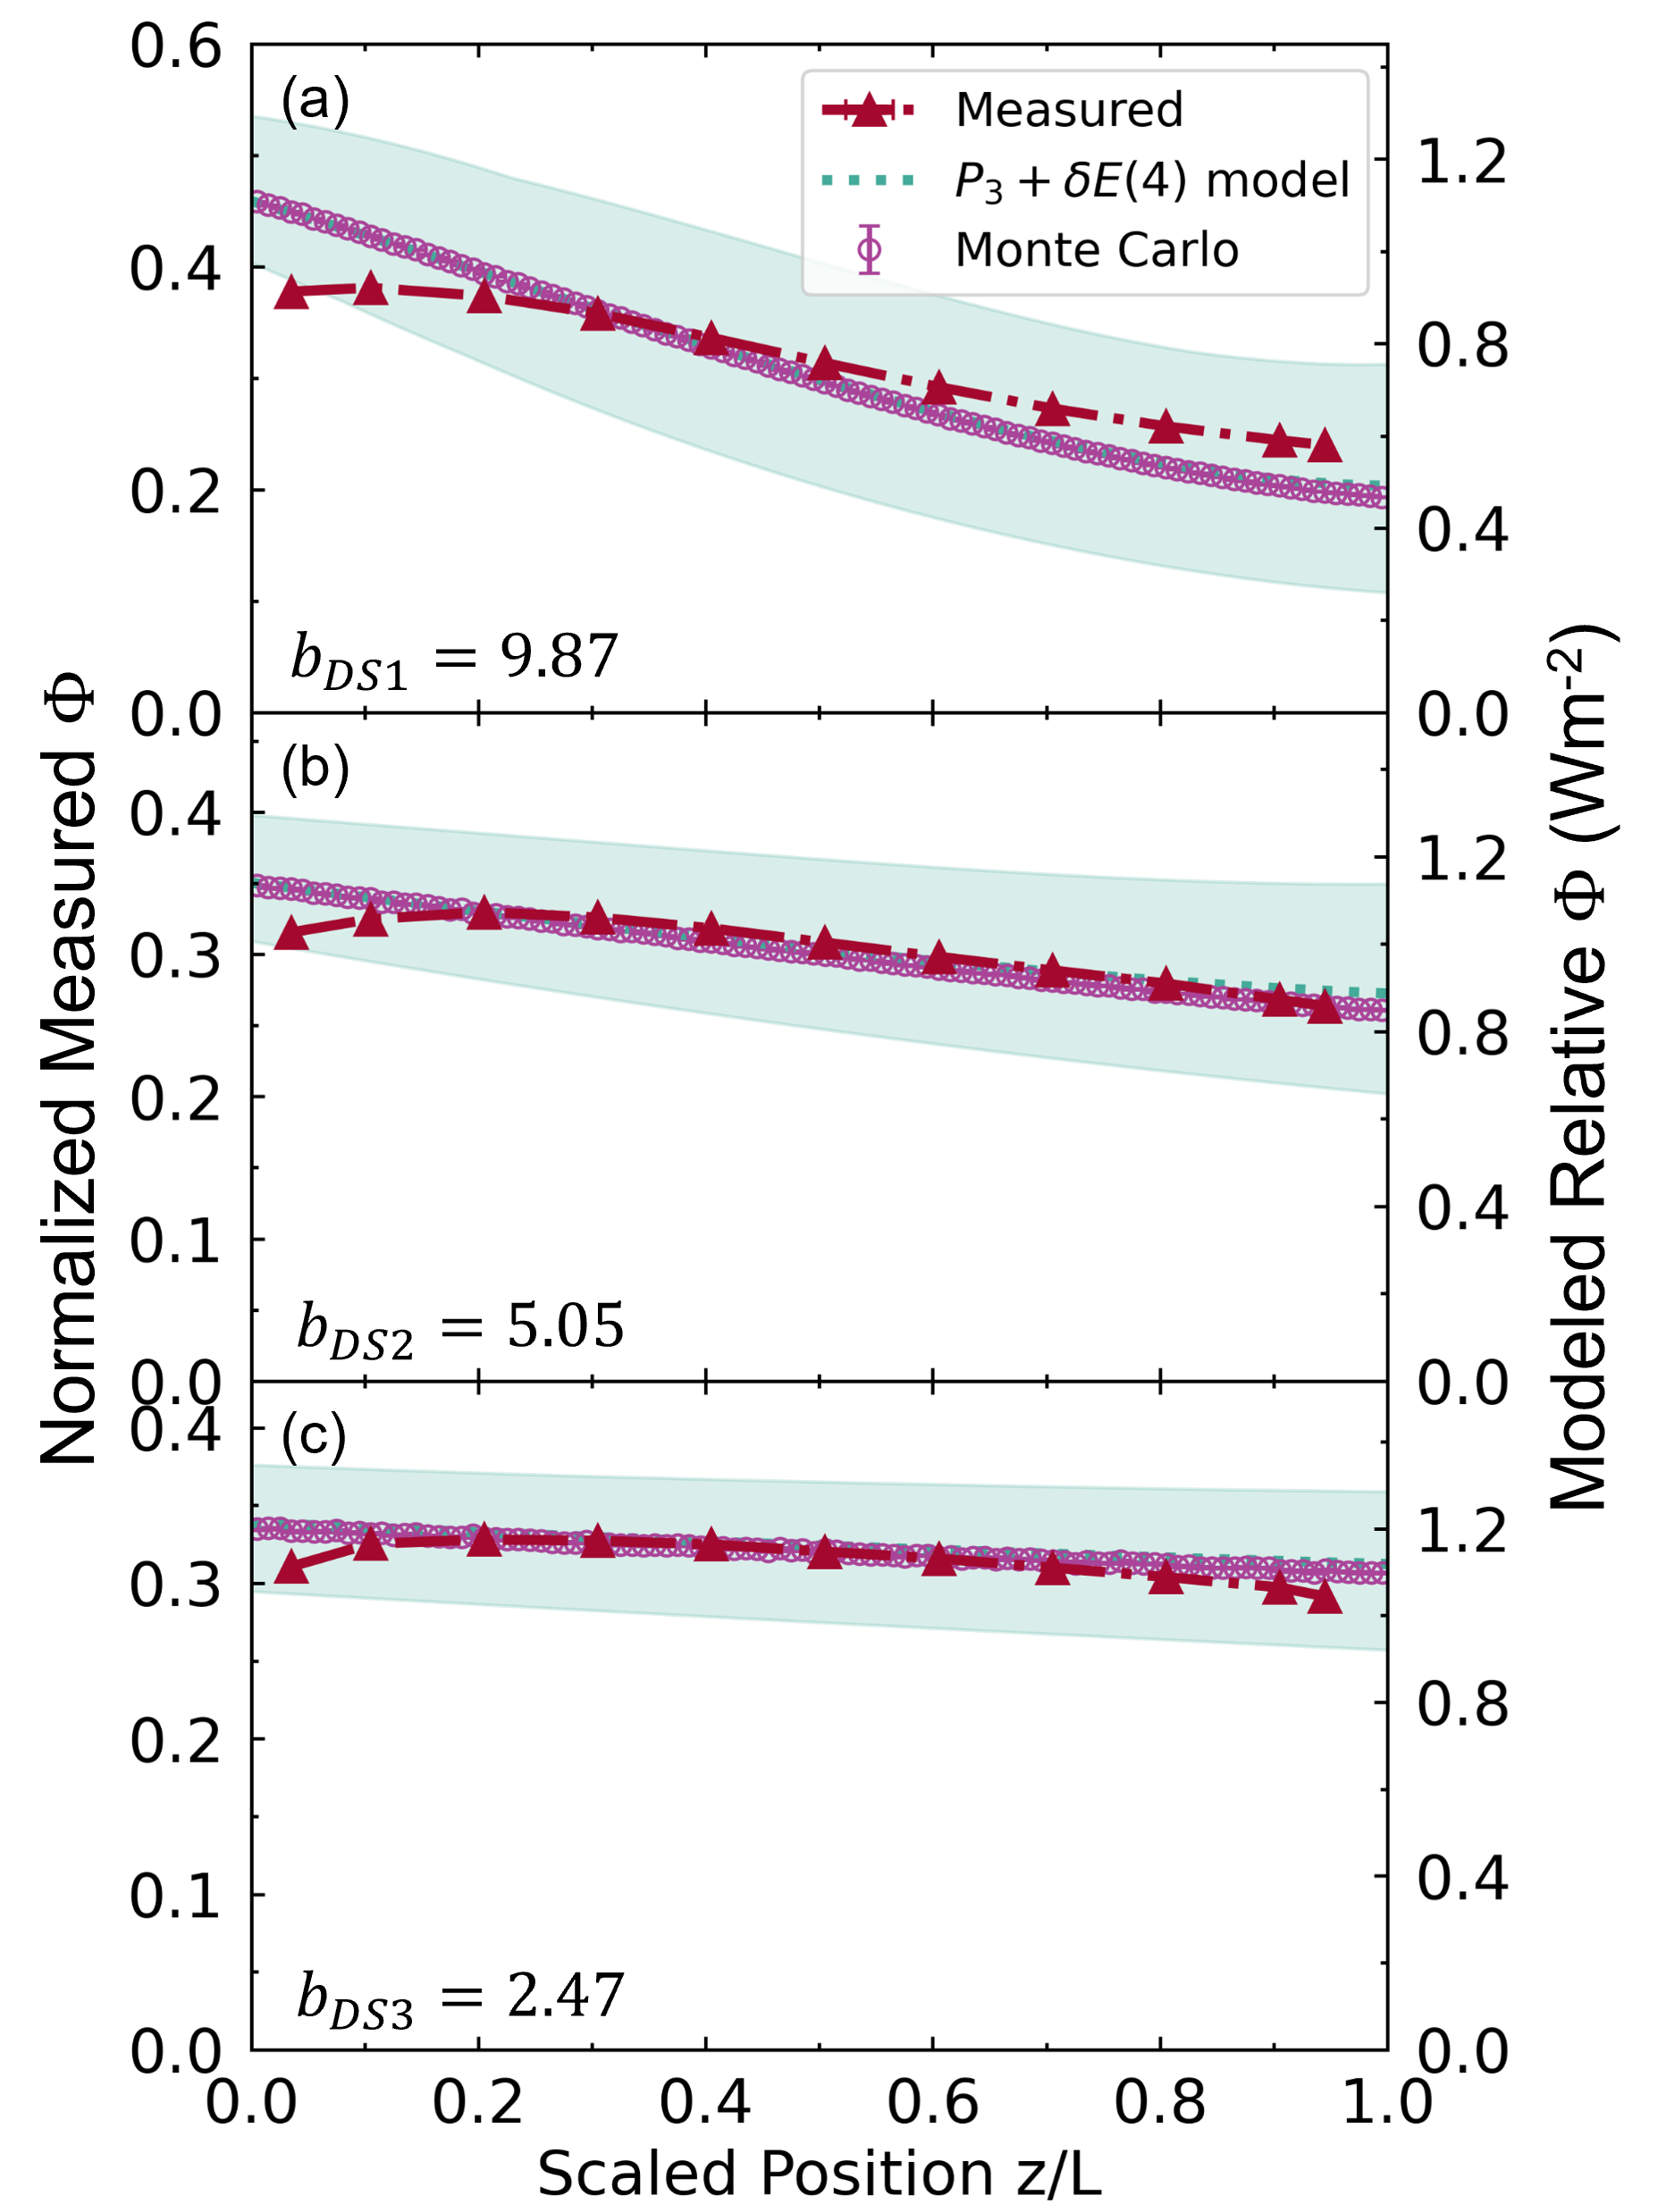
Figure 10 presents the comparison between the models and our measurements. The and approximations are not shown as they demonstrate poor accuracy (see Figure 11). The green areas in Figure 10 represent the modeled values for the extracted range using the approximation. The horizontal axis represents the -positions scaled by the thickness of the sample, while the vertical axis on the left displays the measurements of samples normalized to the measurements of the incident intensity, which is presented in Figure 13(b). The right vertical axis corresponds to the modeled relative . Both vertical axes are scaled to compare the trends of measured and modeled , and a good agreement is observed between them. We define a straightforward relation, neglecting the small random errors in measurements,
| (5) |
where is a constant that represents the portion of that is measured. mainly depends on the experimental limitations that are discussed below in subsection III.5. The small differences in measured and modeled trends, excluding the scaling discussed above, are attributed to the limitations of the Henyey-Greenstein phase function [49].
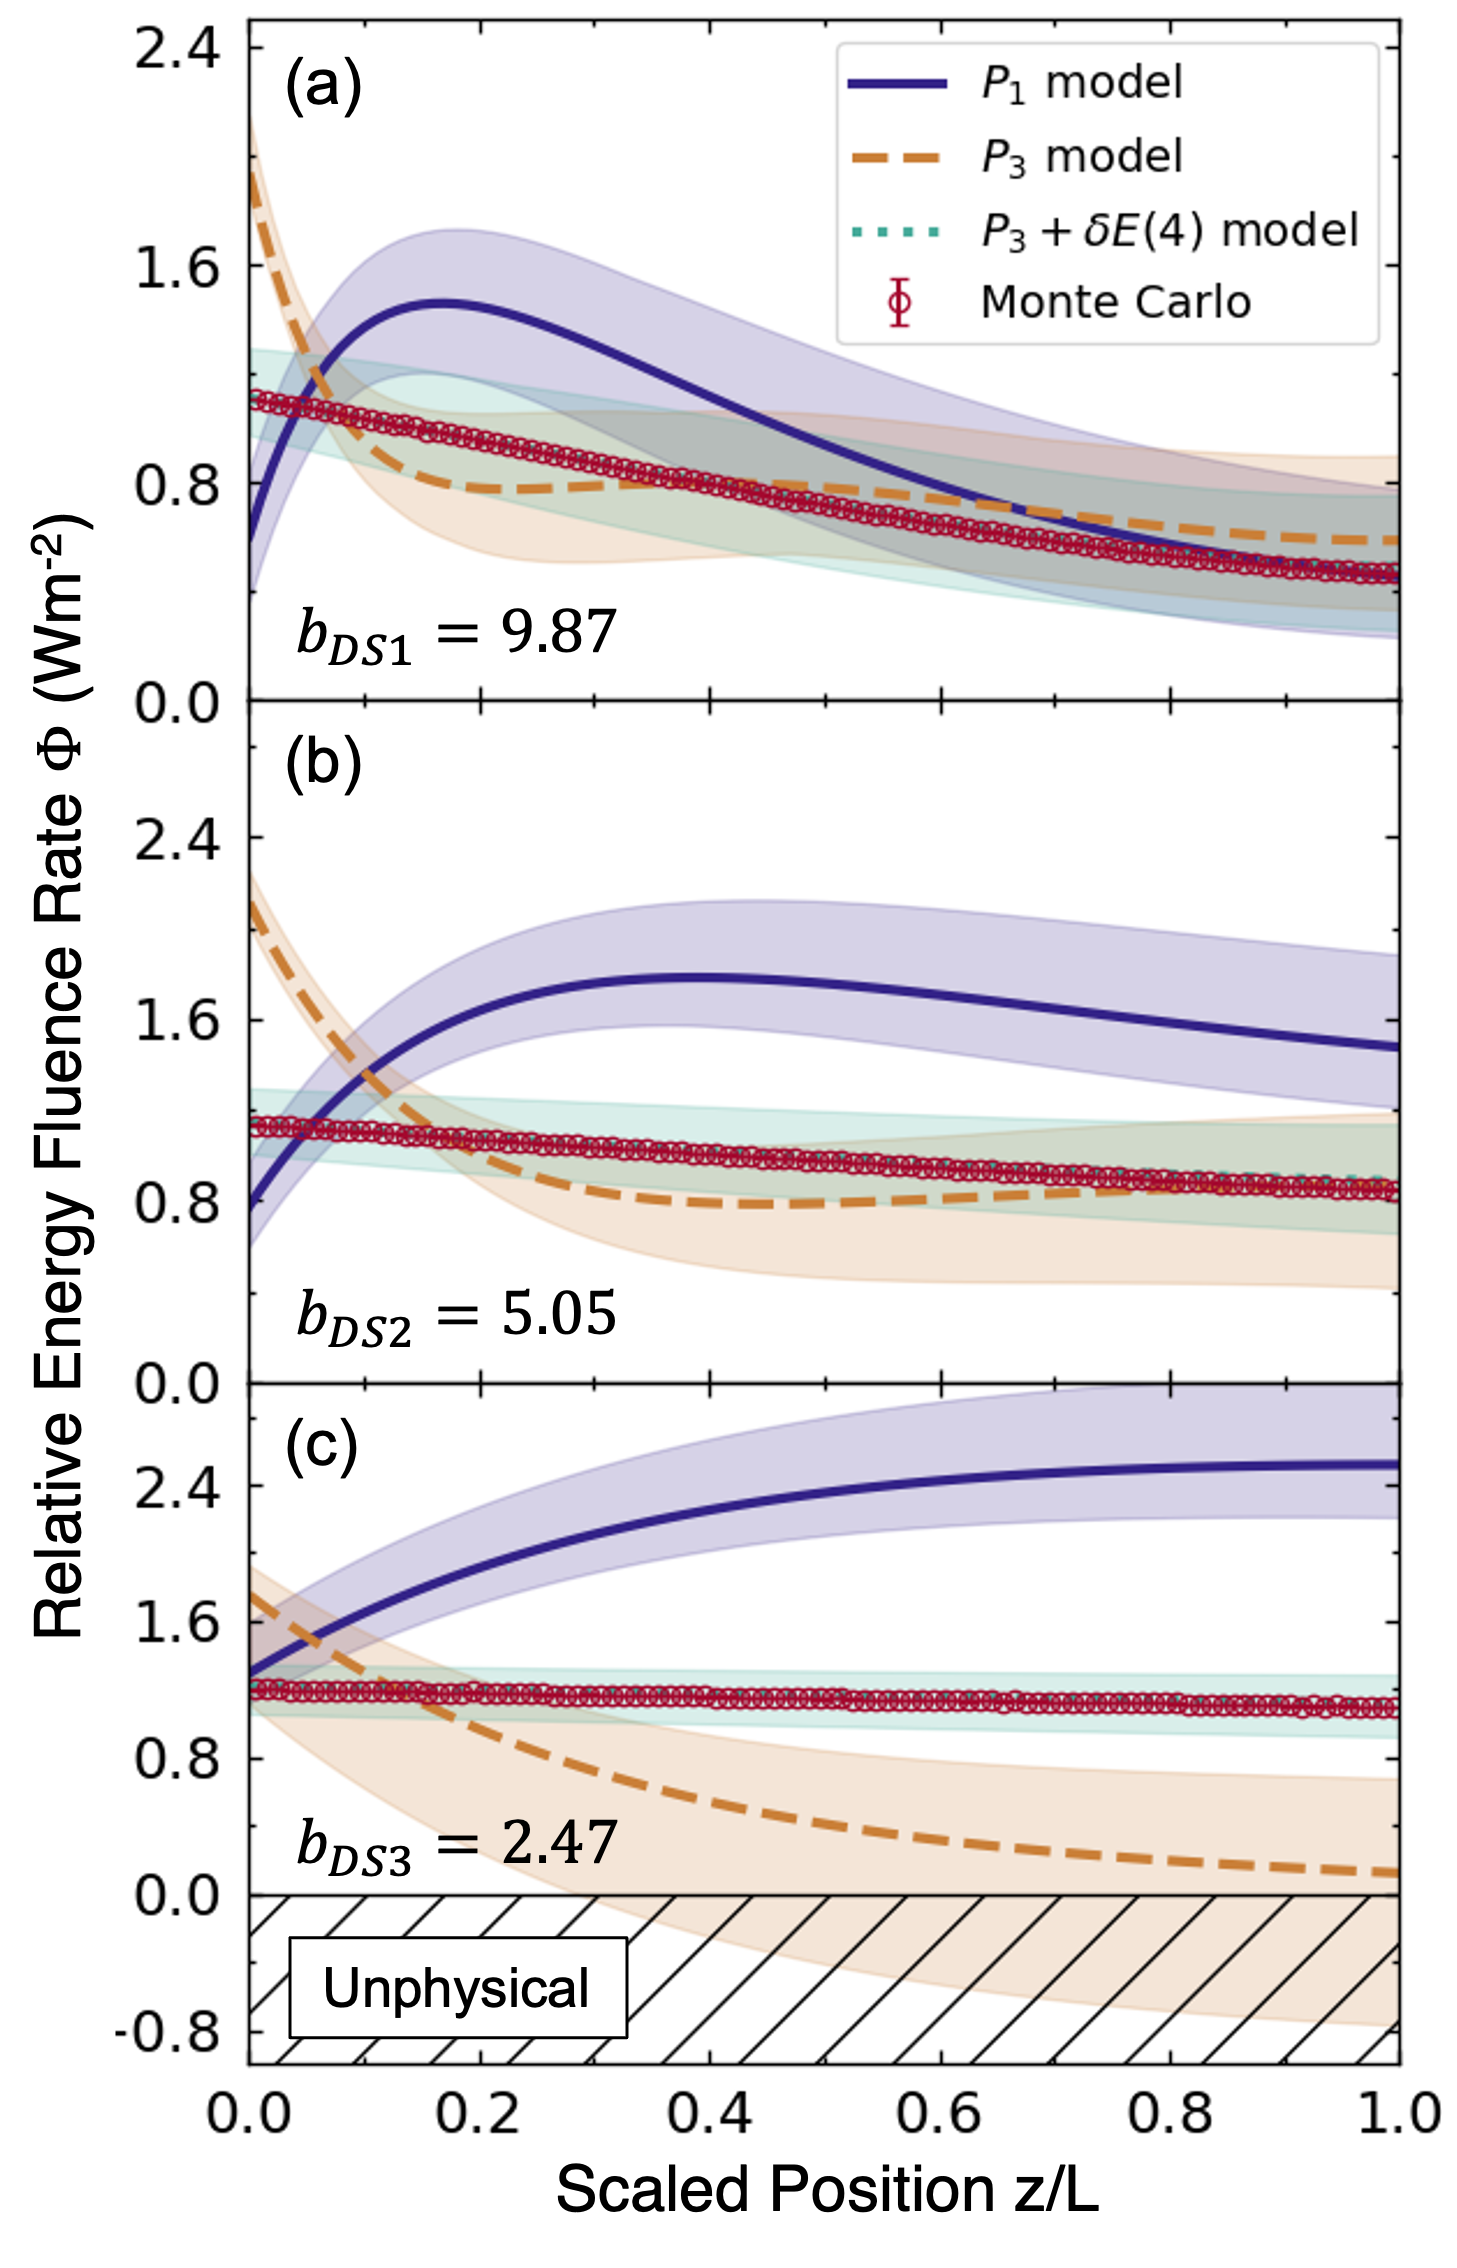
The results of the , , and approximations and Monte Carlo simulations are illustrated in Figure 11, where the -positions are scaled by the thickness of the sample, and the modeled is relative, as the incident flux density (irradiance) in the models is set to be . The dynamic ranges of the approximations represent the modeled values for the extracted range. Initially, it may appear confusing that a relative result is greater than 1, as seen in the case of sample DS1. Although both the irradiance and energy fluence rate have the same units , the former denotes the optical power through the surface of a flat unit area in the direction normal to the surface, while the latter refers to the total optical power through a spherical unit surface area in all directions [50]. Therefore, depending on the scattering properties of the medium being measured, it is possible for to be larger than the incident irradiance [17, 51, 52].
Figure 11 shows that the approximation has the best agreement with the Monte Carlo simulations, which is consistent with previously reported findings [17, 39]. The and approximations perform poorly for these anisotropically scattering and absorbing samples, and the approximation even predicts an unphysical negative energy fluence rate for the dynamic range of the optically thin sample DS3. The unphysical results of the approximation for sample DS3 also agree with our previous findings [39], which shows a broader unphysical range of for optically thin samples in the strong forward scattering range, compared to the thicker samples.
III.4 Position-dependent energy fluence rate of undyed microsphere suspensions
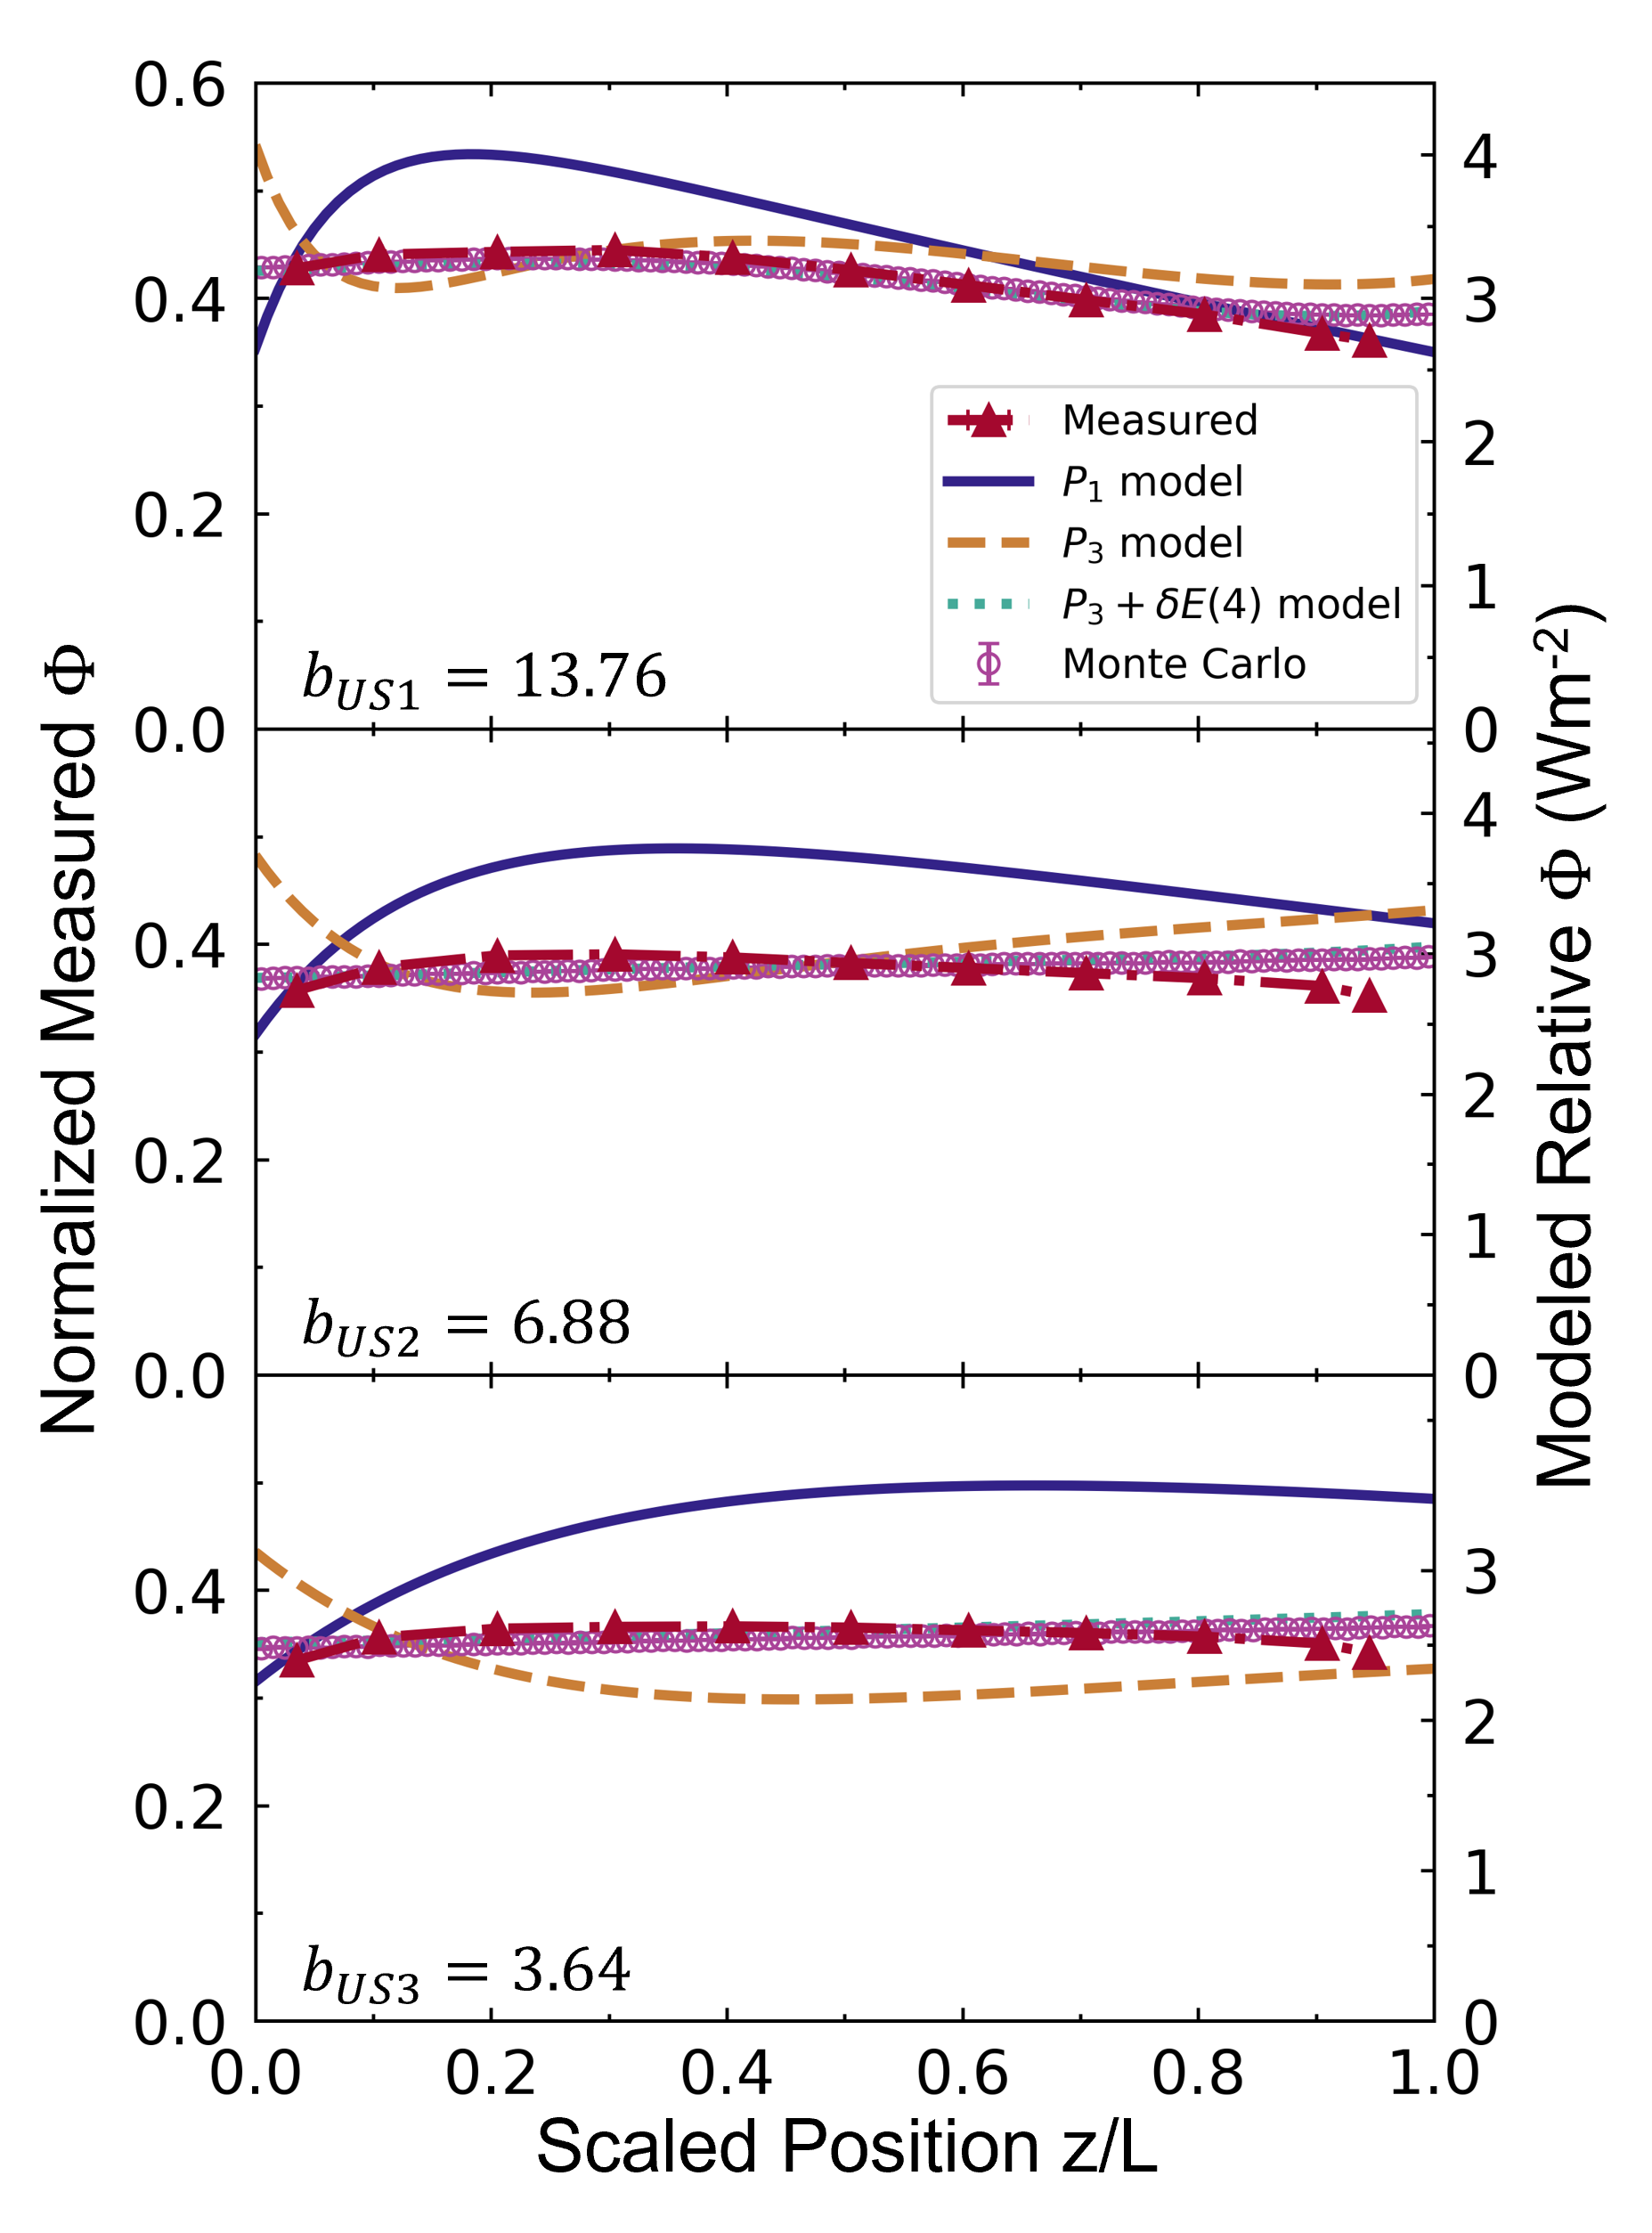
We present measured of undyed sphere suspensions and compare them to models in Figure 12. The approximation results do not have dynamic ranges in Figure 12 as the pair of samples US1, US2, and US3 are extracted from exact Mie calculations, as explained in subsection III.2. Similar to Figure 10, the horizontal axis denotes the -positions scaled by the thickness of the sample, and the left vertical axis gives the measurements of samples normalized to the measurements of the incident intensity given in Figure 13(b). The right vertical axis is the modeled relative , and both vertical axes are scaled to compare the trends of measured and modeled . A good agreement between the trends of , Monte Carlo, and measurements are observed. For these microspheres no unphysical predictions occur since the absorption is absent, hence the albedo is equal to 1. Differences due to experimental limitations are discussed in subsection III.5.
III.5 Experimental limitations
Systematic errors are inevitable in any experiment, including the measurements of . It is thus important to identify and comprehend the underlying causes of the systematic errors, before claiming that the measurements reflect reality. Hence, this subsection discusses the limitations of our experiment that affects the scaling value, , for eqn. 5.
The discussion starts with the shift in detected peaks for -scans at different -positions, which is not immediately obvious for scans presented in Figure 19. To clarify this effect, -scans by the probe at specific are presented in Figure 13(a), which demonstrate a clear shift of the detected intensity in the -direction. This shift is caused by the probe moving at a small angle with respect to the -axis. The angle is estimated as approximately , considering the peaks movement of mm in the -direction for a mm travel in the -direction. Furthermore, Figure 13(b) presents the incident intensity detected by the probe in air, which is used to normalize the measurements of samples in order to compensate for the effect of the -shift.
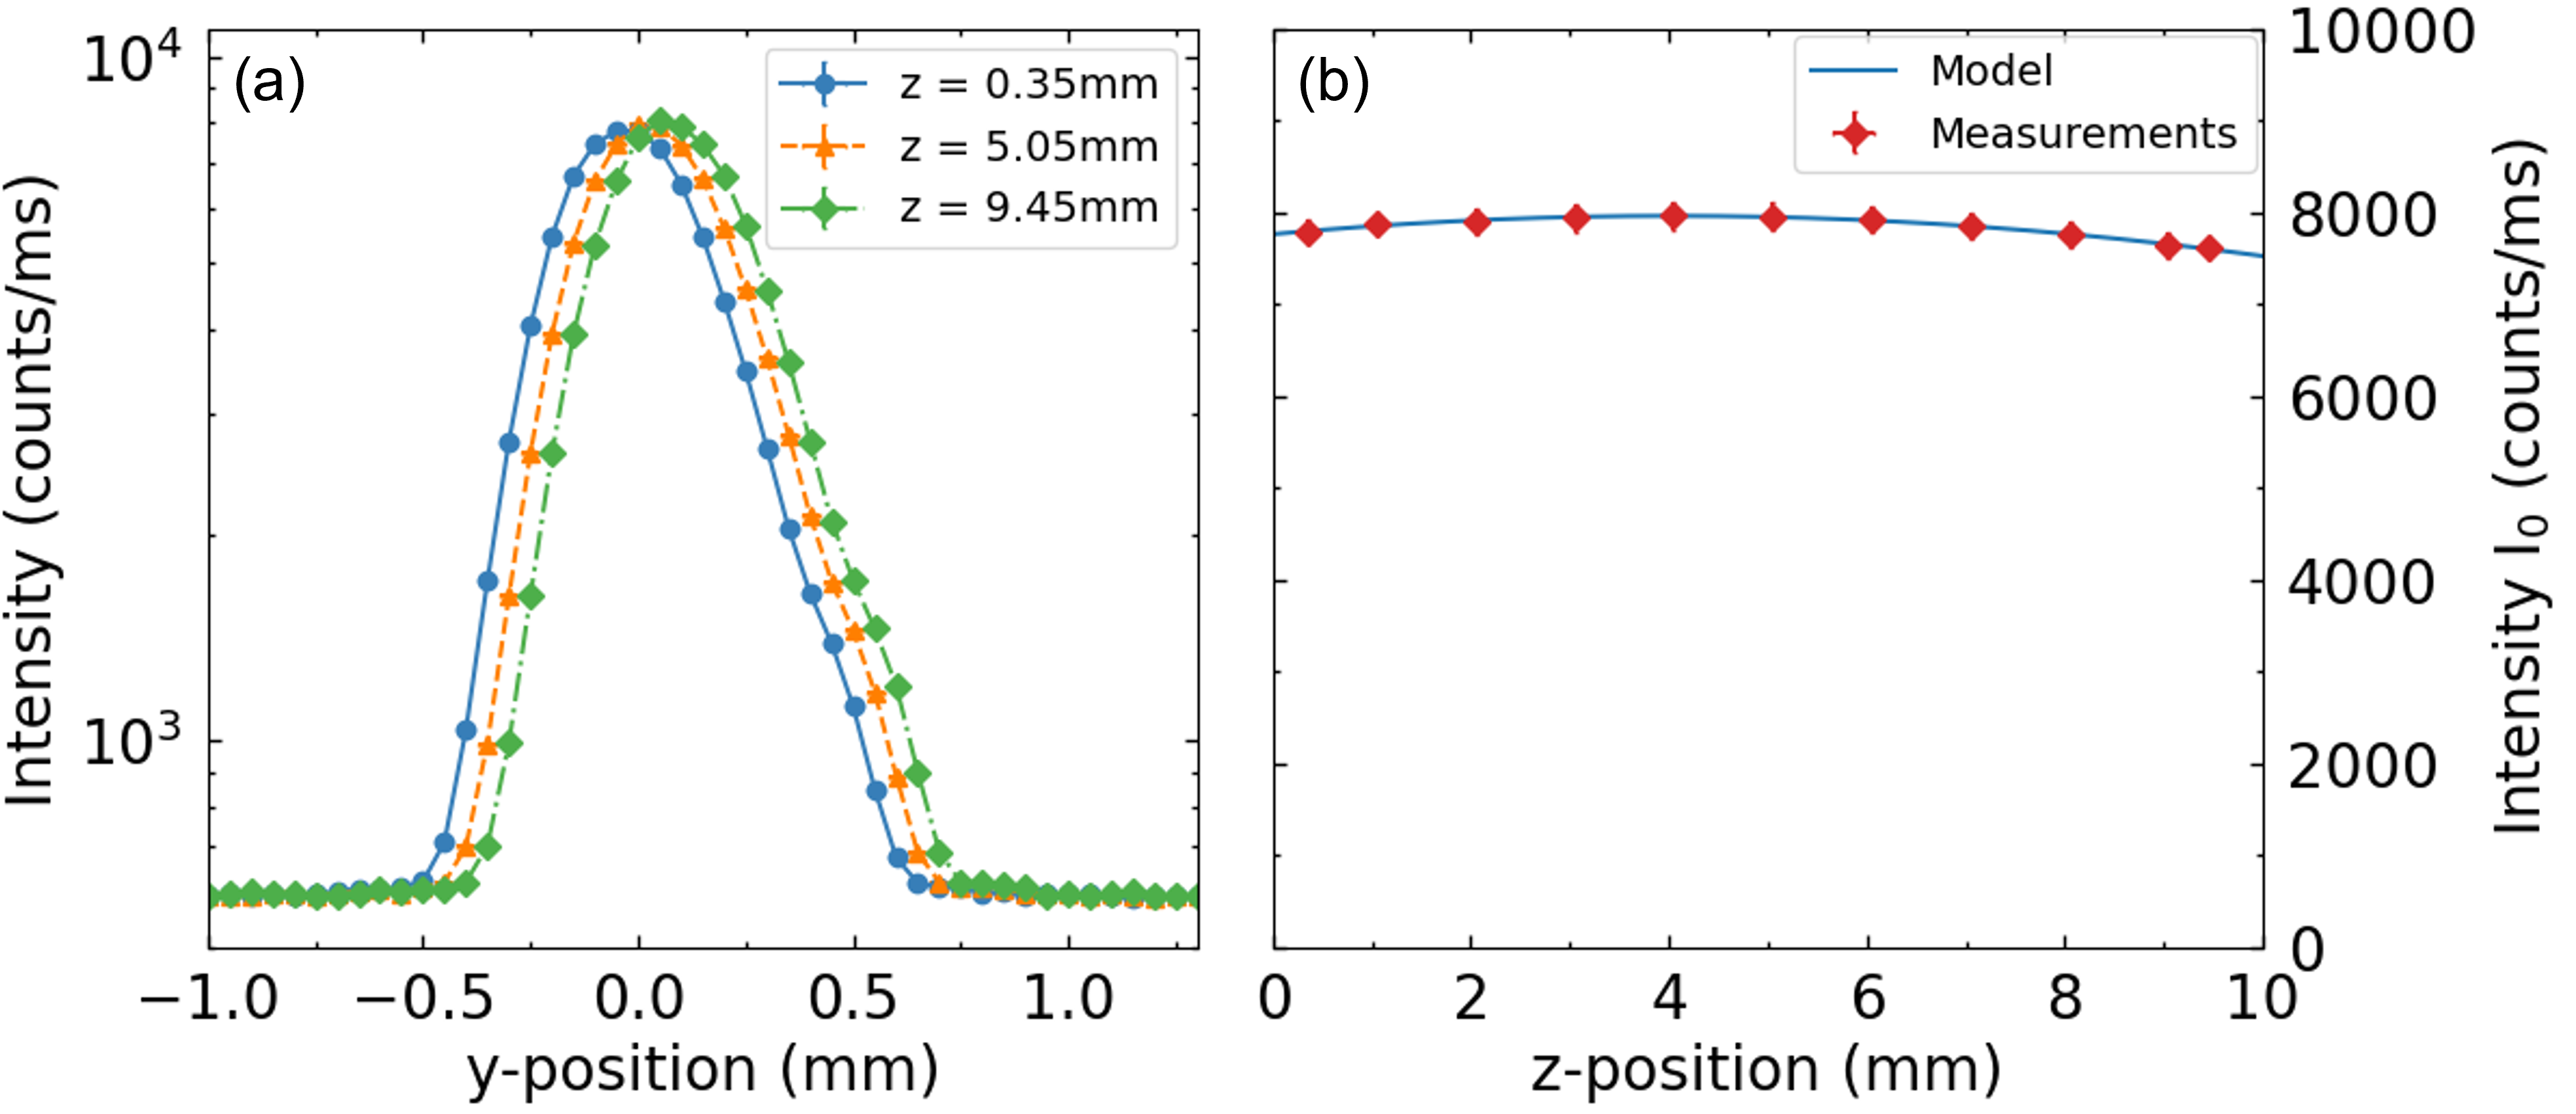
Other experimental limitations associated with the measurements with the probe are listed as follows:
-
1.
The capillary filled with quantum dots is not exactly parallel to the -axis given in Figure 4. Although the kinematic mount attached to the probe holder, as shown in Figure 6, is utilized to adjust the capillary angle, perfect alignment is not always achieved. As a result, the probe positioning inside the sample is restricted to a range between mm and mm, for the -direction. In the event that the probe approaches the boundaries beyond these limits, the capillary may come into contact with the quartz walls of the cuvette, potentially causing its displacement or, worse, breaking of the capillary.
-
2.
The stabilities of the probe holder, sample holder, and fiber-optic cable that connects the probe and detector are not perfect. Small variances in different scan directions presented in Figure 17 are likely caused by this. However, even slight changes in the adjustment of these elements can lead to drastic changes in the detected intensity. Therefore it is crucial to normalize the measurements to the incident intensity measured under identical conditions as the sample measurements. The measurements presented in this work are conducted with utmost care to address this issue.
-
3.
The finite dimensions of the cuvette used in our experiments differ from ideal slab geometry, as a slab has an infinite -plane. However, the beam diameter of our source ( mm) is significantly smaller than the inner -dimensions of the cuvette ( mm), rendering this effect negligible.
-
4.
Although the measurement of along the -plane is carried out through -scans of the samples, the scans are limited to the range mm to mm with the beam centred at . This range is selected due to low signal strength beyond this range, and to shorten the complete measurement time. The range restriction leaves mm of unmeasured space in the -axis. Additionally, during the sample scans, the capillary tip is situated at a distance of approximately from the cuvette’s bottom. Consequently, the probe scans a rectangular area of dimensions within the cuvette. Hence, the portion of the scanned area to the full -plane within the sample is . However, the measurement of cannot be directly scaled with because the experiments employ a collimated beam as the source and detect most of the light within the cuvette, as evident by the low signal strength beyond the scan range (see Figure 19). However, it is worth noting that the signal outside the scanned range is higher for undyed samples, owing to the lower absorption by the scatterers compared to the dyed samples. Therefore, the scaling difference between the measured and modeled for undyed samples is greater than the one for dyed samples.
-
5.
The quantum dots inside the capillary have a certain quantum yield to convert absorbed blue light to emitted red light. This quantum yield is provided by the manufacturer as . Furthermore, the manufacturer provides the molar extinction coefficient , and the molar concentration . Using the inner diameter of the capillary that holds the quantum dots and the Beer-Lambert-Bouguer’s law, we calculate the extinction to be
(6) and the optical thickness to be
(7) -
6.
The presence of the probe inside the sample has an impact on light transport within the medium. In order to investigate this effect, the unscattered transmission of the probe is measured 333This measurement is conducted with a similar capillary as the one used in the measurements of ., while scanning in the -direction at various -positions inside sample Ref (see Table 1). The obtained results are illustrated in Figure 14. Based on Figure 14, the extinction coefficient of the probe is derived as when the probe is situated at the center of the beam. The represents the sum of absorption and scattering by the probe, hence, the absorbed portion of light by the probe and quantum dots inside, cannot be estimated by this measurement alone.
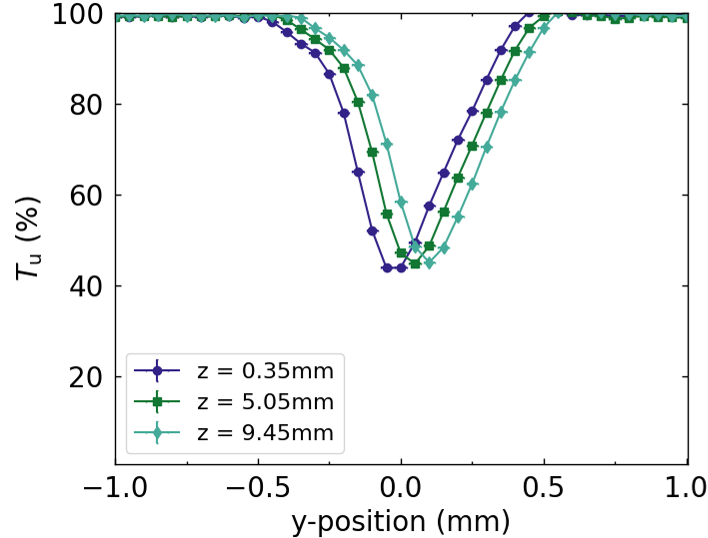
Figure 14: Unscattered transmission of the probe scanning the -direction at various -positions inside sample Ref, see Table 1. -
7.
Part of the emitted light propagates through the capillary and emerges from its top, where it is coupled to the fiber-optic cable of the spectrometer via a connector manufactured in the workshop of the University of Twente. This connector, visible in Figure 6, introduces a distance of approximately mm between the capillary and the fiber. Assuming that the light emanates from the capillary with a solid angle of and taking into account the core diameter of the fiber-optic cable ( ), straightforward calculations yield a coupling efficiency of between the capillary and the fiber.
All experimental limitations listed above contribute to the deviation of measurement results to the model predictions in scale, and the parameter in eqn. 5 is introduced to capture these effects.
IV Conclusions
In this work, we present a comprehensive analysis of the experimental measurements of the position-dependent energy fluence rate in 3D scattering samples with anisotropically scattering and absorbing microspheres ( m), with and without absorbing dye. A thin capillary filled with quantum dots is used as a probe to measure the position-dependent energy fluence rate inside the samples, and the results are compared to analytical models and Monte Carlo simulations. The analytical and approximations to the radiative transfer equation predict inaccurate (and even unphysical) results for these samples, that have a range of scatterer densities. The albedo and anisotropy parameters for the dyed samples are extracted from both experiments and Monte Carlo simulations, while Mie calculations are used to determine the parameters for the undyed samples.
Notably, the and approximations fail to match the observed trends in the position-dependent fluence rate, as anticipated. In contrast, the Monte Carlo simulations and the approximation, which do not yield unphysical results for the samples under consideration, exhibit a relatively good agreement with the measured trends of the fluence rate. We provide a detailed discussion of the experimental limitations that prevent an absolute measurement, and an exact match with the models.
V Acknowledgments
We thank Cock Harteveld and Melissa Goodwin for their help in sample preparation and building the experimental setup, Mario Vretenar for 3D-printing parts for the experimental setup, and Suhyb Salama, Johannes de Boer, and Gilles Vissenberg for very helpful discussions. This work was supported by the NWO-TTW program P15-36 ‘Free-form scattering optics’ (FFSO) in collaboration with TUE and TUD and with industrial partners ASML, Demcon, Lumileds, Schott, Signify, and TNO, and the MESA+ Institute section Applied Nanophotonics (ANP). The data used for this publication are available via the open-access repository Zenodo database that is developed under the European OpenAIRE program and operated by CERN [53].
Appendix A Infrastructure
A.1 Choice of the light source
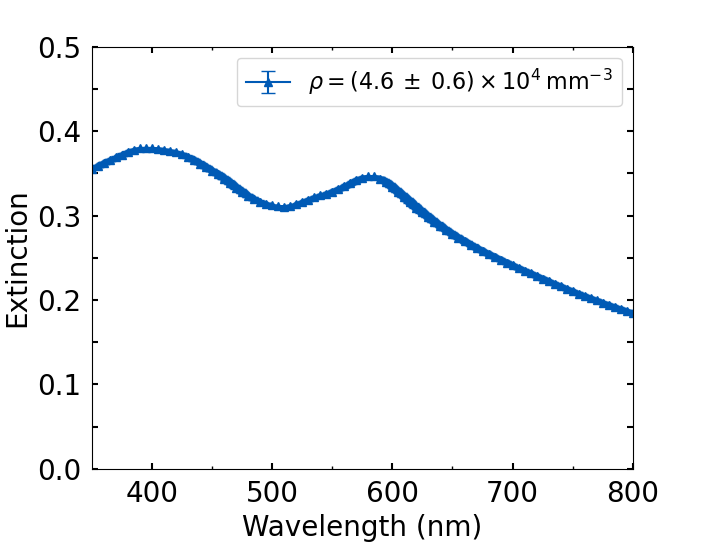
Extinction spectra of the diluted dyed microsphere suspension with a scatterer number density of were measured using a UV-Vis spectrometer (Perkin Elmer Lambda 850, MNF chair at MESA+). The measured spectrum is presented in Figure 15. The sphere suspension is diluted with DI water, thus, the reference used in this UV-Vis measurement is also DI water. The extinction peak of the microspheres in the visible range is observed to be around 400 nm wavelength. Therefore, we chose a Thorlabs NPL41B nanosecond laser with a peak wavelength of as the light source in our experiments, to minimize the albedo of the scatterers.
A.2 Preparation of the probe
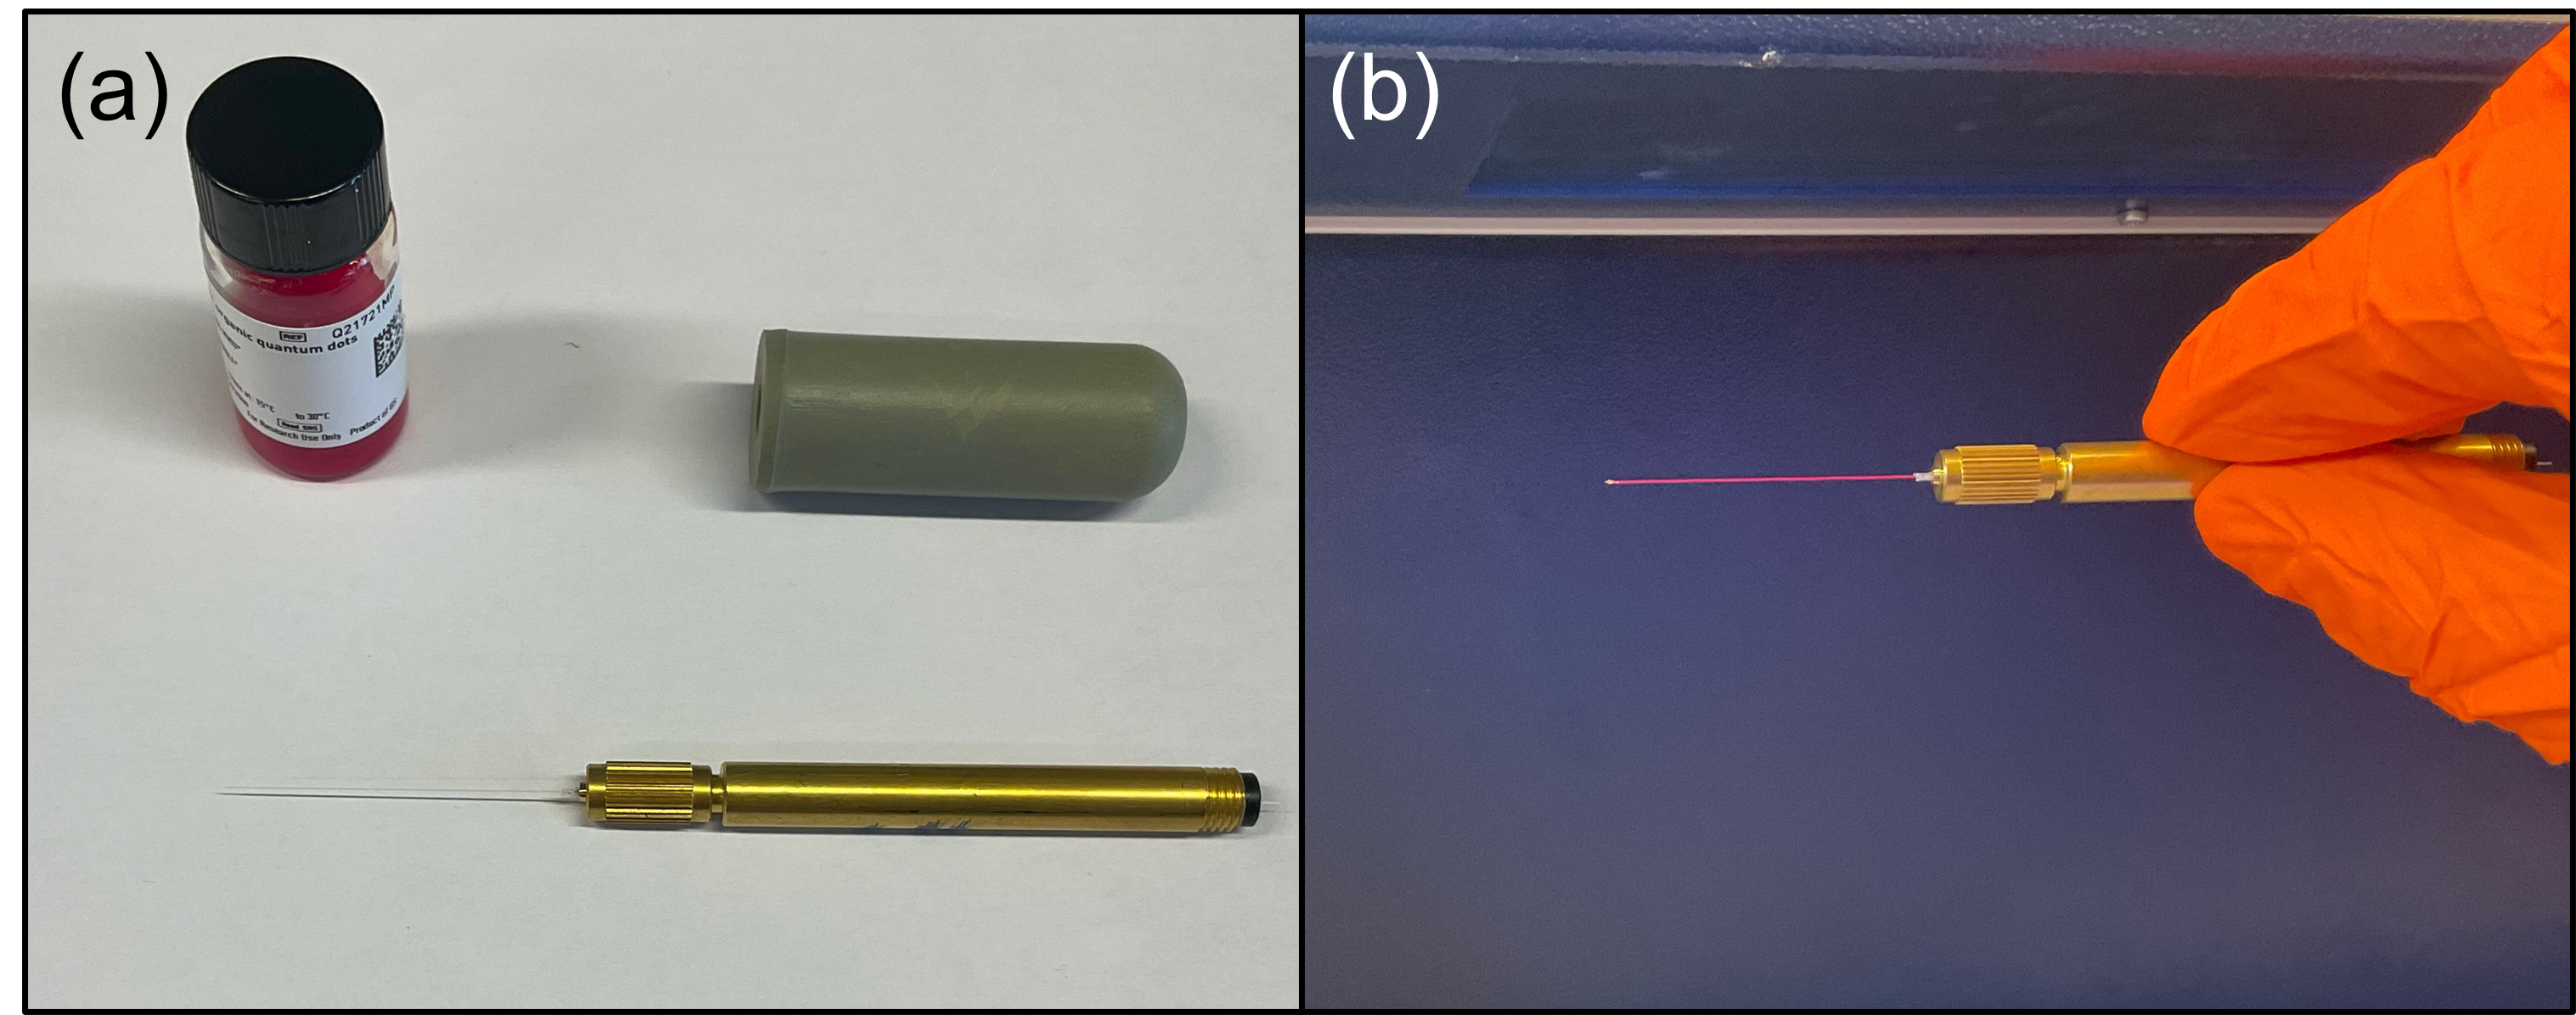
The concept of a probe filled with fluorescent reporters is depicted in Figure 2. To realize such a probe, a cylindrical, quartz capillary with length (CM Scientific, CV1017Q-100), an outer diameter of and an inner diameter of is utilized. A capillary is filled with quantum dots suspended in decane (Thermo Fisher QdotTM 655 ITKTM Organic Quantum Dots). The quantum dots scatter and absorb the incident UV light, and re-emit in the red part of the visible spectrum, with a peak at wavelength, see Figure 16(b). To place the quantum dots inside the capillary, the capillary is placed in a teflon-lined fiber chuck (Newport FPH-J). A rubber stop is attached to the back end of the fiber chuck, and the quantum dots are sucked in the capillary using this assembly, see Figure 16(a). Finally, both ends of the capillary are sealed with super glue, as shown in Figure 16(c). In this work, the capillary-fiber chuck assembly is referred to as the probe.
A.3 Experimental procedures with the probe
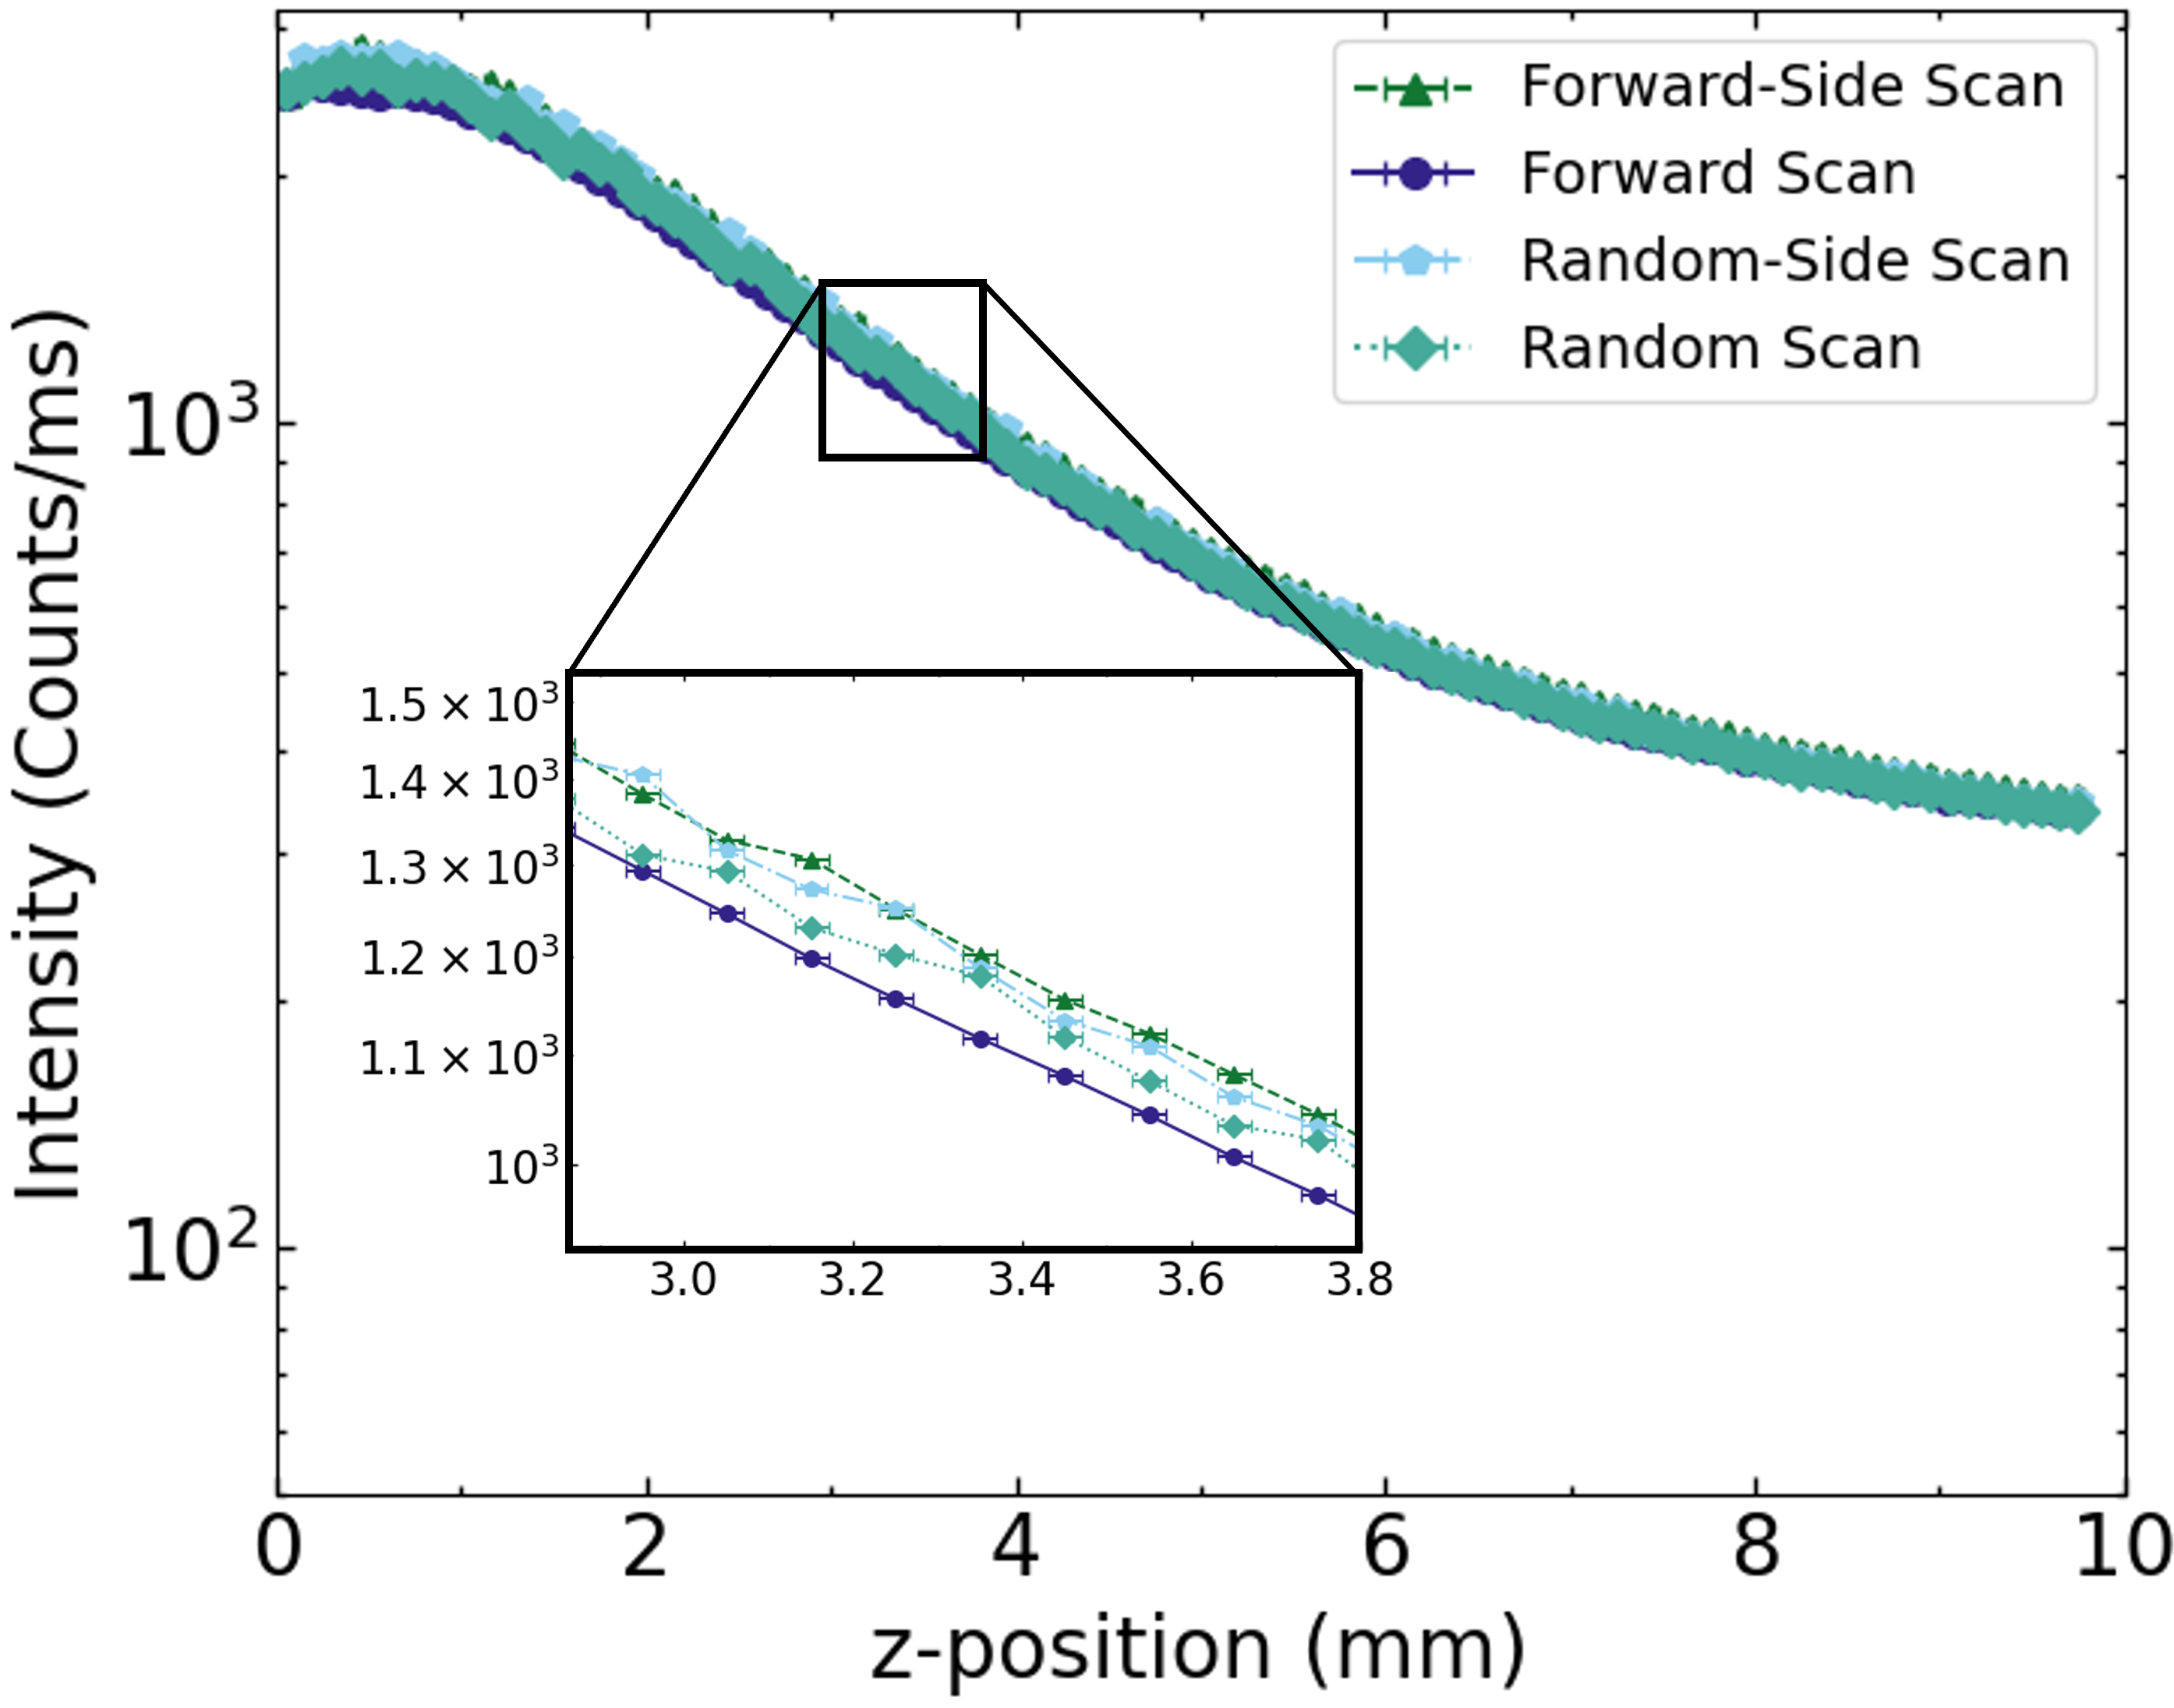
Measurements with the probe along the -direction inside the sample DS1 are shown in Figure 17, including the results from four primary scan directions: forward, forward-side, random, and random-side. To prevent collisions with the sample holder that would damage the fragile probe, the scans start at mm and ends at mm. The forward direction indicates that the sample is scanned from the left boundary to the right boundary , while forward-side refers to scanning the sample in the same direction as forward in , as well as scanning it in the -direction at specific -positions. Random direction refers to scans of the sample along the -direction with the probe randomly positioned during the scan. Finally, random-side indicates that the sample is scanned in the same way as in random direction, but in addition, it is scanned in the -direction at specific -positions, and the -scans are also done with a random positioning of the probe. Figure 17 shows that the scan direction has minimal influence on the outcomes. The minor differences are attributed to slight instabilities of the probe holder, which are discussed further in subsection III.5.
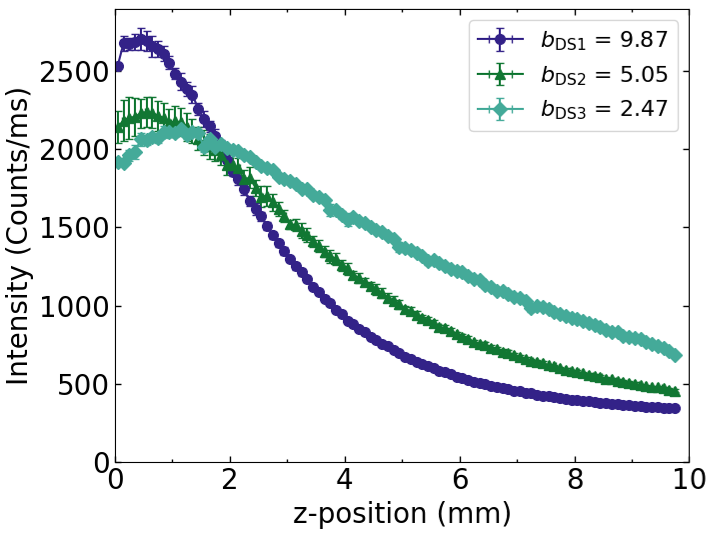
Figure 18 presents the position-dependent intensity in the -direction for samples DS1, DS2, and DS3. The data points in Figure 18 represent an average of four different scan directions, as elaborated in Figure 17. Notably, the optically thicker samples exhibit a higher intensity than the thinner samples, up to a depth of approximately 2 mm inside the sample. This behavior is attributed to the increased number of scatterers in the thicker samples, which scatter the light into the probe more than the less dense samples at the first few millimeters. After depth, the trend reverses and the densest sample has the lowest detected intensity. This trend is expected, as the extinction is higher for thicker samples. However, it should be noted that while the probe scans the -direction entirely in this measurement, it is insufficient to fully characterize the , since a large portion of the -plane is not measured. The models simplify the problem to one dimension by utilizing the symmetries within the slab and averaging over the -plane at each -position [39]. The diameter of our probe is , while the beam size is approximately 1 mm, and the -scans are done when the probe is at the center of the beam in -direction. Consequently, although the probe’s length in the -direction is roughly 40 mm within the sample, the scan presented in Figure 18 predominantly collects the unscattered intensity.
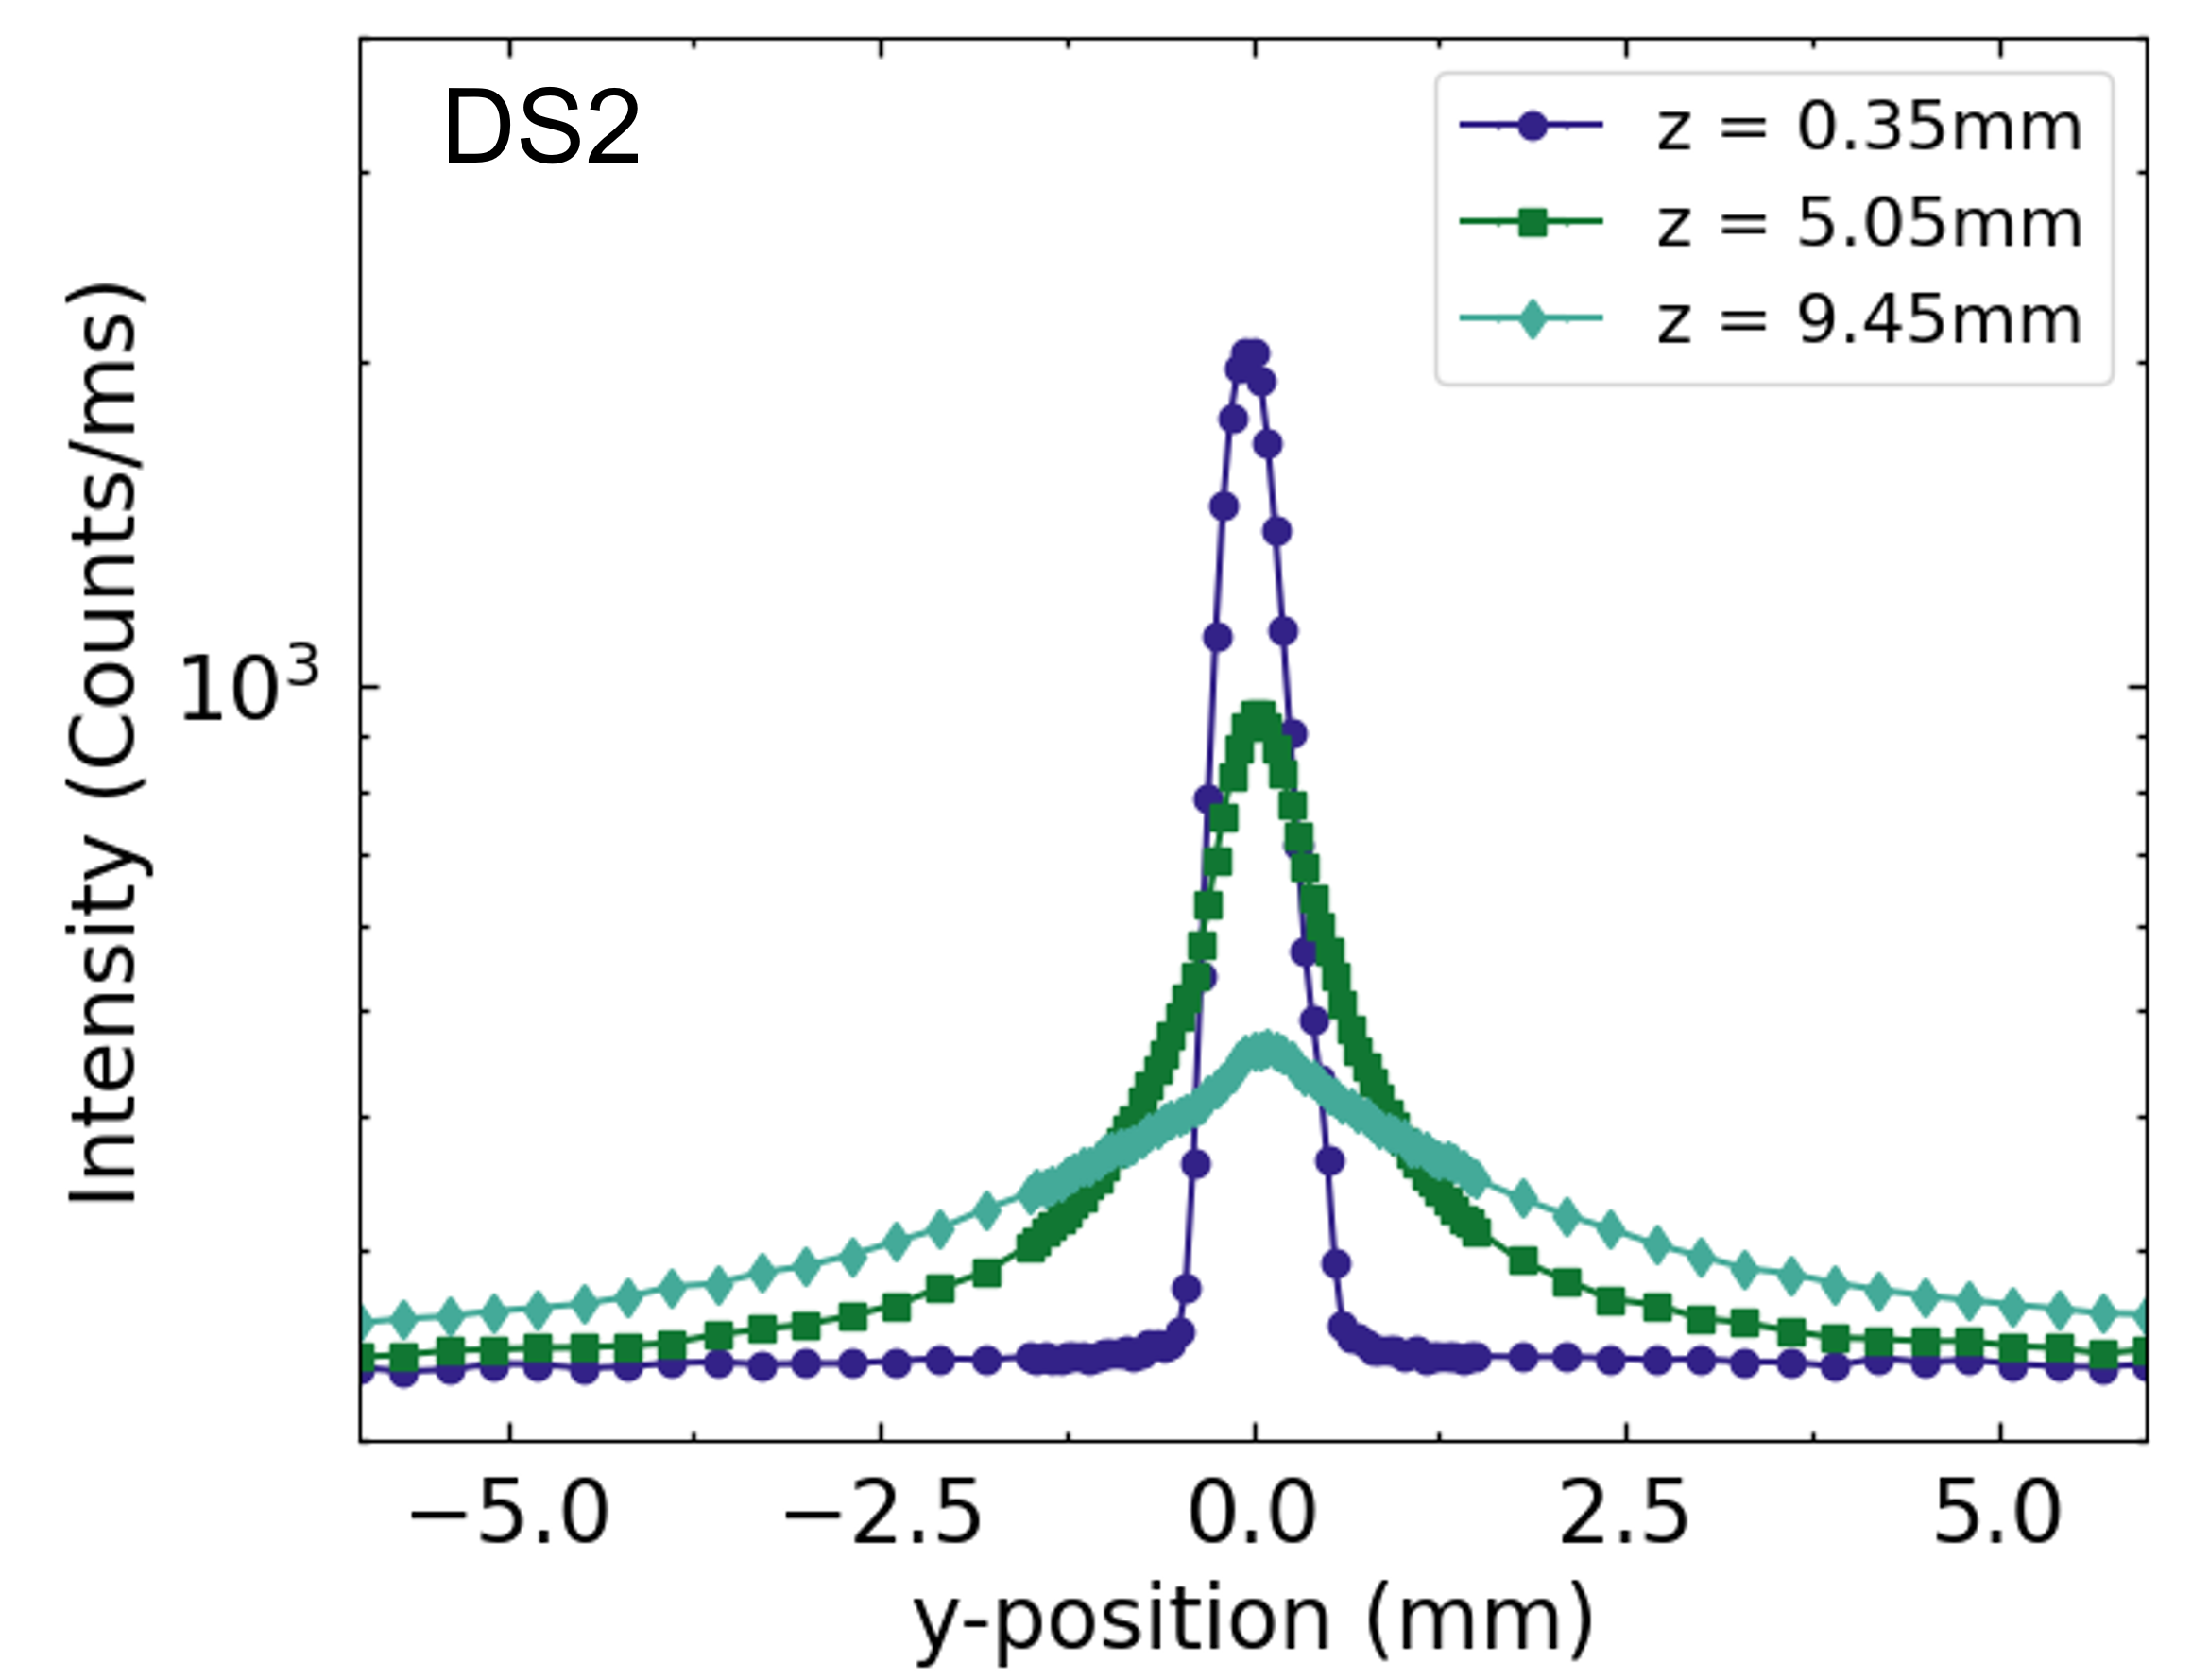
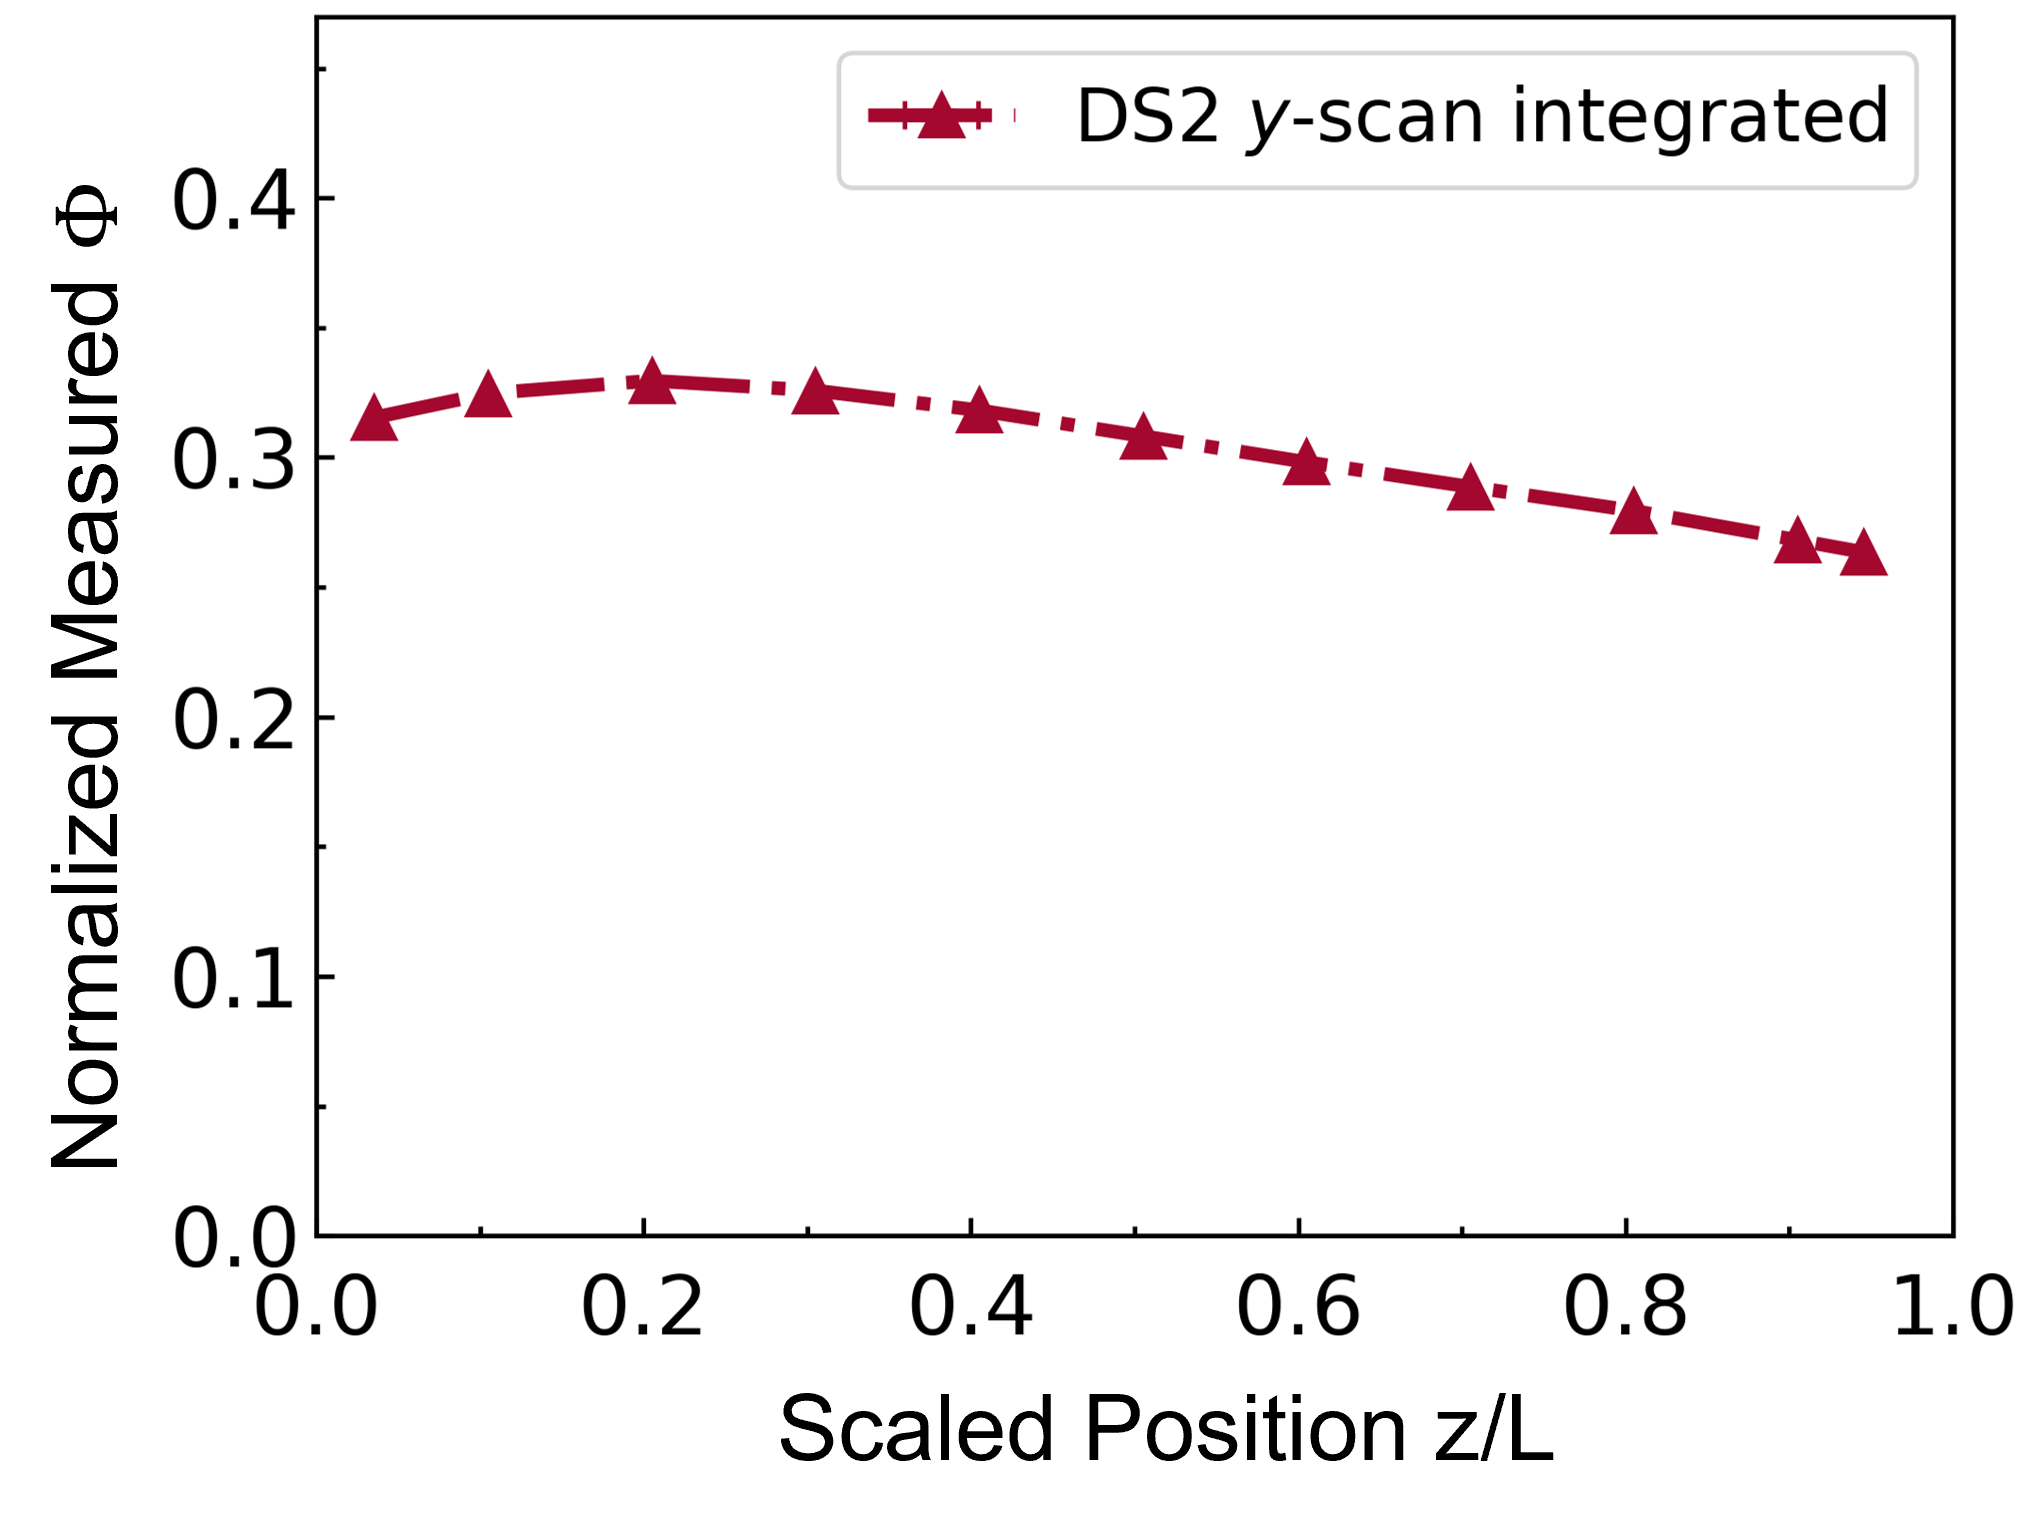
In order to obtain a more comprehensive understanding of , it is necessary to scan samples in the -direction at various positions in . Figure 19 presents three scans at specific -positions. The results show that the energy distribution broadens in the -direction as the light travels deeper in , in agreement with expectations from multiple scattering [54, 55, 56, 57]. All samples are probed in the -direction at numerous -positions, and the resulting curves obtained from these -scans at each -position are integrated to derive a value that represents the total integrated over an -plane. Figure 20 shows the integrated -scans of sample DS2, where the -positions are scaled by the thickness of the sample, and the measured is normalized by the incident intensity. Notably, Figure 20 illustrates the inclusion of diffuse light to the detection, in contrast to the measurements obtained solely from -scans, as shown in Figure 18.
References
- Schubert [2006] E. F. Schubert, Light-Emitting Diodes, 2nd ed. (Cambridge University Press, Cambridge, 2006).
- Krames et al. [2007] M. R. Krames, O. B. Shchekin, R. Mueller-Mach, G. O. Mueller, L. Zhou, G. Harbers, and M. G. Craford, J. Display Technol. 3, 160 (2007).
- Bechtel et al. [2008] H. Bechtel, P. Schmidt, W. Busselt, and B. S. Schreinemacher, in Eighth International Conference on Solid State Lighting, Vol. 7058, edited by I. T. Ferguson, T. Taguchi, I. E. Ashdown, and S. Park, International Society for Optics and Photonics (SPIE, 2008) pp. 64 – 73.
- Akasaki [2015] I. Akasaki, Rev. Mod. Phys. 87, 1119 (2015).
- Amano [2015] H. Amano, Rev. Mod. Phys. 87, 1133 (2015).
- Nakamura [2015] S. Nakamura, Rev. Mod. Phys. 87, 1139 (2015).
- Meretska et al. [2019] M. L. Meretska, G. Vissenberg, A. Lagendijk, W. L. IJzerman, and W. L. Vos, ACS Photon. 6, 3070 (2019).
- Lin et al. [2023] C.-C. Lin, Y.-R. Wu, H.-C. Kuo, M. Wong, S. Denbaars, S. Nakamura, A. Pandey, Z. Mi, P. Tian, K. Ohkawa, D. Iida, T. Wang, Y. Cai, J. Bai, Z. Yang, Y. Qian, S.-T. Wu, J. Han, C. Chen, and Y.-H. Fang, Journal of Physics: Photonics 5, 042502 (2023).
- Nousiainen and Kandler [2015] T. Nousiainen and K. Kandler, “Light scattering by atmospheric mineral dust particles,” in Light Scattering Reviews 9: Light Scattering and Radiative Transfer (Springer Berlin, Heidelberg, 2015) pp. 3–52.
- Funk [1973] C. J. Funk, Appl. Opt. 12, 301 (1973).
- Vos et al. [1986] W. L. Vos, M. Donze, and H. Buiteveld, Communications on Sanitary Engineering and Water Management , 86 (1986).
- Fournier and Forand [1994] G. R. Fournier and J. L. Forand, Ocean Optics XII 2258, 194 (1994).
- Fell and Fischer [2001] F. Fell and J. Fischer, J. Quant. Spectrosc. Radiat. Transfer 69, 351 (2001).
- Stramski et al. [2004] D. Stramski, E. Boss, D. Bogucki, and K. J. Voss, Prog. Oceanogr. 61, 27 (2004).
- McCormick [2006] N. J. McCormick, in Computational Methods in Transport, edited by F. Graziani (Springer Berlin, Heidelberg, 2006) pp. 151–163.
- Salama and Verhoef [2015] M. S. Salama and W. Verhoef, Remote Sens. Environ. 157, 111 (2015), special Issue: Remote Sensing of Inland Waters.
- Star [1989] W. M. Star, in Dosimetry of Laser Radiation in Medicine and Biology, Vol. 10305 (SPIE, 1989) pp. 147 – 155.
- Wilson and Jacques [1990] B. C. Wilson and S. L. Jacques, IEEE J. Quantum Electron. 26, 2186 (1990).
- Cheong et al. [1990] W. F. Cheong, S. A. Prahl, and A. J. Welch, IEEE J. Quantum Electron. 26, 2166 (1990).
- Kienle and Hibst [2006] A. Kienle and R. Hibst, Phys. Rev. Lett. 97, 018104 (2006).
- Prahl et al. [1989] S. A. Prahl, M. Keijzer, S. L. Jacques, and A. J. Welch, in Dosimetry of Laser Radiation in Medicine and Biology, Vol. 10305, edited by G. J. Mueller, D. H. Sliney, and R. F. Potter, International Society for Optics and Photonics (SPIE, 1989) pp. 105 – 114.
- Mujumdar et al. [2010] S. Mujumdar, R. Torre, H. Ramachandran, and D. S. Wiersma, J. Nanophotonics 4, 1 (2010).
- Jacques [2011] S. L. Jacques, “Monte Carlo modeling of light transport in tissue (steady state and time of flight),” in Optical-Thermal Response of Laser-Irradiated Tissue (Springer Netherlands, 2011) pp. 109–144.
- Atif et al. [2011] M. Atif, A. Khan, and M. Ikram, Opt. Spectrosc. 111, 107 (2011).
- Uppu and Mujumdar [2013] R. Uppu and S. Mujumdar, Phys. Rev. A 87, 013822 (2013).
- Leino et al. [2019] A. A. Leino, A. Pulkkinen, and T. Tarvainen, OSA Contin. 2, 957 (2019).
- Jönsson and Berrocal [2020] J. Jönsson and E. Berrocal, Opt. Express 28, 37612 (2020).
- Cooper et al. [2021] M. G. Cooper, L. C. Smith, A. K. Rennermalm, M. Tedesco, R. Muthyala, S. Z. Leidman, S. E. Moustafa, and J. V. Fayne, Cryosphere 15, 1931 (2021).
- Krieger and Wolf [2021] A. Krieger and S. Wolf, Astron. Astrophys. 645, A143 (2021).
- Shonkwiler and Mendivil [2009] R. W. Shonkwiler and F. Mendivil, Explorations in Monte Carlo Methods (Springer, New York, 2009).
- Joseph et al. [1976] J. H. Joseph, W. L. Wiscombe, and J. A. Weinman, J. Atmos. Sci. 33, 2452 (1976).
- Star et al. [1988] W. M. Star, J. P. A. Marijnissen, and M. J. C. van Gemert, Phys. Med. Biol. 33 (1988).
- Keijzer et al. [1988] M. Keijzer, W. M. Star, and P. R. M. Storchi, Appl. Opt. 27, 1820 (1988).
- Dickey et al. [1998] D. Dickey, O. Barajas, K. Brown, J. Tulip, and R. B. Moore, Phys. Med. Biol. 43, 3559 (1998).
- Egger and Schlottbom [2014] H. Egger and M. Schlottbom, Appl. Anal. 93, 1283 (2014), https://doi.org/10.1080/00036811.2013.826798 .
- Liemert and Kienle [2011] A. Liemert and A. Kienle, Phys. Rev. A 83, 015804 (2011).
- Liemert et al. [2021] A. Liemert, S. Geiger, and A. Kienle, J. Opt. Soc. Am. A 38, 405 (2021).
- Ott et al. [2022] F. Ott, D. Reitzle, B. Krüger, A. Liemert, and A. Kienle, J Quant Spectrosc Radiat Transf 277, 107987 (2022).
- Akdemir et al. [2022] O. Akdemir, A. Lagendijk, and W. L. Vos, Phys. Rev. A 105, 033517 (2022).
- Dolgos and Martins [2014] G. Dolgos and J. V. Martins, Opt. Express 22, 21972 (2014).
- Boiger et al. [2022] R. Boiger, R. L. Modini, A. Moallemi, D. Degen, A. Adelmann, and M. Gysel-Beer, J. Aerosol Sci. 163, 105977 (2022).
- Chen et al. [2014] Q. Chen, Q. Chen, S. Liu, and X. Luo, IEEE Trans. Device Mater. 14, 645 (2014).
- Star et al. [1987] W. M. Star, H. P. A. Marijnissen, H. Jansen, M. Keijzer, and M. J. C. van Gemert, Photochem. Photobiol. 46, 619 (1987), https://onlinelibrary.wiley.com/doi/pdf/10.1111/j.1751-1097.1987.tb04822.x .
- Pomerleau-Dalcourt and Lilge [2006] N. Pomerleau-Dalcourt and L. Lilge, Phys. Med. Biol. 51, 1929 (2006).
- Zhu et al. [2018] T. C. Zhu, M. M. Kim, J. Padawer, A. Dimofte, M. Potasek, K. Beeson, and E. Parilov, in Optical Methods for Tumor Treatment and Detection: Mechanisms and Techniques in Photodynamic Therapy XXVII, Vol. 10476, edited by D. H. Kessel and T. Hasan, International Society for Optics and Photonics (SPIE, 2018) p. 104760F.
- FFS [2016] “Freeform scattering optics, initiative by 3 dutch universities,” (2016), https://www.freeformscatteringoptics.com/ [Accessed: (1 December 2020)].
- Li et al. [2016] X. Li, J. M. Zhao, C. C. Wang, and L. H. Liu, Appl. Opt. 55, 8171 (2016).
- Ma et al. [2003] X. Ma, J. Q. Lu, R. S. Brock, K. M. Jacobs, P. Yang, and X.-H. Hu, Phys. Med. Biol. 48, 4165 (2003).
- Henyey and Greenstein [1941] L. G. Henyey and J. L. Greenstein, Astrophys. J. 93, 70 (1941).
- Henderson et al. [2010] E. Henderson, B. Lai, and L. Lilge, in Data Acquisition, edited by M. Vadursi (IntechOpen, Rijeka, 2010) Chap. 14.
- Jacques [1998] S. L. Jacques, Photochem. Photobiol. 67, 23 (1998).
- Ong and Zhu [2016] Y. H. Ong and T. C. Zhu, Opt. Express 24, 26261 (2016).
- [53] 10.5281/zenodo.10534239.
- Koenderink and Vos [2005] A. F. Koenderink and W. L. Vos, J. Opt. Soc. Am. B 22, 1075 (2005).
- Bret [2005] B. Bret, Multiple light scattering in porous gallium phosphide, Ph.D. thesis, University of Twente (2005).
- Akkermans and Montambaux [2007] E. Akkermans and G. Montambaux, Mesoscopic Physics of Electrons and Photons (Cambridge University Press, Cambridge, 2007).
- Carminati and Schotland [2021] R. Carminati and J. C. Schotland, Principles of Scattering and Transport of Light (Cambridge University Press, Cambridge, 2021).