Experimental and theoretical confirmation of an orthorhombic phase transition in niobium at high pressure and temperature
Abstract
Compared to other body-centered cubic (bcc) transition metals Nb has been the subject of fewer compression studies and there are still aspects of its phase diagram which are unclear. Here, we report a combined theoretical and experimental study of Nb under high pressure and temperature. We present the results of static laser-heated diamond anvil cell experiments up to 120 GPa using synchrotron-based fast x-ray diffraction combined with ab initio quantum molecular dynamics simulations. The melting curve of Nb is determined, and evidence for a solid-solid phase transformation in Nb with increasing temperature is found. The high-temperature phase of Nb is orthorhombic Pnma. The bcc-Pnma transition is clearly seen in the experimental data on the Nb principal Hugoniot. The bcc-Pnma coexistence observed in our experiments is explained. Agreement between the measured and calculated melting curves is very good except at 40-60 GPa where three experimental points lie below the theoretical melting curve by 250 K (or 7%); a possible explanation is given.
Introduction
The d-block transition metals are extremely important technological materials. However, their phase diagrams have remained virtually uknown over decades of research. More recently, advances in theoretical 8 ; 9 ; 4 ; 3 ; 10 ; 6 ; 2 ; 5 ; 31 ; Re and experimetal Ni ; KZ ; 14 ; 13 ; 27 ; 16 ; 39 ; 11 ; Re-Boehler ; 15 ; 26 ; 12 ; Mo ; Pt ; V techniques started offering the possibility to gain better understanding of the high-pressure (HP) and high-temperature (HT) behavior of transition metals and to elucidate the fundamental mechanisms responsible for the physical appearance of their HP-HT phase diagrams. Of special interest is HP-HT polymorphism in the bcc transition metals of Groups 4B (Cr, Mo, W) and 5B (V, Nb, Ta) which is related to laser-heated diamond anvil cell (DAC) melting experiments bringing up a small slope of the corresponding melting curves in the pressure-temperature - coordinates in the megabar range Ni ; KZ ; 14 ; 13 ; 27 ; 16 ; 39 ; Re-Boehler . These flat melting curves contradict the results of both more recent experiments 11 ; 15 ; 26 ; 12 ; Mo ; Pt ; V and calculations 9 ; 3 ; 6 ; 5 ; 31 ; Re . This apparent controversy has caused several hypotheses to be proposed. In particular, the flat melting curves could in fact correspond to solid-solid phase transition boundaries at HP-HT below melting. Such HP-HT solid-solid phase transitions have been predicted for Ta 4 ; 10 ; 31 , Mo 8 and Re Re . In contrast to other metals, only few studies on Nb have been reported in the literature. The initial () slope of the Nb melting curve is known from isobaric expansion measurements 20 , although the melting curve itself has not been measured. Shock-wave (SW) experiments have been carried out for Nb up to 124 GPa, with the bcc phase being the only phase observed along the Hugoniot 21 . Here, in order to advance our knowledge of the phase diagrams of transition metals, we report ab initio calculations on the Nb phase diagram to 450 GPa and X-ray diffraction (XRD) experiments on Nb to 120 GPa and 6000 K.
RESULTS
Experimental
XRD measurements reported here are from seven runs carried out on fresh samples to avoid the influence of possible chemical reactions on the results. They were performed at beamline ID27 of the European Synchrotron Radiation Facility (ESRF). See Methods section for both experimental and computational details.
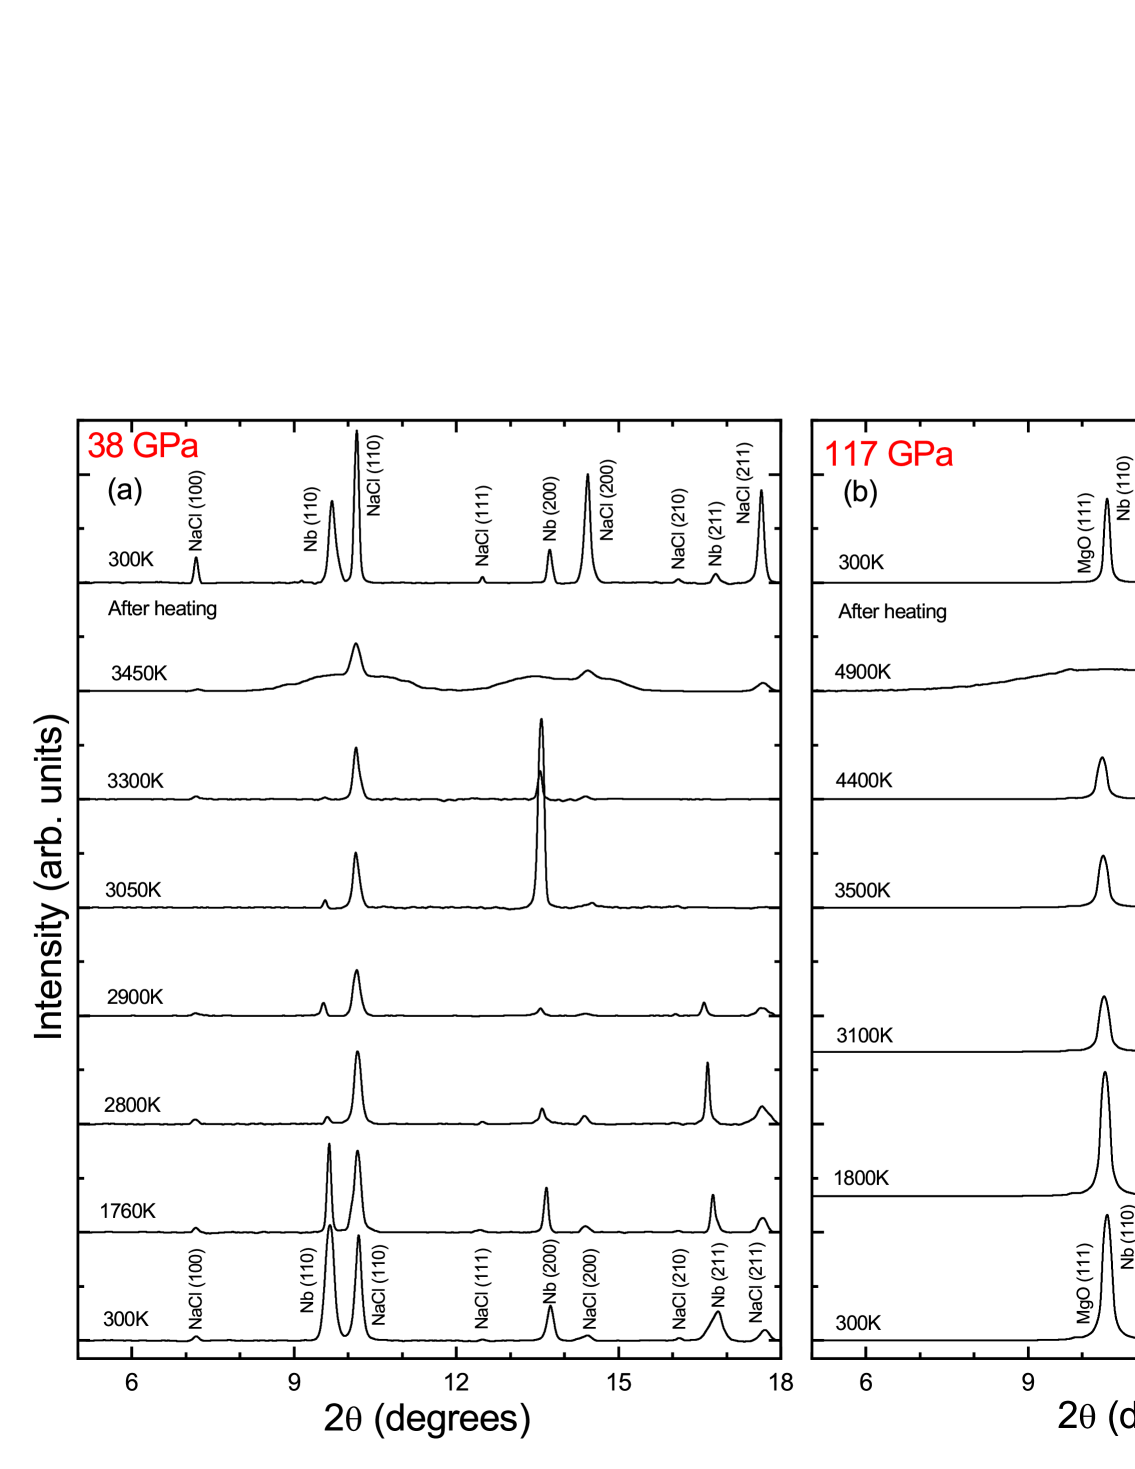
Fig. 1 shows a selection of XRD patterns collected at 38 and 117 GPa at different s. They were obtained after integration of the charge-coupled device (CCD) images as a function of At 38 GPa NaCl was the pressure medium and at 117 GPa it was MgO. A normalized reference background has been subtracted from them. In order to do so, we used a measurement of the scattering from the DAC probing at a point of the pressure chamber where the sample was not present 34 . At 38 GPa, as increases, the peaks slightly move to lower angles due to thermal expansion. We do not observe any other change in the XRD patterns up to 2800 K. In particular, only the bcc phase of Nb and the B2 phase of NaCl are present. Bragg peaks of NaCl are detected even when the of the sample exceeds the melting of NaCl 35 . This occurs because the NaCl in contact with the diamond anvils is at a lower than the sample, due to the high thermal conductivity of diamond. Thus, when the surface of Nb reaches of NaCl, the latter is probably only partially molten, in the region where it is in contact with Nb. At 2800 K a typical powder diffraction pattern starts changing into a single-crystal-like one. Above that , we observe rapid changes in the relative intensities of the Bragg peaks in consecutive diffraction patterns which are due to the recrystallization of the sample. This phenomenon has also been observed in other metals under HP conditions at several hundred degrees below 26 ; 12 ; Mo ; Pt ; V . It is probably caused by an increase in the grain size in polycrystalline material at HT. After this microstructural change, permanent reorientation of the crystal occurs, which causes changes in the relative intensities of the Bragg peaks (see Fig. 1(a)). This phenomenon is usually described in the literature as fast recrystallization (FR), and we will use this terminology in what follows. We note that in the case of Nb, an alternative (qualitative) description of this phenomenon can be given in terms of a transition to a virtual solid phase which becomes energetically competitive with bcc-Nb at the experimental - conditions; see Results section for more detail. As a consequence, single-crystal spots appear and disappear randomly in subsequent XRD exposures. We observe similar behavior at 117 GPa. In this case of MgO is higher than the maximum in the experiment 36 , and therefore MgO remains in the solid B1 phase. In this experiment, the FR of Nb is observed at higher than 3400 K. The recrystallization described above has been observed at the seven s at which we carried out experiments at several hundreds of degrees lower than the where the Bragg peaks of Nb disappear (probably due to melting, as discussed below).
At 38 GPa, upon further heating to 3450 K we observe the disappearance of the Bragg peaks of Nb and the appearance of diffuse rings. At 117 GPa the same effect is detected at 4900 K. Such phenomena have previously been attributed to a signature of the onset of melting 37 . However, this observation alone could lead to an overestimation of Mo ; Pt . Likewise, the plateau, another signature of melting, may correspond to higher than the actual which is the case for titanium, as discussed below. Therefore, the experimental s reported here, although definitely in the neighborhood of the actual melting curve of Nb, should only be considered approximate s.
The diffuse rings at 3450 K are seen in Fig. 1 as two broad bands centered at and Qualitatively similar behavior has been observed in all the experimental runs. In the experiment carried out at 117 GPa, the emergence of the diffuse scattering and the disappearance of bcc-Nb Bragg peaks is detected at 4900 K. In this case, the bump centered at is broader than that at 38 GPa and more intense than the second bump. This qualitative difference in the diffuse scattering can be due to the fact that at 38 GPa NaCl may be also partially molten, as described above. Following the literature 12 ; 13 ; 16 ; 26 ; 27 , we assume that the at which the phenomenon described above occurs corresponds to of Nb. However, it should be noted that the detection of melting by XRD at high is not straightforward because the intensity of the diffuse scattering from the liquid is relatively low. In addition, the rapid change in the laser absorption by the sample during melting hinders the determination of Another cause of uncertainty may be an imperfect alignment of the x-ray beam and the hotspot during the whole heating cycle, although we tried to maintain this alignment to the best of our ability.
Another important issue in the experiments is the possible occurrence of chemical reactions between the sample and the pressure medium or the sample with carbon that diffuses out of the diamond anvils. Usually, chemical reactions lead to a runaway heating 38 which was not observed in our experiments. In addition, after each heating cycle, samples were optically inspected to check that there were no obvious signs of chemical reactions or oxidation on Nb surfaces. The only changes we visually detect on the sample surface after heating are textural changes and, in four of the seven runs, the formation of holes. A reasonable explanation is that the textures are a consequence of solidification upon quenching , and that the holes are formed during melting 39 . On the other hand, chemical reactions usually lead to the appearance of additional Bragg peaks (e.g., the formation of tantalum carbide in DAC experiments on Ta 11 ) that can be detected in the XRD patterns measured after reducing to room temperature (RT), which is not the case within the signal-noise ratio in our experiments. This and the rest of the observations summarized above suggest that no chemical reaction took place during the experiments. In any event, even if a chemical reaction occurred, its products would be undetectable by the current XRD methods and thus should not influence the reported results; a similar statement is also made in a paper on Ta 11 . In two recovered samples we performed energy-dispersive X-ray analysis on a scanning electron microscope (Phillips XL-30) which allows the detection of light elements, and we did not find any detectable traces of either O or C (they can be detected in quantities as low as 1.0 wt%). Other techniques sensitive to the presence of C, such as Raman spectroscopy, were not used to check for C contamination. However, as discussed above, we do have enough evidence to exclude the formation of a sizable amount of either Nb oxides or carbides. This conclusion is consistent with the fact that in XRD patterns we cannot identify Bragg peaks coming from any of the known Nb oxides or carbides 40 ; 41 .
Solid-solid and solid-liquid transitions can be identified by the presence of a plateau in the sample when it is measured as a function of the increased laser heating power 11 ; 16 . However, it has been recently proposed that other phenomena can also cause plateaus plateaus . In our case, we observe such features at two s. One, when the sample reaches the onset of the recrystallization process described above, and the other, when the Nb Bragg peaks disappear. Fig. 2 shows the temporal evolution of the sample measured at 50 GPa. Note that the applied laser power increases linearly with time in our working regime. Two marked plateaus can be clearly identified in the figure, one at 2900 K, which starts simultaneously with the onset of recrystallization, and the other at 3650 K, which occurs after the disappearance of the Nb Bragg peaks that we associate with melting. Then, just like for both V V and MgO MgO , the plateaus observed in our experiments on Nb can be correlated with phase transitions.
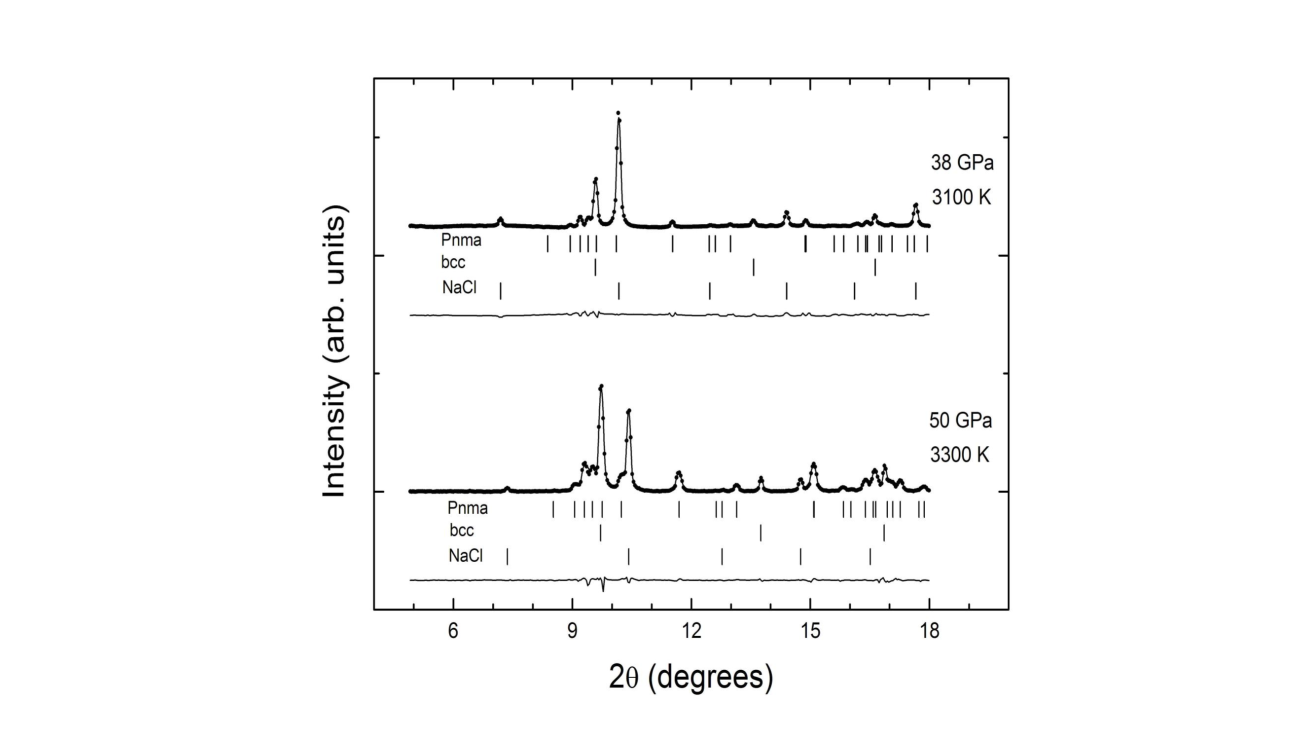
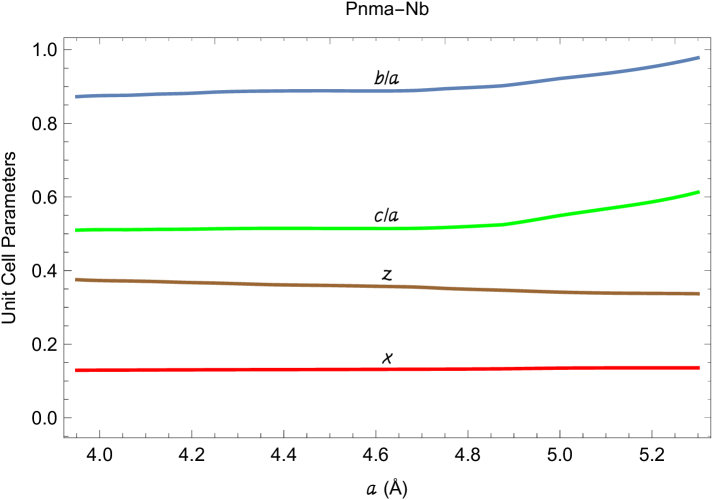
It is important to note here that at the five different s in our experiments up to 50 GPa at below but -300 K above the recrystallization we observe the appearance of extra XRD peaks. After their first appearance, the new peaks are randomly observed as increases to These new peaks are seen in some XRD patterns; other XRD patterns only exhibit the peaks that are associated with bcc-Nb. For instance, Fig. 1 does not show any of the Pnma-Nb peaks above the corresponding bcc-Pnma transition T. This minimizes the possibility of a chemical reaction (which has already been ruled out based on the above considerations), which would otherwise lead to the appearance of new permanent peaks. A notable fact is that the extra Bragg peaks are found in the heating cycle only after s higher than those of the first plateau are reached. Fig. 3 shows XRD patterns which exhibit this phenomenon. In both patterns, measured at (38 GPa, 3100 K) and (50 GPa, 3300 K), the extra peaks can be clearly identified. A possible explanation for this result is the existence of a stable or metastable HP-HT phase of Nb, similar to those proposed recently for both Mo 8 and Ta 2 ; 4 ; 31 . We made an attempt to index the XRD patterns where extra peaks are present, but we could not succeed assuming an extra solid phase of Nb, in addition to B2-NaCl, to be one of those that have been mentioned in the literature in connection with transition metals (from the previous section). However, ab initio quantum molecular dynamics (QMD) simulations helped us understand these XRD patterns. As we discuss in more detail below, in Nb at HP-HT ab initio calculations predict the existence of an orthorhombic structure that becomes thermodynamically more stable than bcc with increasing This orthorhombic structure found in Nb is similar to that found in Ta 2 ; 31 . It belongs to space group Pnma and has four atoms per cell (bcc has two). In this structure Nb atoms are located at Wyckoff’s 4c sites, and where and (and and see Fig. 4), according to calculations. By considering the structure determined theoretically, we were able to index all the extra peaks. According to the indexation (we assumed that and in either case), the unit-cell parameters of the Pnma structure at 38 GPa and 3100 K are Å, Å, and Å. At 50 GPa and 3300 K, the corresponding parameters are Å, Å, and Å. Additionally, we have been able to make decent Rietveld refinements of the XRD patterns shown in Fig. 3 by assuming the coexistence of the bcc and orthorhombic phases of Nb and considering also the presence of B2-NaCl. The residuals of the refinement are shown in Fig. 3. The small residuals of the refinement suggest that the coexistence of two HP-HT phases in Nb is a plausible explanation for our observations. The -factors obtained from the refinement of the XRD pattern measured at 38 GPa and 3100 K are % and %. Similar reliability of the fit parameters is achieved at 50 GPa and 3300 K. We note here that we found the same evidence for the possible existence of an orthorhombic HP-HT phase in Nb in the five experiments performed up to 50 GPa independent of the pressure medium used in these five experiments (NaCl or KBr; other pressure media Al2O3 and MgO were used at higher ) which also reduces the possibility that the extra peaks found in these experiments are due to a chemical reaction between the Nb sample and the pressure medium. Unfortunately, the rapid recrystallization of the sample makes it impossible to detect a pure orthorhombic phase in our experiments. As a consequence, we could not determine the exact locus of the corresponding solid-solid phase boundary. We note that when the sample is cooled down to RT, its quenched XRD patterns do not exhibit any peaks or any amorphous bands that can be associated with the orthorhombic structure. Therefore, the proposed bcc-Pnma solid-solid phase transition is reversible.
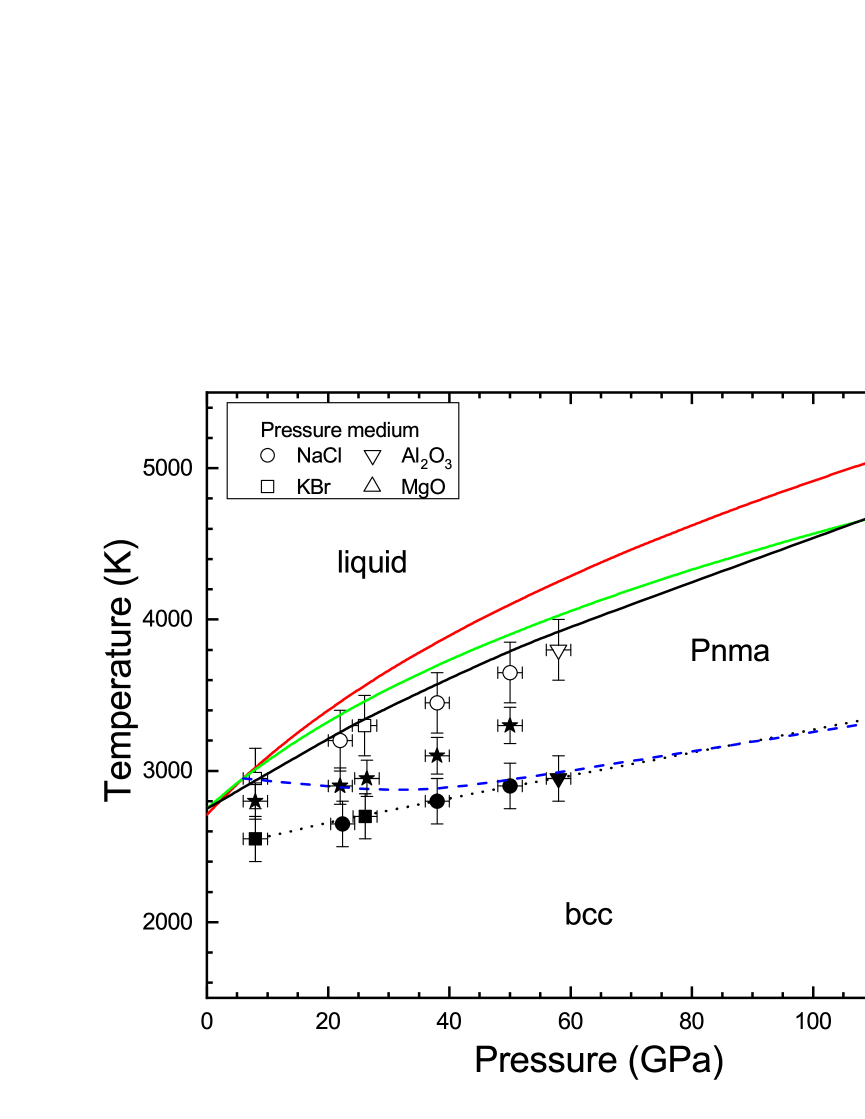
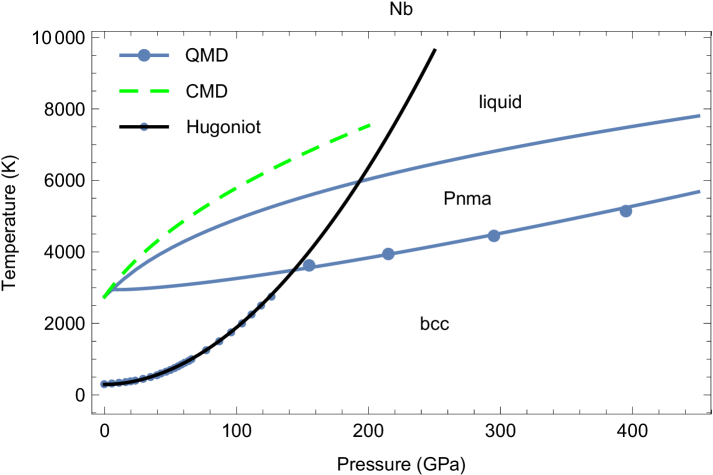
The unit-cell volume determined for the orthorhombic structure at 38 GPa (15.705 Å3 atom-1) is % smaller than that of bcc-Nb at the same (15.852 Å3 atom-1). This small volume change at the bcc-Pnma transition suggests that the corresponding solid-solid phase boundary is rather flat, in view of the Clausius-Clapeyron (CC) formula and should be similar to the flat melting curves in the former DAC experiments 14 ; 13 ; 16 ; 39 . Indeed, as seen in Figs. 5,6, the bcc-Pnma transition boundary is almost flat up to GPa and starts increasing slowly at higher At 50 GPa, the unit-cell volume determined for Pnma-Nb (15.188 Å3 atom-1) is almost identical to that of bcc-Nb [15.186 Å3 atom-1; Å].
The calculated positions of the peaks assigned to Pnma-Nb and bcc-Nb are indicated by the corresponding vertical ticks in Fig. 3 (where the positions of Bragg NaCl peaks are also shown). Note that one of them overlaps with the most intense peak of bcc-Nb, and another one with the most intense peak of NaCl. On the other hand, we have not observed any diffraction pattern with the Pnma-Nb peaks alone. There were always peaks of the bcc phase overlapping with those of the orthorhombic phase, which indicates that the two phases effectively coexist. Such coexistence can be caused by either a FR or radial gradients, or both. Here a FR means a continuous transformation of one solid phase to another, which is described in more detail below. Radial gradients are always present in a laser-heated DAC; in our experiments they were minimized but could not be completely eliminated, hence the surface of the sample can be -300 K hotter than its bulk, in which case XRD picks up a combined signal from the two coexisting solid phases belonging to different sections of the sample that have different s. In Fig. 5 we summarize the results obtained in the seven experimental runs. It can be seen that the difference between the onset of recrystallization and melting increases with which could be interpreted as the scaling of the of recrystallization with the of melting. We also indicate the five - points (black stars) where the orthorhombic Pnma structure of Nb is detected.
Theoretical
Ab initio melting curve of Nb
For the calculation of the melting curve of bcc-Nb a 432-atom () supercell with a single -point is used. Full energy convergence (to meV atom-1) is checked for each simulation. The six bcc-Nb melting points are listed in Table 1. For each of them, ten NVE (fixed total number of atoms N, system volume V, and total energy E; V corresponds to one of the six densities from Table 1) runs of 10000-15000 time steps of 1.5 fs each, with an increment of the initial of 62.5 K are carried out. Such a small increment is chosen to ensure the high accuracy of the results, since the error in is half of the increment of the initial Os . Thus, the errors of our six values of are K, which is 1.25% for the first point and less than 1% for the remaining five. The errors are also negligibly small: GPa for the first point, and 1-2 GPa for the remaining five. Hence, our melting results on bcc-Nb are highly accurate indeed.
Fitting the Simon-Glatzel (SG) form 42 to the six bcc-Nb points gives the melting curve of bcc-Nb ( in K, in GPa),
| (1) |
the initial slope of which, K/GPa at is in excellent agreement with 36 K/GPa from isobaric expansion measurements 20 . Another theoretical value for this slope, 37.7 K/GPa 43-1 ; 43-2 , is only slightly higher. Note that the initial from classical MD simulations is K/GPa using the embedded-atom method 44 , or K/GPa using the Mie-Lennard-Jones pairwise interatomic potential Nb-Tm .
According to our cold free energy (i.e., enthalpy) calculations, the structures that are closest to bcc energetically are A15 (-W) and three orthorhombic structures described with space groups Pnma (No 62), Cmcm (No 63), and Cmca (No 64). At low all four are less stable than bcc-Nb by eV atom-1, although A15 is nominally the closest one to bcc. For comparison, the hexagonal close-packed (hcp)-bcc and face-centered cubic (fcc)-bcc values are and 0.35 eV atom-1, respectively. For each solid structure, the difference of its enthalpy and that of bcc increases with For example, for Pnma-Nb (in eV atom-1) The above four structures closest to bcc were among those for which we simulated melting curves. It turns out that there is only one solid structure the melting curve of which crosses that of bcc-Nb at below 100 GPa, which is therefore relevant to our experimental work. This structure is Pnma. The melting curves of the other two orthorhombic structures may become relevant at above 100 GPa, although additional more careful study may be required to clarify this point. As a matter of fact, the melting curve of bcc-Nb is the highest among those of all the solid structures that we considered, including A15.
The melting curve of Pnma-Nb is calculated exactly the same way as that of bcc-Nb, namely, 10 runs per point, 10000-15000 time steps of 1.5 fs each per run, and an increment of the initial of 62.5 K. In this case, a 448-atom () supercell with a single -point is used, and again, full energy convergence (to meV atom-1) is checked for each simulation. The six melting points of Pnma-Nb are listed in Table 2.
The melting curve of Pnma-Nb is described by the SG form (again, in K and in GPa)
| (2) |
It crosses the melting curve of bcc-Nb, Eq. (1), at the predicted bcc-Pnma-liquid triple point (5.9 GPa, 2949 K).
Supplementary Figures 1,2, and 3,4 demonstrate the time evolution of and in the -method runs of the bcc-Nb melting point and the Pnma-Nb melting point respectively. These two points are chosen as examples and are shown as green and red diamonds in Fig. 5.
bcc-Pnma solid-solid phase transition boundary
We have also obtained the bcc-Pnma solid-solid phase transition boundary from the calculation of the total free energies of both structures using TDEP at four different s.
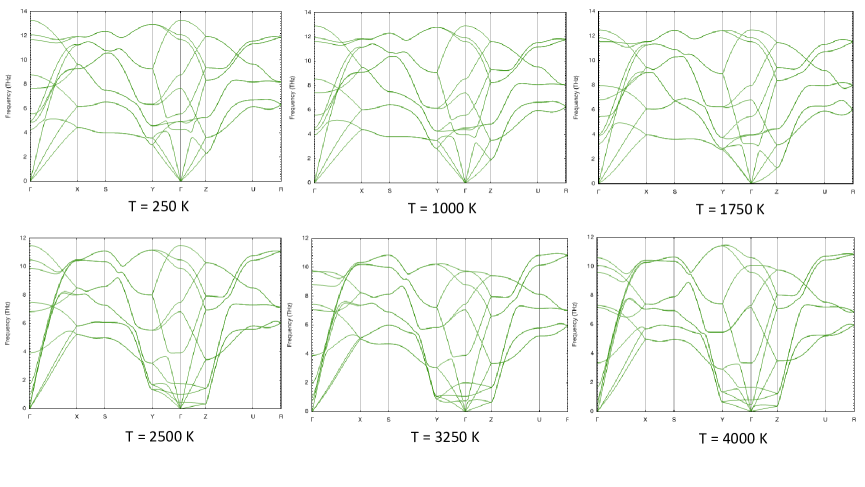
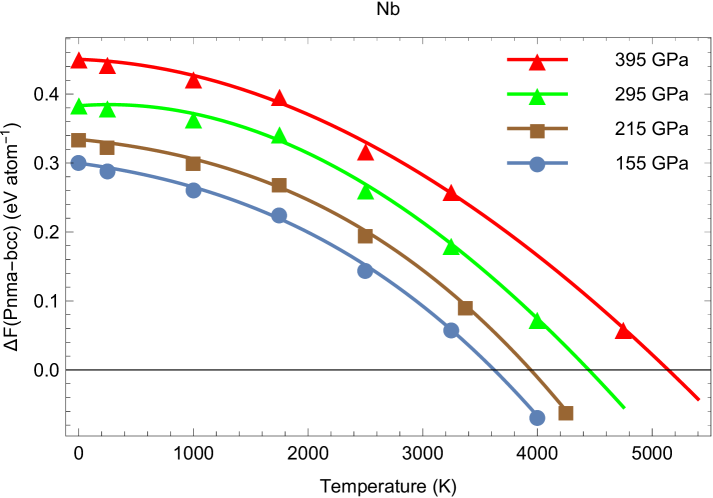
In Fig. 7 we show the phonon spectra of Pnma-Nb at six different s (from very low to slightly above at a density of 9.95 g cm-3). It is seen that all the structures are mechanically stable (no imaginary phonon branches), and the -dependence of their phonon spectra is very weak. We found that Pnma-Nb is mechanically stable at all Hence, its total free energy can be calculated and compared to that of bcc-Nb. Fig. 8 shows the Pnma-bcc total free energy difference, as a function of at four different s. The four starting points lie on the curve that describes the Pnma-bcc enthalpy difference from the previous subsection. At each it is fitted with a cubic polynomial having a positive root that defines the corresponding bcc-Pnma transition point. The four transition points, and define the Pnma-bcc solid-solid phase transition boundary. In what follows, we take the triple point to be and the bcc-Pnma phase boundary is
| (3) |
which interpolates between the low- experimental data and high- theoretical data better than the quadratic fit. The four theoretical bcc-Pnma transition points and the phase boundary are shown in Fig. 6.
Nb Principal Hugoniot
In order to get another confirmation of the existence and the location of the bcc-Pnma solid-solid phase transition boundary derived theoretically in this work, we now turn to the experimental results on the principal Hugoniot of Nb.
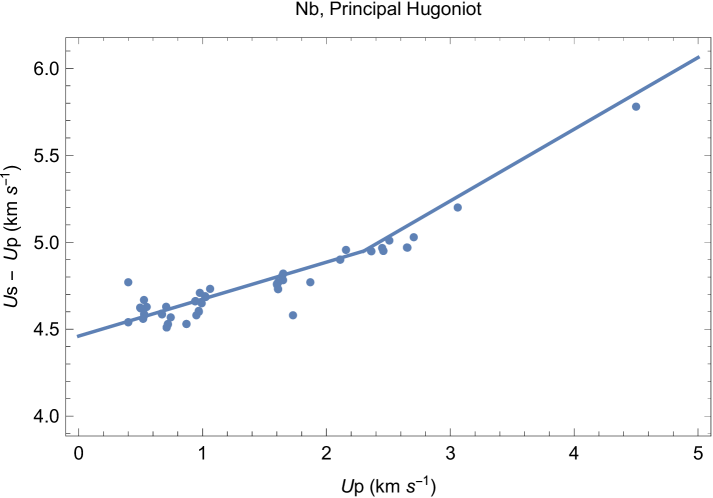
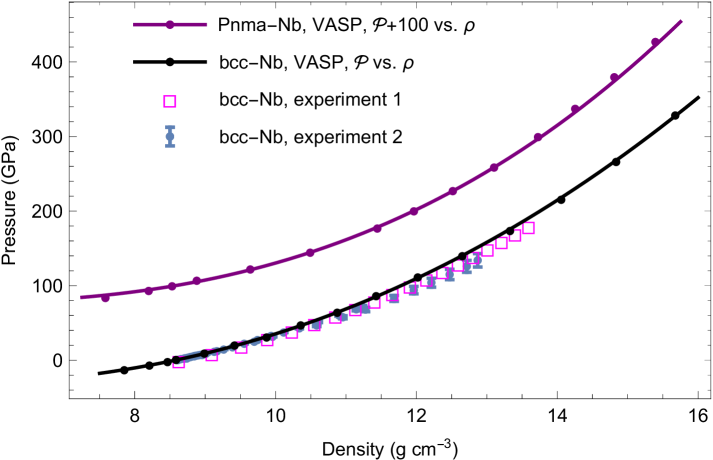
If the bcc-Pnma phase boundary shown in Fig. 6 is correct then the Hugoniot crosses it. The Nb principal Hugoniot that we calculated theoretically, crosses the bcc-Pnma transition boundary given by Eq. (3) at 143.4 GPa. In this case, assuming that the bcc and Pnma portions of the Nb Hugoniot are described by straight segments the piecewise linear function describing the experimental data has a breakpoint at GPa. Fig. 9 shows vs. instead of vs. the data come from the Russian Shock Wave Database RSWD . We have chosen instead of to illustrate a change in compressibility, since on the Hugoniot JD . Each of the straight segments are of the form where and ; and are the adiabatic bulk modulus and its first pressure derivative JD , both of which come from the corresponding EOS. The value of the ambient density, is within a few percent of that of at which we also denote as below. We have calculated the equations of state of both bcc-Nb and Pnma-Nb which are shown in Fig. 10. Their third-order Birch-Murnaghan forms are
where and in g cm-3 and in GPa)
In each of the two cases, this EOS is expected to be reliable to GPa. Note that our value of for bcc-Nb is identical to the Nb experimental ambient density. Our set of for bcc-Nb is consistent with similar sets that can be found in the literature: Kinslow , KMF , 23 , Zou (the average of the four sets is
We also note that the finite- counterparts of the above two EOSs can be written approximately as where and For example, for the two experimental unit cell volumes of Pnma-Nb that correspond to 38 and 50 GPa mentioned above, 15.705 Å3 atom-1 and 15.188 Å3 atom-1 (the corresponding densities are 9.823 and 10.16 g cm-3), the Pnma-Nb finite- EOS with the corresponding set of gives GPa and GPa, in good agreement with 38 and 50, respectively.
With the above values of and the two straight segments shown in Fig. 9 are (bcc) and (Pnma). Agreement between the experimental data and the two segments is excellent. The segments cross each other at km s According to the Nb data of RSWD , along the Nb Hugoniot hence, at the transition point GPa, in excellent agreement with the value 143.4 GPa found above. Thus, the bcc-Pnma Hugoniot transition point is at GPa. Melting on the Hugoniot occurs at GPa ( km s-1), where the Hugoniot crosses the Pnma-Nb melting curve, as seen in Fig. 6. Hence, at the two highest data points in Fig. 9 the Nb is a liquid. These points lie slightly below the straight segment most likely because the bulk modulus of a liquid is slightly smaller than that of a solid.
We note that a solid-solid transition on the Nb Hugoniot was also detected in classical molecular dynamics simulations by Germann Germann . He found a transition from bcc to another solid phase at km s rather close to the 2.3 km s-1 found here. However, he associated the high- phase with hcp rather than Pnma. This was done based on the radial distribution function (RDF) of the simulated structure emerging above the transition after shocking in the [110] direction. This RDF is noisy and cannot be relied upon to identify the high- phase.
The phenomenon of fast recrystallization
The mechanism of fast recrystallization observed in our experiments on Nb can be qualitatively characterized using the approach that we developed to describe a fcc-14H solid-solid phase transition experimentally observed in iridium Ir .
The nonhydrostaticity that is always present in a DAC Ir results in an effective increase of the total free energy of the sample by the amount where is volume, and are the bulk and shear moduli, respectively, and is the nonhydrostatic stress. The use of the -dependent and Nb-thermo , as well as from Nb-sigma1 ; Nb-sigma2 , in the above expression leads to (in eV atom-1), up to the quadratic terms in and )
When the Pnma-bcc total free energy deficit is compensated by an increase in of a bcc-Pnma transition starts. The family of quasi-parallel curves in Fig. 8, and the expression for the bcc-Pnma enthalpy difference from above render the following formula for the Pnma-bcc difference
Equating this to yields the bcc-Pnma transition as a function of under nonhydrostatic stress,
which is very accurately approximated by up to GPa, in excellent agreement with the dashed line of FR in Fig. 5. This formulation is valid up to GPa; at higher flattens out Nb-sigma1 ; Nb-sigma2 , so that and which means that the line of fast resrystallization gets very close to the bcc-Pnma thermodynamic transition boundary (TTB), again in excellent agreement with experiment.
The above arguments strongly suggest the following mechanism of fast recrystallization. Under nonhydrostatic stress in a DAC, bcc-Nb becomes thermodynamically unstable and converts to Pnma-Nb, which results in the release of nonhydrostatic stress. This happens below TTB at GPa and very close to TTB at higher ; see Fig. 5. But since Pnma is thermodynamically less stable than bcc-Nb at these - conditions, it reverts back to bcc, which again converts to Pnma, and so on. A similar mechanism can drive FR above TTB which shows up as the bcc-Pnma coexistence. Indeed, as increases and the bcc-Pnma transition point is approached and eventually reached, bcc-Nb becomes thermodynamically unstable and converts into Pnma-Nb. Then, under nonhydrostatic stress, the total free energy advantage of Pnma over bcc is reversed, by the same mechanism that reverses the total free energy advantage of bcc over Pnma below TTB discussed above, so that Pnma converts to bcc, which reverts back to Pnma, and so on.
The difference between the two cases of FR considered above, namely, below and above TTB, is that bcc-Pnma coexistence is only observed in the latter case but not in the former. The lowest- Pnma data point in Fig. 5 (a star at K) is the only Pnma data point that may seem to contradict the above statement. We note, however, that taking into account the corresponding error bar of -250 K may place this data point above the bcc-Pnma-liquid triple point, and therefore above TTB. The remaining four Pnma data points are very clearly on or above TTB.
There may be a number of reasons for this to happen. First, although the nonhydrostaticity-based model for FR considered above predicts the - location of the FR line below TTB correctly, a texture transition in bcc-Nb may be mainly (or solely) responsible for this FR, so that the corresponding XRD patterns exhibit the bcc phase only. Second, the appearance of Pnma may be suppressed for kinetic reasons, and it may be observed above TTB, as mentioned above, only because the surface of the sample is -300 K hotter than its bulk, so that XRD picks up a combined signal from the two coexisting solid phases belonging to different sections of the sample that have different s. In any event, the duration of the FR Pnma cycle is expected to be larger for FR above TTB than that for FR below TTB. Indeed, this duration directly depends on the kinetic factor , and changes its sign across TTB. For instance, with values of eV atom-1 and K (so that corresponds to eV atom-1) that are typical of Nb, but a factor of two. This may be crucial for the observation of Pnma above TTB. There may be other reasons, too, which we do not mention here. It would be interesting to test the idea that a texture transition observed earlier on in Mo Mo , and perhaps in a number of other metals including Nb, may be triggered by the underlying solid-solid phase transition, either to a real solid phase, like Pnma-Nb, or a virtual one, like fcc-Mo or hcp-Mo, both of which have been discussed in the literature (e.g., 8 ). The nonhydrostaticity-based model of FR considered in this work strongly suggests that this idea is meaningful.
DISCUSSION
The seven experimental s can be described by the SG equation where is in K and in GPa, which is plotted in Fig. 5 as a solid black line. For this fit, the initial slope, 25.8 K/GPa, is significantly lower than the value 36 K/GPa obtained from isobaric expansion measurements 20 . On the other hand, the initial slope of the theoretical melting curve of bcc-Nb, Eq. (1), is 36.5 K/GPa, which is in excellent agreement with 20 . We consider this theoretical melting curve to be the correct one for bcc-Nb. Above the bcc-Pnma-liquid triple point GPa) niobium melts from Pnma, and its melting curve is described by Eq. (2). The fit to the seven experimental points lies below Eq. (2) because of the three relatively low data points at -60 GPa. The difference between their values of and those predicted by Eq. (2) is K, or %, taking into account the upper error bar (perhaps it is even smaller because of K uncertainty in the values of the theoretical melting points). The remaining four experimental data points are consistent with Eq. (2). Next we suggest a possible reason for the experimental s being slightly lower than those predicted by the theory.
As we have already mentioned above, the detection of melting by XRD at high may be problematic, and may cause uncertainty in the experimental melting It turns out that a plateau, too, may be another source of uncertainty in experimental Although a plateau is considered to be an unambiguous signature of melting, there may be experimental conditions at which the plateau may correspond to different from the true Stutzmann et al. Ti found that in the case of titanium the of plateaus decreases with such that it differs significantly (by up to K) from the estimated using XRD data. They attribute this difference in to a decrease in thermal insulation due to the thinning of the pressure chamber with increasing and suggest that in the case of Ti the plateaus cannot be used as a systematic diagnostic for the sample melting. In our case of Nb, the plateaus do not seem to be as drastically different from the XRD melting data as for Ti, but a relatively small difference, -250 K, between the of the plateaus and the true may occur, for reasons similar to those responsible for large differences in the case of titanium. Note that the locations of the plateaus may be also influenced by the FR detected in our experiments below melting.
The theoretical bcc-Pnma solid-solid phase boundary is shown in Fig. 6. We would like to emphasize that this phase boundary is consistent with the experimental data points where evidence for the existence of the proposed HP-HT Pnma phase is found. Note that at low the bcc-Pnma phase boundary is quasi-horizontal, which corresponds to a very small volume change across the bcc-Pnma transition, in view of the CC relation. This is very nicely confirmed by our experimental results, as discussed above.
The theoretically predicted existence of a HP-HT orthorhombic phase not only provides an explanation for the appearance of the extra Bragg peaks observed in our experiments, but also for the observed FR. Unfortunately, it is so fast that the orthorhombic phase cannot be isolated in our XRD, in which images were collected every two seconds. Therefore, our results call for the development of ultrafast XRD techniques for HP studies.
To summarize, we have determined experimentally and theoretically the melting curve of Nb and found very good agreement between experiments and theory. We also found evidence for the existence of Pnma-Nb, the orthorhombic HP-HT phase of Nb. The existence of this phase provides an explanation not only for the appearance of extra Bragg peaks in the XRD patterns at HP-HT conditions, but also for the sample recrystallization observed several hundred K below . The polymorphism of Nb makes it an excellent candidate for further studies that will advance our understanding of the - phase diagrams of transition metals.
We conclude by making the following four points that summarize our combined experimental and theoretical study on Nb at HP-HT.
1. FR observed in HP-HT experiments on transition metals, including the present case of Nb, may correspond to either an isostructural texture change (Mo Mo , V V ) or a true solid-solid phase transformation (Re Re , Nb). In either scenario, the former DAC experiments must have misinterpreted the corresponding FR lines as the flat melting curves.
2. The appearance of bcc-Nb above the bcc-Pnma transition point detected by XRD is probably due to some (small) nonhydrostaticity or radial thermal gradients being present in our experiments, as discussed in more detail above.
3. Our findings provide clear evindence for the topological similarity of the phase diagrams of Nb and Ta, its group 5B partner in the periodic table. In both cases an orthorhombic phase transition occurs, and the high-PT physical solid structure is Pnma. However, the location of the bcc-Pnma-liquid triple point in Ta corresponds to an order of magnitude higher than that in Nb 31 .
4. Our results call for the development of ultrafast HP XRD techniques.
METHODS
Experimental details
Disks of Nb (99.99% purity, Aldrich), 15-25 m in diameter and 5 m thick, were loaded into Almax-Plate DACs (200-280 m culets). The samples were placed in the center of a 60-90 m diameter hole of a rhenium gasket pre-indented to a thickness of 30 m. Al2O KBr, MgO, and NaCl were used as pressure-transmitting media and to thermally insulate the Nb from the diamonds. s were measured before and after heating using ruby fluorescence 22 , and are in agreement with those obtained from the equations of state (EOS) of Nb 23 and the pressure medium 24 . The Nb samples were heated on both sides with two infrared YAG lasers which have a maximum power of 100 W each. The laser beams were defocused to create hotspots of 15-20 m in diameter over the surfaces of the sample. The power and focusing of the lasers were adjusted to minimize the difference of s on both sides of the sample to less than 100 K. Spectral radiometry was used to determine s on the sample surfaces by collecting the thermal emission signal from circular areas of 2 m diameter in the center of the hot spots 25 . gradients in the center of the hot spots were within 10 K m-1 ( K in an area of 10 m in diameter). The x-ray beam ( Å) was focused on a m2 area. X-ray induced fluorescence of the diamond or the pressure medium was used to align the x-ray beam with the hot spot. Samples were compressed at RT up to the selected and then was raised at constant load by gradually increasing the power of the lasers. After reaching the highest of each run, was quenched by a rapid decrease of the laser power to zero in less than 3 seconds. In all the experiments, a pure bcc phase of Nb was recovered, thus confirming RT XRD studies 23 and SW measurements 21 . No extra Bragg peaks were detected in the quenched XRD patterns. During each run, XRD and thermal emission spectra were recorded simultaneously every 2 seconds. XRD patterns were collected using a MAR CCD detector. The same approach was successfully used previously to study Fe 26 ; 27 , Ta 11 and Ni 12 . It allows one to resolve the structure and to establish the onset of melting. In order to do so, the diffraction patterns measured with the CCD detector were integrated as a function of in order to obtain one-dimensional XRD profiles. The indexing and refinement of the powder XRD patterns were performed using the DICVOL 29 and PowderCell 30 programs.
Computational details
We have carried out an extensive study of the phase diagram of Nb using the Z method implemented with VASP (Vienna Ab initio Simulation Package) in combination with the temperature-dependent effective potential (TDEP) method. The Z method was used to simulate the Nb melting curve. The Z method is described in detail in 31 ; Os ; 32 . TDEP Hellman1 ; Hellman2 takes into account anharmonic lattice vibrations. TDEP was used to calculate full free energies of the solid phases of Nb. The calculations were based on density-functional theory (DFT) with the projector-augmented-wave (PAW) PAW implementation and the generalized gradient approximation (GGA) for exchange-correlation energy, in the form known as Perdew-Burke-Ernzerhof (PBE) PBE . Since the simulations were performed at high- conditions, we used accurate pseudopotentials where the semi-core 4s and 4p states were treated as valence states. Specifically, Nb was modeled with 13 valence electrons per atom (4s, 4p, 4d, and 5s orbitals). Cold total free energies (enthalpies) were calcualted using unit cells with very dense k-point meshes (e.g., for bcc-Nb) for high accuracy. In all the non-cubic cases we first relaxed the structure to determine its unit cell parameters at each volume. Fig. 4 shows the unit cell parameters, including two internal coordinates and , for Pnma-Nb as functions of the lattice constant. Finite- total free energies were calculated (with TDEP) using supercells of order 400-500 atoms. Supercells were constructed based on the corresponding unit cells. Using the Z method, we calculated the melting curves of bcc-Nb as well as many other (virtual) solid structures of Nb which have been mentioned in the literature in connection with transition metals: all the close-packed structures with different layer stacking (fcc, hcp, dhcp, thcp, 9R), open structures (simple cubic, A15, hex-), and different orthorhombic structures. Again, in all the non-cubic cases we relaxed the structure to determine its unit cell parameters; those unit cells were used for the construction of the corresponding supercells. We used systems of 400-500 atoms in each case. We did not consider the issue of mechanical stability of the other solid structures of Nb at low We followed the logic that if the melting curve of a solid structure exists, this structure is certainly mechanically stable at a close to the corresponding melting point, regardless of its mechanical stability at low The melting curves were obtained for all the structures that we dealt with, except the simple cubic one, which would disorder during every molecular dynamics run and thus turned out to be mechanically unstable at all .
Data Availability
All relevant data that support the findings of this study are available from the corresponding authors upon request.
References
- (1) Belonoshko, A.B. et al. Molybdenum at high pressure and temperature: melting from another solid phase. Phys. Rev. Lett. 100, 135701 (2008).
- (2) Liu, Z-L., Cai, L-C., Chen, X-R. & Jing, F-Q. Molecular dynamics simulations of the melting curve of tantalum under pressure. Phys. Rev. B 77, 024103 (2008).
- (3) Burakovsky, L. et al. High-pressure–high-temperature polymorphism in Ta: resolving an ongoing experimental controversy. Phys. Rev. Lett. 104, 255702 (2010).
- (4) Haskins, J., Moriarty, J.A. & Hood, R.Q. Polymorphism and melt in high-pressure tantalum. Phys. Rev. B 86, 224104 (2012).
- (5) Hu, J. et al. Sound velocity measurements of tantalum under shock compression in the 10-110 GPa range. J. Appl. Phys. 111, 033511 (2012).
- (6) Liu, C-M. et al. Melting curves and entropy of fusion of body-centered cubic tungsten under pressure. J. Appl. Phys. 112, 013518 (2012).
- (7) Yao, Y. & Klug, D. Stable structures of tantalum at high temperature and high pressure. Phys. Rev. B 88 054102 (2013).
- (8) Pozzo, M. & Alfe, D. Melting curve of face-centered-cubic nickel from first-principles calculations. Phys. Rev. B 88, 024111 (2013).
- (9) Burakovsky, L., Chen, S.P., Preston, D.L. & Sheppard, D.G. Z methodology for phase diagram studies: platinum and tantalum as examples. J. Phys. Conf. Ser. 500, 162001 (2014).
- (10) Burakovsky, L., Burakovsky, N., Preston, D. & Simak, S.I. Systematics of the third row transition metal melting: the hcp metals rhenium and osmium. Crystals 2018, 8, 243.
- (11) Lazor, P., Shen, G. & Saxena, S.K. Laser-heated diamond anvil cell experiments at high pressure: melting curve of nickel up to 700 kbar. Phys. Chem. Minerals 20, 86 (1993)
- (12) Kavner, A. & Jeanloz, R. High-pressure melting curve of platinum. J. App. Phys. 83, 7553 (1998).
- (13) Errandonea, D. et al. Systematics of transition-metal melting. Phys. Rev. B 63, 132104 (2001).
- (14) Errandonea, D. et al. Melting of tantalum at high pressure determined by angle dispersive x-ray diffraction in a double-sided laser-heated diamond-anvil cell. J. Phys. Cond. Mat. 15, 7635 (2003).
- (15) Boehler, R., Santamaría-Perez, D., Errandonea, D. & Mezouar, M. Melting, density, and anisotropy of iron at core conditions: new x-ray measurements to 150 GPa. J. Phys. Conf. Ser. 121, 022018 (2008).
- (16) Santamaría-Perez, D. et al. X-ray diffraction measurements of Mo melting to 119 GPa and the high pressure phase diagram. J. Chem. Phys. 130, 124509 (2009).
- (17) Ruiz-Fuertes, J., Karandikar, A., Boehler R. & Errandonea, D. Microscopic evidence of a flat melting curve of tantalum. Phys. Earth Planet. Inter. 181, 69 (2010).
- (18) Dewaele, A., Mezouar, M., Guignot, N. & Loubeyre, P. High melting points of tantalum in a laser-heated diamond anvil cell. Phys. Rev. Lett. 104, 255701 (2010).
- (19) Yang, L., Karandikar, A. & Boehler, R. Flash heating in the diamond cell: Melting curve of rhenium. Rev. Sci. Instr. 83, 063905 (2012).
- (20) D. Errandonea. High-pressure melting curves of the transition metals Cu, Ni, Pd, and Pt. Phys, Rev. B 87, 054108 (2013).
- (21) Anzellini, S. et al. Melting of iron at Earth’s inner core boundary based on fast X-ray diffraction. Science 340, 464 (2013).
- (22) Lord, O.T. et al. The melting curve of Ni to 1 Mbar. Earth Planet. Sci. Lett. 408, 226 (2014).
- (23) Hrubiak, R., Meng, Y. & Shen, G. Microstructures define melting of molybdenum at high pressures. Nature Comm. 8, 14562 (2017).
- (24) Anzellini, S. et al. In situ characterization of the high pressure – high temperature melting curve of platinum. Sci. Rep. 9, 13034 (2019).
- (25) Errandonea, D. et al. Melting curve and phase diagram of vanadium under high-pressure and high-temperature conditions. Phys. Rev. B 100, 094111 (2019).
- (26) Shaner, J.W., Gathers, G.R. & Minichino, C., A new apparatus for thermophysical measurements above 2500 K, High Temp.-High Pres. 8, 425 (1976).
- (27) LASL shock-wave Hugoniot data, edited by S.P. Marsh, University of California Press, Berkeley, Los Angeles, London, 1980).
- (28) Shen, G., Prakapenka, V.B., Rivers, M.L. & Sutton, S.R. Structural investigation of amorphous materials at high pressures using the diamond anvil cell. Rev. Scient. Instrum. 74, 3021 (2003).
- (29) Boehler, R., Ross, M. & Boercker, D.B. Melting of LiF and NaCl to 1 Mbar: Systematics of ionic solids at extreme conditions. Phys. Rev. Lett. 78, 4589 (1997).
- (30) Fat’yanov, O.V. & Asimow, P.D. MgO melting curve constraints from shock temperature and rarefaction overtake measurements in samples preheated to 2300 K. J. Phys. Conf. Series 500, 062003 (2014).
- (31) Shen, G.Y., Prakapenka, V.B., Rivers, M.L. & Sutton, S.R. Structure of liquid iron at pressures up to 58 GPa. Phys. Rev. Lett. 92, 185701 (2004).
- (32) Errandonea, D. Observation of chemical reactions between alkaline-earth oxides and tungsten at high pressure and high temperature. J. Phys. Chem. Solids 70, 1117 (2009).
- (33) Terao, N. Structure des Carbures de Niobium. Japanese J. Appl. Phys. 3, 104 (1964).
- (34) Terao, N. Structures des Oxydes de Niobium. Japanese J. Appl. Phys. 2, 156 (1963).
- (35) Paraskevas, P., Cova, F. & Garbarino, G. Melting curve of elemental zirconium. Phys. Rev. B 100, 054102 (2019).
- (36) Kimura, T., Ohfuji, H., Nishi, M. & Irifune, T. Melting temperatures of MgO under high pressure by micro-texture analysis. Nature Comm. 8, 15735 (2017).
- (37) Burakovsky, L., Burakovsky, N. & Preston, D. Ab initio melting curve of osmium. Phys. Rev. B 92, 174105 (2015).
- (38) Simon, F. & Glatzel, G. Bemerkungen zur Schmelzdruckkurve. Z. Anorg. Allgem. Chemie 178, 309 (1929).
- (39) Gorecki, T. Vacancies and melting curve of metals at high pressure. Z. Metallk. 68, 231 (1977).
- (40) Gorecki, T. Vacancies and a generalised melting curve of metals. High Temp.-High Pres. 11, 683 (1979).
- (41) Fellinger, M.R., Park, H. & Wilkins, J.W. Force-matched embedded-atom method potential for niobium. Phys. Rev. B 81, 144119 (2010).
- (42) Kramynin, S.P. & Akhmedov, E.N., J. Phys. Chem. Solids 153, 109108 (2019).
- (43) Russian Shock Wave Database; http://www.ihed.ras.ru/rusbank/
- (44) Johnson, J.D., AIP Conference Proceedings, 429, 27 (1998).
- (45) McQueen, R.G. et al., in High Velocity Impact Phenomena, edited by R. Kinslow (Academic Press, New York, 1970), p. 293.
- (46) Katahara, K.W., Manghnani, M.H. & Fisher, E.S. Pressure derivatives of the elastic moduli of niobium and tantalum. J. Appl. Phys. 47, 434 (1976).
- (47) Kenichi, T. & Singh, A.K. High-pressure equation of state for Nb with a helium-pressure medium: Powder x-ray diffraction experiments. Phys. Rev. B 73, 224119 (2006).
- (48) Y. Zou et al. Thermoelasticity and anomalies in the pressure dependence of phonon velocities in niobium. Appl. Phys. Lett. 112, 011901 (2018).
- (49) Germann, T.C., Large-scale classical molecular dynamics simulations of shock-induced plasticity in bcc niobium. AIP Conference Proceedings, 1195, 761 (2009).
- (50) L. Burakovsky et al. Ab initio phase diagram of iridium. Phys. Rev. B 94, 094112 (2016), and references therein.
- (51) Baty, S.R., Burakovsky, L., Preston, D.L., Sjue, S.K. & Luscher, D.J. Thermoelasticity model for niobium. Los Alamos preprint LA-UR-19-28448 (2019).
- (52) Singh, A.K. & Liermann, H.-P. Strength and elasticity of niobium under high pressure. J. Appl. Phys. 109, 113539 (2011).
- (53) Jing, Q.-M. et al. Unusual softening behavior of yield strength in niobium at high pressures. Chin. Phys. B 27, 106201 (2018).
- (54) Stutzmann, V. et al. High-pressure melting curve of titanium. Phys. Rev. B 92, 224110 (2015).
- (55) Mao, H.K., Xu, J. & Bell, P.M. Calibration of the ruby pressure gauge to 800 kbar under quasi-hydrostatic conditions. J. Geophys. Res. 91, 4673 (1986).
- (56) Dorogokupets, P.I. & Dewaele, A. Equations of state of MgO, Au, Pt, NaCl-B1, and NaCl-B2: Internally consistent high-temperature pressure scales. High Pressure Res. 27, 431 (2007) and references therein.
- (57) D. Errandonea. Phase behavior of metals at very high P-T conditions: A review of recent experimental studies. J. Phys. Chem. Solids 67, 2017 (2006).
- (58) Boutlif, A. & Louer, D. Indexing of powder diffraction patterns for low-symmetry lattices by the successive dichotomy method. J. Appl. Crystallogr. 24, 987 (1991).
- (59) Kraus, W. & Nolze, G. POWDER CELL – a program for the representation and manipulation of crystal structures and calculation of the resulting X-ray powder patterns. J. Appl. Crystallogr. 29, 301 (1996).
- (60) Belonoshko, A.B., Skorodumova, N.V., Rosengren, A. & Johansson, B. Melting and critical superheating. Phys. Rev. B 73, 012201 (2006).
- (61) Hellman, O., Abrikosov, I.A. & Simak, S.I. Lattice dynamics of anharmonic solids from first principles. Phys. Rev. B 84, 180301(R) (2011).
- (62) Hellman, O., Steneteg, P., Abrikosov, I.A. & Simak, S.I. Temperature dependent effective potential method for accurate free energy calculations of solids. Phys. Rev. B 87, 104111 (2013).
- (63) Blöchl, P. Projector augmented-wave method. Phys. Rev. B 50, 17953 (1994).
- (64) Perdew, J.P., Burke, K. & Ernzerhof, M. Generalized gradient approximation made simple. Phys. Rev. Lett. 77, 3865 (1996).
- (65) Weck, P.F. et al. Shock compression of niobium from first-principles. J. Appl. Phys. 125, 245905 (2019).
Acknowledgements
The authors acknowledge the European Synchrotron Radiation Facility for the provision of synchrotron beamtime at the beamline ID27. Research financed by Spanish Ministerio de Ciencia, Innovación y Universidades (Grants No MAT2016-75586-C4-1-P, PGC2018-097520-A-100, and RED2018-102612-T), and Generalitat Valenciana (Prometeo/2018/123 EFIMAT). D.S.P. acknowledges the Spanish government for a Ramon y Cajal RyC-2014-15643 grant. This work was performed under the auspices of the U.S. Department of Energy by Lawrence Livermore National Laboratory under contract DE-AC52-07NA27344. QMD simulations were carried out on the Los Alamos IC clusters Conejo, Mapache, Pinto, and Badger.
Author contributions
D.E. designed the study; M.M. expedited the provision of the beamline; D.E, S.M., D.S., H.C., M.M. performed experiments; D.E., S.M., D.S., H.C. analyzed data; L.B., D.P. carried out QMD simulations; L.B., S.C., M.Mc., J.P. carried out theoretical calculations; S.S. carried out TDEP calculations; D.E., L.B. wrote the paper with contributions from all authors.
Additional information
Supplementary Information accompanies this paper and can be found at https://www.nature.com/commsmat/
Competing financial interests:
The authors declare no competing financial or non-financial interests.

| lattice constant (Å) | density (g cm-3) | (GPa) | (K) |
|---|---|---|---|
| 3.445 | 7.547 | -7.9 | 2400 |
| 3.225 | 9.199 | 27.0 | 3460 |
| 3.050 | 10.88 | 79.9 | 4330 |
| 2.955 | 11.96 | 124 | 4820 |
| 2.850 | 13.33 | 191 | 5390 |
| 2.745 | 14.92 | 287 | 6050 |
Table 1. The six ab initio melting points of body-centered cubic bcc-Nb, obtained from the method implemented with VASP.
| lattice constant (Å) | density (g cm-3) | (GPa) | (K) |
|---|---|---|---|
| 5.4270 | 8.143 | 6.5 | 2970 |
| 5.1155 | 9.723 | 40.1 | 3890 |
| 4.9290 | 10.87 | 76.4 | 4550 |
| 4.7675 | 12.01 | 125 | 5240 |
| 4.6390 | 13.04 | 180 | 5850 |
| 4.5260 | 14.04 | 245 | 6430 |
Table 2. The six ab initio melting points of orthorhombic Pnma-Nb, obtained from the method implemented with VASP.