Conformal Prediction Sets Improve Human Decision Making
Abstract
In response to everyday queries, humans explicitly signal uncertainty and offer alternative answers when they are unsure. Machine learning models that output calibrated prediction sets through conformal prediction mimic this human behaviour; larger sets signal greater uncertainty while providing alternatives. In this work, we study the usefulness of conformal prediction sets as an aid for human decision making by conducting a pre-registered randomized controlled trial with conformal prediction sets provided to human subjects. With statistical significance, we find that when humans are given conformal prediction sets their accuracy on tasks improves compared to fixed-size prediction sets with the same coverage guarantee. The results show that quantifying model uncertainty with conformal prediction is helpful for human-in-the-loop decision making and human-AI teams.
1 Introduction
When answering questions, humans naturally provide information on how confident we are in our answers. If unsure, we signal uncertainty to others (Smith & Clark, 1993), and offer alternatives (Berlyne, 1962) (Figure 1). On the other hand, standard methods for discriminative machine learning often output only a single answer without quantifying the uncertainty in the prediction (Abdar et al., 2021). The lack of uncertainty quantification and lack of alternative predictions greatly limits the usefulness of machine learning models for real-world decision making.
Prediction sets are a useful tool for augmenting the output of a discriminative model. Rather than outputting a single prediction, a model can output a set of predictions, which may contain zero, one, or multiple possible values. Generally, prediction sets are constructed to contain the values that are most likely to be correct according to the model using some heuristic notion of confidence. Perhaps the most straightforward way to construct prediction sets in the classification context is by including the top- values according to softmax outputs for a fixed (Grycko, 1993). Top- prediction sets are useful for providing alternatives and can even furnish statistical guarantees (Chzhen et al., 2021); however, they do not quantify uncertainty.

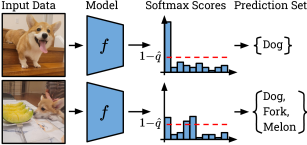
Conformal prediction (Vovk et al., 2005) is a general-purpose method for transforming heuristic notions of uncertainty into rigorous ones through the use of calibrated prediction sets. Conformal sets usually are designed so that the set size indicates how confident the model is about a particular input, with larger sets signalling more uncertainty (Figure 1). The hallmark of conformal prediction is its risk control; conformal sets will only fail to contain the ground truth with a pre-specified error rate. Furthermore, conformal prediction is widely applicable since it can be used with any pre-trained model, and does not rely on distributional assumptions, nor on infinite-data limits (Angelopoulos & Bates, 2021). It has been successfully applied in real-world settings for drug discovery (Eklund et al., 2015; Alvarsson et al., 2021), medical diagnosis (Zhan et al., 2020), time-series forecasting (Stankeviciute et al., 2021; Xu & Xie, 2021; Zaffran et al., 2022), and language modelling (Kumar et al., 2023; Ren et al., 2023).
The main drawback of prediction sets, even conformally calibrated ones, is that decision making in the real world often requires us to act on a single option, which we are not guaranteed to obtain through conformal prediction. Given the qualitative similarity between human expressions of uncertainty and conformal prediction, it is natural to rely on humans as the mechanism for converting prediction sets into decisions. Prediction sets can be provided to a human who uses the information along with their own judgement to make a final decision, with the expectation that the combination outperforms a human alone. Despite its reasonableness, this expectation has not been scientifically tested.
In this work, we conduct a pre-registered 111The pre-registration is viewable at osf.io/fkdhv. randomized controlled trial to directly measure human performance using three classification tasks. We evaluate the benefits of both alternative suggestions and uncertainty quantification to human decision makers by providing three levels of assistance: no assistance (control), top- sets, and conformal sets. Compared to the control, top- sets provide a fixed number of likely alternatives to the human, while conformal sets also quantify uncertainty. Our main finding is that humans do leverage the uncertainty quantification provided by conformal sets. In all three independent tasks we find with statistical significance () that conformal prediction sets improve human accuracy compared to top- sets, although providing prediction sets does not always speed up decision making compared to the control.
2 Background and Related Work
2.1 Uncertainty Quantification
In order build more trustworthy machine learning models, it is paramount to reliably characterize the uncertainty in their predictions (Smith, 2013; Sullivan, 2015; Soize, 2017). In the case of classification models, while the softmax scores of maximum likelihood predictions might seem to be intuitive proxies of uncertainty, it has been shown that modern neural networks do not intrinsically provide calibrated softmax scores (Guo et al., 2017; Minderer et al., 2021; Bai et al., 2021). At best, softmax scores are heuristic notions of uncertainty. However, there exists a plethora of uncertainty quantification techniques including Bayesian methods (Mackay, 1992; Neal, 2012; Graves, 2011; Blundell et al., 2015), Monte Carlo dropout (Gal & Ghahramani, 2016), and ensembles (Dietterich, 2000; Lakshminarayanan et al., 2017; Ashukha et al., 2020). Yet, many such methods can be limited in practice due to their computational overhead, incorrect distributional assumptions, or predisposition to specific architectures and training procedures.
2.2 Prediction Sets and Coverage
While many machine learning tasks are formulated as classification problems with a single ground truth label, the real world is often much more nuanced. Data points may contain elements from multiple classes, in which case multiple labels could apply. Alternatively, some data may be out-of-distribution in which case predicting any single class would misrepresent the uncertainty in the label. In such cases, forcing a predictor to only produce a single output is overly restrictive. Set-valued predictors (Grycko, 1993) are better equipped to deal with the ambiguities of multi-label predictions. A key desiderata of prediction sets is to construct them such that they satisfy the coverage guarantee (Vovk et al., 1999). Formally, we consider an input with corresponding ground truth class drawn from a joint distribution . Suppose we have a set-valued function , where . Prediction sets produced by satisfy the coverage guarantee if222Throughout the paper, we refer to marginal coverage since the probability is marginalized over the randomness in .
| (1) |
where is the error rate, also referred to as risk. Under the coverage guarantee, prediction sets contain the correct label with probability at least , which is important for their reliability when presented to humans.
Given an arbitrary classifier with softmax outputs, the simplest method of creating prediction sets is to select the top- outputs of , denoted ,
| (2) |
While the top- method can satisfy the coverage guarantee, it does not allow the user to specify a desired error rate a priori (Chzhen et al., 2021). Instead, must be computed as a posteriori. In cases where this is not directly computable, the expectation can be estimated from a calibration set , with , obtaining the empirical risk
| (3) |
where is the indicator function. is a random variable over the randomness of with expected value , making it an unbiased estimator of .
2.3 Conformal Prediction
Conformal prediction (Vovk et al., 2005; Shafer & Vovk, 2008) is a prominent framework to construct prediction sets for arbitrary classification models333While conformal prediction can be applied to a broader class of discriminative models, we focus our study on classification. such that, for any pre-specified , the resulting sets provably satisfy the coverage guarantee in Equation 1. In particular, it provides risk control – the ability to choose – which is achieved by allowing the size of prediction sets to vary based on a heuristic notion of uncertainty built into , such as softmax scores. First, we define a conformal score function where larger conformal scores indicate worse agreement between an input and a class according to the heuristic uncertainty notion. While improved alternatives exist (Romano et al., 2020; Angelopoulos et al., 2021), the canonical form of the conformal score for classification is , where is the softmax output for class . Second, using a calibration dataset of size drawn from , we compute the conformal threshold as the quantile of the conformal scores on . Since this quantile is computed from pairs of input data and corresponding labels , it calibrates the conformal score for the model. Finally, is used to generate prediction sets that contain all classes such that the conformal score is below the threshold ,444See Figure 1 where is used in lieu of .
| (4) |
Conformal prediction sets will obey the coverage guarantee in Equation 1 for test data with the sole assumption being that the calibration and test data are exchangeable (Vovk et al., 1999), a weaker assumption than being i.i.d. Hence, unlike other methods for uncertainty quantification, conformal prediction does not rely on assumptions about the underlying model , its training data, nor on distributional assumptions about the data (Angelopoulos & Bates, 2021).
Importantly, conformal prediction sets are calibrated to be larger when the model has greater uncertainty in its predictions. Compared to the fixed-sized nature of top- sets, well-designed conformal sets will have a smaller average set size for the same coverage (Angelopoulos et al., 2021). This is a potentially useful feature for improving downstream human decision making, although one that has not been scientifically verified in prior work.
2.4 Human-in-the-Loop Conformal Prediction
While conformal prediction provides statistically rigorous guarantees, its applicability in real-world scenarios is limited since it requires a post-hoc mechanism to convert prediction sets into single actionable outcomes. A small number of prior works have explored using conformal prediction with human decision makers. Straitouri et al. (2023) proposed restricting experts to only select an option from a conformal prediction set, and developed a search method to find an that maximizes the expert’s accuracy. Babbar et al. (2022) proposed learning a policy that is attuned to a given expert, and defers automated model decisions when it expects the human is likely to be more accurate.
These works are based on the assumption that humans can effectively make use of prediction sets compared to acting without assistance. However, such assumptions have not been supported by scientific evidence. Straitouri et al. (2023) did not conduct any tests involving humans, instead creating algorithmic “experts”. Follow-up work by Straitouri & Rodriguez (2023) did involve humans, but only compared cases where humans are or are not forced to choose their answer from a conformal set. Babbar et al. (2022) recruited humans to compare the usefulness of top-1 predictions to conformal sets and their proposed deferral scheme. However, in these tests the sets of images shown to participants were not randomized, but were hand-selected by the experimenters to highlight cases where the top-1 prediction was incorrect, or where non-deferred sets were smaller in size. Due to such data manipulations, the tests cannot be considered as randomized controlled trials. In our work we provide scientific evidence in support of the notion that humans can effectively leverage prediction sets and the uncertainty quantification that conformal prediction provides.
3 Method
Our aim is to determine if providing conformal prediction sets to humans can benefit their performance on tasks via a pre-registered experiment with human subjects. We consider two aspects of performance: accuracy and speed. Prediction sets that come with coverage guarantees represent additional information, so it is natural to expect that humans could leverage that information to improve their decision accuracy. That additional information may also help them narrow their focus to a few likely candidates, or increase their cognitive load (Beach, 1993), so it is plausible that predictions sets could increase or decrease decision making speed.
Primarily, we aim to disentangle the effects of merely receiving several alternatives versus the uncertainty quantification provided by variable conformal set sizes. To this end, we ask humans to complete a challenging task, and either provide them with no assistance (control), a top- set, or a conformal prediction set generated with the RAPS algorithm (Angelopoulos et al., 2021) (see App. A.2). Both types of sets are derived from the same pre-trained model and come with (empirical) coverage guarantees. To isolate the uncertainty quantification aspects of conformal prediction from the level of coverage, we ensure that both types of predictions sets achieve the same empirical coverage. First, we select a for top-, and evaluate the empirical risk from Equation 3 using . Then, we compute a calibrated conformal threshold using the same and with the choice of risk tolerance equal to the achieved by top-. In both cases, new data drawn i.i.d. from the same distribution as is shown to humans along with the appropriate set and coverage guarantee.555We refrain from providing any other possible information, such as the model’s ordering of likely labels, or softmax scores.
Our experiments are forced-choice tasks, where participants are shown a stimulus and must select one label out of all possible classes. Each participant is randomly assigned to one task and one treatment (control, top-, or conformal), then is trained on their task, and finally completes trials. We collect data on their answers and response time.
The tasks we employ have one-hot labels, so that correctness is binary. Accuracy is computed as the fraction of the trials that were answered correctly. For each of participants in a treatment, we consider their accuracy over trials as one observation; for large we expect the mean accuracy follows a Gaussian distribution by the central limit theorem. Also, since each participant takes only one test, observations are independent and unpaired. Hence, we can perform Welch’s -test (Welch, 1947) to test the null hypothesis that two treatments have the same mean accuracy.666For accuracy, we perform one-sided -tests with the prior expectation that top- sets are more helpful than the control, and that conformal sets are more helpful than top- sets due to their smaller average size.
For measurement of decision making speed, we capture the time between presentation of a stimulus and when the participant enters their response. For every response, participants are unconstrained in the amount of time they spend deciding on their answer, but have a monetary incentive to complete the test expediently since compensation is primarily a fixed amount as enforced by the recruitment platform (Prolific, 2024). We treat each participant’s total response time over trials as a single observation, and again apply Welch’s -test for the null hypothesis that two treatments have the same mean response time.
Finally, we provide effect sizes computed with Cohen’s for equal sample sizes: . Here, is the sample mean over observations for treatment , and the sample variance is , using observations from treatment (Cohen, 2013).
4 Experiments and Evaluation
4.1 Tasks, Datasets, and Models
We designed three independent tasks to represent a variety of real-world settings where human decision makers might benefit from model assistance. Each task is based on a dataset from the machine learning literature for which pre-trained models are available. As discussed in Section 2.3, it is not required that the models were trained on the datasets we employ. The three tasks do not rely on specialized knowledge, only fluency in English, so that they can be completed by the general population. Full details on dataset construction are given in Appendix A, and our code is available at this GitHub repository for reproducibility.
Image Classification
Image classification, a mainstay application of computer vision, is widely performed by humans in critical settings every day. For instance, radiologists diagnose diseases by classifying X-ray images, and could potentially improve the accuracy and speed of diagnosis by leveraging machine learning (Choy et al., 2018; Agarwal et al., 2023). As a representative image classification task we used ObjectNet (Barbu et al., 2019), a dataset of common objects photographed from intentionally difficult viewpoints. We selected the 20 most common classes to reduce the number to a manageable level for humans, balanced the selected classes using stratified sampling, then split the dataset into and maintaining class balance. We used CLIP ViT-L/14 (Radford et al., 2021) as a zero-shot classifier.
Sentiment Analysis
Sentiment analysis is crucial in human interactions. For instance, social media users routinely classify sentiments in posts, comments, and reviews to understand context and communicate effectively. As a prototypical task, we used GoEmotions (Demszky et al., 2020), a dataset of Reddit comments in English with annotations of sentiment categories. We selected the 10 most common classes based on the validation dataset, and balanced the classes using stratified sampling for the validation and test set separately to form and . For the model we selected a RoBERTa-Base (Liu et al., 2019) fine-tuned on the GoEmotions training set (Lowe, 2024).
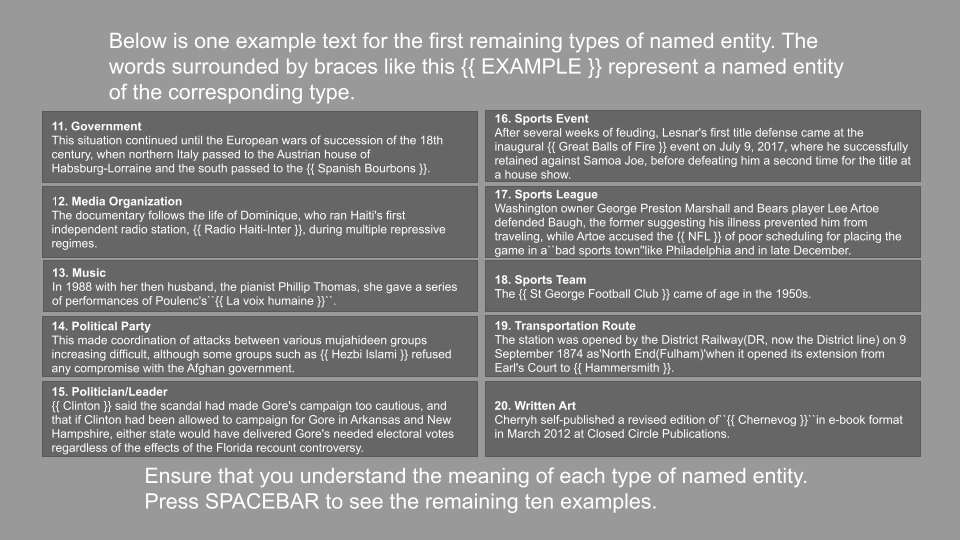
Named Entity Recognition (NER)
Humans regularly perform NER in daily life as we encounter unfamiliar proper names and use context to infer what type of entity that name represents. In the financial industry, human annotators are often employed to locate and extract entities from legal documents, but may rely on model recommendations to expedite extraction. We used the Few-NERD dataset of sentences from Wikipedia in English (Ding et al., 2021), with each word annotated as a named entity class. For our task, a single entity was selected from every sentence as the classification target. We selected the 10 most common classes based on the validation dataset, and balanced the classes using stratified sampling for the validation and test set separately to form and . For the model we used a SpanMarker RoBERTa-Large fine-tuned on the Few-NERD training set (Aarsen, 2023, 2024).
For all three tasks we used to compare the usefulness of top- sets and conformal sets. A summary of model performance as percentages is given in Table 1. We show the empirical risk for top- sets computed on , which is then used as for conformal calibration. We also show for the top-1 and top-3 accuracy of the models, empirical conformal set coverage, and average conformal set size.
| Task | Top-1 | Top-3 | Coverage | Avg. Size | |
|---|---|---|---|---|---|
| ObjectNet | 0.065 | 83.3 | 95.0 | 94.1 | 1.68 |
| GoEmotions | 0.085 | 67.2 | 94.4 | 91.8 | 2.49 |
| Few-NERD | 0.021 | 91.1 | 98.3 | 98.2 | 1.82 |
4.2 Experiment Design
We created our human subject experiments using PsychoPy (Peirce et al., 2019) and hosted them on Pavlovia (Pavlovia, 2024). Participants were recruited on Prolific (Prolific, 2024), a platform that provides the highest quality data according to scientific comparisons of behavioural data collection platforms (Eyal et al., 2021; Douglas et al., 2023).
Our experimental design was informed by research on the collection of high quality data from crowd sourcing platforms. Mitra et al. (2015) show that the most reliable way to ensure high quality data is by training participants on the task at hand, while providing financial incentives can also be beneficial. Hence, in each experiment participants were asked for consent, given instructions on the task, and trained with 20 examples after which the testing phase began. Participants were paid a fixed amount with a financial incentive proportional to their accuracy. On average, participants were paid 7.80 GBP/hr, and in total we spent 1500 GBP on participant compensation, excluding fees.
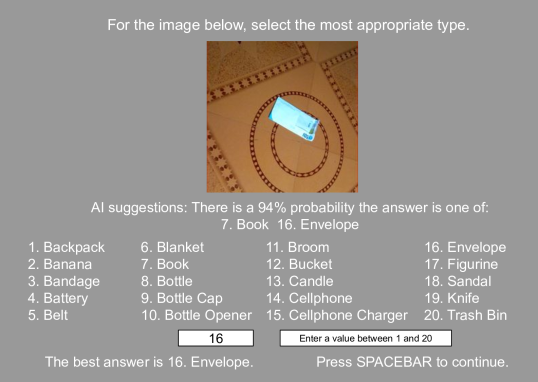
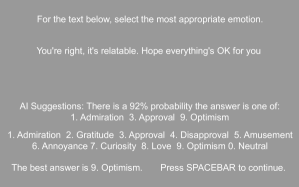
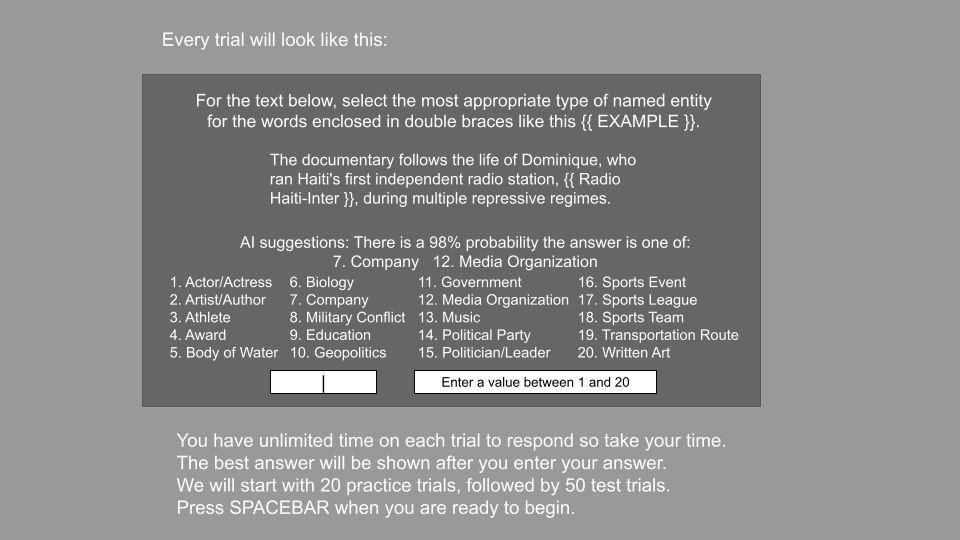
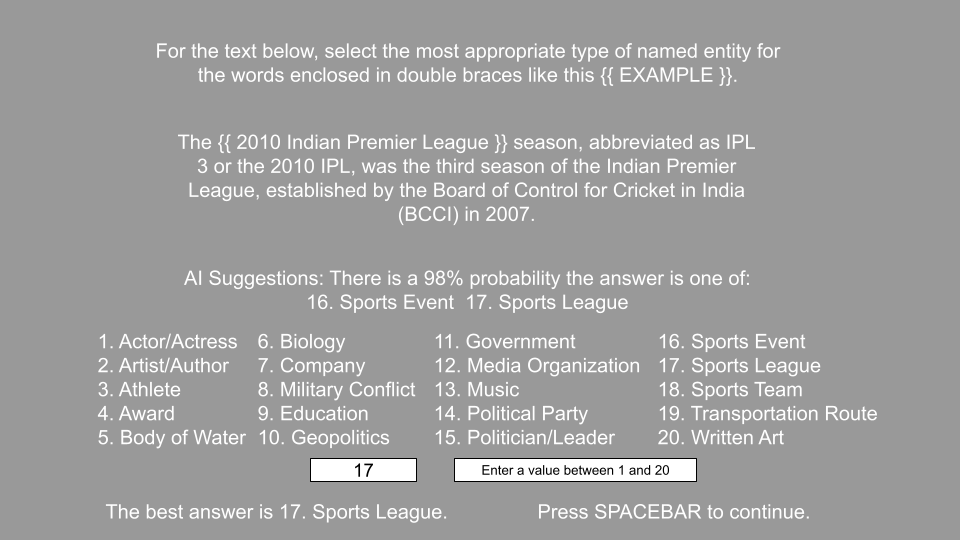
An example trial screen is shown in Figure 2, while complete descriptions of the tasks are given in Appendix B. On each trial the participant was shown a stimulus and all class labels, and was forced to classify as one of the labels. For the top- and conformal treatments, they were also shown a prediction set, along with the (empirical) coverage guarantee. The correct answer was displayed once the participant confirmed their decision. There was no time limit to enter responses, although for ObjectNet the stimulus was only shown for 0.22s, within the limits of human perception (Fraisse, 1984), to increase the difficulty of the task. The set of stimuli shown to each participant was drawn from , making each test randomized.
5 Results
5.1 Human Performance Measurement
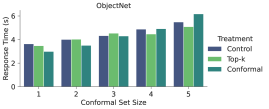
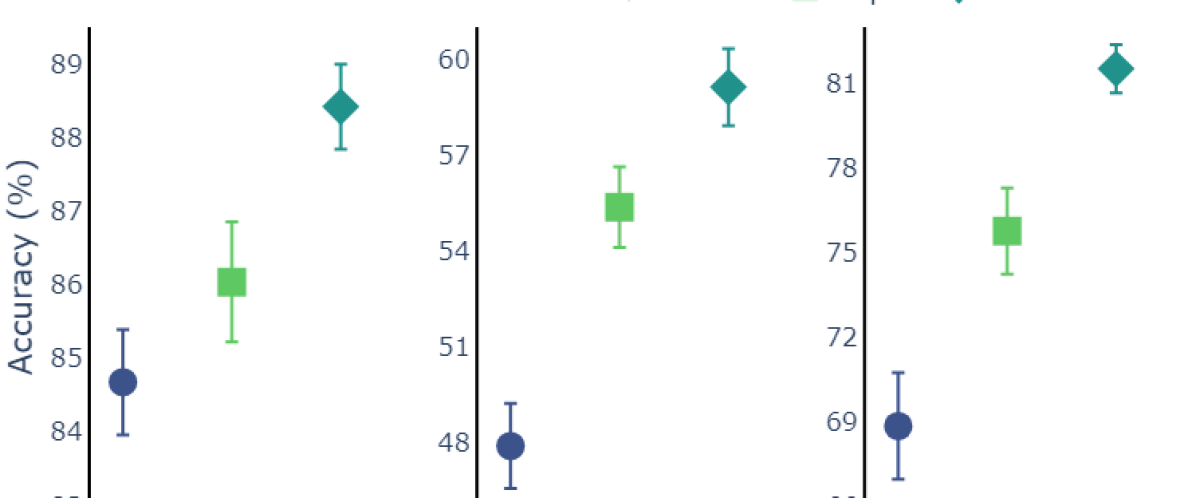
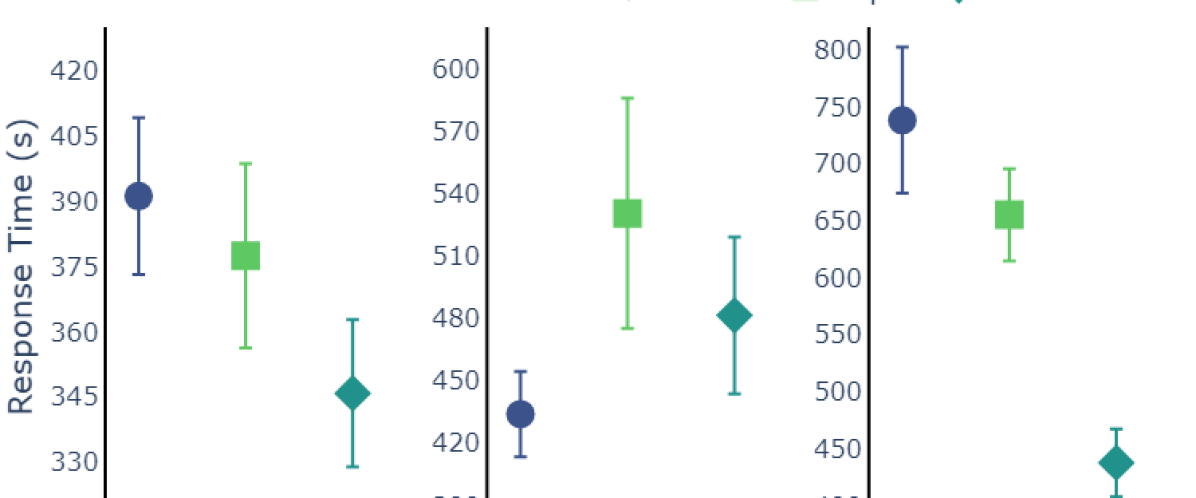
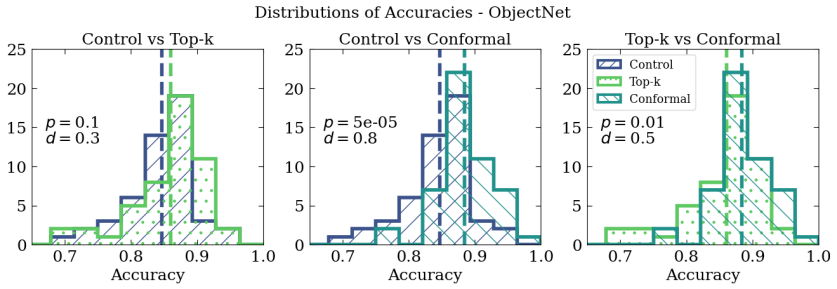
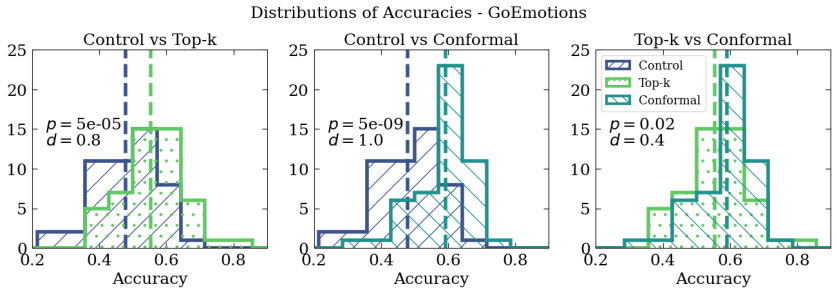
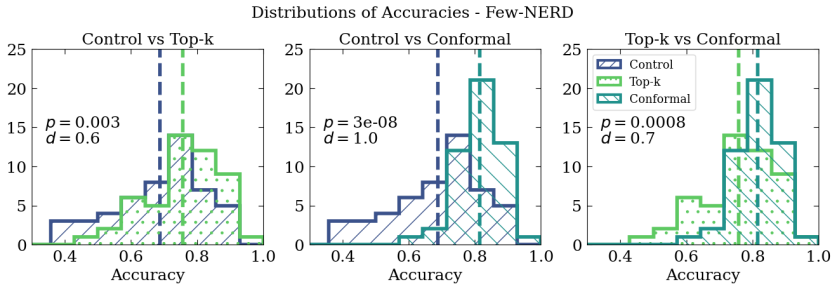
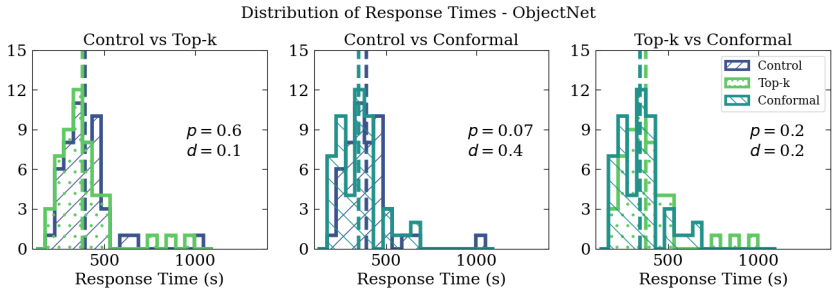
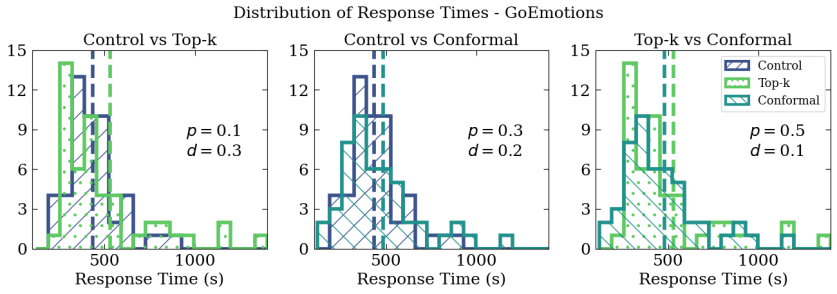
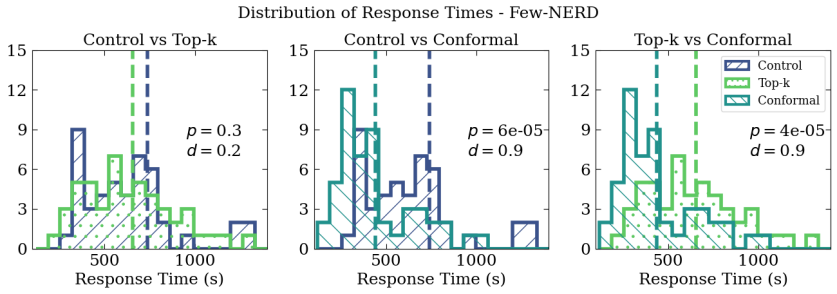
Our main experiment covered three tasks and three treatments, for which we recruited unique people each, totalling 450 paid participants. The results for mean accuracy across observations are shown in Figure 3, while Figure 4 shows the average time taken for participants to complete all test trials.
| ObjectNet | GoEmotions | Few-NERD | ||||
|---|---|---|---|---|---|---|
| Comparison | ||||||
| Top- Control | 0.3 | 0.8 | 0.6 | |||
| Conf. Control | 0.8 | 1.0 | 1.0 | |||
| Conf. Top- | 0.5 | 0.4 | 0.7 | |||
| ObjectNet | GoEmotions | Few-NERD | ||||
|---|---|---|---|---|---|---|
| Comparison | ||||||
| Top- vs. Control | 0.1 | 0.3 | 0.2 | |||
| Conf. vs. Control | 0.4 | 0.2 | 0.9 | |||
| Conf. vs. Top- | 0.2 | 0.1 | 0.9 | |||
For accuracy, we see that top- sets mostly do improve human performance compared to the control, while conformal sets lead to better performance than top- sets. To confirm these visual trends, we conducted pre-planned comparisons between pairs of treatments using -tests as described in Section 3. In all cases except one we reject the null hypothesis that the mean accuracy is the same between treatments, using the significance threshold (Table 2, non-significant results in red). Notably, for all three independent tasks we find statistically significant evidence that conformal prediction sets are more useful to humans than top- sets, with medium effect sizes () (Cohen, 2013). Because both types of prediction sets have the same (empirical) coverage, there are only two differences between the methods to which we can ascribe the improvement: conformal sets are smaller on average (Table 1), and conformal sets quantify uncertainty.
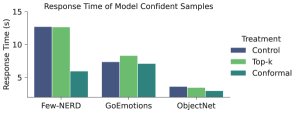
We also pre-planned comparisons between the treatments on the average response time. However, in viewing Figure 4 we do not see a consistent trend between all tasks. Conformal sets have the lowest average response time on two tasks, while the control treatment led to the fastest completions on GoEmotions. In most cases we do not reject the null hypothesis that the treatment has no effect on the mean response time (Table 3). The additional information provided as a prediction set must be processed by the user and incorporated into decision making, which can outweigh the speed advantages of receiving a curated shortlist.
The remainder of our analysis was not explicitly planned as part of our pre-registration, so is presented for insight without statistical analysis or claims of significance. Additional analysis of our data is given in Appendix C.
5.2 Ablations
Based on the results of our pre-registered experiment in Section 5.1, we conducted targeted ablations that independently varied two aspects of the conformal prediction framework, namely conformal set sizes and model performance. For GoEmotions we fixed the model, and performed conformal prediction with a less optimized RAPS procedure that produced larger average set sizes, while for ObjectNet we swapped out the CLIP ViT-L/14 for a weaker CLIP ViT-B/32. We re-ran three experiments (GoEmotions conformal, and ObjectNet top- and conformal) for which we recruited an additional unique people each, or 150 in total.
Conformal Set Size
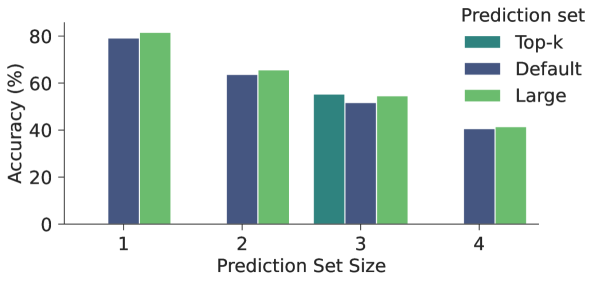
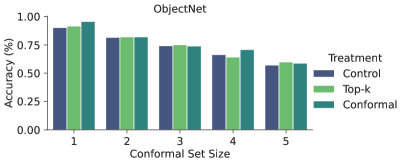
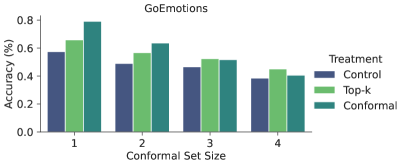
We explored the effect of conformal set size on human accuracy with GoEmotions by comparing two settings: the “default” setting used in our main experiment with an average conformal set size of 2.49 class labels, and the “large” setting with an average size of 2.77. With larger conformal sets, humans achieved lower accuracy, % compared to % with the default setting (cf. % for top-3 sets). This is consistent with the intuitive notion that smaller average set sizes should be more helpful for the same coverage guarantee.
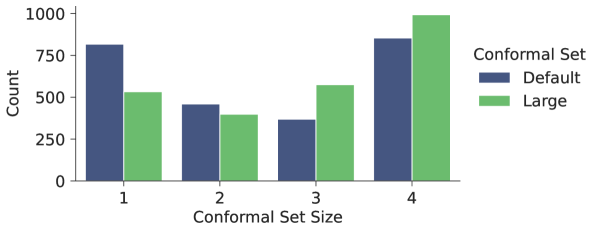
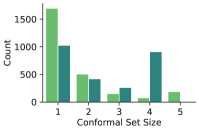
Examining the set size distribution between the two settings helps reveal the source of performance differences. As shown in Figure 5, human performance decreases on examples where prediction sets were larger, but importantly human performance conditioned on set size was comparable between the settings. By comparison, Figure 6 shows that the large setting generated fewer singleton sets where human accuracy is highest, resulting in the observed overall decrease in human accuracy. Optimizing for set sizes where human performance is highest is one way to improve the usefulness of conformal sets for humans.
Model Accuracy
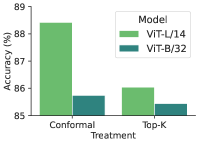
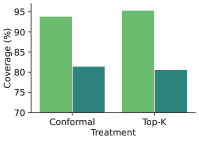
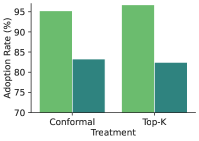
By swapping the ViT-L/14 model used in Section 5.1 for a weaker ViT-B/32, we can study the effect of model performance on the usefulness of both top- and conformal prediction sets. 7(a) shows conformal sets greatly enhanced human performance when using a superior underlying model, whereas for top- the improved model did not translate to as much human improvement. This is despite the empirical coverage (7(b)) increasing by a similar amount between the treatments (by design of our calibration). Furthermore, the rate at which humans chose an answer from the prediction set, which we call the adoption rate (7(c)), was consistently close to the empirical coverage (coverage was communicated to participants during the test). The outsized increase in accuracy for conformal when the better model was used is a function of the higher quality of sets that it produces; although coverage and adoption rates are the same, humans must still choose the correct answer out of the set when they adopt from it, which is much easier to do for singleton sets. The stronger model produces a distribution of conformal set sizes more skewed towards singleton sets (7(d)), whereas top- sets always use even with a more confident and correct model.
5.3 Insights
Role of Uncertainty
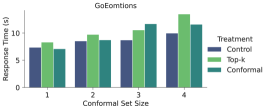
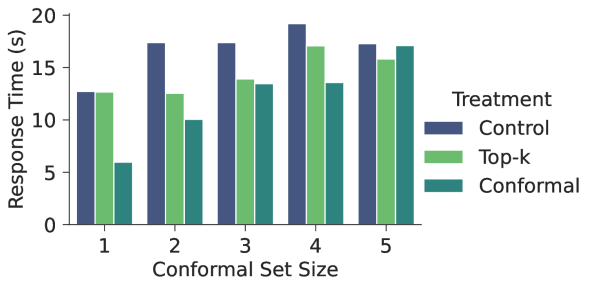
Within each task, some stimuli are more challenging than others which necessitates quantifying model uncertainty, in our case with the size of the conformal set. Since only the conformal treatment distinguishes examples by their difficulty, we can investigate the role of uncertainty quantification by comparing human performance across treatments conditional on conformal set size. In Figure 8 we show this for accuracy using Few-NERD for illustration, although the trends are consistent with the other two tasks (see Appendix C), and in Figure 9 we show the same for response times. Overall, we observe that conformal sets improve human decision making most compared to other treatments when the model expresses certainty through singleton conformal sets.
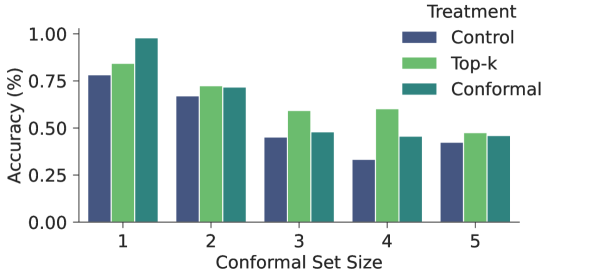
Based on the trends for the control treatment we see that humans and the model are aligned in which examples they find difficult, with larger set sizes correlating with worse human performance. This suggests that conformal prediction could be leveraged to identify samples that would be challenging for humans, allowing them to optimize their efforts by allocating more attention to these examples. In doing so, practitioners should be aware that the marginal coverage guarantee may not extend to sub-populations, such as those examples assigned large prediction sets.
Ensembling Effects
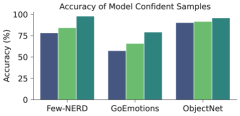
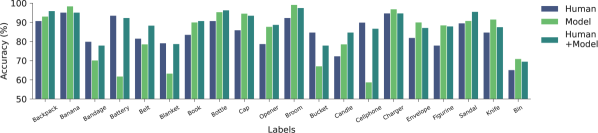
In Figure 3 we concluded that the combination of human and model (conformal treatment) outperforms humans alone (control) in terms of accuracy. Another relevant question is whether human-model teams outperform the model alone. From Table 1 we see that all treatments outperformed the top-1 accuracy of the model on ObjectNet, but the reverse is true on GoEmotions and Few-NERD. In Figure 10 we examine this comparison in more detail using per-class accuracies for ObjectNet. We see high variance in the model’s per-class accuracy, possibly due to the zero-shot nature of predictions we implemented, whereas humans were more consistent (standard deviation vs. ). Notably, low model accuracy (Bandage, Battery, Blanket, Bucket, Cellphone) tended to drag down the human-model team compared to humans alone. This is a point of caution for implementing human-in-the-loop systems, as poor model performance or biases against certain groups may not be completely overcome by humans. However, when the model outperformed the humans, the human-model team also tends to benefit, sometimes surpassing both individual partners (Backpack, Book, Bottle, Opener, Candle, Sandal). Hence there is a type of ensembling effect (Dietterich, 2000) where one partner’s weaknesses can be corrected by the other.
Adoption Rate
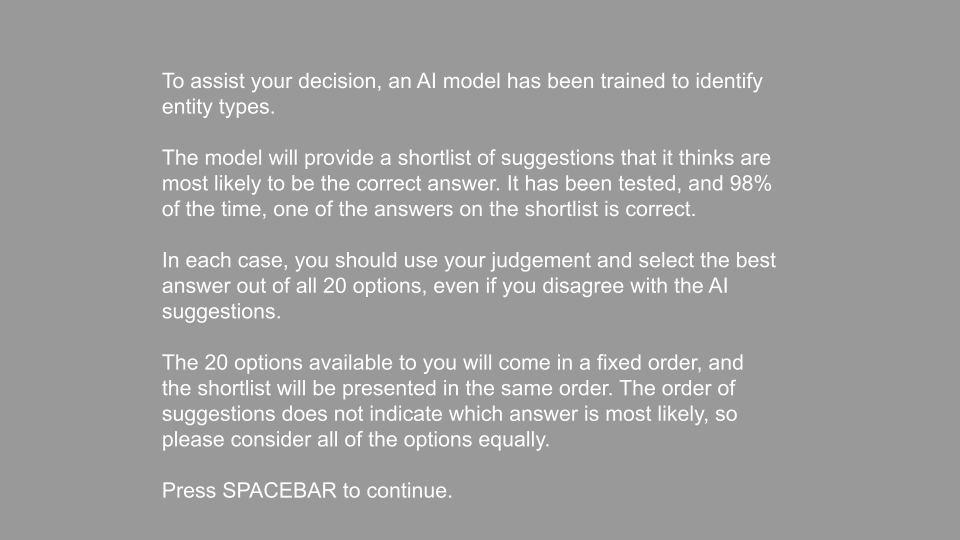
Participants in the top- and conformal treatment groups were informed that the prediction sets they were shown contained the true answer with probability , but were not constrained in how they chose their answers. As shown in Table 4, participants given conformal sets chose their answer from the set at an adoption rate very similar to the set’s stated coverage guarantee, whereas reliance on top- sets was higher than expected. This may suggest that the distributional information of variable-sized conformal sets better communicates when sets can be trusted.
| Task | Top- | Conformal | |
|---|---|---|---|
| ObjectNet | 94 | 97 | 95 |
| GoEmotions | 92 | 94 | 92 |
| Few-NERD | 98 | 99 | 99 |
6 Conclusion and Outlook
It is easy to assume without further reflection that uncertainty quantification through conformal prediction will make model predictions more useful to humans. However, in science we must not blindly follow such assumptions without evidence to support them. In this work, we conducted a scientific study to verify the intuitive notion that providing prediction sets from models can improve human decision making. By recruiting 600 paid participants across all tests, and collecting a total of 42,500 individual responses, we found statistically significant evidence that conformal prediction sets can improve human accuracy on classification tasks, both compared to no assistance, and to top- sets. Since we controlled for the level of empirical coverage provided by conformal and top- sets, we ascribe the improvements in accuracy to two factors: conformal sets have smaller average set sizes, and they quantify model uncertainty via their distribution of set sizes. In contrast to accuracy, we did not find consistent evidence that conformal sets increase decision making speed. A possible explanation is that parsing prediction sets can increase the amount of cognitive processing required to make an informed decision.
Our work informs the design of human-in-the-loop decision pipelines (Wu et al., 2022), which we point out are a natural solution to the problem that set-valued predictions may not be actionable. Including a human into decision pipelines can mitigate some of the concerns around the trustworthiness of machine learning models. For example, more advanced machine learning methods are often less explainable (Linardatos et al., 2021), whereas humans could articulate their thought process even when aided by prediction sets. Neural networks are infamously susceptible to adversarial examples (Biggio et al., 2013; Szegedy et al., 2013; Goodfellow et al., 2014), which, by definition, do not fool humans, making a human-in-the-loop perhaps the most robust defense to adversarial attacks. Still, there are limitations to human-in-the-loop systems. On two out of three tasks, top-1 model accuracy was higher than what humans achieved (even with model assistance). We also found that when a model performs particularly poorly on groups within the data, prediction sets can drag down human performance on those groups. This could manifest as a transfer of biases from models to humans, and reinforces that the fairness of models still needs to be considered even with a human-in-the-loop (Mehrabi et al., 2021).
Finally, while we only covered classification tasks in this study, it would be interesting to examine the compatibility of humans with conformal prediction for regression and time series problems. We also only considered tasks that could be completed by the general population. Our society still relies on experts, such as medical doctors, for many critical decisions and is not prepared to accept the risks of automating them. However, there are potentially great benefits to augmenting the skills of experts by providing information from a model in the form of conformal prediction sets, leaving ultimate control in the hands of the experts (Tizhoosh & Pantanowitz, 2018; Kompa et al., 2021).
7 Impact Statement
Our work promotes the integration of humans into decision making pipelines as a means to mitigate negative impacts of untrustworthy machine learning. As such, we do not foresee negative societal impacts of our study. We provide a complete description of research ethics for our human subject experiments in Appendix B.
References
- Aarsen (2023) Aarsen, T. Spanmarker for named entity recognition, 2023. Master Thesis - Radboud University.
- Aarsen (2024) Aarsen, T. https://huggingface.co/tomaarsen/span-marker-roberta-large-fewnerd-fine-super, 2024. Accessed 2024-01-24.
- Abdar et al. (2021) Abdar, M., Pourpanah, F., Hussain, S., Rezazadegan, D., Liu, L., Ghavamzadeh, M., Fieguth, P., Cao, X., Khosravi, A., Acharya, U. R., Makarenkov, V., and Nahavandi, S. A review of uncertainty quantification in deep learning: Techniques, applications and challenges. Information Fusion, 76:243–297, 2021. doi: https://doi.org/10.1016/j.inffus.2021.05.008.
- Agarwal et al. (2023) Agarwal, N., Moehring, A., Rajpurkar, P., and Salz, T. Combining human expertise with artificial intelligence: Experimental evidence from radiology. Working Paper 31422, National Bureau of Economic Research, July 2023.
- Alvarsson et al. (2021) Alvarsson, J., McShane, S. A., Norinder, U., and Spjuth, O. Predicting with confidence: Using conformal prediction in drug discovery. Journal of Pharmaceutical Sciences, 110(1):42–49, 2021.
- Angelopoulos & Bates (2021) Angelopoulos, A. N. and Bates, S. A gentle introduction to conformal prediction and distribution-free uncertainty quantification. arXiv:2107.07511, 2021.
- Angelopoulos et al. (2021) Angelopoulos, A. N., Bates, S., Jordan, M., and Malik, J. Uncertainty sets for image classifiers using conformal prediction. In International Conference on Learning Representations, 2021.
- Ashukha et al. (2020) Ashukha, A., Lyzhov, A., Molchanov, D., and Vetrov, D. Pitfalls of in-domain uncertainty estimation and ensembling in deep learning. In International Conference on Learning Representations, 2020.
- Babbar et al. (2022) Babbar, V., Bhatt, U., and Weller, A. On the Utility of Prediction Sets in Human-AI Teams. In Proceedings of the Thirty-First International Joint Conference on Artificial Intelligence, pp. 2457–2463, 7 2022. doi: 10.24963/ijcai.2022/341.
- Bai et al. (2021) Bai, Y., Mei, S., Wang, H., and Xiong, C. Don’t just blame over-parametrization for over-confidence: Theoretical analysis of calibration in binary classification. In International Conference on Machine Learning, pp. 566–576. PMLR, 2021.
- Barbu et al. (2019) Barbu, A., Mayo, D., Alverio, J., Luo, W., Wang, C., Gutfreund, D., Tenenbaum, J., and Katz, B. ObjectNet: A large-scale bias-controlled dataset for pushing the limits of object recognition models. In Advances in Neural Information Processing Systems, volume 32, 2019.
- Beach (1993) Beach, L. R. Broadening the definition of decision making: The role of prechoice screening of options. Psychological Science, 4(4):215–220, 1993.
- Berlyne (1962) Berlyne, D. E. Uncertainty and epistemic curiosity. British Journal of Psychology, 53(1):27–34, 1962.
- Biggio et al. (2013) Biggio, B., Corona, I., Maiorca, D., Nelson, B., Šrndić, N., Laskov, P., Giacinto, G., and Roli, F. Evasion attacks against machine learning at test time. In Machine Learning and Knowledge Discovery in Databases: European Conference, pp. 387–402, 2013.
- Blundell et al. (2015) Blundell, C., Cornebise, J., Kavukcuoglu, K., and Wierstra, D. Weight uncertainty in neural network. In International Conference on Machine Learning, pp. 1613–1622. PMLR, 2015.
- Choy et al. (2018) Choy, G., Khalilzadeh, O., Michalski, M., Do, S., Samir, A. E., Pianykh, O. S., Geis, J. R., Pandharipande, P. V., Brink, J. A., and Dreyer, K. J. Current applications and future impact of machine learning in radiology. Radiology, 288(2):318–328, 2018. doi: 10.1148/radiol.2018171820.
- Chzhen et al. (2021) Chzhen, E., Denis, C., Hebiri, M., and Lorieul, T. Set-valued classification–overview via a unified framework. arXiv:2102.12318, 2021.
- Cohen (2013) Cohen, J. Statistical power analysis for the behavioral sciences. Academic press, 2013.
- Demszky et al. (2020) Demszky, D., Movshovitz-Attias, D., Ko, J., Cowen, A., Nemade, G., and Ravi, S. GoEmotions: A dataset of fine-grained emotions. In Proceedings of the 58th Annual Meeting of the Association for Computational Linguistics, pp. 4040–4054, July 2020. doi: 10.18653/v1/2020.acl-main.372.
- Derczynski et al. (2016) Derczynski, L., Bontcheva, K., and Roberts, I. Broad Twitter corpus: A diverse named entity recognition resource. In Matsumoto, Y. and Prasad, R. (eds.), Proceedings of the 26th International Conference on Computational Linguistics: Technical Papers, pp. 1169–1179, Osaka, Japan, December 2016.
- Dietterich (2000) Dietterich, T. G. Ensemble methods in machine learning. In International Workshop on Multiple Classifier Systems, pp. 1–15. Springer, 2000.
- Ding et al. (2021) Ding, N., Xu, G., Chen, Y., Wang, X., Han, X., Xie, P., Zheng, H., and Liu, Z. Few-NERD: A few-shot named entity recognition dataset. In Proceedings of the 59th Annual Meeting of the Association for Computational Linguistics and the 11th International Joint Conference on Natural Language Processing (Volume 1: Long Papers), pp. 3198–3213, August 2021. doi: 10.18653/v1/2021.acl-long.248.
- Douglas et al. (2023) Douglas, B. D., Ewell, P. J., and Brauer, M. Data quality in online human-subjects research: Comparisons between MTurk, Prolific, CloudResearch, Qualtrics, and SONA. PLOS ONE, 18(3):e0279720, 2023.
- Eklund et al. (2015) Eklund, M., Norinder, U., Boyer, S., and Carlsson, L. The application of conformal prediction to the drug discovery process. Annals of Mathematics and Artificial Intelligence, 74:117–132, 2015.
- Eyal et al. (2021) Eyal, P., David, R., Andrew, G., Zak, E., and Ekaterina, D. Data quality of platforms and panels for online behavioral research. Behavior Research Methods, pp. 1–20, 2021.
- Fraisse (1984) Fraisse, P. Perception and estimation of time. Annual Review of Psychology, 35(1):1–37, 1984.
- Gal & Ghahramani (2016) Gal, Y. and Ghahramani, Z. Dropout as a Bayesian approximation: Representing model uncertainty in deep learning. In International Conference on Machine Learning, pp. 1050–1059. PMLR, 2016.
- Goodfellow et al. (2014) Goodfellow, I. J., Shlens, J., and Szegedy, C. Explaining and harnessing adversarial examples. arXiv:1412.6572, 2014.
- Graves (2011) Graves, A. Practical variational inference for neural networks. In Advances in Neural Information Processing Systems, volume 24, 2011.
- Grycko (1993) Grycko, E. Classification with set-valued decision functions. In Information and Classification, pp. 218–224. Springer Berlin Heidelberg, 1993. ISBN 978-3-642-50974-2.
- Guo et al. (2017) Guo, C., Pleiss, G., Sun, Y., and Weinberger, K. Q. On calibration of modern neural networks. In International Conference on Machine Learning, pp. 1321–1330. PMLR, 2017.
- Kompa et al. (2021) Kompa, B., Snoek, J., and Beam, A. L. Second opinion needed: Communicating uncertainty in medical machine learning. NPJ Digital Medicine, 4(1):4, 2021.
- Kumar et al. (2023) Kumar, B., Lu, C., Gupta, G., Palepu, A., Bellamy, D., Raskar, R., and Beam, A. Conformal prediction with large language models for multi-choice question answering. arXiv preprint arXiv:2305.18404, 2023.
- Lakshminarayanan et al. (2017) Lakshminarayanan, B., Pritzel, A., and Blundell, C. Simple and scalable predictive uncertainty estimation using deep ensembles. In Advances in Neural Information Processing Systems, volume 30, 2017.
- Linardatos et al. (2021) Linardatos, P., Papastefanopoulos, V., and Kotsiantis, S. Explainable ai: A review of machine learning interpretability methods. Entropy, 23(1), 2021. doi: 10.3390/e23010018.
- Liu et al. (2019) Liu, Y., Ott, M., Goyal, N., Du, J., Joshi, M., Chen, D., Levy, O., Lewis, M., Zettlemoyer, L., and Stoyanov, V. RoBERTa: A robustly optimized BERT pretraining approach. arXiv:1907.11692, 2019.
- Lowe (2024) Lowe, S. https://huggingface.co/samlowe/roberta-base-go_emotions, 2024. URL https://huggingface.co/SamLowe/roberta-base-go_emotions. Accessed 2024-01-24.
- Mackay (1992) Mackay, D. J. C. Bayesian methods for adaptive models. California Institute of Technology, 1992.
- Mehrabi et al. (2021) Mehrabi, N., Morstatter, F., Saxena, N., Lerman, K., and Galstyan, A. A survey on bias and fairness in machine learning. ACM Comput. Surv., 54(6), jul 2021. doi: 10.1145/3457607.
- Minderer et al. (2021) Minderer, M., Djolonga, J., Romijnders, R., Hubis, F., Zhai, X., Houlsby, N., Tran, D., and Lucic, M. Revisiting the calibration of modern neural networks. Advances in Neural Information Processing Systems, 34:15682–15694, 2021.
- Mitra et al. (2015) Mitra, T., Hutto, C., and Gilbert, E. Comparing Person- and Process-Centric Strategies for Obtaining Quality Data on Amazon Mechanical Turk. In Proceedings of the 33rd Annual ACM Conference on Human Factors in Computing Systems, pp. 1345–1354, 2015. doi: 10.1145/2702123.2702553.
- Neal (2012) Neal, R. M. Bayesian Learning for Neural Networks, volume 118. Springer Science & Business Media, 2012.
- Pavlovia (2024) Pavlovia. https://www.pavlovia.org/, 2024. URL https://www.pavlovia.org/. Accessed 2024-01-24.
- Peirce et al. (2019) Peirce, J., Gray, J. R., Simpson, S., MacAskill, M., Höchenberger, R., Sogo, H., Kastman, E., and Lindeløv, J. K. PsychoPy2: Experiments in behavior made easy. Behavior Research Methods, 51(1):195–203, Feb 2019. doi: 10.3758/s13428-018-01193-y.
- Prolific (2024) Prolific. https://www.prolific.com/, 2024. URL https://www.prolific.com/. Accessed 2024-01-24.
- Radford et al. (2021) Radford, A., Kim, J. W., Hallacy, C., Ramesh, A., Goh, G., Agarwal, S., Sastry, G., Askell, A., Mishkin, P., Clark, J., Krueger, G., and Sutskever, I. Learning transferable visual models from natural language supervision. In Proceedings of the 38th International Conference on Machine Learning, volume 139, pp. 8748–8763. PMLR, 18–24 Jul 2021.
- Ren et al. (2023) Ren, A. Z., Dixit, A., Bodrova, A., Singh, S., Tu, S., Brown, N., Xu, P., Takayama, L., Xia, F., Varley, J., Xu, Z., Sadigh, D., Zeng, A., and Majumdar, A. Robots that ask for help: Uncertainty alignment for large language model planners. In Proceedings of The 7th Conference on Robot Learning, volume 229, pp. 661–682. PMLR, 06–09 Nov 2023.
- Romano et al. (2020) Romano, Y., Sesia, M., and Candes, E. Classification with valid and adaptive coverage. In Advances in Neural Information Processing Systems, volume 33, pp. 3581–3591, 2020.
- Shafer & Vovk (2008) Shafer, G. and Vovk, V. A tutorial on conformal prediction. Journal of Machine Learning Research, 9(3), 2008.
- Smith (2013) Smith, R. C. Uncertainty quantification: Theory, Implementation, and Applications, volume 12. SIAM, 2013.
- Smith & Clark (1993) Smith, V. L. and Clark, H. H. On the course of answering questions. Journal of Memory and Language, 32(1):25–38, 1993. ISSN 0749-596X. doi: https://doi.org/10.1006/jmla.1993.1002.
- Soize (2017) Soize, C. Uncertainty Quantification. Springer, 2017.
- Stankeviciute et al. (2021) Stankeviciute, K., M Alaa, A., and van der Schaar, M. Conformal time-series forecasting. In Advances in Neural Information Processing Systems, volume 34, pp. 6216–6228, 2021.
- Stein et al. (2023) Stein, G., Cresswell, J. C., Hosseinzadeh, R., Sui, Y., Ross, B. L., Villecroze, V., Liu, Z., Caterini, A. L., Taylor, E., and Loaiza-Ganem, G. Exposing flaws of generative model evaluation metrics and their unfair treatment of diffusion models. In Thirty-seventh Conference on Neural Information Processing Systems, 2023.
- Straitouri & Rodriguez (2023) Straitouri, E. and Rodriguez, M. G. Designing decision support systems using counterfactual prediction sets. arXiv:2306.03928, 2023.
- Straitouri et al. (2023) Straitouri, E., Wang, L., Okati, N., and Gomez Rodriguez, M. Improving expert predictions with conformal prediction. In International Conference on Machine Learning, volume 202, pp. 32633–32653, 2023.
- Sullivan (2015) Sullivan, T. J. Introduction to Uncertainty Quantification. Springer, 2015.
- Szegedy et al. (2013) Szegedy, C., Zaremba, W., Sutskever, I., Bruna, J., Erhan, D., Goodfellow, I., and Fergus, R. Intriguing properties of neural networks. arXiv:1312.6199, 2013.
- Tizhoosh & Pantanowitz (2018) Tizhoosh, H. R. and Pantanowitz, L. Artificial intelligence and digital pathology: Challenges and opportunities. Journal of Pathology Informatics, 9(1):38, 2018. doi: https://doi.org/10.4103/jpi.jpi˙53˙18.
- Vovk et al. (1999) Vovk, V., Gammerman, A., and Saunders, C. Machine-learning applications of algorithmic randomness. In International Conference on Machine Learning, pp. 444–453, 1999.
- Vovk et al. (2005) Vovk, V., Gammerman, A., and Shafer, G. Algorithmic Learning in a Random World. Springer, 2005.
- Welch (1947) Welch, B. L. The generalization of ‘Student’s’problem when several different population variances are involved. Biometrika, 34(1-2):28–35, 1947.
- Wu et al. (2022) Wu, X., Xiao, L., Sun, Y., Zhang, J., Ma, T., and He, L. A survey of human-in-the-loop for machine learning. Future Generation Computer Systems, 135:364–381, 2022. doi: https://doi.org/10.1016/j.future.2022.05.014.
- Xu & Xie (2021) Xu, C. and Xie, Y. Conformal prediction interval for dynamic time-series. In International Conference on Machine Learning, pp. 11559–11569. PMLR, 2021.
- Zaffran et al. (2022) Zaffran, M., Féron, O., Goude, Y., Josse, J., and Dieuleveut, A. Adaptive conformal predictions for time series. In International Conference on Machine Learning, pp. 25834–25866. PMLR, 2022.
- Zhan et al. (2020) Zhan, X., Wang, Z., Yang, M., Luo, Z., Wang, Y., and Li, G. An electronic nose-based assistive diagnostic prototype for lung cancer detection with conformal prediction. Measurement, 158:107588, 2020.
Appendix A Implementation Details
A.1 Dataset Pre-processing
High level statistics about the calibration and test datasets are given in Table 5. Below, we give complete details on the pre-processing applied to each dataset. All pre-processing including calibration and generation of conformal sets was carried out with an Intel Xeon Silver 4114 CPU and TITAN V GPU and takes under 3 hours. We provide the code to generate all datasets at at this GitHub repository for reproducibility.
| Dataset | Total Classes | Used Classes () | ||
|---|---|---|---|---|
| ObjectNet | 2000 | 2620 | 313 | 20 |
| GoEmotions | 1180 | 1030 | 28 | 10 |
| Few-NERD | 5000 | 2000 | 66 | 20 |
ObjectNet
Since ObjectNet is comprised of only a test set (50,000 images), we split it to obtain images for calibration. First, we selected the most common classes from all 313 to ensure humans could easily parse all the listed classes. The resulting classes were: [‘Backpack’, ‘Banana’, ‘Bandage’, ‘Battery’, ‘Belt’, ‘Blanket’, ‘Book’, ‘Bottle’, ‘Bottle Cap’, ‘Bottle Opener’, ‘Broom’, ‘Bucket’, ‘Candle’, ‘Cellphone’, ‘Cellphone Charger’, ‘Envelope’, ‘Figurine’, ‘Sandal’, ‘Knife’, ‘Trash Bin’]. We then separated the selected samples into calibration and test datasets, reserving 2000 samples for calibration with the remaining samples used for testing. During splitting, we additionally performed stratified sampling on both the calibration and test sets separately to ensure that classes were balanced. As both calibration and test sets were treated the same way, they can be considered i.i.d. for conformal prediction. Finally, each image was resized via bicubic and center-cropping transformations to pixels following the image processing pipeline of CLIP (Radford et al., 2021) so that both the model and humans were presented with consistent images. ObjectNet is released under a license that permits free use for research purposes.
GoEmotions
We used the original validation dataset for conformal calibration and the original test set as our test set. For pre-processing, we kept only the sentences with a single label and removed any sentences containing emojis, as emojis were incompatible with PsychoPy. Then, to make the task more manageable for human evaluators, we picked the most common sentiment classes based on the calibration set [‘Admiration’, ‘Gratitude’, ‘Approval’, ‘Disapproval’, ‘Amusement’, ‘Annoyance’, ‘Curiosity’, ‘Love’, ‘Optimism’, ‘Neutral’] out of the 28 overall classes. Finally we performed stratified sampling on both calibration and test sets so that the selected classes were balanced. As both calibration and test sets were treated the same way, they can be considered i.i.d. for conformal prediction. The resulting datasets contained 1180 calibration samples and 1030 test samples. GoEmotions is released under a license that permits free use for research purposes.
Few-NERD
We used the validation and test sets that are defined in the supervised variant of Few-NERD as our calibration and test sets, respectively. We first filtered out text examples that contained non-ASCII characters because of limitations when displaying through PsychoPy. We also filtered out examples where the longest named entity spans more than 8 words, where the entire example is longer than 60 words, and where the named entity is presented without any context. Then we selected the most common classes which were [‘person-actor’, ‘person-artist/author’, ‘person-athlete’, ‘other-award’, ‘location-bodiesofwater’, ‘other-biologything’, ‘organization-company’, ‘event-attack/battle/war/militaryconflict’, ‘organization-education’, ‘location-GPE’, ‘organization-government/governmentagency’, ‘organization-media/newspaper’, ‘art-music’, ‘organization-politicalparty’, ‘person-politician’, ‘event-sportsevent’, ‘organization-sportsleague’, ‘organization-sportsteam’, ‘location-road/railway/highway/transit’, ‘art-writtenart’]. For presentation to humans we relabeled these classes as [‘Actor/Actress’, ‘Artist/Author’, ‘Athlete’, ‘Award’, ‘Body of Water’, ‘Biology’, ‘Company’, ‘Military Conflict’, ‘Education’, ‘Geopolitics’, ‘Government’, ‘Media Organization’, ‘Music’, ‘Political Party’, ‘Politician/Leader’, ‘Sports Event’, ‘Sports League’, ‘Sports Team’, ‘Transportation Route’, ‘Written Art’]. We performed stratified sampling separately on the validation and test datasets to balance their classes such that a single named entity was selected and highlighted for examples that contained multiple. Hence this became a balanced multi-class classification task. Finally, we reduced the size of the test set because only 2,500 individual trials were planned for each treatment ( participants, trials each). Throughout the process the calibration and test sets were treated the same way, so we can consider them i.i.d. for conformal prediction. The final datasets comprised 5000 calibration samples and 2000 test samples. Few-NERD is released under a license that permits free use for research purposes.
In our pre-registration at osf.io/fkdhv, we stated that one of the three datasets used would be Broad Twitter Corpus (Derczynski et al., 2016), an NER task gathered from Twitter data. However, upon preparing this dataset for experiments, we determined it to be unsuitable because it contained many non-English example sentences, despite claims in (Derczynski et al., 2016) that it used English language tweets. We replaced Broad Twitter Corpus with another NER dataset, Few-NERD, which contained only English sentences from Wikipedia.
A.2 Conformal Prediction Method and Hyperparameters
To generate conformal prediction sets we used the well-known RAPS procedure (Angelopoulos et al., 2021), which provably produces sets of lower average size than the top- method for an equivalent coverage level. RAPS has three hyperparameters: a temperature used for scaling the model’s logits before applying the softmax; a set size regularizer ; and a regularization weight .
Defining as the total probability mass of the set of labels more likely than for input , and as the ranking of among labels based on softmax scores , the RAPS procedure constructs prediction sets as
| (5) |
where is a uniform random variable. In essence, RAPS defines the score function as a sum of three terms involving the probability mass of more likely classes, the probability of the input class (randomly weighted), and a regularizer that promotes small set sizes by imposing an extra penalty to add classes when have already been included.
We summarize the hyperparameters of our experiments in Table 6. Also shown is the empirical risk achieved by the top- sets, which was then used as for conformal calibration.
| Dataset | |||||
|---|---|---|---|---|---|
| ObjectNet | 3 | 0.5 | 0.002 | 5 | 0.065 |
| ObjectNet Ablation | 3 | 0.3 | 0.005 | 4 | 0.195 |
| GoEmotions | 3 | 0.5 | 0.3 | 4 | 0.085 |
| GoEmotions Ablation | 3 | 0.5 | 1.3 | 4 | 0.085 |
| Few-NERD | 3 | 0.5 | 0.3 | 5 | 0.021 |
Appendix B Human Subject Experiments
In this section we provide additional details on our human subject experiments to complement the descriptions in Sections 3 and 4. We plan to release our aggregated experimental data upon publication.
Ethical Considerations
When running any experiment involving human subjects, ethical considerations are of utmost importance. We considered research ethics through the experimental process, and followed the ethics guidelines for experiments involving humans published by the NeurIPS 2023 conference organizers. In particular, we followed all existing protocols at our institution for such research. Although our institution does not have an internal review board (IRB) process, in its place we took the following steps: understanding the existing process in place at our institution, ensuring that our datasets only contained content appropriate for showing participants, piloting the tests ourselves, informing participants about what data would be collected and what data they would be shown, collecting consent from participants, paying participants a fair wage, and evaluating the demographic distribution of participants in our experiments to be aware of potential biases.
Participant Recruitment and Compensation
We recruited participants through Prolific, which produces the highest quality data according to scientific comparisons of behavioural data collection platforms (Eyal et al., 2021; Douglas et al., 2023). We did not filter the population accepted into our study, other than that we required fluency in English, the language we used for task instructions. When participants voluntarily agreed to join our study, they were randomly assigned to one of three tasks, and one of three treatments. No participant was involved in more than one test. In total, we recruited and paid 600 participants. Compensation followed the guidelines enforced by Prolific. Participants were promised a flat amount of pay based on the median completion time of the test, and were also offered bonus pay proportional to the number of correct answers they gave as a financial incentive to perform well on the tasks. Overall, the average rate of pay was 7.80 GBP/hr, and 1500 GBP was spent on participant compensation in total, exclusive of fees.
All 600 participants consented to the collection and dissemination-in-aggregate of their demographic data. As seen in Table 7, our study population was approximately balanced in terms of gender (58% Male, 42% Female), and covered a wide range of ages. Since all the tasks we designed relied only on general human knowledge (and fluency in English), we do not expect any effect of age or gender on task performance (here measured by accuracy). To verify this null hypothesis, we compare the normalized accuracy for each group in Table 7. Because each task and treatment may have a different inherent difficulty, we normalize the accuracy within each task/treatment cohort before aggregating over demographic groups. We show the mean and standard deviation, where a value of 1 indicates the population performed 1 standard deviation above the mean of their cohort. Unsurprisingly, the results are consistent with there being no effect of gender or age on task performance.
| Group | # Participants | Normalized Accuracy | |
|---|---|---|---|
| Age group | 33 | ||
| 20-29 | 407 | ||
| 30-39 | 95 | ||
| 40-49 | 37 | ||
| 50-59 | 20 | ||
| 8 | |||
| Sex | Male | 345 | |
| Female | 253 | ||
| Other | 2 |
Experiment Details
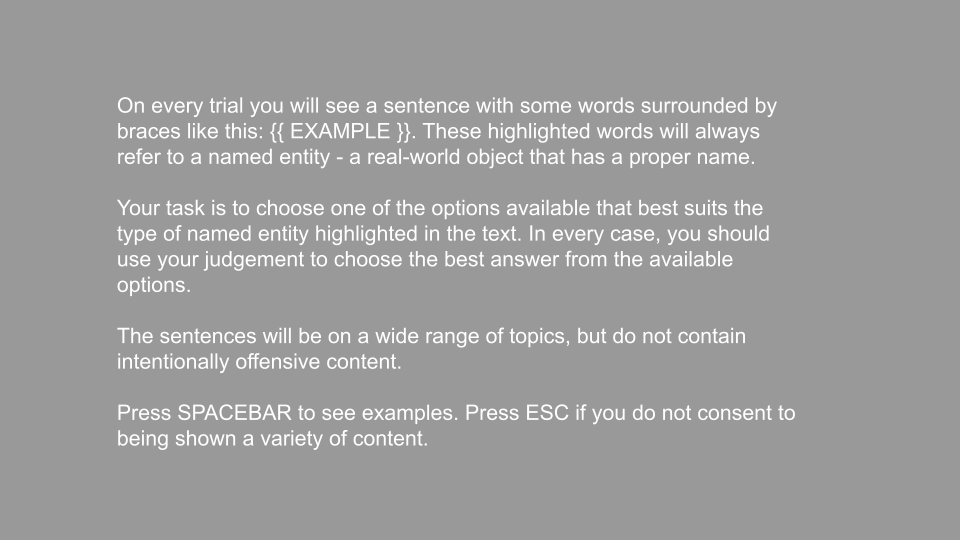
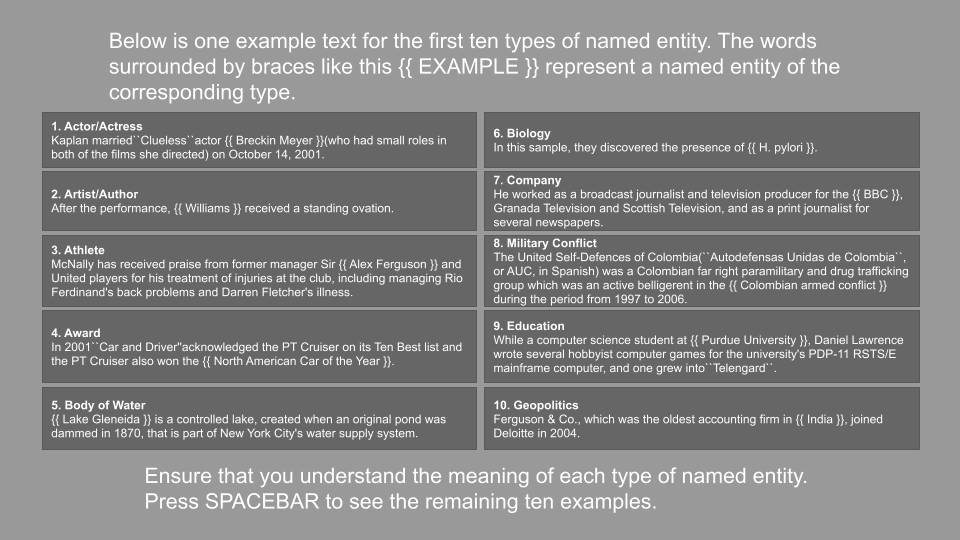
Participants were required to use a desktop or laptop computer to complete our experiment (not a mobile device or tablet). To begin, participants were shown a statement on the data we were collecting, including information on how we planned to store, disseminate, and release that data publicly for scientific purposes. Participants had the option to consent to this treatment, or remove themselves from the study (see Figure 11). We did not collect Personal Identifiable Information (PII) such as name, address, birth date, governmental identification numbers, or banking information. There were no potential risks of participating that we needed to disclose to participants. Then, instructions were shown introducing the task, and we provided labelled examples of each class. Next, participants went through 20 practice trials of the same format as the actual test so they could further learn about the dataset and classes. Example and practice stimuli were taken from , were the same for all participants, and were never reselected as a test trial. Finally, the test trials were conducted using randomized samples from ; for both GoEmotions and Few-NERD trials were used, while for ObjectNet we assigned trials because they could be completed more quickly. Our experimental data is based only on the test trials. Figure 13 shows the screens that were displayed to participants in the Few-NERD experiment; the other two experiments followed the same template, and examples of their main trial screens are given in Figure 2 and Figure 12.


Each trial showed the participant a stimulus and all possible classes , forcing the participant to choose one class with unlimited time to make their choice. For ObjectNet, the stimuli were only shown for 0.22 s to increase the difficulty of the task. Participants were given the correct answer after they responded, both during the practice and testing phase. Training of this kind has been shown to have a large positive effect on the quality of data collected (Mitra et al., 2015). It is possible that the participant may learn about the task while taking the test and change the way they answer to maximize accuracy. We see this as a desirable effect; ultimately we want participants to perform as well as possible. Additional justifications for providing correct answers during the testing phase are given in (Stein et al., 2023).
Due to inherent differences in the datasets, there were small adjustments made to each task. In all cases and were exactly class balanced through stratification. For GoEmotions, classes were used, while was chosen for the other tests. Because we implement a forced choice test, increasing increases the difficulty of the task, as additional possible answers can confound the true label. In preliminary testing we found GoEmotions to be the hardest task already at , and this is borne out in Figure 3. For the tests with , randomly sampling stimuli from can result in a very skewed distribution of classes which subsequently adds variance to the difficulty of the test seen by any individual (for example, Figure 10 shows that there is variation in the accuracy of responses by class for ObjectNet). Hence, for these tests we performed stratified sampling from for the stimuli shown to each participant. Our GoEmotions experiment was conducted in a manner that could be completed very quickly if the participant did not attempt to provide accurate responses. To prevent delinquency, we incorporated two attention checks in accordance with the design principles laid out by Prolific. Participants were rejected from the study and replaced if they failed both attention checks, as planned in our pre-registration. In total, one participant failed both attention checks.
Appendix C Additional Analysis
In this Appendix, we provide additional analysis on the data we collected, in support of Section 5.
Figure 3 summarized our main experimental results regarding human accuracy on our tasks. In Figure 14 we show the histograms of accuracy observations for each task, making pairwise comparisons between treatments. According to the significance tests compiled in Table 2, the conformal treatment shows statistically significant improvement in accuracy compared to the other treatments on each of the tasks.
Our results on response times were displayed in Figure 4. Once again we show the histograms of average response time observations for each task in Figure 15. Unlike for accuracy, we do not see strong trends for prediction sets increasing or decreasing decision speed across all cases, and in most cases we do not see significant differences between the means of the distributions (Table 3).
In our pre-registration at osf.io/fkdhv we stated that data analysis would be conducted using the one-way ANOVA method. In the ensuing time since pre-registration, and based on the discussion in Section 3 we found that applying Welch’s -test was a suitable, and simpler statistical approach, and therefore used it for our final analysis instead.
To complement Figure 8 in the main text for Few-NERD, in Figure 16 we present the human accuracies conditioned on conformal set size for both ObjectNet and GoEmotions. Similar to the observations made for Few-NERD, the provision of prediction sets tended to enhance human accuracy across uncertainty levels, but demonstrated the largest impact on accuracy for singleton sets.
Similarly, Figure 17 completes what was shown in Figure 9 for the remaining datasets. The response time trend observed for GoEmotions and ObjectNet aligns with our findings for Few-NERD: longer response times are consistently observed across all treatment groups when dealing with more uncertain samples, as judged by the models, while singleton conformal sets improve prediction efficiency the most.
The positive effect of singleton conformal sets is further emphasized in Figure 18.