Clues to growth and disruption of two neighbouring spiral arms of the Milky Way
Abstract
Studying the nature of spiral arms is essential for understanding the formation of the intricate disc structure of the Milky Way. The European Space Agency’s Gaia mission has provided revolutionary observational data that have uncovered detailed kinematical features of stars in the Milky Way. However, so far the nature of spiral arms continues to remain a mystery. Here we present that the stellar kinematics traced by the classical Cepheids around the Perseus and Outer spiral arms in the Milky Way shows strikingly different kinematical properties from each other: the radial and azimuthal velocities of Cepheids with respect to the Galactic centre show positive and negative correlations in the Perseus and Outer arms, respectively. We also found that the dynamic spiral arms commonly seen in an N-body/hydrodynamics simulation of a Milky Way-like galaxy can naturally explain the observed kinematic trends. Furthermore, a comparison with such a simulation suggests that the Perseus arm is being disrupted while the Outer arm is growing. Our findings suggest that two neighbouring spiral arms in distinct evolutionary phases - growing and disrupting phases - coexist in the Milky Way.
keywords:
Galaxy: disc — Galaxy: kinematics and dynamics — Galaxy: structure — stars: variables: Cepheids — galaxies: spiral.1 Introduction
Spiral arms are one of the major structures of disc galaxies, where a majority of stars form. Exploring the nature of spiral arms is crucial for understanding the structure formation of disc galaxies. Previous theoretical studies have proposed two major scenarios to explain the nature of spiral arms, both of which remain in debate (Dobbs & Baba, 2014). The density wave scenario proposes rigidly rotating, long-lived spiral arms (Lin & Shu, 1964). In this scenario, spiral arms rotate at a constant pattern speed irrespective of the galactocentric radius, while the azimuthal velocity of stars changes as a function of the galactocentric radius. Another major scenario is the dynamic arm scenario (Sellwood & Carlberg, 1984). In this scenario, spiral arms rotate at a similar speed to the stars, exhibiting transient and recurrent patterns as seen in many N-body simulations (e.g. Fujii et al., 2011; Grand et al., 2012, 2013; Baba et al., 2013; Kawata et al., 2014) and analytical studies (e.g. Meidt & van der Wel, 2023). The transient and recurrent spiral arms can be explained by the superposition of different spiral arm modes with different pattern speeds (Roškar et al., 2012; Sellwood & Carlberg, 2014, 2019, 2021). Some studies further suggest the nonlinear growth also enhances the spiral arm features when the modes overlap (e.g. Kumamoto & Noguchi, 2016).
One way of studying the nature of spiral arms through observations is to test whether there is any offset in spatial positions of spiral arms traced by young and old objects. According to the density wave scenario, spiral arms traced by objects of different ages are offset with respect to each other, and the offset angle depends on the galactocentric radius (Dobbs & Pringle, 2010; Baba et al., 2015). In contrast, the dynamic arm scenario predicts no offset (Grand et al., 2012). However, there is a mixture of observational indications supporting either the density wave scenario for the Milky Way (e.g. Hou & Han, 2015) and for external galaxies (e.g. Abdeen et al., 2022; Vallée, 2020) or the dynamic arm scenario for the Milky Way (e.g. Castro-Ginard et al., 2021) and for external galaxies (e.g. Foyle et al., 2011; Ferreras et al., 2012).
An alternative approach is to look in detail at the distribution of stellar kinematics around spiral arms. Vertex deviation is a convenient concept to characterise stellar kinematics. Vertex deviation is angle of inclination of velocity ellipsoid between galactocentric radial motion and azimuthal motion of stars. Previous theoretical studies suggest that the density wave scenario creates spiral arms with different signs of vertex deviation depending on which side of the spiral arm is analysed (Roca-Fàbrega et al., 2014). On the contrary, the sign of vertex deviation of the dynamic spiral arms does not necessarily change around the peak of the spiral arm. In a previous study (Baba et al., 2018), vertex deviation around the Perseus arm in the Milky Way was calculated by analysing the kinematics of classical Cepheid variables. Although they suffered from a small number statistics, they claimed that there was no change in vertex deviation between in front of and behind a peak of the spiral arm, i.e. the expected change in the sign of vertex deviation around a peak of the spiral arms in the density wave scenario was not observed. However, for a comprehensive and unambiguous understanding of the nature of spiral arms, it is necessary to reveal kinematics of multiple spiral arms. This calls for analysis of stellar kinematics to be studied over a wider region of the Galactic disc, covering both sides of multiple spiral arms. To this end, it is crucial to have tracer stars with precisely measured distances to distinguish whether they are located at leading or trailing sides of spiral arms. Additionally, a sufficient number of stellar samples is required to unambiguously measure whether there are any changes in a sign of vertex deviation.
The Milky Way has a bar structure in the centre of its disc. Hence, the spiral arms in the inner disc could be more affected by the Galactic bar. Therefore, by focusing on the kinematics of the spiral arms located in the outer region of the Galactic disc, i.e. Perseus arm and the Outer arms, we can investigate simpler kinematics of the spiral arm. Hence, we focus on comparing stellar kinematics of these two spiral arms, which would be crucial for understanding the nature of spiral arms.
Investigating kinematics of the Perseus and Outer arms requires precise mapping of stars’ positions, even further away than 4 kpc from the Sun (Reid et al., 2019). The European Space Agency’s Gaia mission has provided revolutionary observational data that are invaluable for studying kinematic structures of the Galactic disc by measuring distances and motions of an unprecedentedly large number of stars with remarkable precision. However, the distance uncertainties arising from their parallax measurement errors become discernibly large when stars are at distances greater than about 4 kpc with the current measurement of Gaia’s third data release (Vallenari et al., 2023). Gaia’s current distance measurements are not precise enough to tell on which side of the spiral arm stars around the Outer arm are located.
Classical Cepheids, which are pulsating variable stars with masses between 4 and 20 M☉, can be used to obtain highly precise distance measurements even as far away as distance to the Outer arm. The uncertainties in distances obtained from the period-luminosity relation are less than 4% for about 90% of the Cepheids found in the Milky Way (Skowron et al., 2019b, a), which surpasses that of Gaia’s parallax distance. This level of precision enables the identification of whether stars around the Outer arm are on the leading or trailing side of the spiral arm. We cross-match the Cepheid data with the Gaia DR3, to obtain six dimensions of phase space information of stars up to around the Outer arm. The combination of these recently available superb data enables us to study stellar kinematics around both the Perseus and Outer arms.
The aim of this paper is to probe the nature of the spiral arm from the stellar kinematics around the Perseus and Outer arms. In Section 2, we describe the observational data and our approach to measure stellar kinematics. Section 3 presents the stellar kinematics shown by the Cepheids around the Perseus and Outer arms. In Section 4, we show the kinematic structure of the spiral arms in an N-body simulation of a disc galaxy and compare it with the observed spiral arms to provide a new picture of the nature of the spiral arms and their formation. In Section 5, we discuss and summarise our findings.
2 Methods
2.1 Observational data
Our sample was taken from a catalogue of classical Cepheids (Skowron et al., 2019b, a). A majority of these Cepheids were identified by the Optical Gravitational Lensing Experiment (OGLE), which explores the Galactic disc up to approximately 20 kpc from the Galactic centre. Distances of the Galactic classical Cepheids were estimated from a period-luminosity relation (Wang et al., 2018) and an extinction map (Bovy et al., 2016).
We selected the data with a small distance uncertainty of , where and refer to the period-luminosity distance from the Sun and its uncertainty, respectively. is not the uncertainty in distance modulus, but rather the uncertainty in distance propagated from the uncertainty in distance modulus (Skowron et al., 2019b). The Cepheids data were cross-matched with the Gaia DR3 sources (Drimmel et al., 2023) and combined with their proper motion and line-of-sight velocity. We applied a quality cut on the Gaia data, selecting only the data with , and 10 .
To obtain information on the position and velocity of the Cepheid in the Galactic rest frame, we utilised solar positions and motions which were obtained in a previous research using High Mass Star Forming Regions (HMSFRs, Reid et al., 2019). The solar positions applied are the Galactocentric radius of kpc and distance from the Galactic mid-plane of kpc. Solar motions are defined as velocities , where , and are solar proper motion in the direction to the Galactic anti-centre, the direction of the Galactic rotation and the direction towards the north Galactic pole, respectively.
From these conditions, we obtained the position, , and the velocity, , for each Cepheid in the Galactocentric cylindrical coordinate, where and are the Galactocentric radius and the distance from the true Galactic mid-plane without warp, respectively. , , and denote velocity radially outward from the Galactic centre, azimuthal velocity, and vertical velocity, respectively.
From the six-dimensional data (3D position and 3D velocity) obtained, we only included the data that satisfy following criteria to exclude the data that are improbable to be classical Cepheids :
| (1) | |||
| (2) | |||
| (3) | |||
| (4) | |||
| (5) |
Although Cepheids show warp and flare structures around the outer edge of the Galactic disc, no Cepheids are expected at kpc (Skowron et al., 2019b, a; Lemasle et al., 2022). The distances to Cepheids whose derived positions are at kpc or kpc are likely to be overestimated compared to their actual distance, likely due to misclassifications with Type II Cepheids or binary stars.
We obtained 1312 Cepheids, which cover kpc and , where the Galactocentric angle, , is defined as on the line between the Galactic centre and the Sun and positive in the direction of Galactic rotation. The panel a) in Fig. 1 shows the distribution of Cepheids in the XY coordinates. The analysis in this paper was limited to objects within the range of , since these regions encompass a significant number of Cepheids located around the position of the Perseus and Outer arms.
The position of the Perseus arm was taken from a previous study (Hou, 2021). The position of the Outer arm was shifted radially outwards by 300 pc with respect to the position of the Outer arm reported in a previous study with HMSFRs (Reid et al., 2019), to align it with the position where the Cepheids are more concentrated, but keeping the pitch angle same as what is obtained with the HMSFRs. This does not necessarily imply that there is an offset in the positions of the spiral arm formed by HMSFRs and Cepheids. The previous study reported only 11 HMSFRs around the Outer arm, while 111 Cephids are found around the location of 300 pc outside of the position with the HMSFRs. Thus, we consider that the Cepheids’ concentration is more likely to represent the real Outer arm position than the one suggested by a limited number of the HMSFRs reported before.
2.2 Calculation for Vertex Deviation
Rotational velocity with respect to circular velocity, , was computed by subtracting circular velocity, , from azimuthal velocity, . We consider that the mean rotation velocity for Cepheids is close to the circular velocity, because they are kinematically cold (Kawata et al., 2018), and their asymmetric drift is negligible. We computed the average rotation of the Cepheids as a function of angular momentum, , with a bin size of 100 kpc, i.e. . Then, we computed for -th Cepheid based on their angular momentum, .
The general form of the equations used for the calculation of vertex deviation are given as follows (Vorobyov & Theis, 2008):
| (7) |
where is the general velocity dispersion tensor
| (8) |
where and denote coordinate directions. Here the velocity dispersion tensor was computed using and , and for example, . This definition of differs from the conventional definition of . In the conventional definition, is used instead of . We combined the data around each spiral arm at a large range of the radius and hence . It is therefore better to take into account the different circular velocity at the different . In addition, positive angles in the conventional definition of indicate a negative correlation between and (Baba et al., 2018; Vorobyov & Theis, 2008; Roca-Fàbrega et al., 2014). On the other hand, we defined the positive angle of as a positive correlation between and . We consider that this is more natural definition than the conventional one, and we used our own definition of the sign of vertex deviation.
The uncertainties in the vertex deviation were computed using a jack-knife method. Notably, the error estimation using the jack-knife method does not account for observational uncertainties of the Cepheids. However, we found that the errors obtained by a jack-knife method are larger than the statistical errors computed by Monte Carlo sampling from the observational uncertainties in period-luminosity distances, Gaia DR3 line-of-sight velocity and proper motion. This means that the Poisson noise has a greater impact than the uncertainty of each data point. Therefore, we employed the uncertainties estimated with the jack-knife method, to be conservative.
3 Observed kinematic diversity around the spiral arms
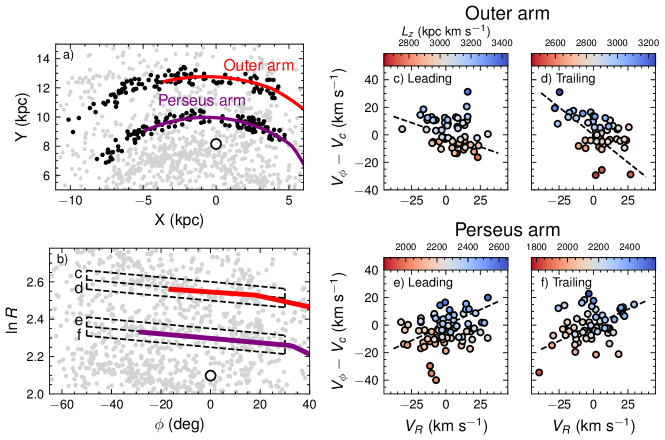
Fig. 1 shows the distribution of the Cepheids around the Perseus and Outer arms and their correlation between and . The panel b) in Fig. 1 uses a logarithmic radius on its vertical axis to trace logarithmic shapes of the spiral arms. The width of areas indicated as c-f in panel b) is defined by to take into account the pitch angles of the spiral arms, which are about 4 deg for both the Perseus and Outer arms (Reid et al., 2019; Hou, 2021). These areas are in the range of (c): , (d): , (e): and (f): , within .
Panels c) and d) in Fig. 1 show results around the Outer arm highlighted as c and d in panel b), respectively, and panels e) and f) present results of the Perseus arm respectively indicated as e and f in panel b). Panels c) and e) show velocity distributions on the leading side of the spiral arms, while panels d) and f) display that on the trailing side of the spiral arms. Angular momentum, , is depicted by colours of dots in panels c)-f). The Cepheids around the Perseus arm tend to have a larger in upper right of the panels, while those around the Outer arm tend to have a larger in upper left.
Fig. 1 shows that motions of the Cepheids are distributed in inclined ellipses in diagram. Angle of this inclination is defined as vertex deviation, . The dashed lines in panels c)-f) show angles of for the Cepheids in each panel. Cepheids around the Perseus arm show positive correlations between and on both the leading and trailing sides, and we obtain and , respectively. Cepheids around the Outer arm have negative correlations on both sides, with on the leading side and on the trailing side.
Vertex deviation around the spiral arms can be derived analytically under the density wave scenario with tight-winding approximation (Roca-Fàbrega et al., 2014). According to the density wave scenario, sign of should change between trailing and leading sides of spiral arms. However, our observational data show on both sides of the Perseus arm and on both sides of the Outer arm. This does not align with the expected behaviour of in the density wave scenario.
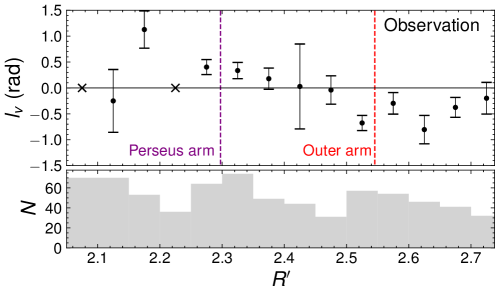
Fig. 2 (upper panel) shows vertex deviation calculated as a function of . The lower panel of Fig. 2 shows a number of Cepheids in each bin. The vertical purple and red dashed lines highlight the positions of the Perseus and Outer arms, respectively. Excesses of the number of Cepheids are seen around these vertical lines. As illustrated in panels c)-f) in Fig. 1, are positive on both sides of the Perseus arm, while they are negative around the Outer arm. It is noteworthy that the kinematic trends around these two neighbouring spiral arms are completely opposite.
4 Kinematics of spiral arm in N-body simulation
The theoretical prediction from the density wave scenario does not explain well the observed kinematics structure of the Cepheids shown in Fig. 1. On the other hand, we discovered that the trend of the opposite vertex deviation of two neighbouring spiral arms is naturally seen in a typical N-body/hydrodynamics simulation. This kind of simulation models commonly have spiral arms that follow the dynamic arm scenario.
We used an N-body/hydrodynamics simulation of a Milky Way-like isolated disc galaxy (Baba & Kawata, 2020; Baba et al., 2022), which includes self-gravity, radiative cooling, star formation and stellar feedback (Saitoh et al., 2008; Saitoh & Makino, 2009, 2010; Baba et al., 2017). The simulation also self-consistently includes stellar and gaseous discs, a classical bulge and a fixed dark matter halo, with particle masses of the star and gas approximately and , respectively. The gravitational softening length is 10 pc, which is sufficiently small to resolve the three-dimensional structure of the disc galaxy (Baba et al., 2013). The analysis of the simulation data for this study was limited to the particles of approximately same age as the Cepheids. The ages of our sampled Cepheids estimated from the period-age relation (Anderson et al., 2016) were taken from the catalogue, where their mentality is considered to follow the observed metallicity gradient (Genovali et al., 2014) and the metallicity dependence of the period-age relation is taken into account. We then obtained a well-known dependence of ages of Cepheids on a Galactocentric radius, , which is attributed to the metallicity gradient. Based on this relation, we applied a selection of particles with age/Myr.
4.1 Neighbouring spiral arms with different kinematics in N-body simulation
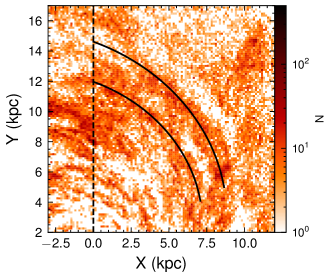
Fig. 3 illustrates a snapshot of two neighbouring spiral arms, which show similar kinematical trends to our observed Cepheids. The dashed line in Fig. 3 shows a line defined as and is defined as positive in clockwise direction (the galactic rotation direction). These arms were found at 3.58 Gyr in the simulation time. Using the particle data within , vertex deviation was computed as a function of which are approximately perpendicular to both of the two spiral arms. Note that the spiral arms have a pitch angle of around 20 deg, which is significantly larger than those of the Perseus and Outer arms. However, our focus is on vertex deviation, and we accept this discrepancy in pitch angle.
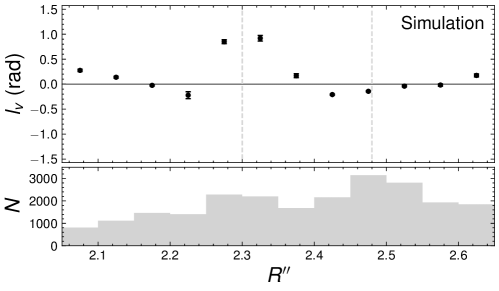
Fig. 4 presents vertex deviation as a function of . Fig. 4 displays around a density peak of the inner spiral arm at , while are seen around the outer arm at . Similar to the observations, the stars in the simulation show the same sign of vertex deviation on either side of these two spiral arms. Spiral arms in our numerical simulations follow the dynamic arm scenario, where spiral arms are transient, co-rotating and winding (Dobbs & Baba, 2014). Hence, the dynamic arm scenario can reproduce two spiral arms with completely opposite kinematic trends, as observed in our sample of Cepheids in the Perseus and Outer arms in the Milky Way.
4.2 Correlation between evolutionary phase of a spiral arm and vertex deviation
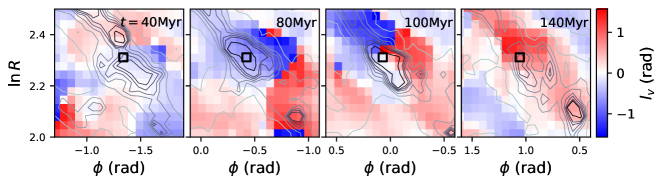
The dynamic arm scenario predicts different kinematics around spiral arms during growing and disrupting phases of the spiral arms (Baba et al., 2013; Grand et al., 2014). We utilised the same N-body/hydrodynamics simulation data used in Section 4.1 and examine whether there is a correlation between phases of a spiral arm (growing and disrupting) and vertex deviation. For this purpose, we selected a conspicuous spiral arm spanning over kpc. This particular spiral arm was selected due to its clear visibility compared to other spiral arms, helping us to track the evolution of the spiral arm over time. The evolution of vertex deviation is analysed for the time from 3.42 Gyr to 3.60 Gyr in the simulation time, whose time is re-defined to be from =0 to 180 Myr. Fig. 5 shows the evolution of the density of this selected arm in contours and the colour map displays the distribution of the vertex deviation.
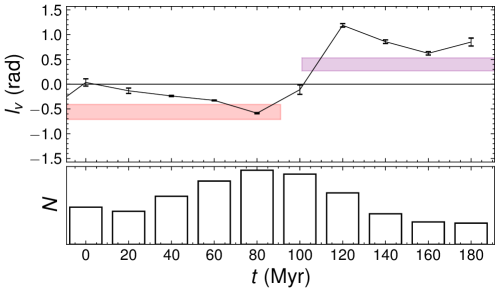
Fig. 6 shows the vertex deviations computed using particles within the black squares in Fig. 5 around the peak of the spiral arm at a constant radius of kpc. Fig. 6 shows that a spiral arm is growing from to Myr, i.e. the number of star particles in a the black square in Fig. 5 is increasing in the lower panel, and shows negative vertex deviation. Then, from to Myr, the spiral arm is disrupting, i.e. the number is decreasing, and positive vertex deviation appears. This suggests that positive and negative vertex deviations are observed in disrupting and growing arms, respectively.
Applying the correlation between evolutionary phases of a spiral arm and the sign of vertex deviation from our simulation to the spiral arms of the Milky Way, we can suggest that the positive vertex deviation around the Perseus arm is due to the Perseus arm being in a disrupting phase.
Meanwhile, the negative vertex deviation around the Outer arm is attributed to the Outer arm being in a growing phase.
Moreover, Fig. 4 shows that both disrupting and growing spiral arms can coexist simultaneously and next to each other in a single galaxy.
Therefore, the observed trend of the Perseus arm and the Outer arm can be explained by different evolutionary phases of the dynamic arm scenario.
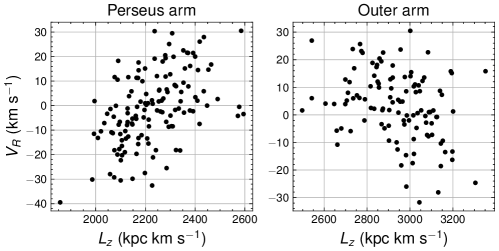
The left panel of Fig. 7 illustrates that the Cepheids around the Perseus arm typically exhibit larger for those with larger angular momentum, . Conversely, the right panel displays that the Cepheids around the Outer arm show smaller for those with larger . Stars with lower angular momentum have their guiding centres inside the spiral arm, whereas stars with higher angular momentum have their guiding centres outside the spiral arm. This provides a view that the Cepheids around the Perseus arm tend to leave their current position and move back towards their guiding centres, because the Cepheids with their guiding centre on the inner side of the spiral arm have inward velocities and the Cepheids with their guiding centre on the outer side of the spiral arm have outward velocities. In other words, the Cepheids around the Perseus arm is going away from each other. This trend is consistent with our suggestion of the disrupting Perseus arm. Meanwhile, the Cepheids around the Outer arm tend to move towards each other, because the Cepheids with their guiding centre on the inner side of the spiral arm have outward velocities and the Cepheids with their guiding centre on the outer side of the spiral arm have inward velocities. This kinematic trend is also consistent with our picture of the growing Outer arm with the stars gathering toward the Outer arm.
5 Discussion and Conclusion
In this paper we have reported the first detection of kinematic structure around the Perseus and Outer arms in the Milky Way using Cepheid variable stars. The kinematics of the Cepheids around the spiral arms are not consistent with analytical predictions under the density wave scenarios based on the tight-winding approximation (Roca-Fàbrega et al., 2014). On the contrary, in dynamic arm scenarios, neighbouring spiral arms can have different kinematic structures similar to the observed feature. Moreover, comparing their kinematics with numerical simulations, we discovered that the observed different stellar kinematics around the Outer and Perseus arms can be respectively explained by their being growing and disrupting phases of the transient, recurrent and dynamic spiral arms.
Recently, Asano et al. (2023) suggested that the dynamic arm scenario shows a compression of the vertical motion of the star in the growing spiral arm and an expansion in the disrupting spiral arm. They also tentatively found that a hint of vertical expanding motion around the Perseus arm and compressing motion around the Outer arm with Gaia DR3 data. Interestingly, this is consistent with what we found from the in-plane stellar motion with more precise distance measurements.
Another spiral arm scenario other than the density wave and dynamic arm scenarios is tidally induced spiral arms due to external perturbations (Oh et al., 2015; Antoja et al., 2022). In the tidal spiral arm scenario, stars in spiral arms are expected to have irrespective of sides of spiral arms (Antoja et al., 2022). In addition, vertex deviation is anticipated to show different signs in front and behind spiral arms, similar to what is expected in the density wave scenario (Antoja et al., 2022). Unfortunately, neither of these expected features is observed in Cepheids.
It should also be noted that the dynamic arm scenario does not perfectly reproduce our results. The two spiral arms used in Fig. 4 have pitch angles around 20 deg, much larger than the pitch angles of 4 deg observed for the Perseus and Outer arms. In our simulation data, we rarely found spiral arms with pitch angle as small as 4 deg and also covering a large region of the galactic azimuthal angle, like the Perseus and Outer arms. Hence, the dynamic arm scenario still needs to explain the small pitch angles of these two long spiral arms with the different vertex deviation. Furthermore, recent observations by Gaia inferred the pattern speed of the bar between 33 and 45 kpc (Leung et al., 2022; Clarke & Gerhard, 2022). This suggests that the bar’s Outer Lindblad Resonance (OLR) is expected to be located near the Perseus arm (e.g. Liu et al., 2012; Khoperskov & Gerhard, 2022). The stellar and gaseous orbits within a bar potential are recognized to vary dependent on the position of resonance (e.g. Dobbs & Baba, 2014). However, the combination effects of the bar resonances and the dynamic are known to be complicated (Hunt et al., 2018, 2019). Our result encourages a further study of the impact of the bar and the dynamic spiral arms on vertex deviation.
Any successful spiral arm scenario must fully explain our discovery of the diverse trend in stellar kinematics around the spiral arms of the Milky Way. The dynamic arm scenario seems to be a promising scenario to explain the observed two opposite kinematic trends of stars around the two spiral arms, the Perseus and Outer arms. This scenario provides clues that these neighbouring spiral arms are in different phases of evolution, i.e. the disrupting Perseus and the growing Outer arm.
Acknowledgements
This work is a part of MWGaiaDN, a Horizon Europe Marie Skłodowska-Curie Actions Doctoral Network funded under grant agreement no. 101072454 and also funded by UK Research and Innovation (EP/X031756/1). This work was also partly supported by the UK’s Science & Technology Facilities Council (STFC grant ST/S000216/1, ST/W001136/1). This work has made use of data from the European Space Agency (ESA) mission Gaia (https://www.cosmos.esa.int/gaia), processed by the Gaia Data Processing and Analysis Consortium (DPAC, https://www.cosmos.esa.int/web/gaia/dpac/consortium). Funding for the DPAC has been provided by national institutions, in particular the institutions participating in the Gaia Multilateral Agreement. This research was supported by a grant from the Hayakawa Satio Fund awarded by the Astronomical Society of Japan.
Data availability
The datasets used and analysed in this study were derived from data published in the Gaia Archive (https://gea.esac.esa.int/archive) and from the public classical Cepheid data (Skowron et al., 2019a) (http://www.astrouw.edu.pl/ogle/ogle4/MILKY_WAY_3D_MAP/Skowron2019_GalClassCephDist.dat). The simulation data used are available from the corresponding author on a reasonable request.
References
- Abdeen et al. (2022) Abdeen S., et al., 2022, Monthly Notices of the Royal Astronomical Society, 512, 366
- Anderson et al. (2016) Anderson R. I., Saio H., Ekström S., Georgy C., Meynet G., 2016, Astronomy and Astrophysics, 591
- Antoja et al. (2022) Antoja T., Ramos P., López-Guitart F., Anders F., Bernet M., Laporte C. F., 2022, Astronomy and Astrophysics, 668
- Asano et al. (2023) Asano T., Kawata D., Fujii M. S., Baba J., 2023, Monthly Notices of the Royal Astronomical Society
- Baba & Kawata (2020) Baba J., Kawata D., 2020, Monthly Notices of the Royal Astronomical Society, pp 4500–4511
- Baba et al. (2013) Baba J., Saitoh T. R., Wada K., 2013, Astrophysical Journal, 763
- Baba et al. (2015) Baba J., Morokuma-Matsui K., Egusa F., 2015, Publications of the Astronomical Society of Japan, 67
- Baba et al. (2017) Baba J., Morokuma-Matsui K., Saitoh T. R., 2017, Monthly Notices of the Royal Astronomical Society, 464, 246
- Baba et al. (2018) Baba J., Kawata D., Matsunaga N., Grand R. J. J., Hunt J. A. S., 2018, The Astrophysical Journal, 853, L23
- Baba et al. (2022) Baba J., Kawata D., Schönrich R., 2022, Monthly Notices of the Royal Astronomical Society, 513, 2850
- Bovy et al. (2016) Bovy J., Rix H.-W., Green G. M., Schlafly E. F., Finkbeiner D. P., 2016, The Astrophysical Journal, 818, 130
- Castro-Ginard et al. (2021) Castro-Ginard A., et al., 2021, Astronomy and Astrophysics, 652
- Clarke & Gerhard (2022) Clarke J. P., Gerhard O., 2022, Monthly Notices of the Royal Astronomical Society, 512, 2171
- Dobbs & Baba (2014) Dobbs C., Baba J., 2014, Publications of the Astronomical Society of Australia, 31
- Dobbs & Pringle (2010) Dobbs C. L., Pringle J. E., 2010, Monthly Notices of the Royal Astronomical Society, 409, 396
- Drimmel et al. (2023) Drimmel R., et al., 2023, Astronomy & Astrophysics, 674, A37
- Ferreras et al. (2012) Ferreras I., Cropper M., Kawata D., Page M., Hoversten E. A., 2012, Monthly Notices of the Royal Astronomical Society, 424, 1636
- Foyle et al. (2011) Foyle K., Rix H. W., Dobbs C. L., Leroy A. K., Walter F., 2011, Astrophysical Journal, 735
- Fujii et al. (2011) Fujii M. S., Baba J., Saitoh T. R., Makino J., Kokubo E., Wada K., 2011, Astrophysical Journal, 730
- Genovali et al. (2014) Genovali K., et al., 2014, Astronomy and Astrophysics, 566
- Grand et al. (2012) Grand R. J., Kawata D., Cropper M., 2012, Monthly Notices of the Royal Astronomical Society, 426, 167
- Grand et al. (2013) Grand R. J., Kawata D., Cropper M., 2013, Astronomy and Astrophysics, 553
- Grand et al. (2014) Grand R. J., Kawata D., Cropper M., 2014, Monthly Notices of the Royal Astronomical Society, 439, 623
- Hou (2021) Hou L. G., 2021, The Spiral Structure in the Solar Neighborhood (arXiv:2110.04446), doi:10.3389/fspas.2021.671670
- Hou & Han (2015) Hou L. G., Han J. L., 2015, Monthly Notices of the Royal Astronomical Society, 454, 626
- Hunt et al. (2018) Hunt J. A., Hong J., Bovy J., Kawata D., Grand R. J., 2018, Monthly Notices of the Royal Astronomical Society, 481, 3794
- Hunt et al. (2019) Hunt J. A., Bub M. W., Bovy J., Mackereth J. T., Trick W. H., Kawata D., 2019, Monthly Notices of the Royal Astronomical Society, 490, 1026
- Kawata et al. (2014) Kawata D., Hunt J. A., Grand R. J., Pasetto S., Cropper M., 2014, Monthly Notices of the Royal Astronomical Society, 443, 2757
- Kawata et al. (2018) Kawata D., Baba J., Ciucă I., Cropper M., Grand R. J., Hunt J. A., Seabroke G., 2018, Monthly Notices of the Royal Astronomical Society: Letters, 479, L108
- Khoperskov & Gerhard (2022) Khoperskov S., Gerhard O., 2022, Astronomy and Astrophysics, 663
- Kumamoto & Noguchi (2016) Kumamoto J., Noguchi M., 2016, The Astrophysical Journal, 822, 110
- Lemasle et al. (2022) Lemasle B., et al., 2022, Astronomy and Astrophysics, 668
- Leung et al. (2022) Leung H. W., Bovy J., Mackereth J. T., Hunt J. A. S., Lane R. R., Wilson J. C., 2022, Monthly Notices of the Royal Astronomical Society, 519, 948
- Lin & Shu (1964) Lin C. C., Shu F. H., 1964, The Astrophysical Journal, 140, 646
- Liu et al. (2012) Liu C., Xue X., Fang M., Ven G. V. D., Wu Y., Smith M. C., Carrell K., 2012, Astrophysical Journal Letters, 753
- Meidt & van der Wel (2023) Meidt S. E., van der Wel A., 2023, The Astrophysical Journal
- Oh et al. (2015) Oh S. H., Kim W. T., Lee H. M., 2015, Astrophysical Journal, 807
- Reid et al. (2019) Reid M. J., et al., 2019, The Astrophysical Journal, 885, 131
- Roca-Fàbrega et al. (2014) Roca-Fàbrega S., Antoja T., Figueras F., Valenzuela O., Romero-Gómez M., Pichardo B., 2014, Monthly Notices of the Royal Astronomical Society, 440, 1950
- Roškar et al. (2012) Roškar R., Debattista V. P., Quinn T. R., Wadsley J., 2012, Monthly Notices of the Royal Astronomical Society, 426, 2089
- Saitoh & Makino (2009) Saitoh T. R., Makino J., 2009, Astrophysical Journal, 697
- Saitoh & Makino (2010) Saitoh T. R., Makino J., 2010, FAST: A Fully Asynchronous Split Time-Integrator for a Self-Gravitating Fluid, https://academic.oup.com/pasj/article/62/2/301/1458760
- Saitoh et al. (2008) Saitoh T. R., Daisaka H., Kokubo E., Makino J., Okamoto T., Tomisaka K., Wada K., Yoshida N., 2008, Toward First-Principle Simulations of Galaxy Formation: I. How Should We Choose Star-Formation Criteria in High-Resolution Simulations of Disk Galaxies?, https://academic.oup.com/pasj/article/60/4/667/2898170
- Sellwood & Carlberg (1984) Sellwood J. A., Carlberg R. G., 1984, The Astrophysical Journal, 282, 61
- Sellwood & Carlberg (2014) Sellwood J. A., Carlberg R. G., 2014, Astrophysical Journal, 785
- Sellwood & Carlberg (2019) Sellwood J. A., Carlberg R. G., 2019, Monthly Notices of the Royal Astronomical Society, 489, 116
- Sellwood & Carlberg (2021) Sellwood J. A., Carlberg R. G., 2021, Monthly Notices of the Royal Astronomical Society, 500, 5043
- Skowron et al. (2019a) Skowron D. M., et al., 2019a, Acta Astronomica, 69, 305
- Skowron et al. (2019b) Skowron D. M., et al., 2019b, Science, 365, 478
- Vallenari et al. (2023) Vallenari A., et al., 2023, Astronomy and Astrophysics, 674
- Vallée (2020) Vallée J. P., 2020, New Astronomy, 76
- Vorobyov & Theis (2008) Vorobyov E. I., Theis C., 2008, Monthly Notices of the Royal Astronomical Society, 383, 817
- Wang et al. (2018) Wang S., Chen X., de Grijs R., Deng L., 2018, The Astrophysical Journal, 852, 78