Boron Abundances in Early B Dwarfs of the Galactic Open Cluster NGC 3293 111Based on observations made with the NASA/ESA Hubble Space Telescope, obtained at the Space Telescope Science Institute, which is operated by the Association of Universities for Research in Astronomy, Inc., under NASA contract NAS 5-26555. These observations are associated with proposal GO-14673.
Abstract
New boron abundances or upper limits have been determined for 8 early-B stars in the young Galactic open cluster NGC 3293, using ultraviolet spectra obtained by the Hubble Space Telescope Cosmic Origins Spectrograph. With previous observations, there are now 18 early-B stars in this cluster with boron measurements. Six of the newly observed stars have projected rotational velocities greater than 200 km/s, allowing new constraints on rotationally driven mixing in main-sequence stars. When comparing to synthetic model populations, we find that the majority of our sample stars agree well with the predicted trends of stronger boron depletion for larger rotation and for larger mass or luminosity. Based on those, a smaller than the canonical rotational mixing efficiency,( vs the more standard value of 0.033), appears to be required. However, our five most slowly rotating stars are not well explained by rotational mixing, and we speculate that they originate from binary mergers.
1 Introduction
The dominant energy source in core hydrogen burning massive stars is the fusion of protons to 4He. Since massive stars use the CNO-cycle to perform this, most of the available carbon and oxygen in the core is converted into nitrogen during this process. At the same time, the pp-chains are also operating. While they contribute little to the energy production in massive stars, the corresponding proton capture reactions leads to the destruction of the light elements, lithium, beryllium and boron, in most of the stellar interior.
It has been known for several decades, that the surfaces of a fraction of the upper massive main-sequence stars show abundance patterns which indicate enrichment with hydrogen burning products. These include anti-correlated nitrogen and carbon abundances indicative of CN processing (Schonberner et al., 1988; Gies & Lambert, 1992; Przybilla et al., 2010), enhanced helium (Herrero et al., 1992), and boron depletion (Proffitt & Quigley, 2001; Venn et al., 2002; Mendel et al., 2006). It has been suggested that these abundance changes have been caused by rotationally driven internal mixing (Maeder & Meynet, 2010; Langer, 2012), and many stellar evolution models for massive stars do now include its effects (Brott et al., 2011a; Ekström et al., 2012; Paxton et al., 2013).
However, refined observations cast doubts on this explanation. Hunter et al. (2008b), identified a population of slowly rotating early B dwarfs in the LMC which showed a significant surface nitrogen enrichment. A similar population was also found in the LMC O star population (Rivero González et al., 2012; Grin et al., 2017). At the same time, it became clear that a typical population of massive main sequence single stars must be expected to contain a significant fraction (%) of binary products, i.e., mass gainers in mass transfer systems or mergers, (Sana et al., 2012; de Mink et al., 2014).
In this paper, we pursue the idea that boron abundance measurements may have a strong potential to discriminate between the suggested enrichment channels. Proffitt et al. (2016) discussed observations of the B III resonance line in 10 early-B stars in the young open cluster NGC 3293, and concluded that modest boron depletion was seen, perhaps consistent with the predictions of the models of Brott et al. (2011a), in which rotational mixing was calibrated using observations of nitrogen abundances in massive main sequence stars of the LMC. We requested observations of ten additional stars, and obtained useful data for 8 of these, as part of HST program 14673, with a focus on more rapidly rotating stars lower on the main-sequence. These data provide us with a unique sample of 18 early B dwarfs with information on their boron and nitrogen abundances in an open star cluster, i.e., with roughly known and equal ages.
2 UV observations
For this analysis, we will combine the new data obtained in HST GO program 14673, with the older data from program HST GO 12520. The latter observations were described in Proffitt et al. (2016). The stars observed by both programs are listed in Table 1 along with descriptive information for each star from Dufton et al. (2006). The observational strategy for 14673 was very similar to that of 12520, utilizing the COS G185M 1971 setting. This setting covers three distinct wavelength ranges, the third of which covers from 2052 to 2087 Å which includes the B III resonance doublet. The observations for 14673 were executed in September of 2016 and June of 2017.
The reduction of the UV spectra also followed the procedures detailed in Proffitt et al. (2016), including the need to correct for the variable vignetting of up to 20% that affects the short wavelength end of each COS NUV ”stripe”, (Ake et al., 2010). This needs to be done by comparing the data taken at each individual FP-POS position to derive a correction before combining them into a final merged spectrum. This correction is not included in the standard pipeline products available from the MAST archive.
Targets for both programs were selected from Dufton et al. (2006), based on their location in the HR diagram as well as their rotational velocity. For the new program, we gave preference to more rapidly rotating stars. After the UV observations were obtained, we found that ESL 016 was a much narrower lined star than we had expected. While Dufton et al. (2006) had adopted the correct photometric information for this star, the FLAMES-Giraffe Spectrograph observation that they associated with it appears to have actually been of the fainter, (), star NGC 3293 B 198, (apparently Gaia EDR3 5351447238427079936), (Balona, 1994), which is located about 2” away from ESL 016. Fortunately, the ESO archive does contain three similar FEROS observations of the brighter star, under the name V 404 Car, taken in 2016 by F. Rodler as part of ESO program 079.A-9008, and we were able to use these spectra for our analysis.
We summarize the UV observations of each star in Table 1, along with basic information for each star from Dufton et al. (2006). We include the signal-to-noise achieved at the location of the B III line over a 0.1Å bin, which corresponds to the pixel COS G185M resolution element. We also note whether a star is a known variable, several are Cehpehi stars, and whether there is any evidence for radial velocity variations. Most of our targets appear to currently be single stars.
For one of the targets, ESL 020, a bad guide star acquisition caused a mis-pointed observation with the target on the edge of the aperture and only a very faint spectrum visible. Since the program was over 90% complete, this visit was not eligible for a repeat. In addition, for ESL 025, the observed UV spectrum appears to be a composite that does not correspond to the optical spectrum and could not be usefully fit. While this star does have a companion about 1.6 magnitudes fainter at a distance of about 2.3”, that star should have been well out of the 2.5” diameter COS aperture, and the 2D spectral image shows no evidence for multiple components. As a result, these two stars will be left out of our analysis.
| ESL no. | Sp. type | HST PID | S/N per | comments | ||
|---|---|---|---|---|---|---|
| (kms) | 0.1Å | |||||
| 02 | 6.73 | B0.7 Ib | 100 | 12520 | 221 | STIS E230H |
| 03 | 7.61 | B1 III | 80 | 12520 | 304 | |
| 04 | 8.03 | B1 III | 105 | 12520 | 320 | |
| 05 | 8.12 | B1 III | 195 | 14673 | 246 | |
| 06 | 8.21 | B1 III | 200 | 14673 | 245 | |
| 07 | 8.25 | B1 III | 65 | 12520 | 185 | |
| 08 | 8.59 | B1 III | 140 | 12520 | 220 | RV var. from Feast |
| 10 | 8.77 | B1 III | 70 | 12520 | 252 | V403 Car, d |
| 12 | 8.95 | B1 III | 100 | 12520 | 179 | V380 Car, d |
| 15 | 9.11 | B1 V | 260 | 14673 | 207 | V440 Car, d |
| 16 | 9.21 | BI III | 10 | 14673 | 172 | V404 Car, d |
| 19 | 9.27 | B1 V | 120 | 12520 | 223 | V405 Car, d; SB2 |
| 20 | 9.55 | B1.5 III | 60 | 14673 | 50 | V401 Car, d; bad pointing no useful data |
| 23 | 10.01 | B1.5 III | 160 | 12520 | 159 | |
| 24 | 10.01 | B1.5 III | 135 | 12520 | 147 | RV var from Feast |
| 25 | 10.01 | B2 III | 215 | 14673 | 124 | no good fit to UV spectrum |
| 28 | 10.26 | B2 V | 215 | 14673 | 177 | |
| 30 | 10.51 | B2 V | 205 | 14673 | 173 | RV var from Morel |
| 31 | 10.66 | B2 V | 230 | 14673 | 133 | |
| 38 | 11.00 | B2.5 V | 235 | 14673 | 125 |
3 Determination of Stellar Parameters from Optical Spectra
The earlier analysis of this cluster by Dufton et al. (2006) and Hunter et al. (2009) primarily relied upon H and He line profiles (H, H, and He I 4026Å) to determine and , while for some stars where the He lines were not useful, parameters were estimated based on the spectral type. For the most narrow lined stars, the Si ionization ratios were also used to constrain the effective temperature.
To determine revised stellar parameters, we reanalyzed the same optical spectra used by Dufton et al. (2006). These observations were originally described in Evans et al. (2005). For the brighter stars, (ESL 002 through ESL 019), in our sample, these spectra were obtained with the Fibre-Fed Extended Range Optical Spectrograph (FEROS) at the Max Planck Gesellschaft MPG/ESO telescope, with ), while for the remainder of the stars, the Fibre Large Array Multi-Element Spectrograph (FLAMES) instrument at the Very Large Telescope (VLT) was used with the FLAMES-Giraffe Spectrograph ().
For four of the narrower lined stars in our sample (ESL 002, 003, 007, and 010), we applied the iterative scheme and updated TLUSTY models presented in Bragança et al. (2019) to redetermine , , abundances of silicon and oxygen, and other stellar parameters. For the other cluster stars in our sample, we then froze the Si and O abundances to the average value determined for these benchmark stars, and then redetermined the stellar parameters based on four spectral regions, the CNO lines near 4650Å, H, He I 4471 Å, and the Si III triplet at 4552 - 4575 Å.
The procedure used was as follows: The procedure used was as follows: 1) We started with the initial and from Dufton et al. (2006). 2) We refit the CNO region near 4650 Å to adjust , while keeping fixed. 3) We adjusted to fit the H line while keeping fixed. 4) We again adjusted to fit the 4471 Å He I line while keeping fixed. 5) Using the from step 3 and the average of the values from steps 2 and 4, we fitted the Si III triplet while keeping the Si abundance fixed at the mean abundance found for the four benchmark stars 6) Finally, for sample stars with 24 000 K, we checked the fit to He II 4686 Å to verify the final parameters.
The resultant parameters are listed in Table 2 and for comparison we also list the parameters derived by Dufton et al. (2006). We find that the present effective temperature and surface gravity estimates are higher than in Dufton et al. (2006), especially for the hotter stars classified as B1 or B1.5. This is consistent with Proffitt et al. (2016) who argued that these higher values, derived from the Si II/Si III ionization balance, are to be preferred to the lower values, that were derived from the Si III/Si IV ionization balance.
Four of our sources, ESL 004, 007, 008, and 019, have HST G430L spectrophotometry (Fitzpatrick et al., 2019) covering the important Balmer jump region, that is sensitive to both effective temperature and surface gravity. These data were used to check the present solutions for these stars by finding the model that best reproduces the G430L spectral energy distribution (SED). We used the Levenberg-Marquardt algorithm, (Markwardt, 2009), and a grid of TLUSTY models for each star, normalized to the observed spectrum in the -band, with extinction applied according to the observed and model measurements and appropriate rotational and radial velocity corrections, and then re-binned to the G430L resolution and pixel size. The results are illustrated in Figure 1 and summarized in Table 3.
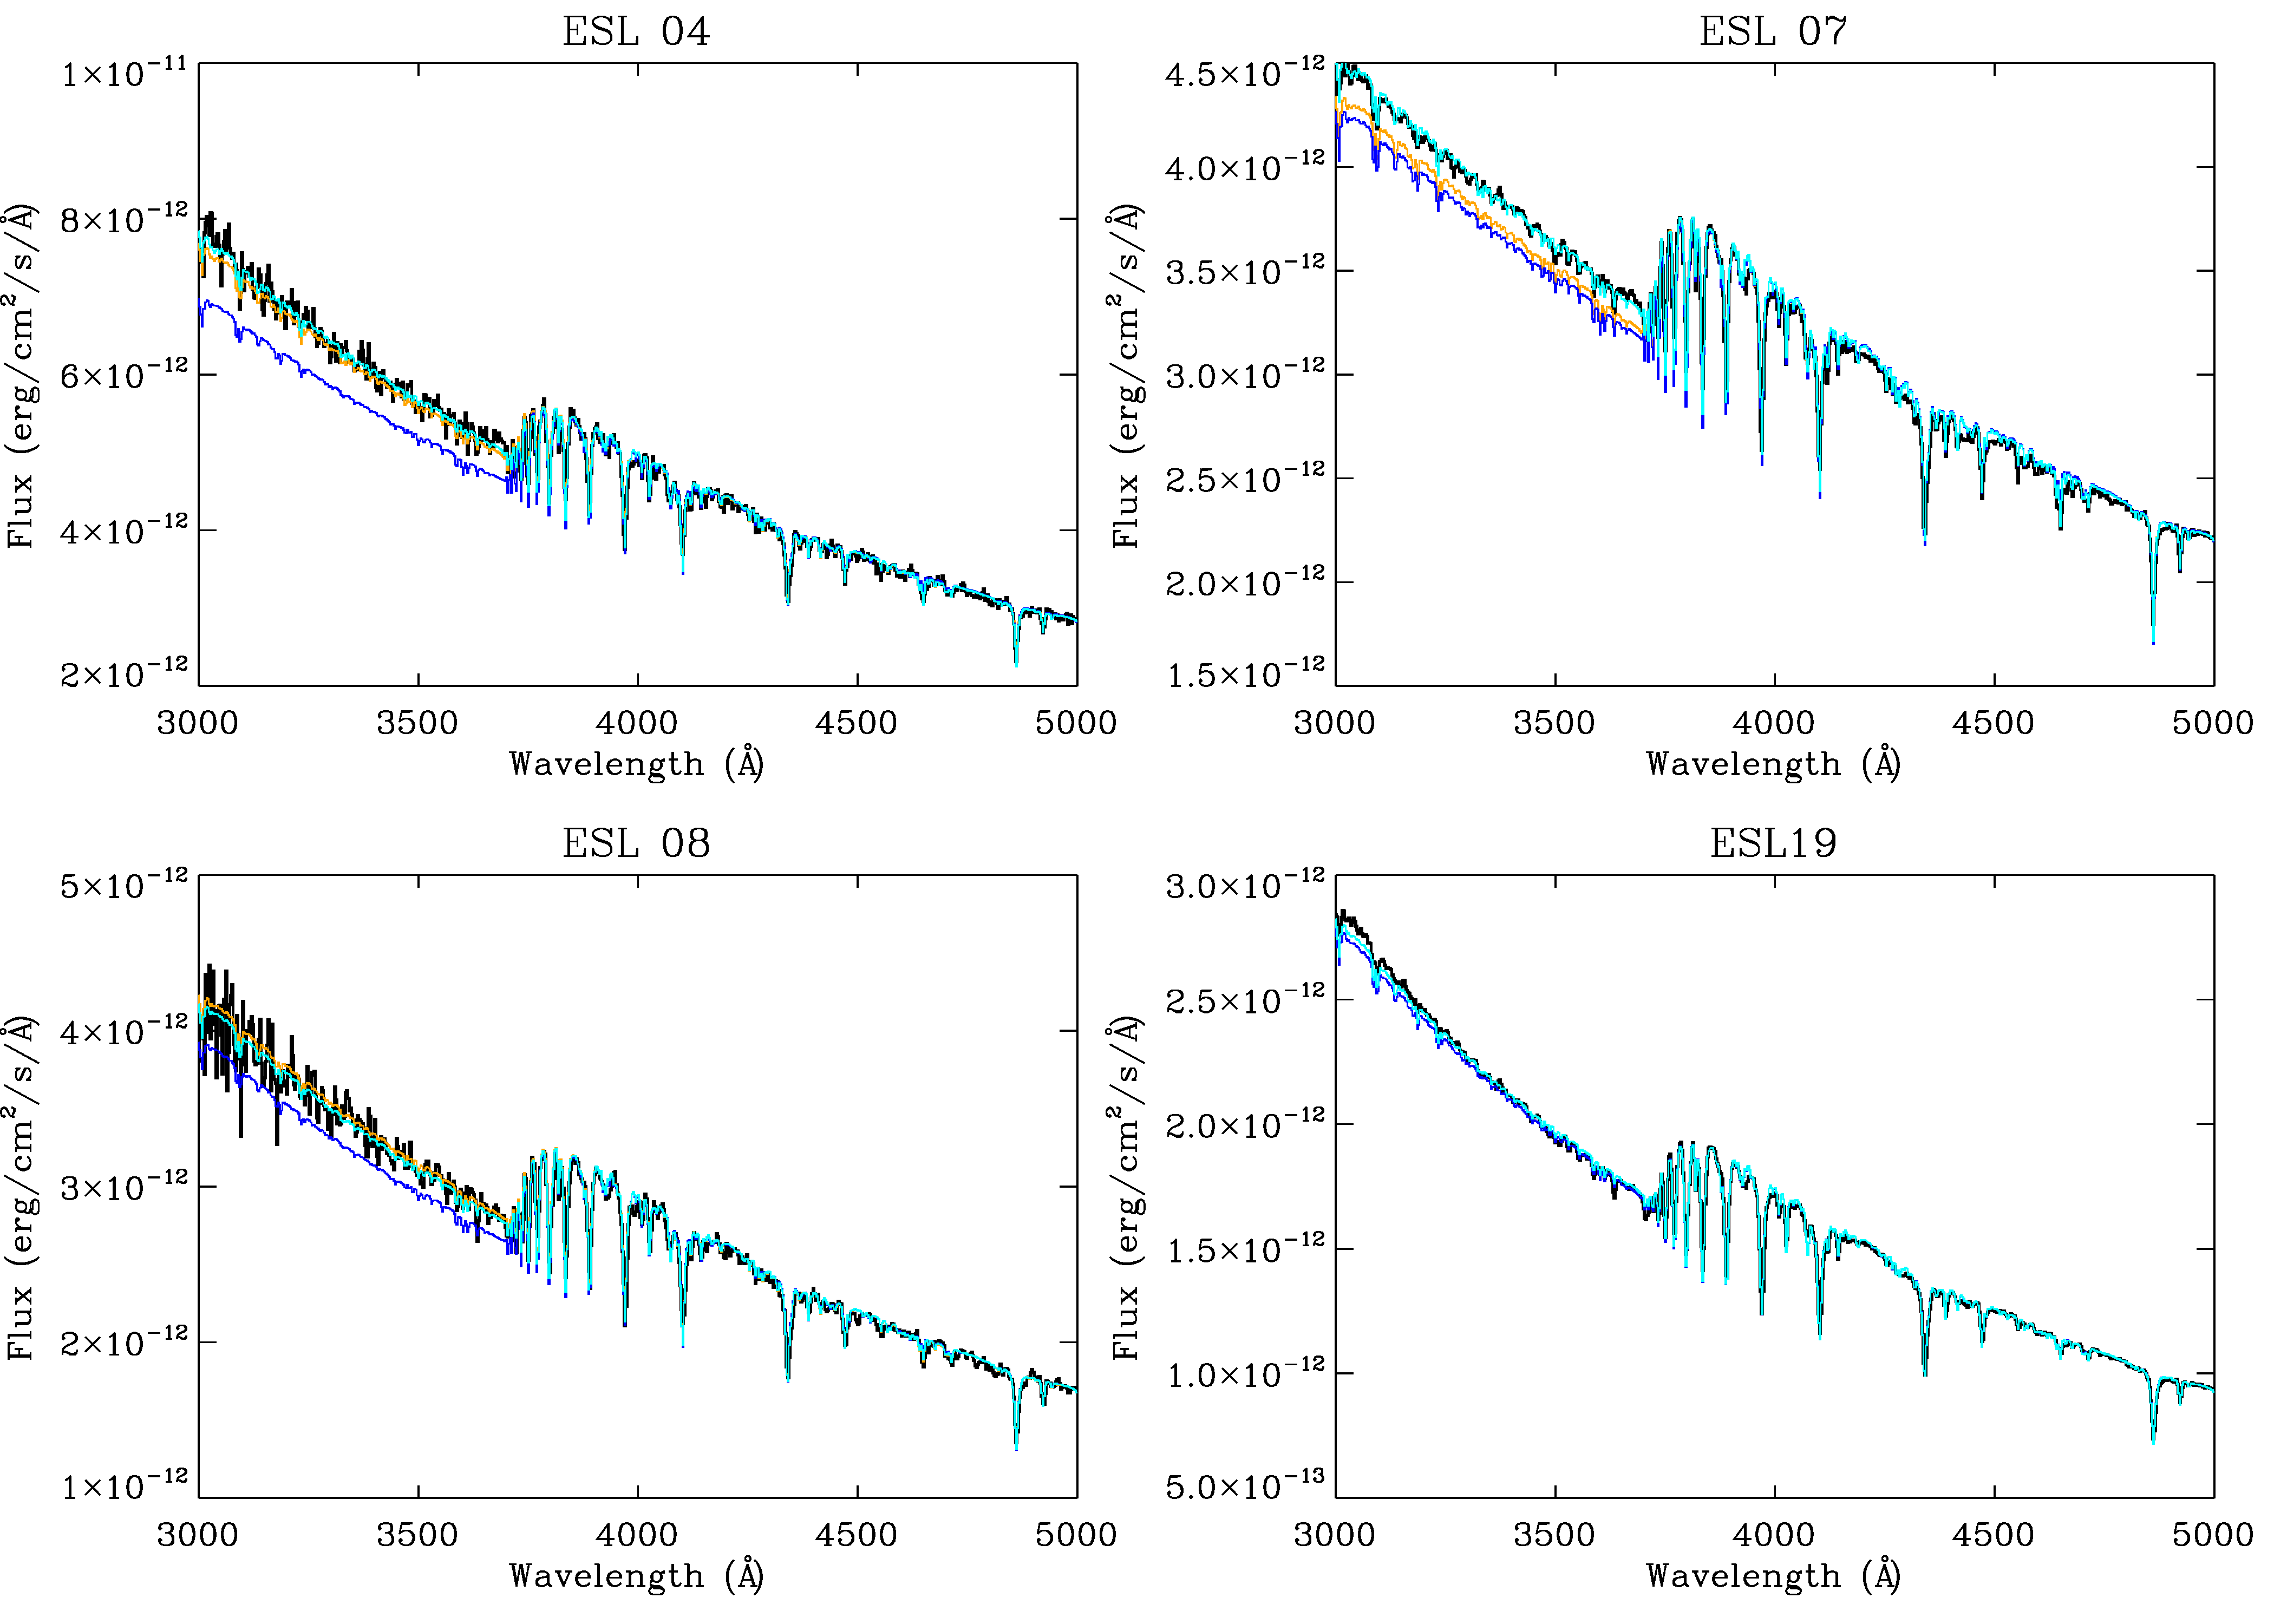
Inspection of Figure 1 confirms that the parameters derived from our spectroscopic analysis of the high resolution optical data also provide an excellent match to observed SEDs, except for star ESL 007. However close inspection of the Balmer jump of that star reveals the presence of a weak secondary emission jump, suggesting this is a Be star (Cochetti et al., 2020), an hypothesis supported by the presence of previously overlooked weak emission in the core of the H profile. While weak narrow nebular H emission is present for most of the sources discussed here, that of ESL 007 is clearly broader than nebular emission. The spectroscopic parameters are therefore to be preferred over the SED results for ESL 007. Comparing results for the other three stars it is clear that the higher effective temperatures derived for the B1/B1.5 stars using the present spectroscopic and SED approaches are indeed appropriate for this spectral type.
3.1 Luminosities
We adopt a distance to NGC 3293 of 2335 pc that is based on an analysis of DR3 data for high probability cluster members (Molina Lera et al. in preparation), in good agreement with the DR2 distance of 233452 pc (Dias et al., 2021). We note the distance to NGC 3293 is similar to other major stellar OB groups in the Carina nebula, such as Tr 14 and 16 (Maíz Apellániz et al., 2022), and all are consistent with being at the geometric distance of 235050 pc derived from an analysis of the 3D structure of the homunculus around Car (Smith, 2006). Using the above distance and effective temperatures (from Table 2), we calculate stellar radii and luminosities, taking into account bolometric corrections (BC) for the TLUSTY models (Lanz & Hubeny, 2007) and extinction. We adopt the average Galactic extinction law of Fitzpatrick et al. (2019) (that assumes =3.1 following Baume et al. (2003)) to redden the model SEDs and estimate , , and via comparison with the observed magnitudes (Table 4).
| NGC 3293 | This work | Dufton et al. (2006) | |||||||||
|---|---|---|---|---|---|---|---|---|---|---|---|
| ESL No. | RV | A(Si) | A(O) | ||||||||
| 002 | 14 | 65 | 42 | 23000 | 2.8 | 100 | |||||
| 003 | 12 | 54 | 27 | 21100 | 2.9 | 80 | |||||
| 004 | 15 | 95 | 30 | mean | mean | 21500 | 3.0 | 105 | |||
| 005 | 12 | 180 | 15 | mean | mean | 21500 | 3.0 | 195 | |||
| 006 | 15 | 200 | 15 | mean | mean | 21500 | 3.15 | 200 | |||
| 007 | 12 | 28 | 26 | 22800 | 3.1 | 65 | |||||
| 008 | 12 | 130 | 30 | mean | mean | 21500 | 3.25 | 140 | |||
| 010 | 11 | 35 | 30 | 21000 | 3.15 | 70 | |||||
| 012 | 12 | 90 | 15 | mean | mean | 21500 | 3.3 | 100 | |||
| 015 | 6 | 260 | 15 | mean | mean | 25000 | 3.9 | 260 | |||
| 016 | 10 | 55 | 15 | mean | mean | 19200 | 4.0 | 110 | |||
| 019 | 8 | 120 | 15 | mean | mean | 25000 | 3.85 | 120 | |||
| 023 | 5 | 170 | 15 | mean | mean | 20500 | 3.4 | 160 | |||
| 024 | 5 | 160 | 15 | mean | mean | 20500 | 3.5 | 135 | |||
| 025 | 5 | 215 | 15 | mean | mean | 21100 | 3.7 | 215 | |||
| 028 | 4 | 200 | 15 | mean | mean | 19400 | 3.65 | 215 | |||
| 030 | 6 | 220 | 15 | mean | mean | 19800 | 3.7 | 205 | |||
| 031 | 6 | 230 | 15 | mean | mean | 17400 | 4.3 | 230 | |||
| 038 | 6 | 235 | 15 | mean | mean | 20600 | 3.95 | 235 | |||
| NGC 3293 | This work | Dufton et al. (2006) | Proffitt et al. (2016) | SED | Fitzpatrick et al. (2019) | |||||
|---|---|---|---|---|---|---|---|---|---|---|
| ESL No. | ||||||||||
| 004 | 24000 | 3.04 | 215001000 | 3.000.10 | 226301500 | 3.040.25 | 25944290 | 3.330.06 | 25037 | 3.10 |
| 007 | 23150 | 3.08 | 228001000 | 3.100.10 | 224741500 | 3.070.25 | 24947921 | 3.170.15 | 24529 | 3.25 |
| 008 | 23600 | 3.40 | 215001000 | 3.250.10 | 226041500 | 3.500.25 | 23319224 | 3.430.07 | 24490 | 3.36 |
| 019 | 25500 | 3.75 | 250001000 | 3.850.10 | 246891500 | 3.850.25 | 25512266 | 3.920.09 | 25921 | 3.71 |
Given the brightness of these stars, it is to be expected that uncertainties in the apparent magnitudes are dominated by systematics and possible variability. While Johnson photometry with notional 1 errors of 0.03m has been published by Evans et al. (2005) and Baume et al. (2003), there are some clear outliers among the sources in common, with some differences ranging up to approximately 3 in both and . We therefore compared these datasets with the photometry derived from XP spectra, that exists for 17 of our sources, and with the photometry derived from the 4 sources with HST spectrophotometry discussed above. We followed the procedure outlined in Maíz Apellániz (2007), and used the zero-points noted therein. Excellent agreement was found between the and HST results, with and . However the magnitudes are consistently brighter and bluer than published data by up to 0.1m in and . We suspect that some of these differences may be attributed to variability (many sources are Cepheid variables), and the published data are single epoch measurements, while the spectra were taken over multiple epochs. The photometry derived from the XP spectra is therefore adopted in the present work, with uncertainties of 0.02m being used for both and . Stars ESL 028 and 030 do not have XP spectra, for these we used transformation formulae (Riello et al., 2021; Bessell, 2000) to convert native photometry to the and , adopting slightly larger uncertainties of 0.03m for these values.
| ESL | BC | ||||||||
|---|---|---|---|---|---|---|---|---|---|
| 2 | 6.67 | 0.03 | 0.259 | 242001000 | 3.000.10 | 5.2240.054 | 23.391.20 | ||
| 3 | 7.58 | 0.05 | 0.271 | 225001000 | 3.000.10 | 4.8090.057 | 16.790.88 | ||
| 4 | 7.99 | 0.220 | 240001000 | 3.040.10 | 4.6400.055 | 12.140.62 | |||
| 5 | 8.08 | 0.04 | 0.261 | 226001500 | 3.000.15 | 4.6000.077 | 13.120.89 | ||
| 6 | 8.18 | 0.02 | 0.252 | 240001500 | 3.150.15 | 4.6040.074 | 11.700.76 | ||
| 7 | 8.21 | 0.13 | 0.356 | 231501000 | 3.080.10 | 4.6900.056 | 13.830.72 | ||
| 8 | 8.54 | 0.00 | 0.232 | 236001000 | 3.400.10 | 4.4280.055 | 9.840.49 | ||
| 10 | 8.70 | 0.182 | 236001000 | 3.550.10 | 4.3060.057 | 8.560.43 | |||
| 12 | 8.91 | 0.02 | 0.258 | 245001000 | 3.700.10 | 4.3540.056 | 8.380.41 | ||
| 15 | 9.09 | 0.186 | 260001500 | 3.800.15 | 4.2500.072 | 6.610.38 | |||
| 16 | 9.31 | 0.222 | 253001000 | 3.800.10 | 4.1820.055 | 6.450.31 | |||
| 19 | 9.22 | 0.163 | 255001000 | 3.750.10 | 4.1510.054 | 6.130.29 | |||
| 23 | 9.95 | 0.155 | 227001000 | 3.900.10 | 3.7470.058 | 4.850.24 | |||
| 24 | 9.95 | 0.172 | 222001000 | 3.850.10 | 3.7460.060 | 5.070.25 | |||
| 25 | 10.14 | 0.179 | 215001500 | 3.700.15 | 3.6450.087 | 4.810.30 | |||
| 28 | 10.24 | 0.01 | 0.223 | 212001500 | 3.900.15 | 3.6500.096 | 4.990.35 | ||
| 30 | 10.51 | 0.174 | 198001500 | 3.800.15 | 3.4140.101 | 4.350.30 | |||
| 31 | 10.59 | 0.02 | 0.231 | 210001500 | 4.000.15 | 3.5130.091 | 4.330.26 | ||
| 38 | 10.95 | 0.195 | 202001500 | 3.950.15 | 3.2860.097 | 3.600.21 |
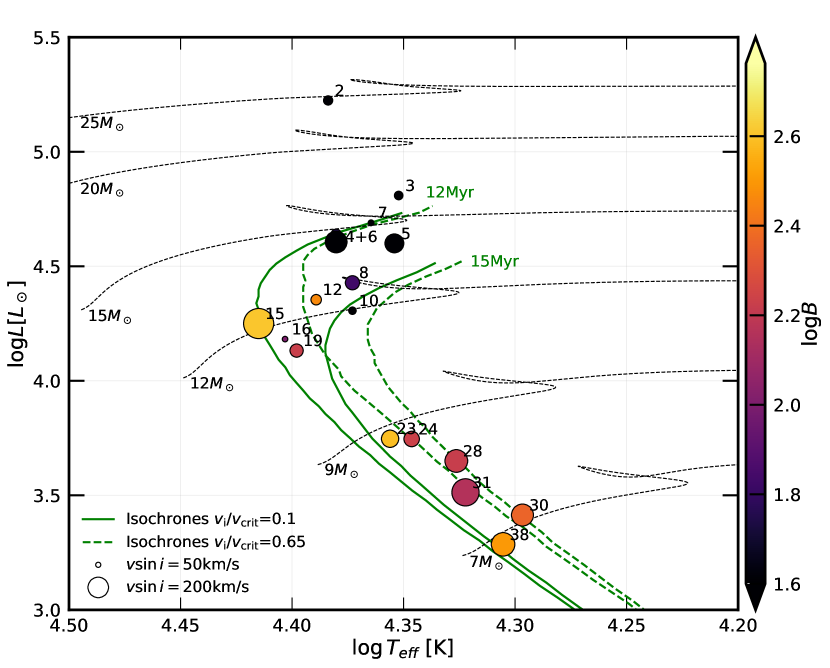
In Figure 2, we show the resulting locations of these stars in the HR diagram together with selected evolutionary tracks from Jin et al. (2023). The physics they adopted, including the assumed efficiencies for rotationally driven mixing are similar to those of the model Brott et al. (2011a, b), but the new Jin et al. (2023) calculations were made using the MESA code (Paxton et al., 2011, 2013, 2015, 2018, 2019) version 10398, and also included some updates to the adopted input abundances, opacities, and mass-dependent overshooting.
Traditional isochrone fitting done using non-rotating models has yielded a range of ages for this cluster. E.g., Baume et al. (2003) estimated Myr from the apparent nuclear age of the turnoff and Myr from the luminosity of the pre-main sequence stars relative to the zero age main-sequence based on a significantly larger distance estimate of 2750 pc, while more recently Bisht et al. (2021) found an age of Myr. Riello et al. (2021) included estimates of the effects of rotational distortion and mixing and suggested a significantly older age near 20 Myr. However, this result will be sensitive to how the adopted details of the interior mixing affect stellar lifetime, and still assumed that most observed stars in this cluster could be explained as products of single star evolution.
In recent years it has become apparent that young star clusters cannot be treated as a single population that can be modeled by one isochrone, or perhaps not even by a mix of different ages and rotation rates, (e.g., Mackey & Broby Nielsen (2007)). Instead, most young clusters in the Magellanic clouds show an extended main-sequence (eMSTO) and a split of the main-sequence into a blue and a red sequence (Milone et al., 2023), with the blue sequence predominantly consisting of relatively narrow-lined stars and the red one of more rapid rotators (Dupree et al., 2017; Marino et al., 2018). Similar features are seen in Galactic clusters, (Bastian et al., 2018; Cordoni et al., 2018). Suggestions for the origin of the two rotational distributions include stellar mergers (Wang et al., 2022), which are expected to lead to slowly rotating merged products (Schneider et al., 2019), or differences in the lifetime of the pre-main sequence accretion disk (Bastian et al., 2020), with stars that retain their disks longer having smaller rotational velocities.
In NGC 3293, most of the stars considered by Proffitt et al. (2016), as well as the brighter ones in this paper may well correspond to eMSTO stars, and as such may well be the products of binary interaction. The fainter stars, ESL 23, 24, 28, 30, 31, and 38, would in this interpretation be part of the red main-sequence due to their fast rotation and can be treated as stars that have evolved as single rotating stars without effects from mergers or binary interactions. The eMSTO stars might be expected to be depleted in boron, especially if these are mass transfer remnants, while the red sequence stars should show more modest boron depletion due to the effects of rotationally driven mixing.
4 Fitting of UV Spectra
Our procedures for fitting the UV spectra are very similar to those used in our previous work (Proffitt et al., 2016). For the adopted and values, we refit the spectrum allowing the boron abundance and radial velocity to vary, and to account for imperfect modeling of the spectral resolution and line formation, we also allow the micro-turbulence and rotational velocity to vary from the values determined by the best fit to the optical data. At each step of the iterative solution, we interpolate in the grid of TLUSTY models to the desired parameters, and recalculate the synthetic spectrum. The Levenberg-Marquardt algorithm (Markwardt, 2009), was then used to find the best fit.
To estimate the errors, in addition to calculating the formal fitting errors, we perturb a number of our assumptions and then redetermine the best fit boron abundance for each case. Our detailed procedure is as follows:
-
1.
Correlated error in and : These parameters are tightly correlated, as adopting a higher requires a higher to fit the Balmer lines. So we will perturb these together using the best fit correlation between Teff and logg as determined from fitting the H- line. The adopted temperature error is either 1000 or 1500K (see table /reftab:optical), while the corresponding gravity variation varies from 0.1 to 0.15 dex per 1000K, similar to the quoted errors in .
-
2.
Error in at fixed : We also calculate the change in boron abundance for a 0.05 dex change in at fixed .
-
3.
Formal fitting error: The Marquardt-Levenburg algorithm returns an error estimate for each variable. By refitting just the boron line with all other parameters frozen, we can get an estimate of the expected errors due to the S/N of the data. For most of our stars, these errors are in the range of 2 to 5%.
-
4.
Uncertainties in line synthesis: We do an alternate set of calculations with the modified line parameters for blending lines discussed below, and take the difference between the boron abundance derived with the two line sets as an additional error term. For the more rapidly rotating stars in this sample, the impact of blending lines can be larger than was the case for the stars analyzed by Proffitt et al. (2016), and so we reconsidered the lines close to the boron feature (Table 5) to ensure that we were not underestimating the opacity in these blending features. Most of the opacity in the blending lines just shortward of the boron feature is from Fe III lines which are treated in NLTE in the TLUSTY models. However, the opacity immediately longward of the boron line is mostly due to Mn III with a Ni III line also contributing. The Mn and Ni lines are treated only in LTE in the TLUSTY models and this may introduce errors that vary as a function of and due to differential NLTE effects that we are not accounting for. For the Mn III line at 2066.546 Å, we adopted the nominal transition probability (Kurucz, 2010), although previous work, (Proffitt et al., 1999), had suggested that a value lower by 0.25 to 0.28 dex might be more appropriate. We have also increased the opacity in the blend of Fe III Å (vacuum wavelength) and Mn III Å lines just shortward of the B III 2066.4 Å line. In the narrow lined template stars that Proffitt et al. (2016) used to fine-tune the line list, these lines are normally blended with the ISM Cr II line at 2066.164 Å, and so are difficult to evaluate empirically, but a reconsideration of the high S/N spectrum of HD 36285 led us to also increase the opacity in this blend.
-
5.
Errors in continuum normalization: To estimate the effects of errors in the flat fielding of the spectra, we perturb the overall continuum normalization by 0.5% while leaving all other parameters fixed. For the broad-lined stars, especially at the lower masses, this term is often the dominant one in the error analysis.
All of the above errors are then added in quadrature to derive the final error estimate. Upper limits are a bit more subjective, but include consideration of the perturbed model that found the highest boron abundance and the estimated errors for that model. Note that for ESL006, all cases yield valid fits with non-zero abundances, but many of these aren’t significantly different from the no-boron case and so we’ve assigned an upper limit for this one as well, even though our procedure formally finds a NLTE corrected boron abundance of for this star.
We note that the overall rms variation in our measured abundances for ESL 23, 24, 28, 30, 31, and 38 is only about 0.16 dex, while our mean estimated ”error” for these stars is 0.23 dex, This suggests that our normalization and error estimation procedures are at least consistent from star-to-star, although this leaves open the possibility of a larger systematic error that affects all of these stars uniformly.
| (vac) | (air) | Ion | E (lower) | comments | |
|---|---|---|---|---|---|
| Å | Å | cm-1 | |||
| 2065.880 | 2065.220 | Fe III | -1.55 | 89697.471 | |
| 2065.898 | 2065.238 | Fe III | -2.47 | 84159.501 | |
| 2065.935 | 2065.275 | Fe III | 0.00 | 130856.736 | |
| 2065.936 | 2065.276 | Fe III | -0.77 | 89783.551 | |
| 2066.144 | 2065.484 | Fe III | -0.17 | 130861.645 | Scaled to match HD36285 |
| 2066.160 | 2065.500 | Mn III | -0.29 | 94697.847 | Scaled to match HD36285 |
| 2066.430 | 2065.771 | 11B III | -0.413 | 0.000 | Mean of hyperfine, scaled by 0.8 |
| 2066.115 | 2065.455 | 10B III | -1.014 | 0.000 | Mean of hyperfine, scaled by 0.2 |
| 2066.546 | 2065.886 | Mn III | 0.01 | 85346.719 | |
| 2066.824 | 2066.164 | Ni III | -0.95 | 85834.200 | Scaled to match HD36285 |
| 2067.032 | 2066.372 | Mn III | 0.57 | 85077.091 | |
| 2067.084 | 2066.424 | Ni III | -0.59 | 86645.880 | |
| 2067.101 | 2066.441 | Mn III | -0.16 | 94771.466 |
The quality of the fits we obtain are very similar to those found in Proffitt et al. (2016). However, the abundances are generally somewhat smaller due to the increases in line opacity discussed above. For the cooler, higher gravity stars where the boron abundance is relatively large, these changes are largely offset by the somewhat lower effective temperatures we have adopted here relative to Proffitt et al. (2016). For the partially depleted stars the differences are somewhat larger.
Our final adopted boron abundances and uncertainties are shown in Table 6, and for the stars in common these are compared to the values of Proffitt et al. (2016). While the spectral synthesis of boron is also done in LTE as the TLUSTY models do not include this model ion, we estimate the NLTE correction using the results of Venn et al. (2002). In interpreting these results, it is important to consider other issues not considered in the formal fits that can potentially effect the derived abundances.
In particular, throughout this analysis we neglect the impact of the rotational distortion of the star on the emitted spectrum, which will in fact depend on rotational velocity and aspect angle, . For example, our treatment of rotational broadening uses a simple broadening function that conserves equivalent width, hence it’s natural to wonder to what extent this compromises our results. However, Collins et al. (1991) has performed detailed LTE calculations of the continua, H, He and Mg II line profiles for a grid of B-type stars (B1 to B9 dwarfs and giants) with various rotational velocities and values. These results demonstrate that there is significant impact on the line profiles only for cases where the rotational velocities greater than % critical, and are strongest at high inclination. While we cannot as yet rule out such a configuration for an individual star, we infer that our sample is likely not significantly affected by the simplified treatment of rotation. At higher rotational rates, more detailed calculations of the effect on the relative line strengths would be needed, (Frémat et al., 2005).
| This work | Proffitt et al. (2016) | |||||||||
|---|---|---|---|---|---|---|---|---|---|---|
| ESL # | RV | B (LTE) | B (NLTE) | B (NLTE) | ||||||
| 02 | 24200 | 3.00 | 18.49 | 89.9 | 23200 | 2.80 | ||||
| 03 | 22500 | 3.00 | 17.20 | 83.6 | 22100 | 2.95 | ||||
| 04 | 24000 | 3.04 | 15.11 | 99.8 | 24200 | 3.30 | ||||
| 05 | 22700 | 3.00 | 12.59 | 184.2 | ||||||
| 06 | 24000 | 3.15 | 15.96 | 211.4 | ||||||
| 07 | 23150 | 3.08 | 9.99 | 56.0 | 24100 | 3.20 | ||||
| 08 | 23600 | 3.40 | 10.23 | 138.2 | 25200 | 3.60 | ||||
| 10 | 23600 | 3.55 | 8.02 | 72.5 | 24500 | 3.50 | ||||
| 12 | 24500 | 3.70 | 7.29 | 102.3 | 23800 | 3.55 | ||||
| 15 | 26000 | 3.80 | 8.72 | 293.6 | ||||||
| 16 | 25300 | 3.80 | 5.64 | 54.0 | ||||||
| 19 | 25500 | 3.75 | 3.90 | 129.1 | 25000 | 3.85 | ||||
| 23 | 22700 | 3.90 | 1.48 | 168.6 | 24300 | 3.80 | ||||
| 24 | 22200 | 3.85 | 1.71 | 150.9 | 24300 | 3.90 | ||||
| 28 | 21200 | 3.90 | 1.35 | 221.5 | ||||||
| 30 | 19800 | 3.80 | 1.32 | 214.7 | ||||||
| 31 | 21000 | 4.00 | 1.38 | 265.3 | ||||||
| 38 | 20200 | 3.95 | 0.92 | 229.0 | ||||||
Even in the absence of significant gravity darkening, there are other uncertainties to consider. For the relatively narrow-lined star ESL 07 and ESL 016, the Cr II ISM feature obscures most of the equivalent width of the stellar boron feature. While in principle one could attempt to fit a model of the ISM to the three members of the Cr II triplet that are covered by our data, in practice the COS G185M does not quite resolve the individual components, the strength of which appear to vary significantly and independently between site-lines in this cluster. In addition, the other two components of the triplet fall in regions where the stellar opacity is changing rapidly introducing additional uncertainties. Given other uncertainties in the spectral syntheses, in practice we have only adopted upper limits for the boron abundance in these two stars. This also provides an illustration of the limits to which we can trust our spectral synthesis. In this star, with our default line list, the blend just red-ward of the boron feature in ESL 016, (Fig. 3a), includes a bit too much absorption even in the absence of any boron. Reducing the Mn III 2066.546 Å line by 0.35 dex and of the Ni III 2066.824 Å line by 0.3 dex (restoring the latter to its canonical value), resolves that discrepancy, (Fig. 3b), allowing a larger boron abundance. So for this star, and the similarly narrow-lined ESL 07, after consideration of such uncertainties, we adopt only upper limits to the boron abundance.
For the lower mass stars in our sample, ESL 23, 24, 28, 30, 31, and 38, we find significantly larger boron abundances, and applying the same line list change we illustrated for ESL 016 would only increase the abundances by 0.1 to 0.15 dex. Our fits for ESL 28, 30, 31, and 38 are shown in Figure 4, and our new fits to ESL 023 and 024 are qualitatively similar to those of Proffitt et al. (2016).
The more evolved broad-lined stars are subject to additional uncertainties, due both to their apparently lower boron abundances and to the larger impact expected from rotational distortions. For ESL 005, (Fig. 5a), there does appear to be some additional opacity at the location of the boron line, but the overall shape of this spectral region is not well matched by the synthesis. For ESL006, (Fig. 5b), the overall fit is somewhat better, but the best fit boron abundance can not be distinguished from zero. Both stars show extra absorption in the blue wing of the strong blend centered around the Ti IV 2066.241 Å and Fe III 2066.915Å lines. In ESL 015, (Fig. 5c), this extra absorption near 2067 Å is even more prominent and we have excluded the affected region from our fit to the boron feature.
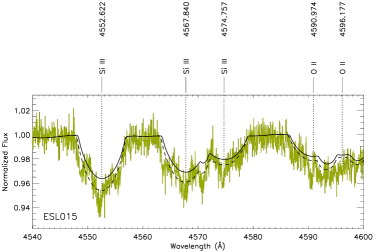
Hunter et al. (2009) had measured nitrogen abundances for most stars in their NGC 3293 sample, finding that, apart from ESL 01 and 02, there was otherwise no evidence for enhanced nitrogen in any of their stars. However, they did not derive an abundance for ESL 015, and in our initial attempt to do this, we were surprised when a preliminary fit to the 3995 Å N II feature using the parameters in Table 2 suggested a nitrogen enhancement of about 0.3 dex relative to the other stars, especially given our apparent detection of a large boron abundance for this star. However, a closer examination of the optical spectrum suggests that many of the lines are affected by additional narrow absorption features that are not reproduced by the broad-lined synthetic spectrum. This can be seen, for example, in the Si III triplet near 4560 Å (see 6), where there appear to be additional sharp features shifted with respect to the best fit synthetic spectrum by approximately , , and km/s, with the same features appearing to repeat in each member of the triplet. Such line profile variations have been seen in other Cephei stars, (e.g. Telting & Schrijvers (1998); Schrijvers et al. (2004). Similar effects in the weaker and noisier N II line could easily cause an overestimate of that line’s equivalent width. Until the impact of such line profile variations on abundance determinations can be taken into account, results for this star in particular should be treated with caution. While a number of our other targets are Cephei variables, none of these appear to show such obvious distortions of the line profiles.
ht
5 Comparison with Stellar Model Predictions
The boron abundance measurements obtained and reported here show that boron is at least partially depleted in most of the early B-type main sequence stars in this cluster. While this is consistent with earlier measurements of boron in many similar field stars, below we will discuss the constraints these observations put on stellar evolution models thanks to their cluster membership.
Since rotationally induced mixing has been suggested as depletion mechanism, (Fliegner et al., 1996; Venn et al., 1996; Frischknecht et al., 2010; Langer et al., 2010; Brott et al., 2011a), we computed a dense grid of rotating single star models with MESA, (Jin et al., 2023), with most of the physics assumptions as in the work of Brott et al. (2011a). We use the canonical rotational mixing efficiency based on a theoretical work by Chaboyer & Zahn (1992) that is widely adopted in the literature (, cf. Heger et al., 2000; Marchant, 2017; Menon et al., 2021; Keszthelyi et al., 2022). Note that Brott et al. (2011a) adopted slightly weaker rotational mixing efficiency than the canonical value . We then used these models to produce synthetic populations for comparison with our observational data. These predictions are based on a population synthesis assuming a Salpeter (1955) initial mass function, a distribution of initial rotational velocities for early B dwarfs in the Tarantula region of the LMC given by Dufton et al. (2013), and an initial boron abundance of 2.76, (matching the initial estimated solar abundance of Asplund et al. (2021)).
The adopted initial rotational velocity distribution is bimodal, with about one quarter of the stars being slow rotators with a distribution peak at , and three quarters are fast rotators with a distribution peaking at , (cf. tab. 6 of Dufton et al., 2013). Similar bimodal rotational velocity distributions are also found in young star clusters, where they manifest as split main sequences in high precision color-magnitude diagrams, (e.g., Milone et al., 2023; Wang et al., 2023), and where they are also spectroscopically verified, (Kamann et al., 2023; Bodensteiner et al., 2023). Notably, the origin of the bimodality is still under debate, (cf. Bastian et al., 2020; Wang et al., 2022), and the boron surface abundance distribution may hold interesting clues.
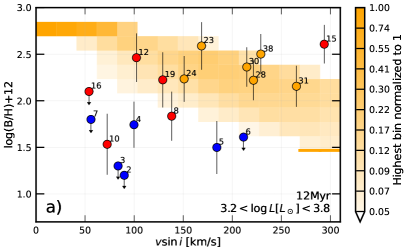
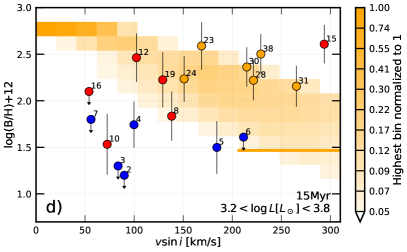
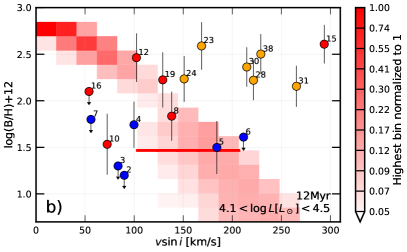
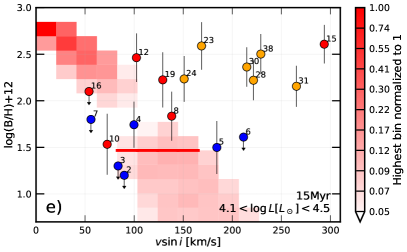
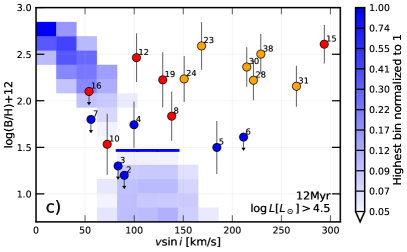
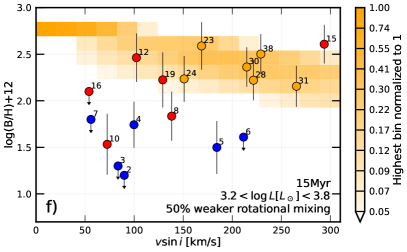
To test the concept of boron depletion by rotational mixing, a Hunter-type diagram (surface abundance versus ) appears well suited. It has been employed repeatedly using the nitrogen surface abundance, (Hunter et al., 2008a, 2009; Brott et al., 2011a; Mahy et al., 2015; Grin et al., 2017), as well as boron, (Frischknecht et al., 2010; Langer et al., 2010). We show in Fig. 7 the boron Hunter diagram of all main sequence stars in NGC 3293 for which boron abundances have been measured or constrained so far. Since faster rotation is thought to lead to faster boron depletion, a corresponding trend may be expected, but the bulk of the data does not show such a trend. However, a trend of a decreasing boron abundance for stars with larger v sin i is expected for an unbiased massive single star population produced via constant star formation, even though with considerable scatter, (Langer et al., 2010). Our sample deviates from such a population. Instead of sampling random ages, our targets belong to an open star cluster, and can be therefore considered as coeval. As such, they contain stars near the cluster turn-off, which are close to ending core hydrogen burning, and stars of roughly half the turn-off mass and bolometrically 30-times fainter (cf., Fig.2), which so far consumed just less than 10% of their initial hydrogen in their core. Stellar models including rotational mixing do predict a faster boron depletion in more rapidly rotating stars. In addition, the depletion timescale drops rapidly with stellar mass, such that in two coeval stellar models with the same rotational velocity, the more massive one is expected to show more boron depletion, (cf., fig. 11 of Brott et al., 2011a).
To illustrate this, we split the boron-Hunter diagram into three panels (Fig. 7, Panels a, b, c), corresponding to three luminosity ranges which contain the investigated stars (cf., Fig. 2). The synthetic sub-populations in these three luminosity intervals form rather linear streaks in the Hunter plots, which are all anchored at the solar boron abundance for , and which become steeper at higher luminosities. These streaks sweep almost through the whole area of the Hunter plot, and reflect the strong dependence of the surface boron abundance in coeval rotating main sequence star models on mass or luminosity. It can be seen that the corresponding observed sub-populations roughly follow the trends suggested by the synthetic sub-populations (except for ESL 15, which we ignore here for reasons pointed out in Sect. 4). Our data may therefore indeed be suited to validate and constrain rotational mixing, as we pursue below.
A closer look shows, however, that the slowest rotators in our sample are all strongly boron depleted. In particular for the mid- and high-luminosity groups, our models can not reproduce all observed stars with the same mixing efficiency and age. We consider this as an indication that a different boron depletion mechanism operated in the slow rotators, and postulate here, that the five stars with the smallest v sin i (ESL 16, 7, 10, 3 and 2) are intrinsic slow rotators, i.e., belong to the 25% of stars with a peculiar formation history, which may not be reflected by our single star models. While for each individual star this can not be proven, the likelihood that, e.g., ESL 16 belongs to the population of rapid rotators is less than 20%.
The remaining stars do show both expected trends, a stronger boron depletion for faster rotation and for higher luminosity, as predicted by our models, which can be exploited quantitatively. A close inspection of panels a-c of Fig. 7 shows that in all three luminosity ranges, less mixing than adopted in the stellar models would lead to a better agreement. This is even more so when an older age of NGC 3293 is considered, as shown by Panels d and e. Panel f in Fig. 7 illustrates the effect of reducing the efficiency parameter for rotational mixing by 50%, (). Notably, an older age can be compensated by a smaller mixing efficiency. Since an age of 12 Myr is at the lower end of the most recently proposed ages for NGC3293, (cf., Morel et al., 2022), we conclude that rotational mixing is likely less efficient than assumed in our models. Assuming we do interpret the small additional dip in the spectrum of ESL 05 (5a, relative to the otherwise similar ESL 06 (5b) as a detection of boron, then the resulting boron abundance of this star may provide the strongest constraint on a reduced rotational mixing efficiency.
The above analysis shows that stellar models including rotational mixing can reproduce both observed trends of the boron abundance with rotation and mass or luminosity. This supports the idea of rotational mixing being the dominating boron depletion mechanism in the rapidly rotating majority of early B type stars. Assuming a different boron depletion mechanism for the slow rotators helps this view, and sheds new light on their origin.
This population was uncovered by Hunter et al. (2008b), who were the first to identify a group of intrinsically slowly rotating early B dwarfs with a strong diversity in nitrogen enrichments, such that the nitrogen enrichment could not be associated to rotational mixing. While boron is not measured in these stars, it can be argued that any nitrogen enrichment process is likely to lead to boron depletion, since the CNO cycle operates at temperatures at which boron is completely destroyed. The boron measurements in the slow rotators of our sample provide new, strong constraints on the evolutionary history of such stars, because in some of them, boron is only partly depleted (ESL 10, and perhaps ESL 04), and nitrogen is not enhanced (see also Morel et al., 2008).
Perhaps, ESL 2 in our sample, and to a lesser extent also ESL 3, 7, can be considered as a smoking gun in this context. ESL 2 is an apparently slow rotator, strongly boron depleted, and the only star in our sample which is nitrogen-enriched. Its location in the HR diagram clearly identifies it as a blue straggler (Fig. 2). Blue stragglers are thought to be the products of binary mass transfer or stellar mergers, (Schneider et al., 2015). According to recent models, merger products in the mass range considered here may be slow rotators (Schneider et al., 2019) and show various degrees of nitrogen enrichments, from none to strong, (Glebbeek et al., 2013). Wang et al. (2022) have proposed that the slow rotators which form the bluer main sequence in young star clusters originate from stellar mergers. The boron abundances found in our sample stars may therefore fit into a consistent picture, with the majority of fast rotators enriching nitrogen and depleting boron by rotational mixing, and the slow rotators having a history of strong binary interaction. Slow rotators in which boron is not fully destroyed could support the suggestion of pre-main sequence mergers, (Tokovinin & Moe, 2020; Wang et al., 2022). To turn this idea from a working hypothesis into a theory, significantly more boron measurements, as well as merger models that include proton captures on boron, are required.
One possible caveat to the arguments above, is that, as discussed by Heger et al. (2000), rotational mixing can result from several distinct processes, and so adjusting the rotational mixing efficiency by the tuning of a single overall parameter may lead to misleading results when comparing stars in different regimes where the relative contributions of the various rotationally driven instabilities may differ. Exploration of this possibility will require additional theoretical work and will not be further discussed here.
6 Discussion and conclusions
The measurements of boron and nitrogen surface abundances in main sequence B type stars of this young open star cluster provide a unique opportunity to shed light on the origin of contamination of a significant fraction of these stars with the products of hydrogen fusion. The best quantitative interpretation of these measurements in terms of rotationally induced mixing in the stellar interior requires us to disregard the five most slowly rotating of our targets, which we tentatively consider as binary products where mixing mechanisms other than rotation dominate. We can then conclude that rotational mixing appears likely as explanation of the observed abundances of the remaining stars, since the trends of the surface abundances with stellar rotation and luminosity are in good agreement with the observations. Obtaining the best quantitative fit to the data does require a reduced mixing efficiency, , to best fit the data, which is significantly lower than either the value of 0.022 adopted by Chaboyer & Zahn (1992); Heger et al. (2000); Brott et al. (2011a), or the standard value of 0.033 adopted by the models of Frischknecht et al. (2010).
The binary interpretation of the slow rotators is only based on circumstantial evidence (cf. Sect.5). A rigorous analysis including the surface abundances of the slow rotators must await corresponding models predictions (Jin et al., in prep.). Nevertheless, we were able to construct a working hypothesis that the majority of rapidly rotating upper main sequence stars undergo mild rotationally induced mixing while the slow rotators are mostly merger products. While this is free of immediate contradictions, it is based on only 18 total stars, and so our conclusions may be sensitive to statistical fluctuations. It also leaves out the fastest rotators in young open clusters, i.e., the Be stars, which have been suggested to originate from mass transfer in binaries (Pols et al. 1991 A&A, 241, 419; Hastings et al. 2021A&A…653A.144), and the roles of pulsations (Varghese et al., 2023ApJ…942…53) and magnetic fields (Meynet et al. 2011A&A…525L..11), which could amplify or reduce internal mixing. Further observations and stellar interior calculations are thus needed to come to more definite conclusions.
Acknowledgements Based on observations with the NASA/ESA Hubble Space Telescope obtained [from the Data Archive] at the Space Telescope Science Institute, which is operated by the Association of Universities for Research in Astronomy, Incorporated, under NASA contract NAS5-26555. Support for program number 14673 was provided through a grant from the STScI under NASA contract NAS5-26555. Much of the data presented in this paper were obtained from the Mikulski Archive for Space Telescopes (MAST) at the Space Telescope Science Institute. The specific observations analyzed can be accessed via https://doi.org/10.17909/7vgt-zq5 (catalog https://doi.org/10.17909/7vgt-zq5). STScI is operated by the Association of Universities for Research in Astronomy, Inc., under NASA contract NAS5–26555. Support to MAST for these data is provided by the NASA Office of Space Science via grant NAG5–7584 and by other grants and contracts. SD acknowledges CNPq/MCTI for grant 306859/2022-0. DJL is supported by the Spanish Government Ministerio de Ciencia e Innovación through grants PID2021-122397NB-C21 and SEV 2015-0548. This paper also made use of data obtained from the ESO Science Archive Facility and observed using ESO Telescopes at the La Silla Paranal Observatory under ESO observing program IDs 73.D-0234, 171.D-0237, 081.A-9006, 081.A-9008, and 188.B-3002. We also thank Jesús Maíz Apellániz for useful discussions on the distance to NGC 3293.
References
- Ake et al. (2010) Ake, T. B., Burgh, E. B., & Penton, S. V. 2010, COS Near-UV Flat Fields and High S/N Determination from SMOV Data, COS Instrument Science Report 2010-03(v1), 12 pages
- Asplund et al. (2021) Asplund, M., Amarsi, A. M., & Grevesse, N. 2021, A&A, 653, A141, doi: 10.1051/0004-6361/202140445
- Balona (1994) Balona, L. A. 1994, MNRAS, 267, 1060, doi: 10.1093/mnras/267.4.1060
- Bastian et al. (2020) Bastian, N., Kamann, S., Amard, L., et al. 2020, MNRAS, 495, 1978, doi: 10.1093/mnras/staa1332
- Bastian et al. (2018) Bastian, N., Kamann, S., Cabrera-Ziri, I., et al. 2018, MNRAS, 480, 3739, doi: 10.1093/mnras/sty2100
- Baume et al. (2003) Baume, G., Vázquez, R. A., Carraro, G., & Feinstein, A. 2003, A&A, 402, 549, doi: 10.1051/0004-6361:20030223
- Bessell (2000) Bessell, M. S. 2000, PASP, 112, 961, doi: 10.1086/316598
- Bisht et al. (2021) Bisht, D., Zhu, Q., Yadav, R. K. S., et al. 2021, MNRAS, 503, 5929, doi: 10.1093/mnras/stab691
- Bodensteiner et al. (2023) Bodensteiner, J., Sana, H., Dufton, P. L., et al. 2023, arXiv e-prints, arXiv:2308.14799, doi: 10.48550/arXiv.2308.14799
- Bragança et al. (2019) Bragança, G. A., Daflon, S., Lanz, T., et al. 2019, A&A, 625, A120, doi: 10.1051/0004-6361/201834554
- Brott et al. (2011a) Brott, I., de Mink, S. E., Cantiello, M., et al. 2011a, A&A, 530, A115, doi: 10.1051/0004-6361/201016113
- Brott et al. (2011b) Brott, I., Evans, C. J., Hunter, I., et al. 2011b, A&A, 530, A116, doi: 10.1051/0004-6361/201016114
- Chaboyer & Zahn (1992) Chaboyer, B., & Zahn, J. P. 1992, A&A, 253, 173
- Cochetti et al. (2020) Cochetti, Y. R., Zorec, J., Cidale, L. S., et al. 2020, A&A, 634, A18, doi: 10.1051/0004-6361/201936444
- Collins et al. (1991) Collins, George W., I., Truax, R. J., & Cranmer, S. R. 1991, ApJS, 77, 541, doi: 10.1086/191616
- Cordoni et al. (2018) Cordoni, G., Milone, A. P., Marino, A. F., et al. 2018, ApJ, 869, 139, doi: 10.3847/1538-4357/aaedc1
- de Mink et al. (2014) de Mink, S. E., Sana, H., Langer, N., Izzard, R. G., & Schneider, F. R. N. 2014, ApJ, 782, 7, doi: 10.1088/0004-637X/782/1/7
- Dias et al. (2021) Dias, W. S., Monteiro, H., Moitinho, A., et al. 2021, MNRAS, 504, 356, doi: 10.1093/mnras/stab770
- Dufton et al. (2006) Dufton, P. L., Smartt, S. J., Lee, J. K., et al. 2006, A&A, 457, 265, doi: 10.1051/0004-6361:20065392
- Dufton et al. (2013) Dufton, P. L., Langer, N., Dunstall, P. R., et al. 2013, A&A, 550, A109, doi: 10.1051/0004-6361/201220273
- Dupree et al. (2017) Dupree, A. K., Dotter, A., Johnson, C. I., et al. 2017, ApJ, 846, L1, doi: 10.3847/2041-8213/aa85dd
- Ekström et al. (2012) Ekström, S., Georgy, C., Eggenberger, P., et al. 2012, A&A, 537, A146, doi: 10.1051/0004-6361/201117751
- Evans et al. (2005) Evans, C. J., Smartt, S. J., Lee, J. K., et al. 2005, A&A, 437, 467, doi: 10.1051/0004-6361:20042446
- Fitzpatrick et al. (2019) Fitzpatrick, E. L., Massa, D., Gordon, K. D., Bohlin, R., & Clayton, G. C. 2019, ApJ, 886, 108, doi: 10.3847/1538-4357/ab4c3a
- Fliegner et al. (1996) Fliegner, J., Langer, N., & Venn, K. A. 1996, A&A, 308, L13
- Frémat et al. (2005) Frémat, Y., Zorec, J., Hubert, A. M., & Floquet, M. 2005, A&A, 440, 305, doi: 10.1051/0004-6361:20042229
- Frischknecht et al. (2010) Frischknecht, U., Hirschi, R., Meynet, G., et al. 2010, A&A, 522, A39, doi: 10.1051/0004-6361/201014340
- Gies & Lambert (1992) Gies, D. R., & Lambert, D. L. 1992, ApJ, 387, 673, doi: 10.1086/171116
- Glebbeek et al. (2013) Glebbeek, E., Gaburov, E., Portegies Zwart, S., & Pols, O. R. 2013, MNRAS, 434, 3497, doi: 10.1093/mnras/stt1268
- Grin et al. (2017) Grin, N. J., Ramírez-Agudelo, O. H., de Koter, A., et al. 2017, A&A, 600, A82, doi: 10.1051/0004-6361/201629225
- Heger et al. (2000) Heger, A., Langer, N., & Woosley, S. E. 2000, ApJ, 528, 368, doi: 10.1086/308158
- Herrero et al. (1992) Herrero, A., Kudritzki, R. P., Vilchez, J. M., et al. 1992, in The Atmospheres of Early-Type Stars, ed. U. Heber & C. S. Jeffery, Vol. 401, 21, doi: 10.1007/3-540-55256-1_269
- Hunter et al. (2008a) Hunter, I., Lennon, D. J., Dufton, P. L., et al. 2008a, A&A, 479, 541, doi: 10.1051/0004-6361:20078511
- Hunter et al. (2008b) Hunter, I., Brott, I., Lennon, D. J., et al. 2008b, ApJ, 676, L29, doi: 10.1086/587436
- Hunter et al. (2009) Hunter, I., Brott, I., Langer, N., et al. 2009, A&A, 496, 841, doi: 10.1051/0004-6361/200809925
- Jin et al. (2023) Jin, H., Langer, N., Lennon, D., & Proffitt, C. R. 2023, in prep
- Kamann et al. (2023) Kamann, S., Saracino, S., Bastian, N., et al. 2023, MNRAS, 518, 1505, doi: 10.1093/mnras/stac3170
- Keszthelyi et al. (2022) Keszthelyi, Z., de Koter, A., Götberg, Y., et al. 2022, MNRAS, 517, 2028, doi: 10.1093/mnras/stac2598
- Kurucz (2010) Kurucz, R. L. 2010, Robert L. Kurucz on-line database of observed and predicted atomic transitions
- Langer (2012) Langer, N. 2012, ARA&A, 50, 107, doi: 10.1146/annurev-astro-081811-125534
- Langer et al. (2010) Langer, N., Brott, I., Cantiello, M., et al. 2010, in Progenitors and Environments of Stellar Explosions, 17
- Lanz & Hubeny (2007) Lanz, T., & Hubeny, I. 2007, ApJS, 169, 83, doi: 10.1086/511270
- Mackey & Broby Nielsen (2007) Mackey, A. D., & Broby Nielsen, P. 2007, MNRAS, 379, 151, doi: 10.1111/j.1365-2966.2007.11915.x
- Maeder & Meynet (2010) Maeder, A., & Meynet, G. 2010, New A Rev., 54, 32, doi: 10.1016/j.newar.2010.09.017
- Mahy et al. (2015) Mahy, L., Rauw, G., De Becker, M., Eenens, P., & Flores, C. A. 2015, A&A, 577, A23, doi: 10.1051/0004-6361/201321985
- Maíz Apellániz (2007) Maíz Apellániz, J. 2007, in Astronomical Society of the Pacific Conference Series, Vol. 364, The Future of Photometric, Spectrophotometric and Polarimetric Standardization, ed. C. Sterken, 227, doi: 10.48550/arXiv.astro-ph/0609430
- Maíz Apellániz et al. (2022) Maíz Apellániz, J., Barbá, R. H., Fernández Aranda, R., et al. 2022, A&A, 657, A131, doi: 10.1051/0004-6361/202142364
- Marchant (2017) Marchant, P. 2017, PhD thesis, Rheinische Friedrich Wilhelms University of Bonn, Germany
- Marino et al. (2018) Marino, A. F., Przybilla, N., Milone, A. P., et al. 2018, AJ, 156, 116, doi: 10.3847/1538-3881/aad3cd
- Markwardt (2009) Markwardt, C. B. 2009, in Astronomical Society of the Pacific Conference Series, Vol. 411, Astronomical Data Analysis Software and Systems XVIII, ed. D. A. Bohlender, D. Durand, & P. Dowler, 251, doi: 10.48550/arXiv.0902.2850
- Mendel et al. (2006) Mendel, J. T., Venn, K. A., Proffitt, C. R., Brooks, A. M., & Lambert, D. L. 2006, ApJ, 640, 1039, doi: 10.1086/500252
- Menon et al. (2021) Menon, A., Langer, N., de Mink, S. E., et al. 2021, MNRAS, 507, 5013, doi: 10.1093/mnras/stab2276
- Milone et al. (2023) Milone, A. P., Cordoni, G., Marino, A. F., et al. 2023, A&A, 672, A161, doi: 10.1051/0004-6361/202244798
- Morel et al. (2008) Morel, T., Hubrig, S., & Briquet, M. 2008, A&A, 481, 453, doi: 10.1051/0004-6361:20078999
- Morel et al. (2022) Morel, T., Blazère, A., Semaan, T., et al. 2022, A&A, 665, A108, doi: 10.1051/0004-6361/202244112
- Paxton et al. (2011) Paxton, B., Bildsten, L., Dotter, A., et al. 2011, ApJS, 192, 3, doi: 10.1088/0067-0049/192/1/3
- Paxton et al. (2013) Paxton, B., Cantiello, M., Arras, P., et al. 2013, ApJS, 208, 4, doi: 10.1088/0067-0049/208/1/4
- Paxton et al. (2015) Paxton, B., Marchant, P., Schwab, J., et al. 2015, ApJS, 220, 15, doi: 10.1088/0067-0049/220/1/15
- Paxton et al. (2018) Paxton, B., Schwab, J., Bauer, E. B., et al. 2018, ApJS, 234, 34, doi: 10.3847/1538-4365/aaa5a8
- Paxton et al. (2019) Paxton, B., Smolec, R., Schwab, J., et al. 2019, ApJS, 243, 10, doi: 10.3847/1538-4365/ab2241
- Proffitt et al. (1999) Proffitt, C. R., Jönsson, P., Litzén, U., Pickering, J. C., & Wahlgren, G. M. 1999, ApJ, 516, 342, doi: 10.1086/307095
- Proffitt et al. (2016) Proffitt, C. R., Lennon, D. J., Langer, N., & Brott, I. 2016, ApJ, 824, 3, doi: 10.3847/0004-637X/824/1/3
- Proffitt & Quigley (2001) Proffitt, C. R., & Quigley, M. F. 2001, ApJ, 548, 429, doi: 10.1086/318673
- Przybilla et al. (2010) Przybilla, N., Firnstein, M., Nieva, M. F., Meynet, G., & Maeder, A. 2010, A&A, 517, A38, doi: 10.1051/0004-6361/201014164
- Riello et al. (2021) Riello, M., De Angeli, F., Evans, D. W., et al. 2021, A&A, 649, A3, doi: 10.1051/0004-6361/202039587
- Rivero González et al. (2012) Rivero González, J. G., Puls, J., Najarro, F., & Brott, I. 2012, A&A, 537, A79, doi: 10.1051/0004-6361/201117790
- Salpeter (1955) Salpeter, E. E. 1955, ApJ, 121, 161, doi: 10.1086/145971
- Sana et al. (2012) Sana, H., de Mink, S. E., de Koter, A., et al. 2012, Science, 337, 444, doi: 10.1126/science.1223344
- Schneider et al. (2015) Schneider, F. R. N., Izzard, R. G., Langer, N., & de Mink, S. E. 2015, ApJ, 805, 20, doi: 10.1088/0004-637X/805/1/20
- Schneider et al. (2019) Schneider, F. R. N., Ohlmann, S. T., Podsiadlowski, P., et al. 2019, Nature, 574, 211, doi: 10.1038/s41586-019-1621-5
- Schonberner et al. (1988) Schonberner, D., Herrero, A., Becker, S., et al. 1988, A&A, 197, 209
- Schrijvers et al. (2004) Schrijvers, C., Telting, J. H., & Aerts, C. 2004, A&A, 416, 1069, doi: 10.1051/0004-6361:20031731
- Smith (2006) Smith, N. 2006, ApJ, 644, 1151, doi: 10.1086/503766
- Stankov & Handler (2005) Stankov, A., & Handler, G. 2005, ApJS, 158, 193, doi: 10.1086/429408
- Telting & Schrijvers (1998) Telting, J. H., & Schrijvers, C. 1998, A&A, 339, 150
- Tokovinin & Moe (2020) Tokovinin, A., & Moe, M. 2020, MNRAS, 491, 5158, doi: 10.1093/mnras/stz3299
- Venn et al. (2002) Venn, K. A., Brooks, A. M., Lambert, D. L., et al. 2002, ApJ, 565, 571, doi: 10.1086/324435
- Venn et al. (1996) Venn, K. A., Lambert, D. L., & Lemke, M. 1996, A&A, 307, 849, doi: 10.48550/arXiv.astro-ph/9508001
- Wang et al. (2022) Wang, C., Langer, N., Schootemeijer, A., et al. 2022, Nature Astronomy, 6, 480, doi: 10.1038/s41550-021-01597-5
- Wang et al. (2023) Wang, C., Hastings, B., Schootemeijer, A., et al. 2023, A&A, 670, A43, doi: 10.1051/0004-6361/202245413