Anomalous Behavior in the Nucleation of Ice at Negative Pressures
Abstract
Ice nucleation is a phenomenon that, despite the relevant implications for life, atmospheric sciences and technological applications, is far from being completely understood, especially under extreme thermodynamic conditions. In this work we present a computational investigation of the homogeneous ice nucleation at negative pressures. By means of the seeding technique we estimate the size of the ice critical nucleus for the TIP4P/Ice water model. This is done along the isotherms , , and , from positive to negative pressures until reaching the liquid-gas kinetic stability limit (where cavitation cannot be avoided). We find that is non-monotonic upon depressurization, reaching a minimum at negative pressures in the doubly metastable region of water. According to classical nucleation theory we establish the nucleation rate and the surface tension , revealing a retracing behavior of both when the liquid-gas kinetic stability limit is approached. We also predict a reentrant behavior of the homogeneous nucleation line. The re-entrance of these properties is related to the re-entrance of the coexistence line at negative pressure, revealing new anomalies of water. The results of this work suggest the possibility of having metastable samples of liquid water for long times at negative pressure provided that heterogeneous nucleation is suppressed.
∗Corresponding author: cvega@quim.ucm.es
Ice formation is possibly the most important liquid-to-solid transition, being relevant in cryo-biology, food storage, material science, and Earth science Gettelman et al. (2010); Coluzza et al. (2017); Nitzbon et al. (2020); John Morris and Acton (2013); Bar Dolev et al. (2016); Broekaert et al. (2011); Russo et al. (2014); Bintanja et al. (2013). Homogeneous nucleation is the mechanism through which thermal fluctuations in a pure liquid below coexistence induce the formation of crystal nuclei that, when sufficiently large (critical size), trigger the crystallization.
At ambient pressure and a few kelvins below coexistence, the size of the critical nucleus is huge and the probability of forming spontaneously in pure supercooled water is negligible Espinosa et al. (2016a); Niu et al. (2019). Consequently, in nature, ice is formed essentially via heterogeneous nucleation Sanz et al. (2013).
Several investigations have addressed the behavior of supercooled liquid water at negative pressure Green et al. (1990); Azouzi et al. (2013); Netz et al. (2001); Henderson and Speedy (1987); Zheng et al. (1991); Imre et al. (2002); Caupin (2015); Gallo et al. (2016); Montero de Hijes et al. (2018), with little attention paid to ice nucleation Marcolli (2017); Kanno et al. (1975). Here, we fill this gap by exploring the homogeneous ice nucleation from positive to negative pressure at constant temperature .
By means of molecular dynamic simulations of the TIP4P/Ice water model Abascal et al. (2005) – probably the best atomistic model to study ice properties and with a well known phase diagramAbascal et al. (2005); Debenedetti et al. (2020)– we reveal that the isothermal variation of is non-monotonic. For any isothermal path, a minimum is always observed at . This retracing behavior is linked to the re-entrance of the coexistence line.
All the simulations have been performed using GROMACS Hess et al. (2008), adopting: i) a time step of ; ii) the Noose-Hoover thermostat with a relaxation time of ; iii) the Parrinello-Rahman barostat with a relaxation time of ; iv) the particle-mesh-Ewald algorithm of order 4, with Fourier spacing of to solve the electrostatic interaction; v) a cutoff of both for the Lennard-Jones and Coulomb interactions; vi) long range corrections to the Lennard-Jones interaction.
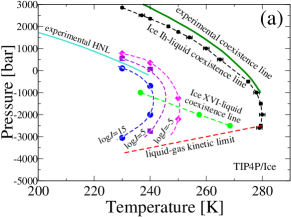
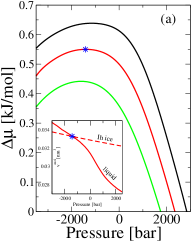
Given the polymorphism of ice, we investigate the most stable structure. According to Matsui et al. Matsui et al. (2019), Ih is clearly the most stable ice up to extreme negative pressures, where ice Ih and the recently discovered ice XVI Falenty et al. (2014) are close in terms of stability. Hence, first we determine the solid-liquid coexistence lines for ice Ih and ice XVI for the TIP4P/Ice model via direct coexistence simulations [see the Supporting Material (SM)SM_ ]. The - loci of the coexistence lines are shown in Fig. 1a. For the ice XVI coexistence line is lower than the Ih coexistence line, meaning that the Ih structure is more stable than the ice XVI for this pressure range. The triple point water-Ih-ice XVI is estimated at and , similar to what has been found for the TIP4P/2005 water model Conde et al. (2009). Therefore, we have conducted our investigation with ice Ih, although for the nucleation of ice XVI could be relevant.
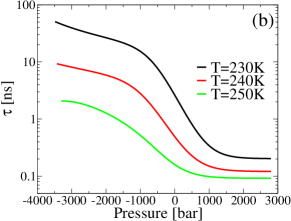
We then estimate the liquid-gas kinetic stability limit defined as the locus where 2000 liquid water molecules were stable for at least . For any thermodynamic state in this work it is possible to reach a metastable equilibrium, as the relaxation time is smaller than (Fig. 1b). As can be seen, before this stability limit is reached, there is a re-entrance of the coexistence line with a turning point at and . In 1982, Speedy conjectured a re-entering behavior of the liquid-gas spinodalSpeedy (1982). This has been recently demonstrated to be the case for colloidal systems Rovigatti et al. (2017) but ruled out for water Debenedetti (2003) as further seen in this work. Nevertheless, Henderson and Speedy later conjectured a reentrance in the coexistence line Henderson and Speedy (1987) (also suggested by Bridgman in 1912 Bridgman (1912)). Speedy’s estimation of the turning point of the coexistence line occurring at and Henderson and Speedy (1987) is surprisingly close to our numerical finding.
Although experimentally inaccessible for large (in absolute value) negative pressures, the possible re-entrance of the solid-liquid coexistence line affects the kinetic and thermodynamic properties of the accessible metastable region of the supercooled water’s phase diagram at negative pressure. This phenomenon resembles what has been largely discussed in the last decades about the origin of water’s anomalies Speedy and Angell (1976); Poole et al. (1992); Kim et al. (2009); Stokely et al. (2010); Russo et al. (2014); Bianco and Franzese (2014); Palmer et al. (2014); Pallares et al. (2014); Nilsson and Pettersson (2015); Gallo et al. (2016); Perakis et al. (2017); Bianco and Franzese (2019); Gallo et al. (2019). There, the possible presence of a second liquid-liquid critical point in a low -high region of the phase diagram (confirmed recently for the TIP4P/Ice modelDebenedetti et al. (2020) although experimentally prohibitive) would determine the increase of the fluctuations (and related thermodynamic response functions) in the accessible metastable region of the phase diagram.
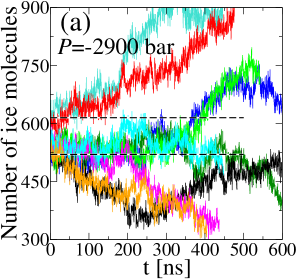
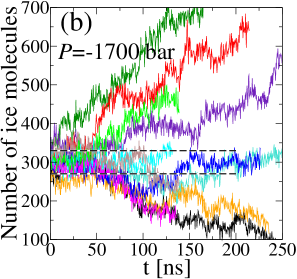
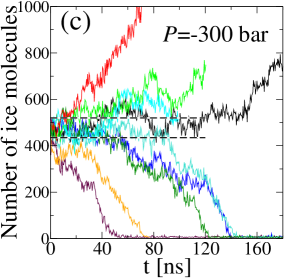
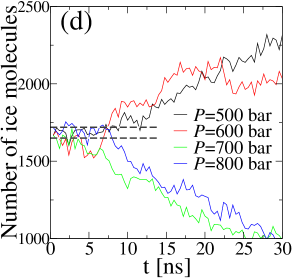
To evaluate we follow the seeding computational approach, introduced by Bai and Li Bai and Li (2005), and widely adopted in nucleation studies Sanz et al. (2013); Espinosa et al. (2014); Espinosa et al. (2016b, c); Espinosa et al. (2018); Lifanov et al. (2016); Leoni et al. (2019); Montero de Hijes et al. (2019); Montero de Hijes et al. (2020); Montero de Hijes et al. (2020); Tipeev et al. (2018); Knott et al. (2012); Pereyra et al. (2011); Dasgupta et al. (2020); Niu et al. (2020); Zimmermann et al. (2015) (see SM for details). This scheme consists in introducing a spherical crystal seed of a given size into a bulk of supercooled liquid and let it evolve at constant and . Seeds whose size is larger than grow spanning the entire system, while those below melt. When the size is critical, the crystal seed can grow or melt with equal probability. Hence, by comparing the time evolution of the size of the crystal seeds at certain and , it is possible to establish (within a certain resolution). One can either study seeds differing in size at fixed state point (Fig. 2a-c) or a given seed at different (Fig. 2d).
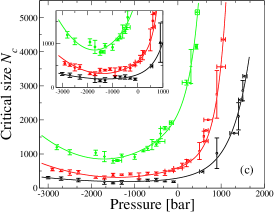
We investigate the isotherms with water molecules. For any we explore , i.e. from the liquid-gas kinetic stability limit at negative pressures up to the melting point at positive pressures. The number of ice molecules is determined according to the Lechner-Dellago order parameter Lechner and Dellago (2008), with cutoff distance of . Molecules (within the cutoff distance) above the threshold are labeled as ice, whereas those with smaller values are labeled as liquid. The value of which depends on and is determined according to the mislabeling criterionEspinosa et al. (2016b) (see the SM for details). In Fig. 2 we show the time evolution of the number of ice particles in the crystal seed along the isotherm , with runs spanning in some cases up to the . On average any has been identified by means of independent runs. All the estimated along the three isotherms are presented in Fig. 3c and reported in the SM. As shown in Fig. 3c, from positive pressures, largely decreases upon decreasing , reaching a quasi-constant value at negative . By further decreasing we find that increases again. In all cases the minimum value of is observed at . In particular, we find that the minimum value of is for , for , and for . From we can extract the -dependence of the surface tension following the classical nucleation theory (CNT). Indeed, according to CNT, can be expressed as Espinosa et al. (2016c)
| (1) |
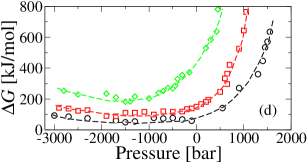
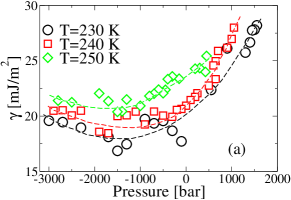
being the ice density at , and the difference in chemical potential between water () and ice (). As discussed in the SM (see Fig. 3 and Table II), can be computed by thermodynamic integration. In Fig. 3a we report along the isotherms of interest, showing a retracing behavior whose maximum value is always reached at . The maxima of are observed at , , and , roughly coinciding with the thermodynamic state points where exhibits a minimum. The presence of the maximum of is due to the crossing of ice and liquid water densities along the corresponding isotherm as shown in Fig. 3a inset (see also Fig. 3(c-e) of the SM). From Eq. 1 we obtain which is shown in Fig. 4a. As can be seen, decreases upon decreasing , reaching a quasi-constant value at negative , then increasing again at largely (in absolute value) negative . We can extract the values of at : for , for , and for . These values are in agreement with the fitting expression for reported in Ref. Espinosa et al. (2016c); Montero de Hijes et al. (2019) ( 19.1, 21.8, respectively).
Following Becker and Döring Becker and Döring (1935) we can express the nucleation rate as
| (2) |
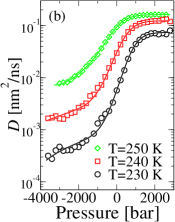
where is the density of the liquid phase, and is the free energy barrier associated to the formation of a critical cluster. Also, is the Boltzmann constant and is the Zeldovich factor which depends on the curvature of around the barrier top and is related to the width of the critical region. The attachment rate can be approximated as , where is the diffusion coefficient of the supercooled water (shown in Fig. 3b) and according to previous work Espinosa et al. (2014). Such an approximation succesfully works at positive pressure Espinosa et al. (2014). We test it at negative pressure by computing rigorously as in Ref. Auer and Frenkel (2001) from , at for finding good agreement, as reported in SM (the deviations do not affect the resulting value of ).
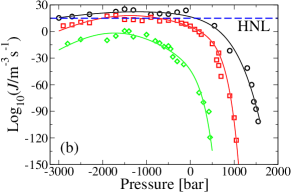
The -dependence of is shown in Fig. 3d. Then, we estimate via Eq. 2. In Fig. 4b, the returning of at negative is revealed. The maxima of are found at for all the explored and mark the conditions where homogeneous nucleation occurs more easily as recently suggested by Marcolli Marcolli (2017). In this particular case, for (, ), for (, ), and for (, ). Accordingly, the estimated surviving time of a water droplet with volume cm3 characteristic of the inclusion experiments at negative Azouzi et al. (2013); Caupin (2015) is at , at , and at . Thus, this work suggests that - is the minimum at which one can study macroscopic samples of water at without freezing the entire sample in a few seconds.
Finally, we compute the iso-nucleation rate lines for TIP4P/Ice (representing the loci of points in the plane where the nucleation rates have identical values). They are presented in Fig. 1 for ( m-3 s-1 ). As can be seen, the iso-nucleation rate lines present reentrant behavior. The curve ( m-3 s-1 ) is of particular interest as it can be regarded as an estimate of the experimental homogeneous nucleation line (HNL) Espinosa et al. (2016a) where freezing of droplets of a few microns occurs in a few seconds and cannot be avoided, thus, representing the solid-liquid limit of stability. In the isotherm, ( m-3 s-1 ) occurs at (see also Fig. 1). The results of this work suggest that the HNL presents reentrant behavior, another anomaly of water arising at the confluence of low and negative Altabet et al. (2017); Holten et al. (2017) that, to the best of our knowledge, has not been reported before.
In conclusion, we use computer simulations of the TIP4P/Ice water model to estimate the size of the critical nucleus along three isotherms , , and . We cover from typical positive coexistence pressures until approaching the liquid-gas kinetic stability curve (under 100 ns of observation). We show how does not change monotonically exhibiting a minimum at negative and increasing again in the vicinity of the stability limit. Accordingly, the nucleation rate and the surface tension show a retracing behavior, with a maximum of and a minimum of both occurring at negative . Our findings reveal new water anomalies as the retracing behavior of , and along the isotherms when going from positive to negative pressures. We also predict anomalous behavior of the homogeneous nucleation line, which again presents reentrant behavior at negative pressures. This can be regarded as a smoking gun of the re-entrance of the melting curve which can be evaluated experimentally only up to moderate values of negative pressures Henderson and Speedy (1987); Zheng et al. (1991); Imre et al. (2002); Azouzi et al. (2013); Caupin (2015).
The authors acknowledge the project PID2019-105898GB-C21 of the MEC. V. B. acknowledges the support from the European Commission through the Marie Skłodowska-Curie Fellowship No. 748170 ProFrost. P.M.d.H. acknowledges the financial support from the FPI grant no. BES-2017-080074. C.P.L thanks MEC for a predoctoral FPU grant FPU18/03326 and also Ayuntamiento de Madrid for a Residencia de Estudiantes grant. The authors acknowledge the computer resources and technical assistance provided by the RES and the Vienna Scientific Cluster (VSC).
References
- Gettelman et al. (2010) A. Gettelman, X. Liu, S. J. Ghan, H. Morrison, S. Park, A. J. Conley, S. A. Klein, J. Boyle, D. L. Mitchell, and J.-L. F. Li, Journal of Geophysical Research 115, D18216 (2010).
- Coluzza et al. (2017) I. Coluzza, J. Creamean, M. Rossi, H. Wex, P. Alpert, V. Bianco, Y. Boose, C. Dellago, L. Felgitsch, J. Fröhlich-Nowoisky, et al., Atmosphere 8, 138 (2017).
- Nitzbon et al. (2020) J. Nitzbon, S. Westermann, M. Langer, L. C. P. Martin, J. Strauss, S. Laboor, and J. Boike, Nature Communications 11, 2201 (2020).
- John Morris and Acton (2013) G. John Morris and E. Acton, Cryobiology 66, 85 (2013).
- Bar Dolev et al. (2016) M. Bar Dolev, I. Braslavsky, and P. L. Davies, Annual Review of Biochemistry 85, 515 (2016).
- Broekaert et al. (2011) K. Broekaert, M. Heyndrickx, L. Herman, F. Devlieghere, and G. Vlaemynck, Food Microbiology 28, 1162 (2011).
- Russo et al. (2014) J. Russo, F. Romano, and H. Tanaka, Nature Materials 13, 733 (2014).
- Bintanja et al. (2013) R. Bintanja, G. J. van Oldenborgh, S. S. Drijfhout, B. Wouters, and C. A. Katsman, Nature Geoscience 6, 376 (2013).
- Espinosa et al. (2016a) J. R. Espinosa, A. Zaragoza, P. Rosales-Pelaez, C. Navarro, C. Valeriani, C. Vega, and E. Sanz, Physical Review Letters 117, 135702 (2016a).
- Niu et al. (2019) H. Niu, Y. I. Yang, and M. Parrinello, Physical Review Letters 122, 245501 (2019).
- Sanz et al. (2013) E. Sanz, C. Vega, J. R. Espinosa, R. Caballero-Bernal, J. L. F. Abascal, and C. Valeriani, Journal of the American Chemical Society 135, 15008 (2013).
- Green et al. (1990) J. Green, D. Durden, G. Wolf, and C. Angell, Science 249, 649 (1990).
- Azouzi et al. (2013) M. E. M. Azouzi, C. Ramboz, J.-F. Lenain, and F. Caupin, Nature Physics 9, 38 (2013).
- Netz et al. (2001) P. Netz, F. Starr, H. Stanley, and M. Barbosa, J. Chem. Phys. 115, 344 (2001).
- Henderson and Speedy (1987) S. J. Henderson and R. J. Speedy, The Journal of Physical Chemistry 91, 3069 (1987).
- Zheng et al. (1991) Q. Zheng, D. Durben, G. Wolf, and C. Angell, Science 254, 829 (1991).
- Imre et al. (2002) A. R. Imre, H. J. Maris, and P. R. Williams, Liquids Under Negative Pressure : Proceedings of the NATO Advanced Research Workshop of Liquids Under Negative Pressure Budapest, Hungary 23-25 February 2002 (Springer Netherlands, 2002), ISBN 9781402008962.
- Caupin (2015) F. Caupin, Journal of Non-Crystalline Solids 407, 441 (2015).
- Gallo et al. (2016) P. Gallo, K. Amann-Winkel, C. A. Angell, M. A. Anisimov, F. Caupin, C. Chakravarty, E. Lascaris, T. Loerting, A. Z. Panagiotopoulos, J. Russo, et al., Chemical Reviews 116, 7463 (2016).
- Montero de Hijes et al. (2018) P. Montero de Hijes, E. Sanz, L. Joly, C. Valeriani, and F. Caupin, J. Chem. Phys. 149, 094503 (2018).
- Marcolli (2017) C. Marcolli, Scientific Reports 7, 16634 (2017).
- Kanno et al. (1975) H. Kanno, R. J. Speedy, and C. A. Angell, Science 189, 880 (1975).
- Abascal et al. (2005) J. L. F. Abascal, E. Sanz, R. García Fernández, and C. Vega, The Journal of Chemical Physics 122, 234511 (2005).
- Debenedetti et al. (2020) P. G. Debenedetti, F. Sciortino, and H. Zerze, Science 369, 289 (2020).
- Hess et al. (2008) B. Hess, C. Kutzner, D. van der Spoel, and E. Lindahl, 4, 435 (2008).
- Matsui et al. (2019) T. Matsui, T. Yagasaki, M. Matsumoto, and H. Tanaka, The Journal of chemical physics 150, 041102 (2019).
- Falenty et al. (2014) A. Falenty, T. C. Hansen, and W. F. Kuhs, Nature 516, 231 (2014).
- (28) See Supplemental Material at http://link.aps.org/ supplemental/10.1103/PhysRevLett.126.015704 for a detailed description of the numerical methods and results (seeding, direct coexistence, mislabeling, thermodynamic integration and attachment rates) of this work and the fitting curves shown in the main text. (????).
- Conde et al. (2009) M. Conde, C. Vega, G. Tribello, and B. Slater, The Journal of chemical physics 131, 034510 (2009).
- Speedy (1982) R. J. Speedy, The Journal of Physical Chemistry 86, 982 (1982).
- Rovigatti et al. (2017) L. Rovigatti, V. Bianco, J. Tavares, and F. Sciortino, Journal of Chemical Physics 146, 041103 (2017).
- Debenedetti (2003) P. G. Debenedetti, Journal of Physics: Condensed Matter 15, R1669 (2003).
- Bridgman (1912) P. W. Bridgman, 47, 441 (1912).
- Speedy and Angell (1976) R. J. Speedy and C. A. Angell, J. Chem. Phys. 65, 851 (1976).
- Poole et al. (1992) P. H. Poole, F. Sciortino, U. Essmann, and H. E. Stanley, Nature 360, 324 (1992).
- Kim et al. (2009) C. U. Kim, B. Barstow, M. W. Tate, and S. M. Gruner, Proceedings of the National Academy of Sciences 106, 4596 (2009).
- Stokely et al. (2010) K. Stokely, M. G. Mazza, H. E. Stanley, and G. Franzese, Proceedings of the National Academy of Sciences of the United States of America 107, 1301 (2010).
- Bianco and Franzese (2014) V. Bianco and G. Franzese, Scientific reports 4, 4440 (2014).
- Palmer et al. (2014) J. C. Palmer, F. Martelli, Y. Liu, R. Car, A. Z. Panagiotopoulos, and P. G. Debenedetti, Nature 510, 385 (2014).
- Pallares et al. (2014) G. Pallares, M. El Mekki Azouzi, M. A. González, J. L. Aragones, J. F. Abascal, C. Valeriani, and F. Caupin, Proceedings of the National Academy of Sciences 111, 7936 (2014).
- Nilsson and Pettersson (2015) A. Nilsson and L. G. Pettersson, Nature Communications 6, 8998 (2015).
- Perakis et al. (2017) F. Perakis, K. Amann-Winkel, F. Lehmkühler, M. Sprung, D. Mariedahl, J. A. Sellberg, H. Pathak, A. Späh, F. Cavalca, D. Schlesinger, et al., Proceedings of the National Academy of Sciences 114, 8193 (2017).
- Bianco and Franzese (2019) V. Bianco and G. Franzese, Journal of Molecular Liquids 285, 727 (2019).
- Gallo et al. (2019) P. Gallo, T. Loerting, and F. Sciortino, The Journal of Chemical Physics 151, 210401 (2019).
- Bai and Li (2005) X.-M. Bai and M. Li, The Journal of Chemical Physics 122, 224510 (2005).
- Espinosa et al. (2014) J. R. Espinosa, E. Sanz, C. Valeriani, and C. Vega, The Journal of chemical physics 141, 18C529 (2014).
- Espinosa et al. (2016b) J. R. Espinosa, C. Vega, C. Valeriani, and E. Sanz, The Journal of Chemical Physics 144, 034501 (2016b).
- Espinosa et al. (2016c) J. R. Espinosa, C. Navarro, E. Sanz, C. Valeriani, and C. Vega, The Journal of Chemical Physics 145, 211922 (2016c).
- Espinosa et al. (2018) J. R. Espinosa, C. Vega, and E. Sanz, The Journal of Physical Chemistry C 122, 22892 (2018).
- Lifanov et al. (2016) Y. Lifanov, B. Vorselaars, and D. Quigley, The Journal of Chemical Physics 145, 211912 (2016).
- Leoni et al. (2019) F. Leoni, R. Shi, H. Tanaka, and J. Russo, The Journal of Chemical Physics 151, 044505 (2019).
- Montero de Hijes et al. (2019) P. Montero de Hijes, J. R. Espinosa, E. Sanz, and C. Vega, The Journal of Chemical Physics 151, 144501 (2019).
- Montero de Hijes et al. (2020) P. Montero de Hijes, J. R. Espinosa, V. Bianco, E. Sanz, and C. Vega, The Journal of Physical Chemistry C 124, 8795 (2020).
- Montero de Hijes et al. (2020) P. Montero de Hijes, K. Shi, E. Noya, E. Santiso, K. Gubbins, E. Sanz, and C. Vega, The Journal of Chemical Physics 153, 191102 (2020).
- Tipeev et al. (2018) A. O. Tipeev, E. D. Zanotto, and J. P. Rino, The Journal of Physical Chemistry C 122, 28884 (2018).
- Knott et al. (2012) B. C. Knott, V. Molinero, M. F. Doherty, and B. Peters, Journal of the American Chemical Society 134, 19544 (2012).
- Pereyra et al. (2011) R. G. Pereyra, I. Szleifer, and M. A. Carignano, The Journal of chemical physics 135, 034508 (2011).
- Dasgupta et al. (2020) T. Dasgupta, G. M. Coli, and M. Dijkstra, ACS Nano 14, 3957 (2020).
- Niu et al. (2020) H. Niu, L. Bonati, P. M. Piaggi, and M. Parrinello, Nature Communications 11, 2654 (2020).
- Zimmermann et al. (2015) N. E. Zimmermann, B. Vorselaars, D. Quigley, and B. Peters, Journal of the American Chemical Society 137, 13352 (2015).
- Lechner and Dellago (2008) W. Lechner and C. Dellago, The Journal of Chemical Physics 129, 114707 (2008).
- Becker and Döring (1935) R. Becker and W. Döring, Annalen der Physik 416, 719 (1935).
- Auer and Frenkel (2001) S. Auer and D. Frenkel, Nature 409, 1020 (2001).
- Altabet et al. (2017) Y. E. Altabet, R. S. Singh, F. H. Stillinger, and P. G. Debenedetti, Langmuir 33, 11771 (2017).
- Holten et al. (2017) V. Holten, C. Qiu, E. Guillerm, M. Wilke, J. Ricka, M. Frenz, and F. Caupin, The journal of physical chemistry letters 8, 5519 (2017).