Detecting Population III Stars through Tidal Disruption Events in the Era of JWST and Roman
Abstract
The first generation metal-free stars, referred to as population III (Pop III) stars, are believed to be the first objects to form out of the pristine gas in the very early Universe. Pop III stars have different structures from the current generation of stars and are important for generating heavy elements and shaping subsequent star formation. However, it is very challenging to directly detect Pop III stars given their high redshifts and short life-times. In this paper, we propose a novel signature for detecting Pop III stars through their tidal disruption events (TDEs) by massive black holes. We model the emission properties and calculate the expected rates for these unique TDEs in the early Universe at . We find that Pop III star TDEs have much higher mass fallback rates compared to normal TDEs in the local universe and are therefore rather luminous, rendering them feasible for detection. They also have very long observed flare evolution timescale, making it more likely to detect such TDEs during their rising phase. We further demonstrate that a large fraction of the TDE emissions are redshifted to infrared wavelengths and can be detected by the James Webb Space Telescope and the Nancy Grace Roman Space Telescope. Lastly, the TDE rate sensitively depends on the black hole mass function in the early Universe. We find a promising Pop III star TDE detection rate of up to a few tens per year using the Nancy Grace Roman Space Telescope.
1 Introduction
The first generation of stars are believed to form from the pristine gas a few hundred million years after the Big Bang. These metal-free stars are commonly referred to as population III (Pop III) stars. Pop III stars are believed to form in collapsed dark matter mini-halos with masses of around at (Abel et al., 2002; Bromm et al., 2002; Yoshida et al., 2006). The initial mass function (IMF) of these short-lived Pop III stars, is expected to be tilted to higher masses and hence they are likely more massive than the current generation of forming stars (Population I, or Pop I stars). While there is uncertainty at the present time regarding the Pop III IMF, their masses are believed to lie within the range of . Pop III stars are expected to be key players in the early Universe and they are believed to be responsible for re-ionizing the inter galactic medium (IGM) (Sokasian et al., 2004; Johnson et al., 2007; Kulkarni et al., 2014), and lifting the fog of the dark ages and jump-starting structure formation. Moreover, Pop III stars produce metals in their core and therefore play a crucial role in bridging the gap between the metal-free primordial gas and higher-metallicity Population II (Pop II) and Pop I stars by polluting the IGM through supernovae explosions (Chen et al., 2022). Hence, as metal polluters that shape subsequent generations of star formation, Pop III stars are an important population to detect directly as this will enable constraining their properties and better understand the evolution of subsequent generations of stellar populations.
A plethora of numerical studies have been carried out to track the formation of Pop III stars in the first few billion years of the Universe (Abel et al., 2002; Bromm et al., 2009; Park et al., 2021a; Saad et al., 2022; Prole et al., 2023). In particular, recent studies show that Pop III stars do not form in isolation, and that typically multiple Pop III stars can form inside a single minihalo (Clark et al., 2011; Liu & Bromm, 2020; Park et al., 2021b). While it is generally believed that the Pop III star formation rate peaks around (Scannapieco et al., 2003; Jaacks et al., 2018), there has been speculation that they could continue forming at lower redshifts if pristine gas pockets are available in galaxies (Jimenez & Haiman, 2006; Liu & Bromm, 2020).
Direct observation of Pop III stars, however, turns out to be extremely challenging. So far only a few Pop III like candidate objects have been identified (Vanzella et al., 2020; Welch et al., 2022): detected through serendipitous gravitational lensing (Rydberg et al., 2013; Vikaeus et al., 2022b); in pair-instability supernovae (Hummel et al., 2012; Regős et al., 2020); in gamma ray bursts (de Souza et al., 2011; Mesler et al., 2014; Lazar & Bromm, 2022) and recent claimed detection with JWST NIRSpec observations (Wang et al., 2022a).
In this paper, we propose and explore in detail a novel detection channel for Pop III stars motivated by the unfolding JWST observations and evidence for the possible existence of massive black holes (MBHs) formed via direct collapse of gas in place at these early epochs (Bogdán et al., 2023; Natarajan et al., 2024). Therefore, Pop III stars stand to be revealed via the observation of their tidal disruption by MBHs in early galaxies. Recent JWST observations in combination with Chandra X-ray observations, have revealed and confirmed the presence of an accreting supermassive black hole (SMBH) in the source UHZ1 at , a mere 470 Myrs after the Big Bang (Bogdán et al., 2023) that is consistent with formation via direct collapse of gas.
Tidal Disruption Events (TDEs) are produced whenever a star approaches a massive black hole (MBH) and comes within the distance at which the tidal force of the black hole exceeds the self-gravity of the star. In such cases, the star will be destroyed by the tidal force, which in turn will produce a luminous tidal disruption event (TDE) (Rees, 1988; Evans & Kochanek, 1989). At the present time about 100 TDEs of Pop I stars in the local Universe have been observed (Gezari, 2021), and these are typically associated with powerful emission observed in multiple wavebands including X-ray, ultraviolet (UV) optical and radio (Auchettl et al., 2017; Alexander et al., 2020; Saxton et al., 2020; van Velzen et al., 2021).
In this paper, we model the properties of Pop III star TDEs. As these first stars are expected to exist primarily in high-redshift galaxies, their optical and UV emission will be redshifted rendering them detectable in infrared (IR) wavelengths. This study is extremely timely due to the recent launch and successful data stream from the James Webb Space Telescope (JWST, Gardner et al., 2006) and planning underway for the soon to be launched Nancy Grace Roman Space Telescope (Roman, Spergel et al., 2015). JWST and Roman operate in IR bands, covering the wavelength range of nm - nm and nm - nm respectively. With the high resolution Near Infrared Camera (NIRCam) and Near Infrared Spectrograph (NIRSpec) along with Mid-Infrared Instrument (MIRI), JWST has already started to revolutionize our understanding of the first galaxies and early MBHs (e.g., Castellano et al., 2022; Atek et al., 2023; Yajima et al., 2023; Bogdán et al., 2023). On the other hand, the planned extremely large field of view of Wide Field Instrument (WFI) on board Roman is designed to observe a vast area of the sky, making it possible to detect numerous faint objects simultaneously. One of the primary objectives of Roman is to shed light on the matter distribution over a large range of redshifts to understand the nature of dark matter and expansion history of the universe. Both missions are hence expected to yield a large sample of extremely faint high redshift sources.
Our paper is structured as follows: in Section 2, we introduce the basic structure of Pop III stars, based on which we calculate the key TDE parameters. We also introduce the fiducial model used to calculate the emission properties of these Pop III TDEs. In Section 3, we present our main results, predictions for the intrinsic and the observed emission spectra; luminosities and the light curves of Pop III star TDEs. We also calculate event rates and discuss the detection prospects for this new class of sources with JWST and Roman. We conclude with a summary of our key findings and implications of our results for unveiling the early Universe with these new probes in Section 4.
2 Modelling Pop III TDEs
2.1 Mass-Radius Relation of Pop III Stars
We consider Pop III stars in the main sequence stage. Massive Pop III stars are primarily radiation-pressure dominated, so their structures can be approximated using a polytropic model with an index of or (Bromm et al., 2001b). Throughout this work, we use the mass-radius relationship of Pop III stars adopted from Bromm et al. (2001b):
| (1) |
where is the stellar mass, is the stellar radius, and is the metallicity of Pop III stars. When increases, cooling through metal lines is enhanced and the effective temperature of a Pop III star drops, which means the average stellar density also decreases given for a polytropic star with (Fowler & Hoyle, 1964). Therefore, increases with increasing . The value of the metallicity considered has varied from zero to a very small non-zero number in previous treatments (Bromm et al., 2001b; Schaerer, 2003; Murphy et al., 2021; Klessen & Glover, 2023). Many studies show that there likely exists a critical metallicity at which the transition from metal-free Pop III stars to metal-poor PopII stars occurs and that value is depending on the IMF of Pop III stars (Bromm et al., 2001a; Schneider et al., 2002; Yoshida et al., 2004; Wise et al., 2012; Jaacks et al., 2018). Furthermore, Jaacks et al. (2018) show that the mean gas metallicity increases with decreasing redshift and reaches at . Hereafter, in this work in order to probe the metallicity dependence of our results, we calculate fiducial properties for Pop III stars with two chosen values for the metallicity: and a lower metallicity of .
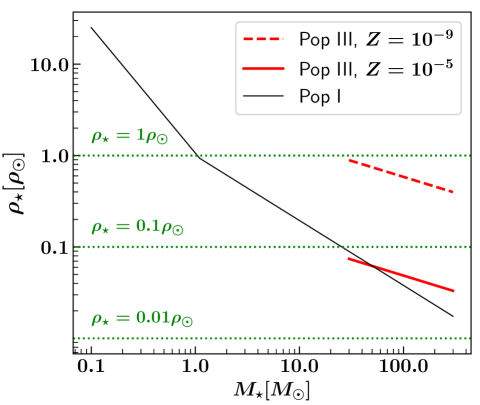
Given the stellar structure outlined above, we can calculate the the average stellar density of Pop III stars based on Eq. 1. In Fig. 1, we show the variation of for Pop III stars as a function of their mass in the typical mass range of and compare that with the case of Pop I main-sequence stars. For the latter, we assume that their masses can extend to few hundreds of (Crowther et al., 2010; Rickard & Pauli, 2023), and we adopt the mass-radius relation from Kippenhahn & Weigert (1990):
| (2) |
It can be seen that for both types of stars, drops as the increases. Furthermore, Pop III stars have for the lower metallicity case and as approaches the upper limit of .
2.2 Tidal Disruption of Pop III Stars
A star is tidally disrupted by a MBH when it approaches within its tidal disruption radius (). To first order, can be calculated using
| (3) |
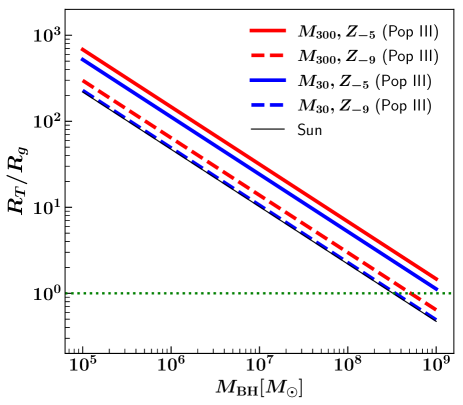
where is the black hole (BH) mass. Therefore, for a fixed , only depends on the average stellar density (). Fig. 2 shows the comparison of for Pop III stars (of different masses and metallicities) and with that for solar type stars disrupted by MBHs with mass ranging from . It can be seen that for Pop III stars at very low metallicity () are similar to that of the Sun, while for Pop III stars at relatively high metallicities () are a few times larger, which is consistent with the density comparison seen in Fig. 1.
Moreover, since while the gravitational radius of a BH , there exists a upper limit of (called the Hill mass) beyond which an approaching star is swallowed by the MBH as a whole. One can see in Fig. 2 that the high-metallicity () Pop III stars can be disrupted by MBHs with masses up to . This can be used as an important indicator for Pop III TDE detection, since Pop I main-sequence stars can only be disrupted by MBHs with except in the extreme case when the MBH has a close to maximal spin (Kesden, 2012). Although the estimated mass of the BH in sources like UHZ1 (at ) is estimated to be , it is expected that even more massive SMBHs could exist at these epochs although they are expected to be extremely rare. Meanwhile, MBHs with masses less than that of UHZ1 could be significantly more numerous at these early epochs.
After the star is disrupted, about half of the stellar debris is ejected from the system and the rest remains bound to the MBH with a spread in its specific binding energy. The rate that the bound stellar debris orbits back to the pericenter is called the debris mass fallback rate (), which can be calculated as (Evans & Kochanek, 1989; Phinney, 1989):
| (4) |
where the fallback time is the orbital time of the most tightly bound debris.
In this work we adopt the results from Guillochon & Ramirez-Ruiz (2013) (hereafter GR13) who performed high-resolution hydrodynamical simulations to study this disruption process. In particular, adopting polytropic stellar models, GR13 provide the following fitting formulae for the debris fallback time and the peak mass fallback rate:
| (5) |
| (6) |
where , and . Furthermore, for a poly-tropic star with , the coefficients are:
| (7) |
| (8) |
Here is called the penetration factor, where is the pericenter distance of the stellar orbit. A deep plunging orbit is commonly associated with , whereas mild or partial disruption is denoted by & respectively. GR13 showed that stars with polytropic index are fully disrupted when , and under this condition remains similar. Hence we mark this as the critical penetration factor and use for the calculations throughout this paper unless otherwise specified. For , , and .
For Pop III stars, one can then use the mass-radius relationship (Eq. 1) and rewrite Eq. 5 and 6 as:
| (9) |
| (10) |
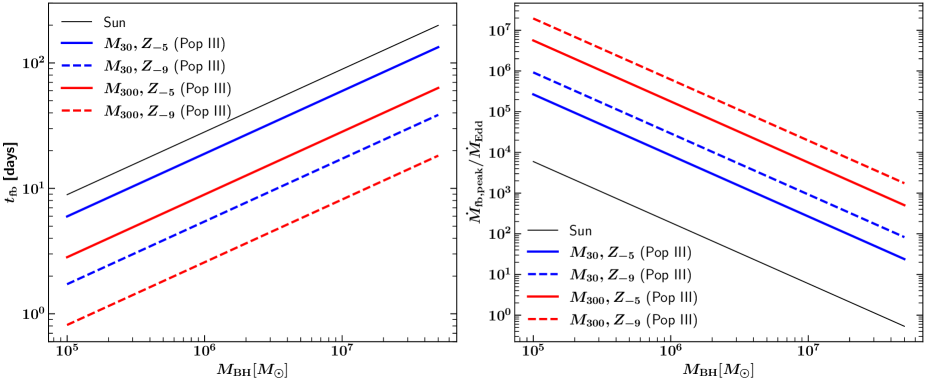
We plot and as functions of for various Pop III stars compared to the Sun in Fig. 3. It can be seen that for Pop III stars are usually around a few days, which is shorter compared to that of a solar-type star wherein a few tens of days for the case of . Furthermore, Pop III stars have extremely high which exceeds that of Pop I star TDEs by several orders of magnitude. For example, when , for Pop III star TDEs can reach , where is the Eddington accretion rate of the BH with being the Eddington luminosity, the speed of light and is the radiative efficiency with a nominal value of 0.1. This hyper-Eddington debris mass fallback rate is a consequence of the very large masses of Pop III stars coupled with their short debris mass fallback timescales.
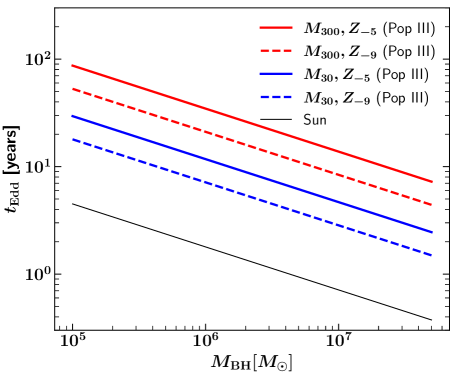
After the peak of the flare, the debris mass fallback rate drops with time following . At late times, the fallback rate should transit from super-Eddington to sub-Eddington. We can calculate the timescale over which the fallback rate stays super-Eddington using :
| (11) |
This timescale is shown in Fig. 4. It is clearly seen that Pop III TDEs have super-Eddington fallback rates for a much longer duration (up to hundreds of years) compared to a solar type star TDE (a few years) considering .
2.3 TDE Optical/UV Emission Model
The extremely high debris mass fallback rate seen in Fig. 3 means that even if just a small fraction of the debris reaches the vicinity of the MBH, a super-Eddington accretion flow could result, which will launch powerful winds due to the large radiation pressure (Dai et al., 2018; Bu et al., 2023). Furthermore, outflows are also expected to be powered by debris stream collisions (Shiokawa et al., 2015; Bonnerot & Rossi, 2019; Lu & Bonnerot, 2020).
It has been proposed that these outflows are responsible for producing the optical/UV emission observed from TDEs in the local universe (Loeb & Ulmer, 1997; Strubbe & Quataert, 2009; Lodato & Rossi, 2011; Roth et al., 2016; Metzger & Stone, 2016; Roth et al., 2020; Dai et al., 2021). There have also been sophisticated numerical simulations studying super-Eddington BH accretion, outflow and emission (Sadowski & Narayan, 2016; Dai et al., 2018; Jiang et al., 2019; Thomsen et al., 2022). However, no simulation has been done yet to study super-Eddington accretion flows with Eddington ratios as high as . Given lack of guidance from simulations, we adopt an analytical model proposed by Strubbe & Quataert (2009, hereafter SQ09) to calculate the emission properties of Pop III star TDEs, while making a few changes to adapt model parameters consistent with more recent studies.
We first provide a brief summary of the SQ09 model below. SQ09 assume that during the early, super-Eddington phase a sizable fraction of the fallback material constitutes an outflow. Furthermore, they also assume that a fraction of the wind kinetic energy is converted to thermal energy, which in turn produces black-body radiation. This assumption appears to hold even when the outflows are powered by debris stream collisions, and it is supported by recent simulations (Dai et al., 2018; Zanazzi & Ogilvie, 2020; Andalman et al., 2022; Thomsen et al., 2022). SQ09 assume a spherical wind geometry and a constant wind velocity, under these circumstances, the wind density profile can be approximated as:
| (12) |
Here the wind mass rate is assumed to be a constant fraction of the debris mass fallback rate so that . We use a fiducial value (instead of used by SQ09), inspired by recent numerical simulations of super-Eddington accretion flows (e.g. Dai et al., 2018; Jiang et al., 2019; Thomsen et al., 2022). We recognize that the exact value of has a dependence on the Eddington ratio, but our results do not significantly vary when . denotes the edge of the wind. The wind velocity is assumed to be the escape velocity at the wind-launching radius , which is set to be (the circularization radius). Therefore, we have , which can be further simplified as:
| (13) |
Furthermore, SQ09 calculate the temperature of the wind by assuming that the gas thermal energy density and kinetic energy density are similar at the wind-launching site:
| (14) |
Here with being the Stefan-Boltzmann constant, is the gas temperature at , and is the gas density at which can be calculated as . It is further assumed that the wind expands adiabatically so that its temperature scales with gas density:
| (15) |
The photosphere radius of the wind, , is located where
| (16) |
where is the electron scattering opacity which is taken to be assuming the Hydrogen abundance for Pop III stars is , while rest of the mass is mostly dominated by Helium (Bromm et al., 2009).
Initially, the wind gas density is very high due to the large fallback rate, so and the photo-sphere almost coincides with the edge of the wind, which gives :
| (17) |
where is the Schwarzschild radius of a non-spinning black hole. The effective temperature of the photo-sphere at this stage is given by:
| (18) |
As decreases with , after a certain time, drops to 1 and the photo-sphere starts to recede afterwards. This transition time is calculated to be:
| (19) |
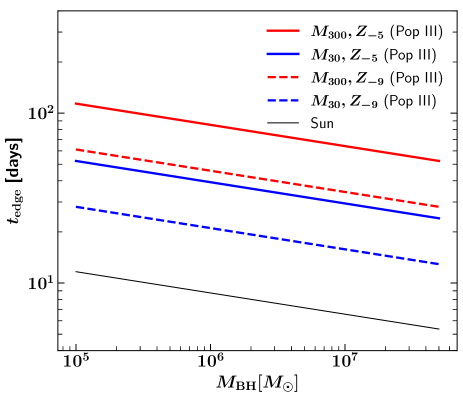
where , and (this fraction is set as throughout this paper unless otherwise specified). As we will show later, is also the time when the flare bolometric luminosity reaches the peak. We plot for Pop III stars and the Sun in Fig. 5. It is clearly seen that the transition occurs on timescales of a few tens of days for Pop III stars as compared to a few days for the Sun in case of . This leads to larger photo-sphere radii and higher peak luminosities for Pop III TDEs.
After the photo-sphere starts to recede, the photo-sphere radius and temperature at this later stage can be estimated following Eq. 15 and Eq. 16 and given as:
| (20) | ||||
| (21) |
where .
Specifically for Pop III stars, using their mass-radius relationship (Eq. 1), we have:
| (22) |
Before :
| (23) |
| (24) |
After :
| (25) | |||
| (26) |
We note that this first-order calculation in SQ09 assumes that the outflows start to be launched around the peak of the debris mass fallback rate and they ignore the outflows produced prior. The luminosity increases in the initial phase as the wind builds up and therefore the characteristic rising time for the flare will be instead of . While this assumption can cause issues for a solar-type star TDE which has , it works well for Pop III star TDEs in which . Therefore, Pop III star TDE flares should rise on timescales of , i.e., a few weeks to months in the intrinsic TDE frame.
Furthermore, SQ09 also consider disk emission after the fallback rate drops to the sub-Eddington level. At this phase, the gas can radiate efficiently and a thin accretion disk is expected to form, which produces emission mainly in the X-ray and EUV bands. However, for Pop III star TDEs, as seen from Fig. 4, the fallback rate stays super-Eddington for a very long time (tens to hundreds of years). Therefore, in this work, we focus only on the emission produced from the winds launched in the super-Eddington phase and ignore the disk emission at very late times.
3 Results
3.1 Pop III Star TDE Intrinsic Emission Spectrum and Luminosity
We first calculate the TDE luminosity and spectral energy distribution (SED) in the rest frame of the host galaxy based on the properties of the photo-sphere described in Section 2.3. Assuming blackbody emission, the energy spectrum and bolometric luminosity can be computed using:
| (27) |
| (28) |
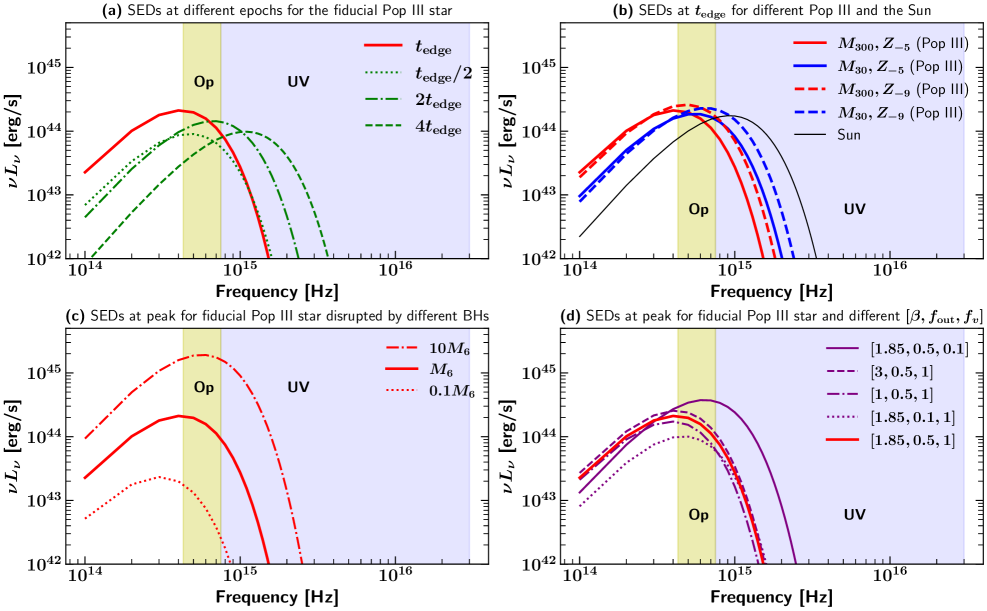
We plot the emission SEDs in Fig. 6 and explore the dependence on various model parameters. The default set of parameters for a fiducial Pop III star TDE model is: and . We stick to these parameters for calculations unless specified otherwise.
We illustrate the evolution of the emission from a single TDE in Fig. 6(a), which shows the SEDs at different epochs for the fiducial case. It is seen that initially the luminosity increases and the peak of the SED shifts slightly towards lower frequency, as a result of increasing and decreasing during this phase. After , recedes while increases, so the SED evolves in reverse, i.e., the luminosity decreases and the SED peak shifts towards higher frequency.
Fig. 6(b) shows the SEDs at (the peak of the flare) from the TDEs of Pop III stars of different masses and metallicities in comparison to that of a solar type star, all around a MBH. It can be immediately noticed that a significant fraction of the emission energy resides in the UV/optical wavelength regimes for all cases. The SEDs of Pop III star TDEs, compared to that of the solar-type TDE, have lower peak temperatures (with the SED peaking in the optical band instead of UV) and slightly larger luminosities. However, the mass or metallicity of a Pop III star does not make a significant difference to its tidal flare emission. Increasing the metallicity leads to a slightly smaller luminosity and increasing the stellar mass shifts the SED towards slightly longer wavelengths.
Fig. 6(c) shows the impact of on the SED. It can be seen that more massive BHs produce more luminous flares. Interestingly, the recent detection of sources such as UHZ1 (Bogdán et al., 2023) and GNz-11 (Maiolino et al., 2023) suggest that massive black holes of at could be much more abundant than previously estimated. Therefore, it is likely that some Pop III TDEs can produce very luminous flares with intrinsic bolometric luminosity larger than .
Finally, Fig. 6(d) shows how various other parameters, namely, (outflow fraction), (ratio between wind velocity and escape velocity) and (stellar orbital penetration parameter), affect the SED. One can see that overall the choice of these parameters only mildly impacts the SED. We note that increasing or decreasing generally both lead to a larger peak luminosity. A lower means the star is only partially disrupted, which will reduce the outflow mass, so the effect induced is similar to having a lower . Increasing beyond only slightly increases the peak fallback rate so it barely also affects the peak luminosity of the flare.
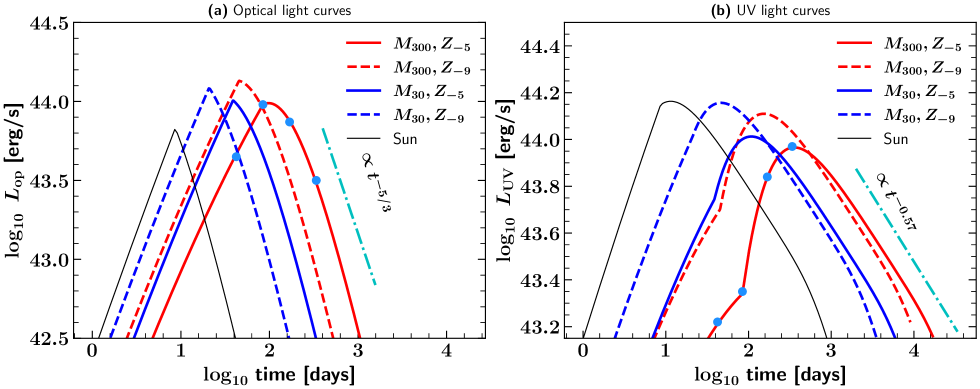
Next we consider the evolution of the flare flux in specific wavelength bands. Fig. 7 shows the optical ( THz) and UV ( THz) light curves of TDEs of Pop III and solar-type stars by a MBH of . For the fiducial Pop III star model, we also mark the epochs () on the light curves. One can see that both the optical and UV luminosities increase in the initial phase when traces the edge of the wind. However, the behavior of the UV and optical light curves after are different. For a solar-type star, since the peak of the flare SED stays in the UV regime, both the UV and the optical light-curve reach the peak around and decay afterwards. However, for a Pop III star, the TDE flare SED shifts from UV to optical bands around and shifts back to UV band afterwards. Therefore, while the tidal flare optical light curve still peaks at , the UV light curve continues to rise for tens to few hundreds of days after . Furthermore, at late times, while the optical luminosity decays rather closely following the debris mass fallback rate (), the UV light curve has a much shallower slope () due to the temperature evolution in this phase. This also means that the UV light curve has an evolution timescale longer than that of the optical light curve.
In summary, the bolometric luminosity of a Pop III star TDE in the rest frame of the host galaxy increases with a larger ; a smaller metallicity; a higher outflow fraction, or a slower wind velocity, which all likely promote the potential observability of these TDEs. Furthermore, a higher Pop III mass will additionally serve to lengthen the evolution timescale of these light curves. We calculate the properties of the observed, and redshifted TDE emission in the next section.
3.2 Pop III Star TDEs: Observed Fluxes and Light Curves
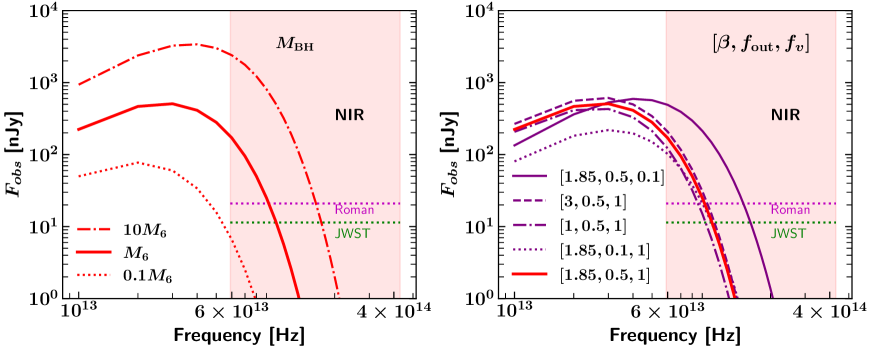
So far we have established that the emission from Pop III TDEs mostly resides in UV/optical wavebands in the rest frame of the TDE host galaxy. In the subsequent calculations, we adopt a canonical value of redshift for Pop III star TDEs and calculate the red-shifted TDE emissions observed at .
With and denoting the rest-frame frequency and the observed frequency, respectively, the two are related as:
| (29) |
Therefore, the observed Pop III star TDE SED should be redshifted following and peaks around or slightly below Hz, which corresponds to nm. This means that a large fraction of the Pop III star TDE emission should be redshifted to the near-infrared (NIR) regime, and such events can be potentially detected by the Near Infrared Camera (NIRCam) on JWST covering the wavelength range of nm as well as the Wide Field Instrument (WFI) on Roman with a waveband of nm.
The observed specific flux, ), is related to the rest-frame specific luminosity, , following (Hogg et al., 2002)
| (30) |
Here denotes the luminosity distance which can be expressed as
| (31) |
where
is the comoving distance, is the matter, energy density parameter and Hubble constant at the current time.
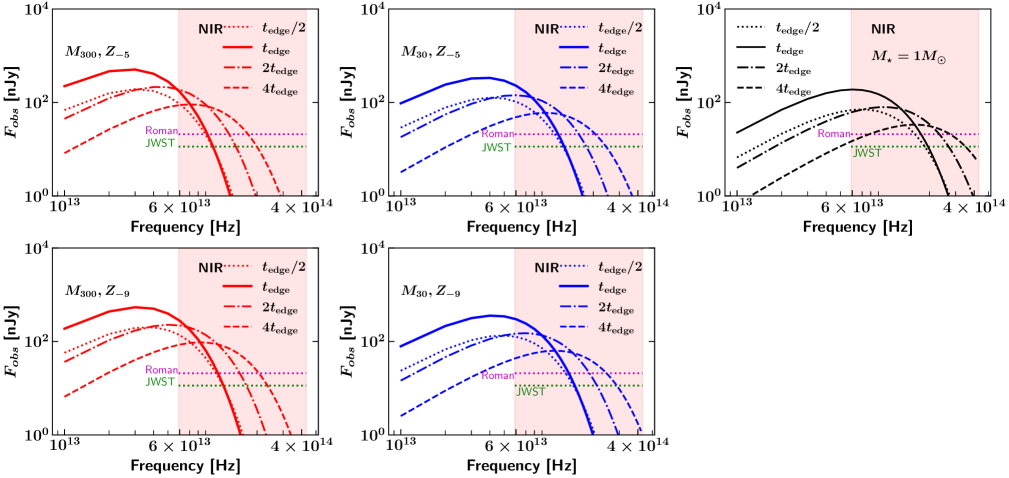
We calculate the observed fluxes of Pop III TDEs at different epochs throughout the event for different stellar models using Eq. 30. The results are plotted in Fig. 8. It can be seen that for all models the fluxes in the NIR band stay above the detection limit of the JWST NIRCam ( nJy corresponding to the F150W filter) and Roman WFI ( nJy corresponding to F106 filter) throughout these epochs. Also no significant differences in the flux level are observed due to different masses or metallicities of Pop III stars. Moreover, we note that the observed flux from the TDE of a disrupted solar-type star is also detectable by NIRcam and WFI.
Additionally, we have examined the dependence of observed flux on other model parameters and the results are shown in Fig. 9. Consistent with the results illustrated in Fig. 6 (c) and (d), one can see that the NIR flux increases significantly with increasing and moderately with decreasing , but is barely affected by and . In particular, the NIR flux becomes undetectable even around peak luminosity when , unless the wind is exceptionally slow (). In summary, in all models, the observed Pop III star TDE NIR flux around flare peak stays significantly above the detection limit of NIRCam and WFI, as long as . Therefore, our results demonstrate that the detection of Pop III star TDEs at with both JWST or Roman is feasible.
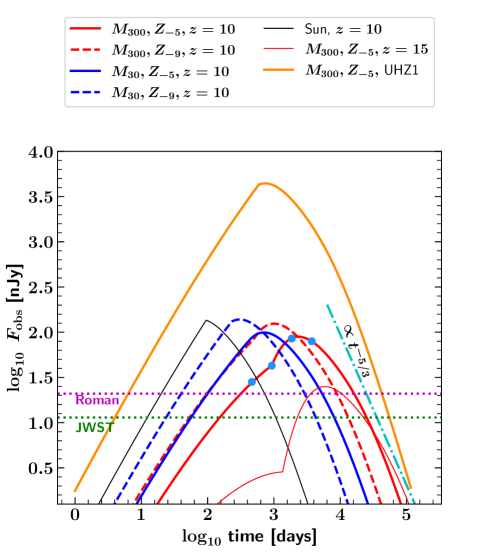
Next we calculate the NIR light curves of Pop III star TDEs as would be observed in the JWST NIRcam band. The NIR light curves are shown in Fig. 10, where one can see that the NIR flux can exceed both the JWST NIRCam and Roman WFI detection limits even when the TDE originates at . Moreover, at such high redshifts, the time dilation effect due to cosmological redshift is very strong, since . Taking a Pop III star TDE at as an example, the observed NIR light curve (above the detection limit) rises on timescales days and decays over days. At late time, the NIR flux still decays following a pattern relatively close to the classical mass fallback rate ().
Furthermore, inspired by the recent discovery of UHZ1, we include the case of a Pop III star disrupted by a MBH with hosted by galaxy at (orange line). As expected, the observed NIR flux is significantly higher in this case, which increases the chance of observing such events in current and upcoming NIR surveys.
Interestingly, given the observed Pop III star TDE flares rise over a few years, there is still a prospect of identifying such TDEs detected during the rising phase as transients, if multiple detections are made within the typical operation time of surveys. However, during the flare decay phase, as the evolution timescale is very long, these events will have almost near constant brightness during the limited operation time and therefore they are more likely to be mis-categorized as AGNs based on their photometry. One promising method to distinguishing Pop III star TDEs from TDEs of Pop I stars or AGNs is through spectroscopic follow-ups. Metal lines should be present in the spectra of either Pop I star TDEs or AGNs even at given that gas is likely no longer metal free (Yang et al., 2023). However, if a Pop III star TDE occurs in a previously quiescent galaxy, a metal-free spectrum should be produced, since all gas supplied to the MBH likely originates from the tidally disrupted Pop III star.
3.3 Rates of Pop III Star TDEs
We now estimate the intrinsic rates of Pop III TDEs in the early Universe. We adopt the approach in Pfister et al. (2020, 2022) to calculate the TDE rate through two-body scattering. The differential TDE rate is given by:
| (32) |
Here is the stellar initial mass function (IMF), is the specific orbital energy of the star with the maximum value at corresponding to the orbit with as the closest approach, and is a function of the loss-cone filling factor , the stellar distribution function , the stellar mass and the penetration parameter . The TDE of a Pop III star can be induced by the scattering between a Pop III star and a normal star or that between two Pop III stars. However, at the redshift range that we are considering, Pop III stars contribute to only a few percent of total stellar mass (Magg et al., 2022). Therefore, we only include the scattering of Pop III stars by normal stars into our calculation. Further details of the terms in Eq. 32 and the rate calculation are given in Appendix A.
| IMF | |||||
|---|---|---|---|---|---|
| Greif et al. (2011) | |||||
| de Bennassuti et al. (2014) | |||||
| Jaacks et al. (2018) |
We summarize the assumptions used for the TDE rate calculation as below:
-
•
Ranges of parameters: We adopt the MBH mass range of , Pop III stellar mass range of ], normal star in the range of ], and in the range to calculate the total TDE rate by integrating Eq. 32.
-
•
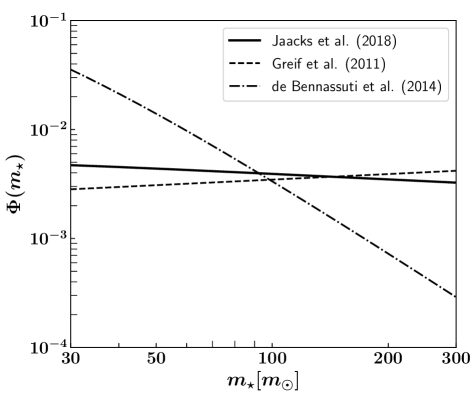
IMF of the stellar populations: We adopt the general Kroupa IMF (Kroupa, 2001) for the normal main-sequence stars. However, the IMF for Pop III stars is model-dependent and not constrained very well yet. Different IMFs have been proposed in the literature, and a few examples are shown in Table 1 and Fig. 11. However, using different Pop III star IMFs bring negligible effects to TDE rates, as explained in Appendix A.
-
•
Mass fraction of Pop III stars: Magg et al. (2022) showed that at Pop III stars has a mass fraction between among all stellar population depending on the timescale at which Pop III stars transit to Pop II stars. We adopt a Pop III star mass fraction of throughout the galaxy for our calculation.
-
•
Stellar density distribution: As there lacks studies of the structures of galaxies for different stellar populations at these extremely high redshifts, we follow the classical papers such as Wang & Merritt (2004); Stone & Metzger (2016); Pfister et al. (2020) and assume isothermal stellar density distributions in the Keplerian potential for both Pop III and normal stars, which gives
(33) where is the stellar density, , and , with being the velocity dispersion of the host galaxy.
Under these assumptions, the TDE rate of Pop III stars from a single galaxy hosting MBH is calculated and listed in Table 1. This intrinsic TDE rate is , which is barely affected by the choice of Pop III star IMF.
One can further compute the volumetric rate of Pop III star TDEs using:
| (34) |
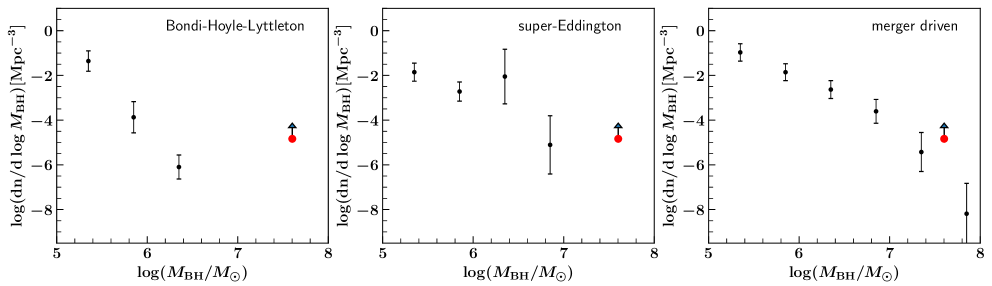
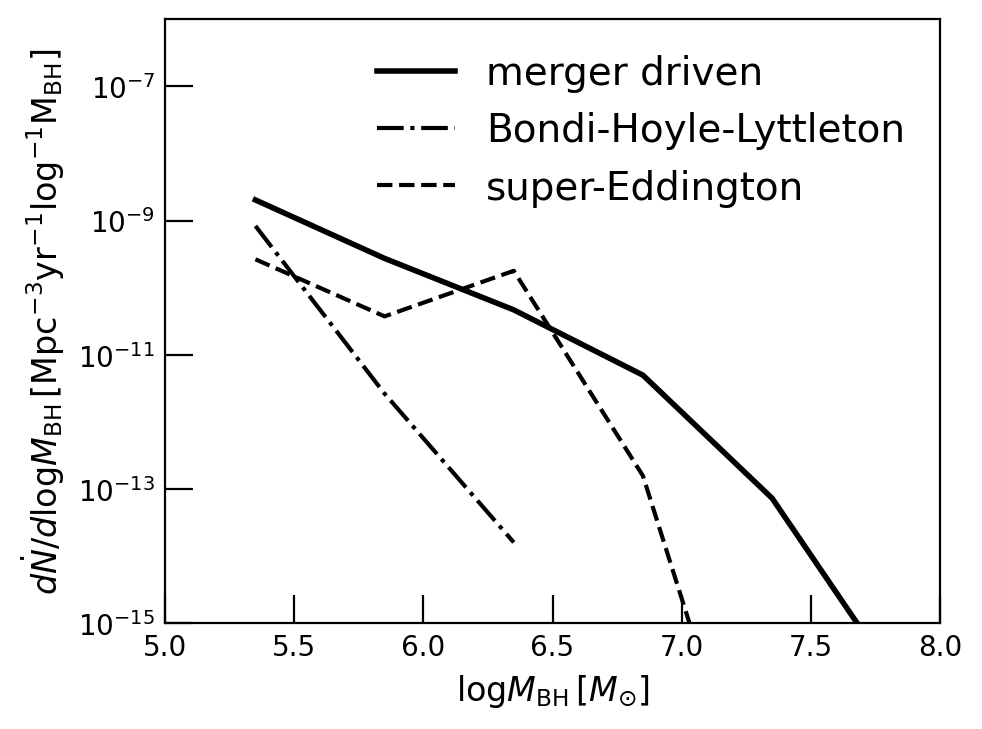
here denotes the black hole mass function (BHMF), which is defined as the number of MBHs with masses between and in unit co-moving volume. We note that the BHMF at high redshifts sensitively depends on the seeding scenarios and growth channels of MBHs, much of which is currently uncertain. In this work, we adopt three different BHMFs from Trinca et al. (2022), that consider not only light, intermediate and heavy MBH seeds but also different processes responsible for their growth. Fig. 12 shows the BHMF at for these three growth models, namely, Eddington-limited Bondi-Hoyle-Lyttleton accretion, super-Eddington accretion and merger-driven growth (Hoyle & Lyttleton, 1941; Bondi, 1952). We focus on the MBHs with for this work, since the observed Pop III star TDE flux goes below the threshold of NIRCam and WFI when (Fig. 9). It is seen that the BHMF from the merger-driven growth channel generally has higher values in this range than the other two BHMF choices. The volumetric Pop III star TDE rates using these three different BHMFs are calculated and shown in Fig. 13, which are around . Out of the three, not surprisingly, the BHMF based on the merger-driven growth model produces the highest integrated volumetric TDE rate .
We also include the BHMF inferred from calibrating models with the detection of UHZ1 in Fig. 12, and note that the BHMF taken from Trinca et al. (2022) (as well as other current BHMF models) underestimate the number density of massive black holes in all the growth models. Hence it is possible that the actual Pop III TDE rate is higher than our estimate. An updated BHMF at high redshift from additional observations of a population of BHs will be crucial for more accurately constraining the Pop III star TDE rate.
3.4 Pop III Star TDE Predictions for JWST and Nancy Grace Roman Space Telescope
In this section we estimate the total number of Pop III star TDEs that stand to be detected by telescope JWST and Roman. For a first-order estimate of the upper limit of the detection numbers, we ignore factors such as survey strategies and limitations. The total number can then be approximated using:
| (35) |
Here is the volumetric TDE rate obtained in the previous section, is duration of the observational survey, and is the co-moving volume from which the event can be detected. can be computed using the following equation:
| (36) |
where is the co-moving distance dependent on redshift , and is the sky coverage fraction of the telescope of survey.
For the case of Pop III star TDEs, we adopt , when the Pop III star population reaches peak, and , when both the Pop III stars and MBHs should have started to form. More importantly, we have predicted in Fig. 10 that Pop III star TDEs at are still bright enough to be detected by JWST and Roman. Moreover, for simplicity, we stick to a constant (based on the Pop III star IMF by Jaacks et al. (2018) and the BHMF from the merger-driven growth model), and note that this likely gives an upper limit to the detected number.
JWST Cycle 1 has various deep surveys, such as COSMOS-Web with a total area of 0.54 and duration of 255 hours (Casey et al., 2023), and the JWST Advance Deep Extragalactic Survey (JADES) with its sky coverage of and a total duration of hours considering both the deep and medium modes (Eisenstein et al., 2023). Using both the COSMOS-Web survey and the deep mode of the JADES survey, which can both probe galaxies at , the total detected number of Pop III TDEs in one year is about . Throughout the 10 year expected lifespan of JWST, even if we assume COSMOS-Web like surveys are continuously conducted, the total expected detection number is still only event in total. Therefore, the chance of detecting Pop III star TDEs using JWST is slim. If such TDEs were detected, it would indicate the BHMF at is much larger than currently estimated, which would pose an interesting challenge in our understanding of the formation efficiency and evolution of MBHs in the early Universe. With the recent discovery of UHZ1 and its interpretation as an OBG arising from a heavy initial seed by Natarajan et al. (2024), it appears that BH seed formation in the early Universe can occur via multiple seeding pathways hence rendering the process significantly more efficient than previously believed.
A much more promising telescope for detecting Pop III star TDEs is the upcoming Nancy Grace Roman Space Telescope, which is designed to have a sensitivity similar to JWST (Fig. 10) and conduct wide-field surveys over a very large FOV of (Mosby et al., 2020). Hence, from the High Latitude Wide Area Roman survey that aims to cover a total sky area of deg2 (Wang et al., 2022b), the number of detected Pop III TDEs can reach in one year. Furthermore, there is another proposed survey, the Next-generation All-sky Near-infrared Community surveY (NANCY) (Han et al., 2023), which plans to perform an all-sky scan. This survery strategy will lead to the detection of Pop III TDEs in a single year! Once a large sample of Pop III star TDEs are observed, the number can be used to put a strong constraints on the properties and mass fraction of Pop III stars as well as the BHMF at which will provide the much needed insights into the efficiency of early BH formation.
4 Summary and Discussion
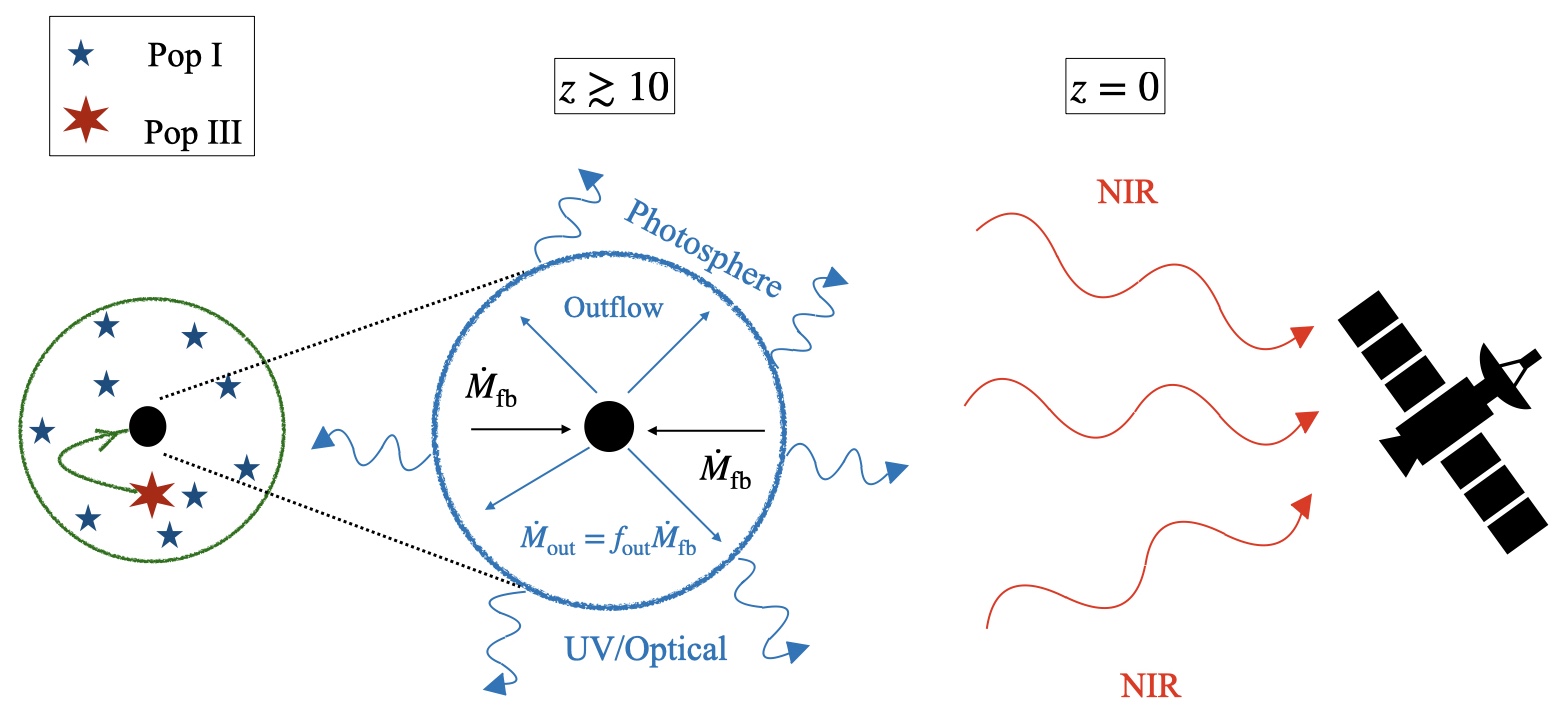
Pop III stars are the first-generation stars which are expected to form from metal-free primordial gas. Their formation and properties have been under study with multiple theoretical investigations, but their direct detection remains a challenging open question. The primary focus of this work is to investigate the prospect of detecting Pop III stars through the flares produced when these stars are tidally disrupted by MBHs, utilizing telescopes such as JWST and Roman that can probe the high redshift Universe. We summarize the key features of our assumed model and main findings therefrom below and show a schematic illustration in Fig. 14.
-
•
Pop III stars have tidal disruption radii around or a few times larger than that of a solar-type star. Very massive Pop III stars with can possibly be disrupted by MBHs with up to .
-
•
The debris mass fallback rates for Pop III star TDEs can stay hyper-Eddington for long periods. For example, for a typical MBH with , can reach a peak value of and stays super-Eddington for years, with its peak value . In the more extreme case of a UHZ1-like source with , drops to around and can still stay super-Eddington for more than a few years.
-
•
We adopt the super-Eddington outflow model proposed by Strubbe & Quataert (2009) and only consider the emission produced by the outflow in this phase while predicting potential observational signatures.
- •
-
•
As Pop III star TDEs are expected to mostly occur at high redshifts (), a large fraction of the emission is redshifted to the NIR band and the observed flux exceeds the detection limit of JWST NIRCam and Roman WFI (Fig. 8 and Fig. 9). Moreover, due to the time dilation effect, the observed NIR flares evolve even more slowly (rising in 100-1000 days and decaying over 10-100 years) (Fig. 10).
-
•
The volumetric rate of Pop III star TDEs is insensitive to Pop III star IMF, but sensitively depends on the BHMF at high redshifts which in turn depends on the seeding and growth models of MBHs.
-
•
We obtain an upper limit on Pop III star TDE volumetric rate of (Fig. 13), based on the current BHMF model. We note that the recent detection of overmassive black holes at high redshifts indicate that the density of MBHs at and hence our estimated TDE rates could be lower than the actual numbers.
-
•
The high NIR luminosity and long duration of the Pop III star tidal flares make these events detectable by the Roman Space telescope and we predict up to a few tens of events per year with its wide field instrument. However, the probability of detecting a Pop III TDE using JWST is low due to its narrower FOV.
Our results under the SQ09 model are rather robust against the choice of Pop III star mass, metallicity, and other model parameters such as the penetration parameter of the stellar orbit, outflow fraction and speed, etc. However, it should be acknowledged that this 1D analytical model cannot explain the observed X-ray emissions produced in Pop I star TDEs in the local universe. For the latter, simulations of super-Eddington disks around SMBHs with reveal that an optically thin funnel can form in the polar region through which X-rays can leak out (Dai et al., 2018; Jiang et al., 2019; Thomsen et al., 2022). However, it is previously shown that the funnel can diminish when reaches (Sadowski & Narayan, 2016). Therefore, Pop III star TDEs with extremely high fallback rates likely cannot produce strong X-ray emissions, unless when relativistic jets are produced and pointing towards the observer. Moreover, we note that the realistic structures of the massive stars can affect the TDE debris mass fallback rate calculation (Law-Smith et al., 2020). Therefore, future detailed modeling of Pop III star structures will be useful to improve our calculation.
It is also worth mentioning that at the high redshifts we are considering, Pop III stars only occupy a few percent of the total stellar population, while Pop I and Pop II stars dominate the stellar mass and therefore should produce much higher TDE rates. Although the focus of this work is on Pop III star TDEs, we have shown that the NIR flux of Pop I star TDEs at also exceeds the detection limit of JWST and Roman. Pop III star and Pop I star TDEs, however, can be distinguished by their different evolution timescales. Furthermore, the Pop I star TDEs observed so far typically produce metal lines including C, N, O, Mg, and Fe lines in their optical or UV spectra (Leloudas et al., 2019; Blagorodnova et al., 2019; Gezari, 2021; Charalampopoulos et al., 2022), and such signatures cannot be produced by Pop III star TDEs. Pop I and Pop II star TDEs at high redshifts are worth further investigation, which is beyond the scope of this paper.
Another interesting aspect worth considering is the detection of TDEs at high redshifts magnified through gravitational lensing. Recent works show promising results of finding extremely faint high- objects, including a number of Pop III star candidates, faint stars, distant galaxies and black holes with their observed fluxes largely boosted by nearby foreground lensing clusters (Kelly et al., 2018; Kaurov et al., 2019; Schauer et al., 2022; Vikaeus et al., 2022a; Bogdán et al., 2023; Meena et al., 2023; Diego et al., 2023). Hence, the effect of lensing should also enhance the observed TDE fluxes, which will bring more high- (Pop III) TDEs into view. While it has been shown that the chance of having a high- galaxy lensed is roughly (Saha et al., 2024), the probability of having lensed transients yet to be studied in detail.
With the advent of JWST, the number of detected quasars with at has increased by a large number (Wang et al., 2023; Yang et al., 2023; Natarajan et al., 2024), which offers interesting insights into the models of BH seed formation. TDEs including Pop III TDEs could also be one of the channels responsible for the rapid growth of BH seeds at very high redshifts. This was previously proposed by Pfister et al. (2021) who showed that IMBHs at high redshifts can accumulate their masses through TDEs at a similar rate as through gas accretion.
In summary, in this work we compute the properties of a brand new class of high-redshift sources, tidally disrupted Pop III stars, and demonstrate that they could be viably detected in upcoming wide field IR surveys. The prospect of observing such TDEs has only become promising due to the recent launch of JWST and the expected launch of the Nancy Grace Roman Space Telescope.
Appendix A Calculation of TDE Rates
For a distribution of Pop III stars with density profile following and mass distribution expressed by , the TDE rate can be calculated using the loss cone dynamics. We give a summary of the methodology as below and refer the readers to Pfister et al. (2020, 2022) for more details. The differential TDE rate can be expressed in terms of stellar mass (), black hole mass () and the penetration parameter () such that:
| (A1) |
The specific binding energy is integrated from 0 to the maximum energy . The function is described as follows:
| (A2) | ||||
where describes the fraction of stars in the loss cone:
| (A3) |
and
| (A4) |
and are the Bessel functions of the first kind, with general notation as:
| (A5) |
where is the gamma function, and is the th zero of the Bessel function .
If we assume the density follows an isothermal profile with (Eq 33), the distribution function takes an analytical form:
| (A6) |
where is the velocity distribution at the BH influence radius , is the average stellar mass of the Pop III stellar mass function , is the Euler Gamma function, and is the central density:
| (A7) |
Here denotes the mass fraction of Pop III stars among all stellar populations in a galaxy at (Magg et al., 2022). The loss cone filling factor can also be described as follow:
| (A8) |
with
| (A9) |
Here is the coulomb logarithm, , and represents the total population of stars inside a galaxy that are available for scattering. To simplify the calculation, we assume all Pop III star TDEs are produced by the scattering between a Pop III star and a Pop I star star, so that
| (A10) |
Furthermore, is defined as
| (A11) |
with as the incomplete Euler Beta function.
As discussed in Sec 3.3, the volumetric rate of TDE is very mildly affected by the IMF of Pop III stars. This is mainly because that total TDE rate scales with , which does not differ much when the average is taken over the same mass range () for different IMFs.
References
- Abel et al. (2002) Abel, T., Bryan, G. L., & Norman, M. L. 2002, Science, 295, 93, doi: 10.1126/science.295.5552.93
- Alexander et al. (2020) Alexander, K. D., van Velzen, S., Horesh, A., & Zauderer, B. A. 2020, Space Sci. Rev., 216, 81, doi: 10.1007/s11214-020-00702-w
- Andalman et al. (2022) Andalman, Z. L., Liska, M. T. P., Tchekhovskoy, A., Coughlin, E. R., & Stone, N. 2022, MNRAS, 510, 1627, doi: 10.1093/mnras/stab3444
- Atek et al. (2023) Atek, H., Chemerynska, I., Wang, B., et al. 2023, MNRAS, 524, 5486, doi: 10.1093/mnras/stad1998
- Auchettl et al. (2017) Auchettl, K., Guillochon, J., & Ramirez-Ruiz, E. 2017, ApJ, 838, 149, doi: 10.3847/1538-4357/aa633b
- Blagorodnova et al. (2019) Blagorodnova, N., Cenko, S. B., Kulkarni, S. R., et al. 2019, ApJ, 873, 92, doi: 10.3847/1538-4357/ab04b0
- Bogdán et al. (2023) Bogdán, Á., Goulding, A. D., Natarajan, P., et al. 2023, Nature Astronomy, doi: 10.1038/s41550-023-02111-9
- Bondi (1952) Bondi, H. 1952, MNRAS, 112, 195, doi: 10.1093/mnras/112.2.195
- Bonnerot & Rossi (2019) Bonnerot, C., & Rossi, E. M. 2019, MNRAS, 484, 1301, doi: 10.1093/mnras/stz062
- Bromm et al. (2002) Bromm, V., Coppi, P. S., & Larson, R. B. 2002, ApJ, 564, 23, doi: 10.1086/323947
- Bromm et al. (2001a) Bromm, V., Ferrara, A., Coppi, P. S., & Larson, R. B. 2001a, MNRAS, 328, 969, doi: 10.1046/j.1365-8711.2001.04915.x
- Bromm et al. (2001b) Bromm, V., Kudritzki, R. P., & Loeb, A. 2001b, ApJ, 552, 464, doi: 10.1086/320549
- Bromm et al. (2009) Bromm, V., Yoshida, N., Hernquist, L., & McKee, C. F. 2009, Nature, 459, 49, doi: 10.1038/nature07990
- Bu et al. (2023) Bu, D.-F., Qiao, E., & Yang, X.-H. 2023, MNRAS, 523, 4136, doi: 10.1093/mnras/stad1696
- Casey et al. (2023) Casey, C. M., Kartaltepe, J. S., Drakos, N. E., et al. 2023, ApJ, 954, 31, doi: 10.3847/1538-4357/acc2bc
- Castellano et al. (2022) Castellano, M., Fontana, A., Treu, T., et al. 2022, ApJ, 938, L15, doi: 10.3847/2041-8213/ac94d0
- Charalampopoulos et al. (2022) Charalampopoulos, P., Leloudas, G., Malesani, D. B., et al. 2022, A&A, 659, A34, doi: 10.1051/0004-6361/202142122
- Chen et al. (2022) Chen, K.-J., Tang, C.-Y., Ho, M.-Y., et al. 2022, arXiv e-prints, arXiv:2211.06016, doi: 10.48550/arXiv.2211.06016
- Clark et al. (2011) Clark, P. C., Glover, S. C. O., Smith, R. J., et al. 2011, Science, 331, 1040, doi: 10.1126/science.1198027
- Crowther et al. (2010) Crowther, P. A., Schnurr, O., Hirschi, R., et al. 2010, MNRAS, 408, 731, doi: 10.1111/j.1365-2966.2010.17167.x
- Dai et al. (2021) Dai, J. L., Lodato, G., & Cheng, R. 2021, Space Sci. Rev., 217, 12, doi: 10.1007/s11214-020-00747-x
- Dai et al. (2018) Dai, L., McKinney, J. C., Roth, N., Ramirez-Ruiz, E., & Miller, M. C. 2018, ApJ, 859, L20, doi: 10.3847/2041-8213/aab429
- de Bennassuti et al. (2014) de Bennassuti, M., Schneider, R., Valiante, R., & Salvadori, S. 2014, MNRAS, 445, 3039, doi: 10.1093/mnras/stu1962
- de Souza et al. (2011) de Souza, R. S., Yoshida, N., & Ioka, K. 2011, A&A, 533, A32, doi: 10.1051/0004-6361/201117242
- Diego et al. (2023) Diego, J. M., Sun, B., Yan, H., et al. 2023, A&A, 679, A31, doi: 10.1051/0004-6361/202347556
- Eisenstein et al. (2023) Eisenstein, D. J., Willott, C., Alberts, S., et al. 2023, arXiv e-prints, arXiv:2306.02465, doi: 10.48550/arXiv.2306.02465
- Evans & Kochanek (1989) Evans, C. R., & Kochanek, C. S. 1989, ApJ, 346, L13, doi: 10.1086/185567
- Fowler & Hoyle (1964) Fowler, W. A., & Hoyle, F. 1964, ApJS, 9, 201, doi: 10.1086/190103
- Gardner et al. (2006) Gardner, J. P., Mather, J. C., Clampin, M., et al. 2006, Space Sci. Rev., 123, 485, doi: 10.1007/s11214-006-8315-7
- Gezari (2021) Gezari, S. 2021, ARA&A, 59, 21, doi: 10.1146/annurev-astro-111720-030029
- Greif et al. (2011) Greif, T. H., Springel, V., White, S. D. M., et al. 2011, ApJ, 737, 75, doi: 10.1088/0004-637X/737/2/75
- Guillochon & Ramirez-Ruiz (2013) Guillochon, J., & Ramirez-Ruiz, E. 2013, ApJ, 767, 25, doi: 10.1088/0004-637X/767/1/25
- Han et al. (2023) Han, J. J., Dey, A., Price-Whelan, A. M., et al. 2023, arXiv e-prints, arXiv:2306.11784, doi: 10.48550/arXiv.2306.11784
- Hogg et al. (2002) Hogg, D. W., Baldry, I. K., Blanton, M. R., & Eisenstein, D. J. 2002, arXiv e-prints, astro, doi: 10.48550/arXiv.astro-ph/0210394
- Hoyle & Lyttleton (1941) Hoyle, F., & Lyttleton, R. A. 1941, MNRAS, 101, 227, doi: 10.1093/mnras/101.4.227
- Hummel et al. (2012) Hummel, J. A., Pawlik, A. H., Milosavljević, M., & Bromm, V. 2012, ApJ, 755, 72, doi: 10.1088/0004-637X/755/1/72
- Jaacks et al. (2018) Jaacks, J., Thompson, R., Finkelstein, S. L., & Bromm, V. 2018, MNRAS, 475, 4396, doi: 10.1093/mnras/sty062
- Jiang et al. (2019) Jiang, Y.-F., Stone, J. M., & Davis, S. W. 2019, ApJ, 880, 67, doi: 10.3847/1538-4357/ab29ff
- Jimenez & Haiman (2006) Jimenez, R., & Haiman, Z. 2006, Nature, 440, 501, doi: 10.1038/nature04580
- Johnson et al. (2007) Johnson, J. L., Greif, T. H., & Bromm, V. 2007, ApJ, 665, 85, doi: 10.1086/519212
- Kaurov et al. (2019) Kaurov, A. A., Dai, L., Venumadhav, T., Miralda-Escudé, J., & Frye, B. 2019, ApJ, 880, 58, doi: 10.3847/1538-4357/ab2888
- Kelly et al. (2018) Kelly, P. L., Diego, J. M., Rodney, S., et al. 2018, Nature Astronomy, 2, 334, doi: 10.1038/s41550-018-0430-3
- Kesden (2012) Kesden, M. 2012, Phys. Rev. D, 85, 024037, doi: 10.1103/PhysRevD.85.024037
- Kippenhahn & Weigert (1990) Kippenhahn, R., & Weigert, A. 1990, Stellar Structure and Evolution
- Klessen & Glover (2023) Klessen, R. S., & Glover, S. C. O. 2023, The first stars: formation, properties, and impact. https://arxiv.org/abs/2303.12500
- Kroupa (2001) Kroupa, P. 2001, MNRAS, 322, 231, doi: 10.1046/j.1365-8711.2001.04022.x
- Kulkarni et al. (2014) Kulkarni, G., Hennawi, J. F., Rollinde, E., & Vangioni, E. 2014, ApJ, 787, 64, doi: 10.1088/0004-637X/787/1/64
- Law-Smith et al. (2020) Law-Smith, J. A. P., Coulter, D. A., Guillochon, J., Mockler, B., & Ramirez-Ruiz, E. 2020, ApJ, 905, 141, doi: 10.3847/1538-4357/abc489
- Lazar & Bromm (2022) Lazar, A., & Bromm, V. 2022, MNRAS, 511, 2505, doi: 10.1093/mnras/stac176
- Leloudas et al. (2019) Leloudas, G., Dai, L., Arcavi, I., et al. 2019, ApJ, 887, 218, doi: 10.3847/1538-4357/ab5792
- Liu & Bromm (2020) Liu, B., & Bromm, V. 2020, MNRAS, 497, 2839, doi: 10.1093/mnras/staa2143
- Lodato & Rossi (2011) Lodato, G., & Rossi, E. M. 2011, MNRAS, 410, 359, doi: 10.1111/j.1365-2966.2010.17448.x
- Loeb & Ulmer (1997) Loeb, A., & Ulmer, A. 1997, ApJ, 489, 573, doi: 10.1086/304814
- Lu & Bonnerot (2020) Lu, W., & Bonnerot, C. 2020, MNRAS, 492, 686, doi: 10.1093/mnras/stz3405
- Magg et al. (2022) Magg, M., Reis, I., Fialkov, A., et al. 2022, MNRAS, 514, 4433, doi: 10.1093/mnras/stac1664
- Maiolino et al. (2023) Maiolino, R., Scholtz, J., Witstok, J., et al. 2023, arXiv e-prints, arXiv:2305.12492, doi: 10.48550/arXiv.2305.12492
- Meena et al. (2023) Meena, A. K., Zitrin, A., Jiménez-Teja, Y., et al. 2023, ApJ, 944, L6, doi: 10.3847/2041-8213/acb645
- Mesler et al. (2014) Mesler, R. A., Whalen, D. J., Smidt, J., et al. 2014, ApJ, 787, 91, doi: 10.1088/0004-637X/787/1/91
- Metzger & Stone (2016) Metzger, B. D., & Stone, N. C. 2016, MNRAS, 461, 948, doi: 10.1093/mnras/stw1394
- Mosby et al. (2020) Mosby, G., Rauscher, B. J., Bennett, C., et al. 2020, Journal of Astronomical Telescopes, Instruments, and Systems, 6, 046001, doi: 10.1117/1.JATIS.6.4.046001
- Murphy et al. (2021) Murphy, L. J., Groh, J. H., Farrell, E., et al. 2021, MNRAS, 506, 5731, doi: 10.1093/mnras/stab2073
- Natarajan et al. (2024) Natarajan, P., Pacucci, F., Ricarte, A., et al. 2024, ApJ, 960, L1, doi: 10.3847/2041-8213/ad0e76
- Park et al. (2021a) Park, J., Ricotti, M., & Sugimura, K. 2021a, MNRAS, 508, 6176, doi: 10.1093/mnras/stab2999
- Park et al. (2021b) —. 2021b, MNRAS, 508, 6193, doi: 10.1093/mnras/stab3000
- Pfister et al. (2021) Pfister, H., Dai, J. L., Volonteri, M., et al. 2021, MNRAS, 500, 3944, doi: 10.1093/mnras/staa3471
- Pfister et al. (2022) Pfister, H., Toscani, M., Wong, T. H. T., et al. 2022, MNRAS, 510, 2025, doi: 10.1093/mnras/stab3387
- Pfister et al. (2020) Pfister, H., Volonteri, M., Dai, J. L., & Colpi, M. 2020, MNRAS, 497, 2276, doi: 10.1093/mnras/staa1962
- Phinney (1989) Phinney, E. S. 1989, in The Center of the Galaxy, ed. M. Morris, Vol. 136, 543
- Prole et al. (2023) Prole, L. R., Schauer, A. T. P., Clark, P. C., et al. 2023, MNRAS, 520, 2081, doi: 10.1093/mnras/stad188
- Rees (1988) Rees, M. J. 1988, Nature, 333, 523, doi: 10.1038/333523a0
- Regős et al. (2020) Regős, E., Vinkó, J., & Ziegler, B. L. 2020, ApJ, 894, 94, doi: 10.3847/1538-4357/ab8636
- Rickard & Pauli (2023) Rickard, M. J., & Pauli, D. 2023, A&A, 674, A56, doi: 10.1051/0004-6361/202346055
- Roth et al. (2016) Roth, N., Kasen, D., Guillochon, J., & Ramirez-Ruiz, E. 2016, ApJ, 827, 3, doi: 10.3847/0004-637X/827/1/3
- Roth et al. (2020) Roth, N., Rossi, E. M., Krolik, J., et al. 2020, Space Sci. Rev., 216, 114, doi: 10.1007/s11214-020-00735-1
- Rydberg et al. (2013) Rydberg, C.-E., Zackrisson, E., Lundqvist, P., & Scott, P. 2013, MNRAS, 429, 3658, doi: 10.1093/mnras/sts653
- Saad et al. (2022) Saad, C. R., Bromm, V., & El Eid, M. 2022, MNRAS, 516, 3130, doi: 10.1093/mnras/stac2479
- Sadowski & Narayan (2016) Sadowski, A., & Narayan, R. 2016, MNRAS, 456, 3929, doi: 10.1093/mnras/stv2941
- Saha et al. (2024) Saha, P., Sluse, D., Wagner, J., & Williams, L. L. R. 2024, arXiv e-prints, arXiv:2401.04165, doi: 10.48550/arXiv.2401.04165
- Saxton et al. (2020) Saxton, R., Komossa, S., Auchettl, K., & Jonker, P. G. 2020, Space Sci. Rev., 216, 85, doi: 10.1007/s11214-020-00708-4
- Scannapieco et al. (2003) Scannapieco, E., Schneider, R., & Ferrara, A. 2003, ApJ, 589, 35, doi: 10.1086/374412
- Schaerer (2003) Schaerer, D. 2003, A&A, 397, 527, doi: 10.1051/0004-6361:20021525
- Schauer et al. (2022) Schauer, A. T. P., Bromm, V., Drory, N., & Boylan-Kolchin, M. 2022, ApJ, 934, L6, doi: 10.3847/2041-8213/ac7f9a
- Schneider et al. (2002) Schneider, R., Ferrara, A., Natarajan, P., & Omukai, K. 2002, ApJ, 571, 30, doi: 10.1086/339917
- Shiokawa et al. (2015) Shiokawa, H., Krolik, J. H., Cheng, R. M., Piran, T., & Noble, S. C. 2015, ApJ, 804, 85, doi: 10.1088/0004-637X/804/2/85
- Sokasian et al. (2004) Sokasian, A., Yoshida, N., Abel, T., Hernquist, L., & Springel, V. 2004, MNRAS, 350, 47, doi: 10.1111/j.1365-2966.2004.07636.x
- Spergel et al. (2015) Spergel, D., Gehrels, N., Baltay, C., et al. 2015, arXiv e-prints, arXiv:1503.03757, doi: 10.48550/arXiv.1503.03757
- Stone & Metzger (2016) Stone, N. C., & Metzger, B. D. 2016, MNRAS, 455, 859, doi: 10.1093/mnras/stv2281
- Strubbe & Quataert (2009) Strubbe, L. E., & Quataert, E. 2009, MNRAS, 400, 2070, doi: 10.1111/j.1365-2966.2009.15599.x
- Thomsen et al. (2022) Thomsen, L. L., Kwan, T. M., Dai, L., et al. 2022, ApJ, 937, L28, doi: 10.3847/2041-8213/ac911f
- Trinca et al. (2022) Trinca, A., Schneider, R., Valiante, R., et al. 2022, MNRAS, 511, 616, doi: 10.1093/mnras/stac062
- van Velzen et al. (2021) van Velzen, S., Gezari, S., Hammerstein, E., et al. 2021, ApJ, 908, 4, doi: 10.3847/1538-4357/abc258
- Vanzella et al. (2020) Vanzella, E., Meneghetti, M., Caminha, G. B., et al. 2020, MNRAS, 494, L81, doi: 10.1093/mnrasl/slaa041
- Vikaeus et al. (2022a) Vikaeus, A., Whalen, D. J., & Zackrisson, E. 2022a, ApJ, 933, L8, doi: 10.3847/2041-8213/ac7802
- Vikaeus et al. (2022b) Vikaeus, A., Zackrisson, E., Schaerer, D., et al. 2022b, MNRAS, 512, 3030, doi: 10.1093/mnras/stac488
- Wang et al. (2023) Wang, F., Yang, J., Hennawi, J. F., et al. 2023, ApJ, 951, L4, doi: 10.3847/2041-8213/accd6f
- Wang & Merritt (2004) Wang, J., & Merritt, D. 2004, ApJ, 600, 149, doi: 10.1086/379767
- Wang et al. (2022a) Wang, X., Cheng, C., Ge, J., et al. 2022a, arXiv e-prints, arXiv:2212.04476, doi: 10.48550/arXiv.2212.04476
- Wang et al. (2022b) Wang, Y., Zhai, Z., Alavi, A., et al. 2022b, ApJ, 928, 1, doi: 10.3847/1538-4357/ac4973
- Welch et al. (2022) Welch, B., Coe, D., Diego, J. M., et al. 2022, Nature, 603, 815, doi: 10.1038/s41586-022-04449-y
- Wise et al. (2012) Wise, J. H., Turk, M. J., Norman, M. L., & Abel, T. 2012, ApJ, 745, 50, doi: 10.1088/0004-637X/745/1/50
- Yajima et al. (2023) Yajima, H., Abe, M., Fukushima, H., et al. 2023, MNRAS, doi: 10.1093/mnras/stad2497
- Yang et al. (2023) Yang, J., Wang, F., Fan, X., et al. 2023, ApJ, 951, L5, doi: 10.3847/2041-8213/acc9c8
- Yoshida et al. (2004) Yoshida, N., Bromm, V., & Hernquist, L. 2004, ApJ, 605, 579, doi: 10.1086/382499
- Yoshida et al. (2006) Yoshida, N., Omukai, K., Hernquist, L., & Abel, T. 2006, ApJ, 652, 6, doi: 10.1086/507978
- Zanazzi & Ogilvie (2020) Zanazzi, J. J., & Ogilvie, G. I. 2020, MNRAS, 499, 5562, doi: 10.1093/mnras/staa3127