Awakening of A Blazar at Redshift 2.7 Temporally Coincident with Arrival of Cospatial Neutrino Event IceCube-201221A
Abstract
We report on multiwavelength studies of the blazar NVSS J171822+423948, which is identified as the low-energy counterpart of 4FGL J1718.5+4237, the only -ray source known to be cospatial with the IceCube neutrino event IC-201221A. After a 12-year long quiescent period undetected by Fermi-LAT, -ray activities with a tenfold flux increase emerge soon (a few tens of days) after arrival of the neutrino. Associated optical flares in the ZTF , , and bands are observed together with elevated WISE infrared fluxes. Synchronized variations suggest that both the -ray emission and the neutrino event are connected to the blazar. Furthermore, the optical spectrum reveals emission lines at a redshift = 2.68 0.01. Thus, it is the first candidate for a neutrino-emitting blazar at the redshift above 2. Discussions of theoretical constraints of neutrino production and comparisons with other candidates are presented.
1 Introduction
The IceCube Neutrino Observatory has detected high-energy astrophysical neutrinos (e.g., IceCube Collaboration, 2013; Aartsen et al., 2015; Icecube Collaboration et al., 2023), ushering in a new era in neutrino astronomy. The neutrino signal is compatible with an isotropic distribution in the sky, suggesting that a substantial fraction of the observed neutrinos are of extragalactic origin. Neutrinos interact weakly with matter and travel undeflected in magnetic fields, providing key insights into extreme cosmic environments that are otherwise opaque (Aartsen et al., 2018). Interactions involving photohadronic () or hadronuclear () processes are responsible for the generation of neutrinos, while accompanying -ray radiations are also anticipated (Halzen & Kheirandish, 2022). Moreover, hadronic cascades produce electromagnetic emissions at lower energies. Hence, there should be a strong correlation between electromagnetic emissions and neutrino events. Various types of extragalactic -ray emitters are proposed as potential neutrino sources, such as active galactic nucleus (AGN) jets (e.g., Böttcher et al., 2013; Becker Tjus et al., 2014), -ray bursts (e.g., Waxman, 1995), tidal disruption events (Stein et al., 2021; Reusch et al., 2022; Jiang et al., 2023), starburst galaxies (e.g., Loeb & Waxman, 2006) as well as galaxy clusters (e.g., Murase et al., 2008). Intriguingly, evidence for neutrino emission from a nearby Seyfert galaxy NGC 1068 has been revealed (IceCube Collaboration et al., 2022). However, because of the relatively large angular uncertainties of neutrinos, the origin of extragalactic astrophysical neutrinos remains unresolved.
In addition to spatial information, temporal information is also crucial for determining the origin of neutrinos. IceCube has detected a 0.3 PeV muon neutrino (IC-170922A) cospatial with a blazar TXS 0506+056 ( = 0.3365, Paiano et al. 2018), at the time when the blazar underwent unprecedented multi-wavelength flares, yielding a 3 significance for the correlation of observed multimessenger radiations (IceCube Collaboration et al., 2018a). Blazars are a rare subclass of active galactic nuclei (AGNs) that includes flat-spectrum radio quasars (FSRQs) and BL Lacertae objects (BL Lacs), of which strong relativistic jets are well aligned with our light of sight (Blandford et al., 2019). Blazars, which are the dominant population in the extragalactic -ray sky, exhibit overwhelming and highly variable Doppler-boosted nonthermal jet emissions that cover a wide range of energy regimes from radio to very high-energy -rays (Madejski & Sikora, 2016). There are a growing number of cases in which spatial and temporal coincidences have been observed between flaring blazars and incoming neutrinos (e.g., Kadler et al., 2016; Garrappa et al., 2019; Franckowiak et al., 2020; Giommi et al., 2020; Liao et al., 2022; Sahakyan et al., 2023). However, such circumstances are still rather rare. Furthermore, from an observational perspective, the connections between electromagnetic emissions and neutrinos are rather intricate. Electromagnetic activities were not observed during neutrino flaring of TXS 0506+056 in 2014-2015 (IceCube Collaboration et al., 2018b). However, one of the brightest -ray blazars, PKS 1502 + 106, lies within the localization uncertainty region of the neutrino event IC-190730A (e.g., Rodrigues et al., 2021). It is in a quiescent state from optical emission to rays, but with high flux-level radio emission, when the neutrino arrives (Kun et al., 2021).
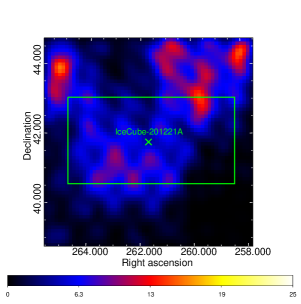
On 2020 December 21, a 0.174 PeV track-like neutrino event (IceCube-201221A, hereafter IC-201221A) with a 56.4% probability of being an astrophysical origin (i.e., Gold alert streams) with the arrival direction given as R.A. ∘ and decl. ∘ was reported (IceCube Collaboration, 2020). Subsequent electromagnetic observations were triggered, but no corresponding activities were reported (e.g., Garrappa et al., 2020; Fernandez & HAWC Collaboration, 2020). However, the fourth data release of the Fermi -ray source catalog (4FGL-DR4, Ballet et al. 2023) includes a listing for a -ray source, 4FGL J1718.5+4237, in this direction. However, no corresponding low-energy counterpart is provided. Given the absence of a known source in the 4FGL-DR3 catalog (Abdollahi et al., 2022), the detection of 4FGL J1718.5+4237 is likely attributed to its recent flaring activity, which suggests a possible temporal correlation with IC-201221A. In light of these observational findings, we thoroughly examine 4FGL J1718.5+4237 in this letter, including the search for its low-energy counterpart, and explore its potential association with the neutrino event IC-201221A. Analyses of multiwavelength data, including an optical spectroscopic observation by Hale 5 m telescope, along with results, are presented in Section 2; while discussions and a short summary are given in Section 3. We adopt a CDM cosmology with = 0.32, = 0.68, and a Hubble constant of = 67 km-1 s-1 Mpc-1 (Planck Collaboration et al., 2014).
2 Data Analysis and Results
2.1 Fermi-LAT Data
We analyzed the first 14.4-yr (i.e., from 2008 August 04 to 2023 January 01) Fermi-LAT Pass 8 data (evclass = 128 and evtype = 3) between energy 100 MeV and 500 GeV. We used Fermitools software version 2.0.8 and the accompanying Fermitools-data version 0.18. A region of interest (ROI), centered on 4FGL J1718.5+4237, with a 10-degree radius was considered. In order to avoid significant contamination from earth limb, a zenith angle cut ( 90∘) was adopted, so as the quality-filter cuts (i.e., DATA_QUAL==1 && LAT_CONFIG==1). Unbinned likelihood analysis was carried out using gtlike task to extract the flux and spectrum of rays. The significance of detecting a -ray source was determined by the test statistic (TS = -2ln(/), Mattox et al. 1996). and denote the maximum likelihood value for the model with and without the target source, respectively. The parameters of the background sources within the ROI as well as normalizations of the two diffuse templates (i. e., gll_iem_v07 and iso_P8R3_SOURCE_V3_v01) were left free, while other parameters are fixed to values listed in 4FGL-DR4. We examined whether there are new -ray sources (i.e., TS 25) by analyzing subsequently generated residual TS maps. If so, we then reran the likelihood fitting process with the updated background model.In the process of temporal analysis, low-intensity background sources (TS 10) were excluded from the model file. Additionally, the pyLikelihood UpperLimits tool was employed to compute a 95% confidence level upper limit instead of a flux in cases where the detection is uncertain.
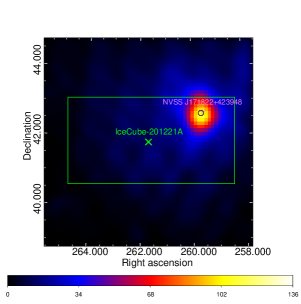
First, a complete analysis of the entire dataset was performed, from which detection of a significant -ray source (TS = 60) in this direction was confirmed. The average flux of rays is given as (4.05 ± 1.07) 10-9 ph cm-2 s-1, along with a relatively soft spectrum ( = 2.57 0.19, where is the index of the power law function, ). The optimized location was constrained as R.A. , decl. , with a 95% C.L. error radius of . These results are consistent with those listed in 4FGL-DR4. Within the radius of localization error, two radio sources, NVSS J171822+423948 (hereafter Cand. I) and NVSS J171853+423658 (hereafter Cand. II), are found. Therefore, the association relationship cannot be determined by spatial information alone. Therefore, investigations of two candidates were carried out. The former is identified as a flat spectral radio source (Myers et al., 2003), while for the latter, data only from the NRAO VLA sky survey is accessible (Condon et al., 1998). Sloan Digital Sky Survey (SDSS) reveals a possible dropout in the band for cand. I (Ahumada et al., 2020), suggesting that it may be a high redshift quasar. Based on the SDSS band magnitude and radio flux density at 5 GHz, radio-loudness of cand. I is given as high as 1500 (Kellermann et al., 1989), indicative of a blazar candidate.
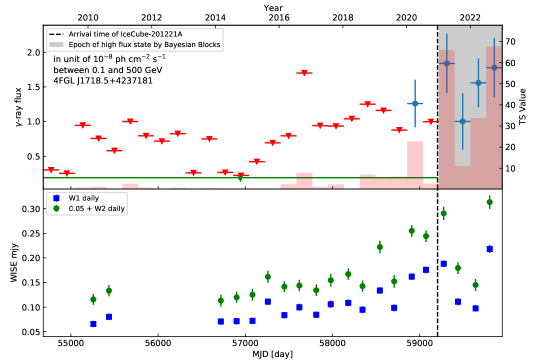
A half-year time-bin -ray light curve was extracted to investigate its temporal behavior, shown in Figure 1. A distinct feature of the light curve is the significant flux variation on a long timescale. Adopting “variability index” test (Nolan et al., 2012), the significance of the variability is given as . Considering the relatively limited angular resolution of Fermi-LAT for sub-GeV photons, light curves from nearby background sources were also extracted. Since no similar variations were found to those of the target, therefore, the variation of the target is suggested to be intrinsic rather than artificially caused by the neighbors. Furthermore, the Bayesian Block analysis (Scargle et al., 2013) marks a two-year epoch (i.e., last four time bins) in a high-flux state between MJD 59219 and 59945. A specific analysis yields a significant -ray source (TS = 136). The corresponding photon flux is (1.4 0.24) 10-8 ph cm-2 s-1, with a slightly harder spectrum ( = 2.43 0.11) than the value derived from the analysis of the entire dataset. By utilizing the Fermi gtsrcprob tool, it was determined that the maximum energy observed is approximately 10 GeV, while the majority of high-energy photons possess an energy of around 2 GeV. Sophisticated spectral templates were tried, but no significant spectral curvature was found. The localization analysis provides an optimized position of and , with a 95% C.L. error radius of approximately . Both candidates fall within the error radius. This source had been maintained in a low-flux state for the 12 years since the beginning of Fermi-LAT observation. Combining the low-state data produces only a tentative detection (TS = 15) of a flux (1.89 0.58) 10-9 ph cm-2 s-1, which is approximately seven times lower than the value of 2-year epoch.
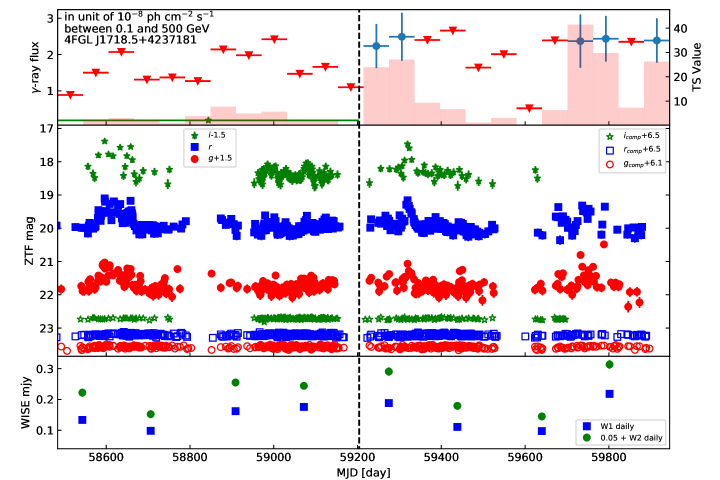
We extracted a zoomed-in 2-month time-bin light curve, focusing on the epoch of the high-flux state (see Figure 2). The -ray activity consists of two sub-flares, separated by a one-year long quiescent state. The first lasted about four months (TS = 54), between MJD 59214 and 59336. The duration of the other is also several months (TS = 113). Individual analyses of data for these two subflares reveal a similar flux level, 2 10-8 ph cm-2 s-1, approximately one order of magnitude of the flux level extracted from the first 12-year Fermi-LAT data. The two subflares also share a similar spectrum, 2.3. In addition, localization analyses provide similar results so that the two radio sources fall into the -ray radii. Weekly time-bin -ray light curves were further extracted; no signs of short-timescale variability are found.
2.2 Optical Data
2.2.1 Hale P200 spectroscopic observation
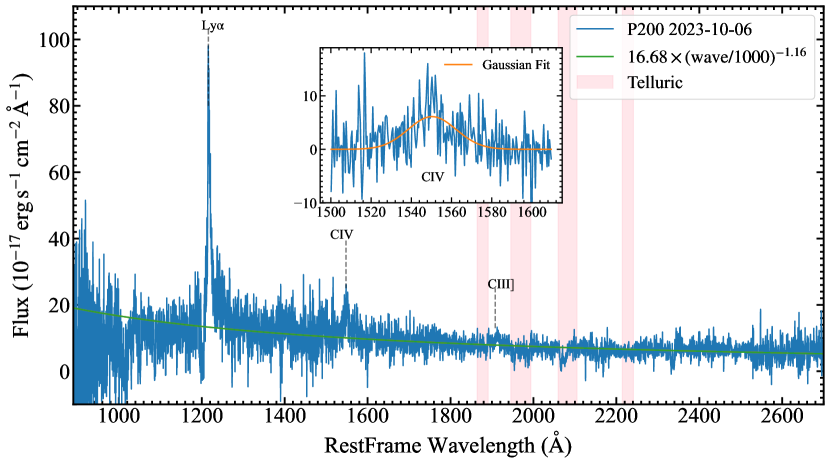
Spectroscopic observation of Cand. I was performed at MJD 60223, using the double spectrograph, with dichroic D55, mounted on the Hale 200-inch telescope at Palomar Observatory (P200, Oke & Gunn 1982). The total exposure time for the observation was 2400 s. To match the seeing conditions, we chose a slit width of 1.5. Data were reduced with Pypeit (Prochaska et al. 2020). We conducted flux calibration using a standard star on the same night. Galactic extinctions were corrected (Schlafly & Finkbeiner, 2011). A simple power-law model was used to fit the continuum component after excluding the wavelength windows of the emission lines, the telluric region, and the blueward region of the peak of .
The spectrum shows strong , moderately weak , and faint emission lines, which give a redshift of 2.68 0.01. emission line is fitted with a single Gaussian. Its FWHM are constrained to be km , of which the uncertainty is derived by Monte-Carlo simulations. Based on the estimated and the bolometeric correction factor (Shen et al., 2011), the bolometeric luminosity reaches erg . However, it could be overestimated due to the jet contribution. Then the mass of the SMBH can be inferred as (Vestergaard & Peterson, 2006). Therefore, the Eddington ratio 0.3 is suggested.
2.2.2 Zwicky Transient Facility Light-curve Data
We collected the latest Zwicky Transient Facility (ZTF) data (Masci et al., 2019; PTF Team, 2020)111https://www.ztf.caltech.edu/ztf-public-releases.html. Based on coadded reference images in the , , and bands, magnitudes within 5″ of Cand. I were extracted to construct optical light curves, shown in Figure 2. Only frames satisfied with catflag = 0 and chi < 4 were selected. Optical activities in multi-epoch, for instance, around MJD 58600, 59300 and 59700, are exhibited. The variability amplitudes in all three bands are approximately one magnitude. For Cand. II, no significant excesses against the background emission were found from the reference images in all three bands.
2.3 WISE data
Firstly, we investigated the infrared counterparts of the two candidates. An infrared source, WISE J171822.76+423945.1, is clearly detected at the position of Cand. I, while no sources were found within 10″ of the radio position of Cand. II according to the AllWISE Source Catalog (Wright et al., 2010; WISE Team, 2019). The W1 (m) and W2 (m) magnitudes given by the catalog are 16.587 0.059 and 16.152 0.123, respectively. We first attempted to construct the long-term light curves after excluding bad exposures and binning the data within each epoch (within one day) following Jiang et al. (2021b). Although with larger errors (typically 0.2 mag), there are two obvious flux maxima at MJD 59274 (i.e. W1 = 15.412 0.294 mag and W2 = 14.439 0.317 mag) and MJD 59804 (i.e. W1 = 15.297 0.166 mag and W2 = 14.411 0.26 mag). In order to confirm this and obtain more accurate measurements, we also attempted to perform PSF photometry on the difference images of time-resolved WISE/NEOWISE coadds (Meisner et al., 2018) with the first epoch as the reference following Jiang et al. (2021a). Finally, we adopted the fluxes measured from image subtraction with the reference flux added (see Figure 1).
2.4 Implications of multi-messenger observations
Blazars are well known for significant broadband variability, on timescales from minutes to years (Wagner & Witzel, 1995; Ulrich et al., 1997). A remarkable observational feature of FSRQs is the highly correlated optical/infrared and -ray emissions (e.g., Abdo et al., 2010). Since the angular resolution of Fermi-LAT (typically 0.1∘) is limited compared to those of the optical and radio bands ( 3″), the observed correlated emissions are essential to determine the association relationship between -ray source and its low-energy counterpart. For the two radio candidates falling into the localization uncertainty area of 4FGL J1718.5+4237, optical and infrared temporal behaviors have been investigated here. Significant flux variations of Cand. I have been detected, while no such evidence is found for the other one. Similarity of long term -ray and infrared variations, see Figure 1, reinforces that a tight connection between Candi. I and 4FGL J1718.5+4237. Furthermore, as shown in Figure 2, corresponding to a -ray activity around MJD 59300, distinct optical flares in all three independent bands are presented. Meanwhile, its infrared emission is at high flux state. Similar behaviors are found for another -ray activity MJD 59800, though there is no available -band observations then. Based on these observed features, in conclusion, Cand. I (i.e., NVSS J171822+423948) is suggested as the low-energy counterpart of 4FGL J1718.5+4237. In the latest incremental version of the fourth catalog of AGNs detected by Fermi-LAT (Ajello et al., 2022), only 29 known -ray emitting blazars beyond the redshift of 2.6 are embraced, among more than three thousand sources. Our optical spectroscopic observation reveals the redshift of Cand. I as = 2.68 0.01, and hence it is noticed as one of the rare high redshift -ray emitting blazars, which are crucial for studying relativistic jets and mass growth of the central SMBHs at the early epoch of the evolution of the universe (e.g., Volonteri, 2010; Ackermann et al., 2017; Liao et al., 2018).
The contemporaneous brightening of Cand. I suggests that its optical and -ray emission is likely from the same radiation region. Although no sign of fast variability in -ray is found, optical flares peaking at MJD 59319 put a constraint on the radiation region. For instance, the -band flux increases 1.1 mag within 10 days, giving a doubling time in the source frame, day. A similar value is obtained from the flux variations in the band, but the timescale in -band is relatively longer. Hence, adopting a routine Doppler factor () value of 10 (Liodakis et al., 2017), radius of the radiation region is limited to 0.02 pc. Assuming a conical jet geometry, the location of the radiation region is constrained to 0.2 pc, where is the bulk Lorentz factor. Meanwhile, the radius of the broad line region (BLR) is also suggested as 0.2 pc based on the detected (Grier et al., 2019). Therefore, the radiation region is likely embedded within the radiation of BLR. Note that the observational cadence of ZTF is several days, so potential intraday optical variability could be missed. In fact, fast -ray variability for blazars of 3 with a timescale down to a few hours has been reported (Li et al., 2018). Meanwhile, intraday infrared variability has also been found in one of these sources (Liao et al., 2019). All of these pieces of evidence indicate the presence of a compact dissipation region.
Benefiting from multi-messenger observations, connection of the flaring blazar and the neutrino event is investigated. Firstly, Cand. I is the only known -ray source spatially coincident with IC-201221A. However, due to its relatively large localization uncertainty, relying solely on spatial coincidence is not sufficient to claim a physical connection. Monte-Carlo simulations have been performed to calculate a probability of chance. The central location of IC-201221A is randomized in the sky beyond the Galactic plane with a varying right ascension value. Since the sensitivity of IceCube is strongly dependent on sky declination, the declination value of the neutrino is frozen during the simulation. Meanwhile, the size of the angular uncertainty box is also fixed. After simulations, the chance probability is derived as 1, where N is the simulation time, M is number of 4FGL-DR4 sources (Ballet et al., 2023) that fall into the simulated uncertainty box. Obviously, additional temporal information is needed. As shown in Figure 1, incoming of the neutrino seems to switch on -ray emission of the blazar. It maintains to be in a quiescent state lasting for over 12-yr beneath the detection limit of Fermi-LAT. However, it becomes detectable soon after the arrival of IC-201221A, roughly several tens of days. Variability amplitude between different flux levels is one order of magnitude. Since yearly time bin -ray light curve for each 4FGL-DR4 source is available222https://fermi.gsfc.nasa.gov/ssc/data/access/lat/14yr_catalog/4FGL-DR4_LcPlots_v32.tgz, the simulations are re-performed including temporal information. At this time, only sources exhibiting a clear flux increase (i.e., three times of the 14-yr averaged flux) in the 13th time bin are considered. The probability of chance reduces to 0.03. A similar case in which the emergence of a cospatial transient -ray source coincides temporally with the detection of neutrinos is reported for GB6 J2113+1121/IC-191001A (Liao et al., 2022). Apart from a long period in quiet state (i.e., over 8-yr), -ray flux enhancement about five-fold of TXS 0506+056 in long term are found, corresponding to incoming of IC-170922A (IceCube Collaboration et al., 2018a). Furthermore, in a multiwavelength perspective, strong optical flares with peaking time 115 days later of arrival time of the neutrino (i.e., MJD 59204) are detected, although prior optical activities are exhibited, see Figure 2. In addition, accompanying infrared flux increases at MJD 59274 are also presented. Conclusively, Cand. I is suggested as a promising neutrino emitter.
3 Discussions and Summary
It is interesting to put some general theoretical constraints on neutrino production of Cand. I based on the multimessenger data presented in the last section. The number of muon (antimuon) neutrinos detected by IceCube during a time interval at a declination is given as,
| (1) |
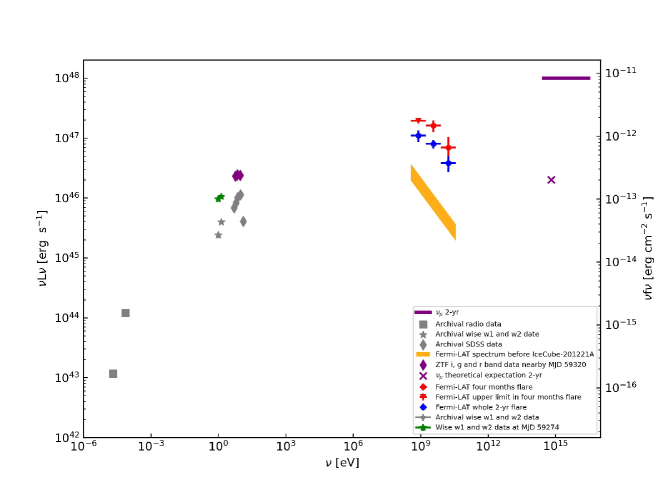
where = 80 TeV and = 8 PeV represent the limits of the energy range that one expects 90 of neutrinos in the GFU channel (Oikonomou et al., 2021), while denotes the differential flux of muon neutrinos. For IC-201221A, the EHE+GFU_Gold effective area of IceCube is approximately 10 m2 (Blaufuss et al., 2019). Neutrinos are assumed to follow a power-law spectrum ( with = 2). Meanwhile, is set as 2-year, corresponding to the duration of high -ray flux state obtained by the Bayesian Blocks approach. Under these circumstances, the neutrino energy flux is derived as 2 10-11 erg cm-2 s-1. Taking into account the high redshift of the blazar, the corresponding apparent muon neutrino luminosity is as high as 1048 erg s-1.
Photopion () processes are adopted as the responsible neutrino production mechanism, considering luminous accretion disk emission of the blazar. The energy of the detected neutrino, 0.6 PeV in the source frame, suggests that the energy of the emitting proton is 12 PeV. Following estimates in Murase et al. (2018), 0.6 PeV (0.1 keV/)(/10), energy of external target photons in the source frame is inferred, = 10 eV, where is the energy in the comoving frame. The UV emissions could be radiation from BLR. During the interaction, protons lose 3/8 of their energy to neutrinos, resulting in an all-flavor neutrino luminosity given by , where the optical depth to processes () is used to describe the efficiency of neutrino production. The remaining 5/8ths of the proton energy lost contributes to the production of electrons and pionic -rays. Subsequent electromagnetic cascades start and synchrotron cooling is dominated because of Klein–Nishina suppression in inverse Compton processes. The connection between neutrino radiations and the cascade is given as (Murase et al., 2018),
| (2) |
Here, represents the Compton-Y parameter (typically ). Optimistically, the cascade emission is capable of contributing significantly in the -ray domain. The corresponding energy is deduced in Murase et al. (2018). If = 4 Gauss and = 10 are set, meanwhile, UV emissions are adopted as target photons ( 0.1 keV), 2 GeV( Gauss)(/12 PeV)2(10/). Such a energy corresponds to the observed value that majority of the high energy -ray photons possess. Therefore, the observed -ray spectrum in the 2-yr high flux state, shown in Figure 4, is utilized to constrain the theoretical expectation of neutrinos. Since the former is provided as 5 1046 erg s-1, a muon (anti-muon) neutrino luminosity of 2 1046 erg s-1 is anticipated. Compared to the luminosity of apparent muon neutrinos inferred by the detection of IC-201221A, Poisson probability of detecting such a neutrino is 0.02. An upward fluctuation () is needed if the neutrino is radiated from the blazar, which is consistent with the value found from TXS 0506+056/IC-170922A (e.g., Gao et al., 2019; Cerruti et al., 2019; Petropoulou et al., 2020).
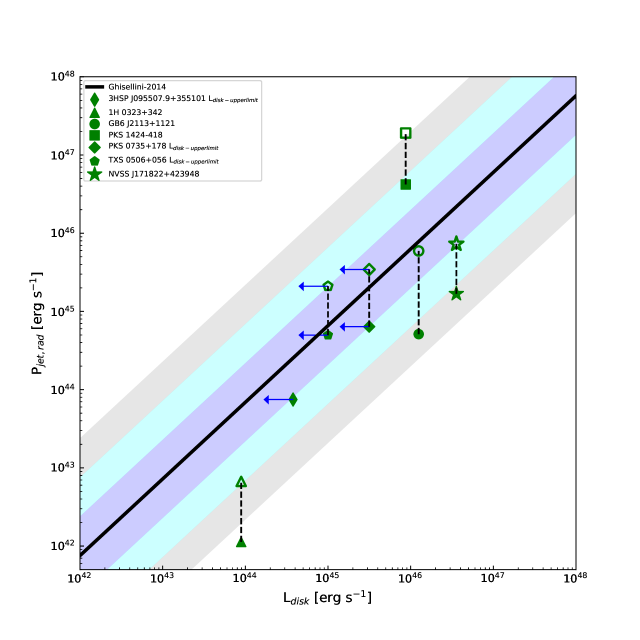
In addition to TXS 0506 + 056, an intermediate synchrotron peak BL Lac (ISP, Padovani & Giommi 1995; Abdo et al. 2010), a few other BL Lacs are reported as neutrino-emitting blazar candidates, including GB6 J1040+0617 (LSP, Garrappa et al. 2019), MG3 J225517 + 2409, and PKS 0735 + 178 (ISP, Franckowiak et al. 2020; Sahakyan et al. 2023), as well as 3HSP J095507.9+355101 (HSP, Giommi et al. 2020). Note that an accompanying X-ray flare of 3HSP J095507.9+355101, not in rays, is detected responsible for the arrival of a neutrino (Giommi et al., 2020). FSRQs are also proposed as potential neutrino emitters, such as PKS B1424-418 and GB6 J2113+1121 (Kadler et al., 2016; Liao et al., 2022). Interestingly, a minor -ray flare of 1H 0323+342, a HSP radio-loud narrow line Seyfert galaxy, is detected temporally coincident with a cospatial neutrino (Franckowiak et al., 2020). Because of the strong optical emission lines, Cand. I is classified as an FSRQ. Meanwhile, shape of its broadband spectral energy distribution (SED) suggests that it is an LSP, see Figure 4. Accretions of the central SMBHs of FSRQs and RLNLS1s are efficient, leading to intense radiation fields external to the jet. If such photons act as target photons in photo-pion processes, rather than self radiation from the jet alone, production of neutrinos is significantly enhanced. On the other hand, dense soft photons also likely play an important role in absorption processes, and hence severe absorption creates a soft -ray spectrum and weakens the observational connection between -ray emissions and neutrinos (Kun et al., 2021). For LSP/ISP BL Lacs, modest emissions from the accretion system are anticipated, and serious dilution from the jet emission is an obstacle to detect potential broad line emissions (e.g., Padovani et al., 2019). In addition to the accretion efficiency, FSRQs and BL Lacs exhibit different behaviors in the perspective of cosmic evolution. HSP BL Lacs show strong negative evolution, with number density increasing for z 0.5, while LSP/ISP BL Lacs and FSRQs show positive evolution, but peaking redshift in space density of the former ( 1.2) is lower than the latter ( 2) (Ajello et al., 2012, 2014). High redshift blazars ( 3), mostly FSRQs, represent an extremely luminous population, not only in jet power, but also in radiation of the accretion disk (Ghisellini et al., 2010, 2014). Since PKS B1424-418 ( = 1.52) is recognized as the candidate for the most distant neutrino-emitting blazar, our study reveals the first case beyond of 2. As shown in Figure 5, candidates are plotted in a vs. diagram. It is not surprising that the three FSRQs with redshifts above 1 lie at upper right corner of the diagram. Especially, Cand. I exhibits the most luminous disk emission among the candidates, 4 erg . Powerful jets that efficiently accelerate relativistic particles, together with intense photon fields from the accretion system, make it reasonable to detect a neutrino event from such a distant source. Maybe more detections of incoming neutrinos from high redshift ( 3) flaring blazars will be revealed by IceCube in the near future.
In summary, a thorough investigation of 4FGL J1718.5+4237 has been performed, which is the only known -ray source within the angular uncertainty region of IC-201221A. Firstly, the low-energy counterpart of the -ray source is determined. Although two radio sources fall into its localization radius, contemporaneous brightening of Cand. I (i.e., NVSS J171822+423948) between -ray and optical/infrared emissions are detected. Meanwhile, no optical and infrared sources are found towards the other radio source. Therefore, Cand. I is suggested to be associated with 4FGL J1718.5+4237. Moreover, optical spectroscopic observation reveals a distinct Ly emission line, and hence Cand. I is identified as a rare high redshift ( = 2.68 0.01) -ray emitting blazar. The multiwavelength temporal information is also important to establish a potential physical connection between the neutrino and the blazar. It maintains in a quiescent state over 12-yr undetected by Fermi-LAT, but soon (i.e., a few tens of days) after arrival of the neutrino, a 10-fold -ray flux increase emerges. 115-day later of arrival time of the neutrino, strong optical flares in ZTF , and bands are exhibited, meanwhile, infrared fluxes are at high level then. Monte-Carlo simulations, with both spatial and temporal information embraced, give a by chance probability of 0.03, suggesting that the blazar is a promising neutrino emitter and the first candidate above redshift of 2. Theoretical constraints of neutrino production and comparisons with other candidates have been discussed. Future multiwavelength campaigns, especially X-ray observations in which contributions of cascades of Bethe-Heitler pairs may be non-negligible, together with detailed theoretical SED modeling, would further investigate its jet properties and connection to the neutrino.
References
- Aartsen et al. (2015) Aartsen, M. G., Abraham, K., Ackermann, M., et al. 2015, Phys. Rev. Lett., 115, 081102, doi: 10.1103/PhysRevLett.115.081102
- Aartsen et al. (2018) Aartsen, M. G., Ackermann, M., Adams, J., et al. 2018, Advances in Space Research, 62, 2902, doi: 10.1016/j.asr.2017.05.030
- Abdo et al. (2010) Abdo, A. A., et al. 2010, Nature, 463, 919, doi: 10.1038/nature08841
- Abdo et al. (2010) Abdo, A. A., Ackermann, M., Agudo, I., et al. 2010, ApJ, 716, 30, doi: 10.1088/0004-637X/716/1/30
- Abdollahi et al. (2022) Abdollahi, S., Acero, F., Baldini, L., et al. 2022, ApJS, 260, 53, doi: 10.3847/1538-4365/ac6751
- Acharyya et al. (2023) Acharyya, A., Adams, C. B., Archer, A., et al. 2023, ApJ, 954, 70, doi: 10.3847/1538-4357/ace327
- Ackermann et al. (2017) Ackermann, M., Ajello, M., Baldini, L., et al. 2017, ApJ, 837, L5, doi: 10.3847/2041-8213/aa5fff
- Ahumada et al. (2020) Ahumada, R., Prieto, C. A., Almeida, A., et al. 2020, ApJS, 249, 3, doi: 10.3847/1538-4365/ab929e
- Ajello et al. (2012) Ajello, M., et al. 2012, Astrophys. J., 751, 108, doi: 10.1088/0004-637X/751/2/108
- Ajello et al. (2014) Ajello, M., Romani, R. W., Gasparrini, D., et al. 2014, ApJ, 780, 73, doi: 10.1088/0004-637X/780/1/73
- Ajello et al. (2022) Ajello, M., Baldini, L., Ballet, J., et al. 2022, ApJS, 263, 24, doi: 10.3847/1538-4365/ac9523
- Ballet et al. (2023) Ballet, J., Bruel, P., Burnett, T. H., Lott, B., & The Fermi-LAT collaboration. 2023, arXiv e-prints, arXiv:2307.12546, doi: 10.48550/arXiv.2307.12546
- Becker Tjus et al. (2014) Becker Tjus, J., Eichmann, B., Halzen, F., Kheirandish, A., & Saba, S. M. 2014, Phys. Rev. D, 89, 123005, doi: 10.1103/PhysRevD.89.123005
- Blandford et al. (2019) Blandford, R., Meier, D., & Readhead, A. 2019, ARA&A, 57, 467, doi: 10.1146/annurev-astro-081817-051948
- Blaufuss et al. (2019) Blaufuss, E., Kintscher, T., Lu, L., & Tung, C. F. 2019, in International Cosmic Ray Conference, Vol. 36, 36th International Cosmic Ray Conference (ICRC2019), 1021, doi: 10.22323/1.358.01021
- Böttcher et al. (2013) Böttcher, M., Reimer, A., Sweeney, K., & Prakash, A. 2013, ApJ, 768, 54, doi: 10.1088/0004-637X/768/1/54
- Cerruti et al. (2019) Cerruti, M., Zech, A., Boisson, C., et al. 2019, MNRAS, 483, L12, doi: 10.1093/mnrasl/sly210
- Condon et al. (1998) Condon, J. J., Cotton, W. D., Greisen, E. W., et al. 1998, AJ, 115, 1693, doi: 10.1086/300337
- Fernandez & HAWC Collaboration (2020) Fernandez, M., & HAWC Collaboration. 2020, GRB Coordinates Network, 29151, 1
- Franckowiak et al. (2020) Franckowiak, A., Garrappa, S., Paliya, V., et al. 2020, ApJ, 893, 162, doi: 10.3847/1538-4357/ab8307
- Gao et al. (2019) Gao, S., Fedynitch, A., Winter, W., & Pohl, M. 2019, Nature Astronomy, 3, 88, doi: 10.1038/s41550-018-0610-1
- Garrappa et al. (2020) Garrappa, S., Buson, S., & Fermi-LAT Collaboration. 2020, GRB Coordinates Network, 29135, 1
- Garrappa et al. (2021) Garrappa, S., Buson, S., Sinapius, J., Kadler, M., & Fermi-LAT Collaboration. 2021, GRB Coordinates Network, 31194, 1
- Garrappa et al. (2019) Garrappa, S., Buson, S., Franckowiak, A., et al. 2019, ApJ, 880, 103, doi: 10.3847/1538-4357/ab2ada
- Ghisellini et al. (2014) Ghisellini, G., Tavecchio, F., Maraschi, L., Celotti, A., & Sbarrato, T. 2014, Nature, 515, 376, doi: 10.1038/nature13856
- Ghisellini et al. (2010) Ghisellini, G., Della Ceca, R., Volonteri, M., et al. 2010, MNRAS, 405, 387, doi: 10.1111/j.1365-2966.2010.16449.x
- Giommi et al. (2020) Giommi, P., Padovani, P., Oikonomou, F., et al. 2020, A&A, 640, L4, doi: 10.1051/0004-6361/202038423
- Grier et al. (2019) Grier, C. J., Shen, Y., Horne, K., et al. 2019, ApJ, 887, 38, doi: 10.3847/1538-4357/ab4ea5
- Halzen & Kheirandish (2022) Halzen, F., & Kheirandish, A. 2022, arXiv e-prints, arXiv:2202.00694, doi: 10.48550/arXiv.2202.00694
- IceCube Collaboration (2013) IceCube Collaboration. 2013, Science, 342, 1242856, doi: 10.1126/science.1242856
- IceCube Collaboration (2020) —. 2020, GRB Coordinates Network, 29102, 1
- IceCube Collaboration et al. (2018a) IceCube Collaboration, Aartsen, M. G., Ackermann, M., et al. 2018a, Science, 361, eaat1378, doi: 10.1126/science.aat1378
- IceCube Collaboration et al. (2018b) —. 2018b, Science, 361, 147, doi: 10.1126/science.aat2890
- IceCube Collaboration et al. (2022) IceCube Collaboration, Abbasi, R., Ackermann, M., et al. 2022, Science, 378, 538, doi: 10.1126/science.abg3395
- Icecube Collaboration et al. (2023) Icecube Collaboration, Abbasi, R., Ackermann, M., et al. 2023, Science, 380, 1338, doi: 10.1126/science.adc9818
- Jiang et al. (2021a) Jiang, N., Wang, T., Hu, X., et al. 2021a, ApJ, 911, 31, doi: 10.3847/1538-4357/abe772
- Jiang et al. (2023) Jiang, N., Zhou, Z., Zhu, J., Wang, Y., & Wang, T. 2023, ApJ, 953, L12, doi: 10.3847/2041-8213/acebe3
- Jiang et al. (2021b) Jiang, N., Wang, T., Dou, L., et al. 2021b, ApJS, 252, 32, doi: 10.3847/1538-4365/abd1dc
- Kadler et al. (2016) Kadler, M., Krauß, F., Mannheim, K., et al. 2016, Nature Physics, 12, 807, doi: 10.1038/nphys3715
- Kellermann et al. (1989) Kellermann, K. I., Sramek, R., Schmidt, M., Shaffer, D. B., & Green, R. 1989, AJ, 98, 1195, doi: 10.1086/115207
- Kun et al. (2021) Kun, E., Bartos, I., Tjus, J. B., et al. 2021, ApJ, 911, L18, doi: 10.3847/2041-8213/abf1ec
- Li et al. (2018) Li, S., Xia, Z.-Q., Liang, Y.-F., Liao, N.-H., & Fan, Y.-Z. 2018, ApJ, 853, 159, doi: 10.3847/1538-4357/aaa3fb
- Liao et al. (2019) Liao, N.-H., Dou, L.-M., Jiang, N., et al. 2019, ApJ, 879, L9, doi: 10.3847/2041-8213/ab2893
- Liao et al. (2018) Liao, N.-H., Li, S., & Fan, Y.-Z. 2018, ApJ, 865, L17, doi: 10.3847/2041-8213/aae20d
- Liao et al. (2022) Liao, N.-H., Sheng, Z.-F., Jiang, N., et al. 2022, ApJ, 932, L25, doi: 10.3847/2041-8213/ac756f
- Liodakis et al. (2017) Liodakis, I., Marchili, N., Angelakis, E., et al. 2017, MNRAS, 466, 4625, doi: 10.1093/mnras/stx002
- Loeb & Waxman (2006) Loeb, A., & Waxman, E. 2006, J. Cosmology Astropart. Phys, 2006, 003, doi: 10.1088/1475-7516/2006/05/003
- Madejski & Sikora (2016) Madejski, G. G., & Sikora, M. 2016, ARA&A, 54, 725, doi: 10.1146/annurev-astro-081913-040044
- Masci et al. (2019) Masci, F. J., Laher, R. R., Rusholme, B., et al. 2019, PASP, 131, 018003, doi: 10.1088/1538-3873/aae8ac
- Mattox et al. (1996) Mattox, J. R., Bertsch, D. L., Chiang, J., et al. 1996, ApJ, 461, 396, doi: 10.1086/177068
- Meisner et al. (2018) Meisner, A. M., Lang, D., & Schlegel, D. J. 2018, AJ, 156, 69, doi: 10.3847/1538-3881/aacbcd
- Murase et al. (2008) Murase, K., Inoue, S., & Nagataki, S. 2008, ApJ, 689, L105, doi: 10.1086/595882
- Murase et al. (2018) Murase, K., Oikonomou, F., & Petropoulou, M. 2018, ApJ, 865, 124, doi: 10.3847/1538-4357/aada00
- Myers et al. (2003) Myers, S. T., Jackson, N. J., Browne, I. W. A., et al. 2003, MNRAS, 341, 1, doi: 10.1046/j.1365-8711.2003.06256.x
- Nolan et al. (2012) Nolan, P. L., Abdo, A. A., Ackermann, M., et al. 2012, ApJS, 199, 31, doi: 10.1088/0067-0049/199/2/31
- Oikonomou et al. (2021) Oikonomou, F., Petropoulou, M., Murase, K., et al. 2021, J. Cosmology Astropart. Phys, 2021, 082, doi: 10.1088/1475-7516/2021/10/082
- Oke & Gunn (1982) Oke, J. B., & Gunn, J. E. 1982, PASP, 94, 586, doi: 10.1086/131027
- Padovani & Giommi (1995) Padovani, P., & Giommi, P. 1995, ApJ, 444, 567, doi: 10.1086/175631
- Padovani et al. (2019) Padovani, P., Oikonomou, F., Petropoulou, M., Giommi, P., & Resconi, E. 2019, MNRAS, 484, L104, doi: 10.1093/mnrasl/slz011
- Paiano et al. (2018) Paiano, S., Falomo, R., Treves, A., & Scarpa, R. 2018, ApJ, 854, L32, doi: 10.3847/2041-8213/aaad5e
- Paliya et al. (2021) Paliya, V. S., Domínguez, A., Ajello, M., Olmo-García, A., & Hartmann, D. 2021, ApJS, 253, 46, doi: 10.3847/1538-4365/abe135
- Petropoulou et al. (2020) Petropoulou, M., Murase, K., Santander, M., et al. 2020, ApJ, 891, 115, doi: 10.3847/1538-4357/ab76d0
- Planck Collaboration et al. (2014) Planck Collaboration, Ade, P. A. R., Aghanim, N., et al. 2014, A&A, 571, A16, doi: 10.1051/0004-6361/201321591
- Prince et al. (2023) Prince, R., Das, S., Gupta, N., Majumdar, P., & Czerny, B. 2023, arXiv e-prints, arXiv:2301.06565, doi: 10.48550/arXiv.2301.06565
- Prochaska et al. (2020) Prochaska, J., Hennawi, J., Westfall, K., et al. 2020, The Journal of Open Source Software, 5, 2308, doi: 10.21105/joss.02308
- PTF Team (2020) PTF Team. 2020, Palomar Transient Factory Level 1, IPAC, doi: 10.26131/IRSA155
- Reusch et al. (2022) Reusch, S., Stein, R., Kowalski, M., et al. 2022, Phys. Rev. Lett., 128, 221101, doi: 10.1103/PhysRevLett.128.221101
- Rodrigues et al. (2021) Rodrigues, X., Garrappa, S., Gao, S., et al. 2021, ApJ, 912, 54, doi: 10.3847/1538-4357/abe87b
- Sahakyan et al. (2023) Sahakyan, N., Giommi, P., Padovani, P., et al. 2023, MNRAS, 519, 1396, doi: 10.1093/mnras/stac3607
- Scargle et al. (2013) Scargle, J. D., Norris, J. P., Jackson, B., & Chiang, J. 2013, ApJ, 764, 167, doi: 10.1088/0004-637X/764/2/167
- Schlafly & Finkbeiner (2011) Schlafly, E. F., & Finkbeiner, D. P. 2011, ApJ, 737, 103, doi: 10.1088/0004-637X/737/2/103
- Shen et al. (2011) Shen, Y., Richards, G. T., Strauss, M. A., et al. 2011, ApJS, 194, 45, doi: 10.1088/0067-0049/194/2/45
- Stein et al. (2021) Stein, R., van Velzen, S., Kowalski, M., et al. 2021, Nature Astronomy, 5, 510, doi: 10.1038/s41550-020-01295-8
- Ulrich et al. (1997) Ulrich, M.-H., Maraschi, L., & Urry, C. M. 1997, ARA&A, 35, 445, doi: 10.1146/annurev.astro.35.1.445
- Vestergaard & Peterson (2006) Vestergaard, M., & Peterson, B. M. 2006, ApJ, 641, 689, doi: 10.1086/500572
- Volonteri (2010) Volonteri, M. 2010, A&A Rev., 18, 279, doi: 10.1007/s00159-010-0029-x
- Wagner & Witzel (1995) Wagner, S. J., & Witzel, A. 1995, ARA&A, 33, 163, doi: 10.1146/annurev.aa.33.090195.001115
- Waxman (1995) Waxman, E. 1995, Phys. Rev. Lett., 75, 386, doi: 10.1103/PhysRevLett.75.386
- WISE Team (2019) WISE Team. 2019, AllWISE Source Catalog, IPAC, doi: 10.26131/IRSA1
- Wright et al. (2010) Wright, E. L., Eisenhardt, P. R. M., Mainzer, A. K., et al. 2010, AJ, 140, 1868, doi: 10.1088/0004-6256/140/6/1868