Temporal Interaction and its Role in the Evolution of Cooperation
Abstract
This research investigates the impact of dynamic, time-varying interactions on cooperative behaviour in social dilemmas. Traditional research has focused on deterministic rules governing pairwise interactions, yet the impact of interaction frequency and synchronicity in groups on cooperation remains underexplored. Addressing this gap, our work introduces two temporal interaction mechanisms to model the stochastic or periodic participation of individuals in these games, acknowledging real-life variances due to exogenous temporal factors and geographical time differences. We consider that the interaction state significantly influences both game payoff calculations and the strategy updating process, offering new insights into the emergence and sustainability of cooperation. Our results indicate that maximum game participation frequency is suboptimal under a stochastic interaction mechanism. Instead, an intermediate activation probability maximizes cooperation, suggesting a vital balance between interaction frequency and inactivity security. Furthermore, local synchronization of interactions within specific areas is shown to be beneficial, as time differences hinder the spread of cross-structures but promote the formation of dense cooperative clusters with smoother boundaries. We also note that spatial regularity and larger group sizes increase cooperation. This research contributes to understanding the role of node-based temporality and probabilistic interactions in social dilemmas, offering insights into fostering cooperation.
Index Terms:
Temporal interactions, Time-varying network, Public goods game, Evolutionary game theory.I INTRODUCTION
Cooperation is a fundamental pro-social behaviour essential for the successful evolution of both biological ecosystems and human societies [1, 2, 3]. The imperative to understand its origins and persistence has become more pressing in the context of global challenges such as climate change [4] and pandemics [5]. Notwithstanding, cooperation typically requires individual sacrifices for collective gain. It presents a dilemma where selfish individuals may be tempted to defect and exploit the efforts of others, resulting in the tragedy of the commons scenario [6]. To illustrate the contrast between individual and collective optimal behaviours, the Public Goods Game (PGG) serves as a fundamental paradigm in cooperation research. Particularly in contexts where interactions occur in pairwise patterns, the PGG can be simplified into the more specific framework of the Prisoner’s Dilemma Game (PDG) [7].
In recent decades, the advancement of evolutionary game theory (EGT) has been bolstered by developments in network science, statistical physics, and other interconnected fields [8, 9, 10]. These contributions have furnished a robust mathematical framework essential for examining the emergence of cooperation in social dilemmas. Evolutionary games on graphs utilize nodes to represent individuals and links to denote interactions. With this approach, it has demonstrated that certain types of population structures, such as lattice [11], small-world [12], scale-free [13], are conducive to fostering cooperation. This phenomenon is identified as network reciprocity [14], a concept highlighting that individual interaction topologies are influenced by physical or social connections rather than occurring in a well-mixed population setting [15, 16]. Apart from the aforementioned network structure, heuristic strategies have also been instrumental in modifying individual interactions, such as migration [17, 18, 19], volunteering [20, 21, 22], and reputation-based partner choice [23, 24]. For example, the volunteer mechanism within the spatial PGG shows ’loners’ opting out, earning a steady and modest income. It is important to note that while their non-participation and external benefits affect game payoffs, these strategies do not impact the dynamics of learning individual strategies.
In much of the research concerning evolutionary games on networks, a common simplification posits that individuals engage in uninterrupted interaction, participating in repeated games. This implies that deterministic interactions among neighboring individuals are persistently active. However, real-world situations frequently diverge from this assumption. In practice, not all potential interaction relationships remain continuously operational. Instead, these interactions can be intermittent, displaying characteristics that fluctuate over time [25]. This observation highlights the discrepancy between the idealized models commonly used in theoretical research and the more complex, dynamic nature of real-world interactions. To bridge this gap, research has begun to incorporate the time dimension to examine how the dynamic nature of time-varying interactions affects the tendency of coupled systems to achieve coherency [26, 27]. One typical framework corresponds to the cases where the structural evolution of the graph alters the interaction in a way that switches it on and off over the course of time, such as the coevolutionary games [28, 29, 30] or temporal networks [31, 32]. In this case, the occurrence of individual interactions is fully dependent on the existence of links and acts on the strategy updating process.
The second category includes systems where the time-dependency of interactions is driven by external factors, such as environmental changes. Research in this area typically models scenarios where nodes interact randomly, even with established links among neighbours, and the probability of interaction is not uniform. The exploration of stochastic interactions within evolving games has been a crucial component of these studies [33, 34]. Individuals stochastically participate in PDGs with direct neighbours based on specified probabilities, where interaction frequency, governed by a certain distribution, only impacts game participation and not strategy updates. Nevertheless, a notable limitation of these studies is the frequent oversight of the physical features that adhere to specific spatial-temporal rules within the dynamics of interactions. This oversight is particularly evident when considering individuals with varying circadian rhythms or those situated in different geographical locations [35]. Such disparities can result in different periods of inactivity between game rounds and difficulties in synchronizing gameplay due to factors like jet lag. This highlights the necessity of comprehending how the frequency and synchrony of interactions influence the evolution of cooperation in spatial PGG.
Building upon volunteering and stochastic interaction concepts, our study introduces temporal interaction mechanisms to explore the effects of sporadic individual interactions on group cooperation. In this extended PGG framework, individuals can choose between cooperation or defection strategies and be either active or inactive. We have refined the allocation of public goods benefits, ensuring inactive individuals receive a basic allowance only in the presence of active cooperators. Additionally, we established two individual activity patterns by creating state variables for each individual. These variables follow random distributions across time and space, introducing a time lag that renders interactions periodic over time and varied across regions.
This work offers a two-fold contribution. Firstly, we find that high-frequency game interaction is not essential for the prevalence of cooperation; instead, there is an optimal interaction frequency range that maximizes cooperation levels. Cooperation necessitates individuals being synchronously active within a localized area. Time differences, while hindering the spread of cooperation, promote the formation of highly cooperative clusters. Secondly, distinguishing from studies with pairwise interactions on temporal networks, we present a deeper understanding of the spatial dynamics affecting the emergence of cluster in self-organizing populations through typical snapshots of temporal group interactions and the comparison on heterogeneous network structure. These insights could have significant implications for fostering cooperation in social and information networks.
This paper is structured as follows: Section II outlines the model under stochastic and periodic interaction mechanisms. Section III details our numerical simulation results. In Section IV, we formulate an extended pair-approximation model and provide theoretical analyzes. Finally, conclusions and discussions are drawn in Section V.
II MODEL
II-A Public Goods Game
We consider the spatial PPGs on a square lattice with periodic boundary conditions. Each individual is situated at a node and interacts within the von Neumann neighbourhood, where represents the group size, and indicates the node degree. Participants can adopt one of two strategies: cooperation (C), where cooperators contribute a quantity to the common pool or defection (D), where defectors contribute nothing, opting to free-ride on the public goods. For simplicity, we standardize the investment cost to one.
II-B Temporal Interaction
Considering scenarios where individuals frequently miss games due to various time-related factors, we introduce an exogenous time-dependent state variable to represent the interaction state of individual at time . Active individuals () choose to contribute to public goods and revise strategies based on their payoff differential with neighbours. In contrast, inactive individuals () neither participate in games nor change strategies, but they receive a small, fixed portion of the public resources. This is due to the non-excludability and positive externalities of public goods, preventing the exclusion of non-contributors from accessing them. In each PGG group, total benefits are generated exclusively from active cooperators’ contributions. After deducting the shares for inactive individuals, the residual amount is equally divided among all active members. Notably, different from the loners’ scenario [21], inactive individuals receive no benefits in the absence of active cooperators.
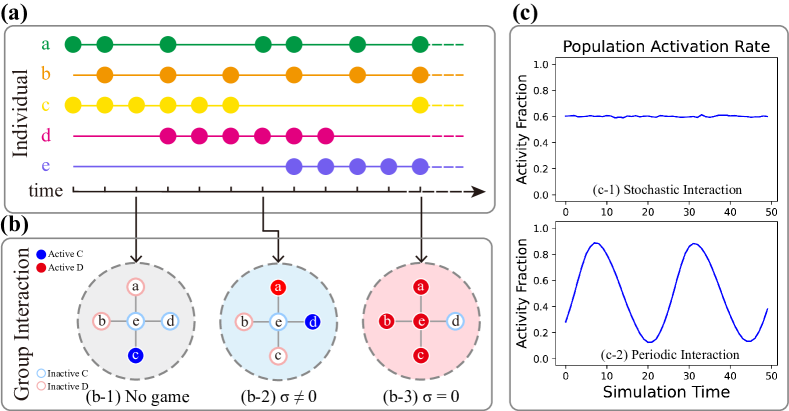
To investigate the impact of activity patterns on evolutionary dynamics, this study considers two representative distributions for activation interaction rules. These rules introduce a degree of heterogeneity and randomness into the evolutionary timeline. Fig. 1 illustrates these individual activity patterns. The population activation rate is defined as the ratio of the number of activated individuals at time to the total population size. As depicted in Fig. 1(a), stochastic interaction (individual and ) characterizes scenarios where human behaviour is random at any given time. We assign a probability for each individual to become active in group interactions, where . The number of activations in which an individual participates over the total simulation time follows a binomial distribution . A scenario of represents full interactions, reverting our model to the baseline spatial public goods game [11].
Periodic interaction, accounting for human circadian rhythms and location, alternates between engagement and rest periods as depicted in Fig. 1(a) and individuals . For each individual, the number of activations within the time follow a Poisson distribution with parameter , as . Here, is a unit like a day or week, and represents the average number of active participations per time interval. The probability for any value is for . Thus, the average activation probability , simplified to for further discussion. Additionally, a random variable is introduced to indicate the time lags effect on interaction states across different areas. A node close to the network centroid is arbitrarily selected as a reference point, with its time serving as the basis for simulation time. The mean value of corresponds to the Euclidean distance between an individual and this reference node:
| (1) |
where must be met to ensure the maximum time difference between the farthest individuals does not surpass the time interval. The local time for each agent is set to . All probability is assumed to be independently and identically distributed among different individuals.
II-C Evolutionary dynamics
Simulations are conducted using Monte Carlo methods. Initially, each individual on site is randomly assigned a strategy with equal probability, and all actively participate in games. Subsequently, an activation schedule is generated for each individual according to the temporal interaction rule, defining their state at any point during the evolutionary process. For periodic interaction, we set , and to simulate daily human activities. The PGG then advances through a sequence of elementary steps.
Step 1 (Game Interaction): A random individual is selected as the focal player to participate in the PGGs occurring at its site and neighbouring sites. Within each group , let () denote the number of active cooperators and defectors, respectively, and represents the total number of active neighbors. If , the game does not take place, and all individuals receive a payoff of 0 (Fig. 1 (b-1). In other scenarios, the multiplication factor determines the total contributions from cooperators, with an increase in leading to a diminished dilemma strength. Accordingly, the payoff of active cooperator (AC) and active defector (AD) in one game are given as
| (2) |
| (3) |
Both inactive cooperator (IC) and inactive defector (ID) receive a payoff
| (4) |
where represents the inactivity payoff. Specifically, when there are no active individuals investing in public goods, all AD, IC and ID have no benefits, as illustrated in (b-3). The overall payoff at time step is the sum of all payoffs from the games participated in, calculated as .
Step 2 (Update of Strategy and State): Following game participation, individuals update their strategies asynchronously in a randomly sequential manner. Initially, individual randomly selects one of its neighbours , who acquires its payoff . Then, adopts ’s strategy with a probability determined by the Fermi function [36]:
| (5) |
where measures noise intensity. With , individuals with higher payoffs easily dominate strategy-wise over those with lower payoffs. Conversely, for , strategy imitation becomes indiscriminate of payoffs, indicative of weak selection [37]. We set , favouring the imitation of higher payoff strategies, though noise allows for the occasional adoption of less successful ones. It is important to note that strategy updates are exclusive to ’active’ individuals, while ’inactive’ ones keep their strategies but may still influence others (Eq. 5). Each individual updates its state to for the next game round. The process concludes with iterations, allowing every individual the opportunity to revise their strategy and state once on average, completing a full Monte Carlo step.
III RESULTS
In the following sections, we present simulation results conducted on a square lattice of size . The key value , characterizing the frequency of cooperators in the population, is derived by averaging over the last generations, following more than time steps. To ensure robustness and minimize variability, the final steady states are obtained by conducting up to 10 independent realizations.
III-A Overview of temporal interaction mechanism
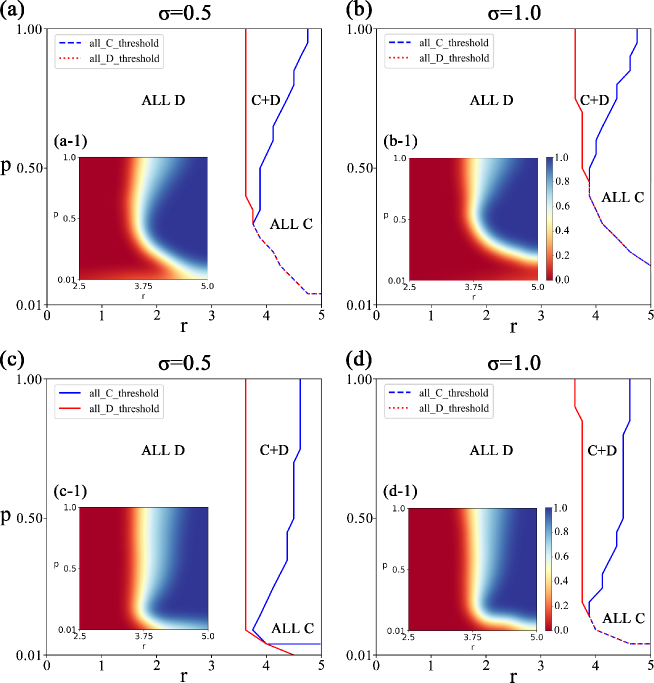
We begin by providing a comprehensive analysis of the transition phenomenon, focusing on the multiplication factor and activation probability . Fig. 2 presents phase diagrams illustrating the cooperation level under both stochastic and periodic interaction mechanisms. Notably, although a portion of the investment returns in public goods is distributed to inactive individuals, the threshold for cooperators to surpass defectors is significantly lower than the null model. This implies that temporal interaction mechanisms are conducive to the flourishing of cooperation. Moreover, at , the proportion of defectors is reduced compared to the volunteering model [21], increasing the likelihood of the group reaching a global cooperation steady state. However, the fixed payoff of inactive individuals undermines cooperation. As increases from to , the transition lines between all D, C+D and all C shrink, along with a reduction in the area representing the C+D phase. Interestingly, the transition between the all-cooperator and all-defector states is discontinuous, with low activation probabilities. Conversely, under conditions of frequent interactions, the system evolves into a mixed C+D state through a continuous phase transition.
Further, there exists a non-linear interplay between multiplication factor and activation probability in fostering cooperation, with varying impacts depending on the activity pattern. As depicted in Fig. 2(a) and (b), within the stochastic interaction mechanism, a negative correlation between and is observed at . Specifically, as decreases, the threshold required to shift the system from an all-defector (ALL D) to an all-cooperator (ALL C) state incrementally rises. It’s important to note that cooperators fail to sustain themselves at , underscoring the critical role of adequate interaction for the emergence of cooperation. In scenarios of higher activation frequency (), the transition from an ALL D to a mixed cooperator-defector (C+D) phase shows limited sensitivity to changes in . However, the multiplier needed to achieve an ALL C phase escalates with increasing , indicating a positive correlation. This suggests that, in stochastic interactions, an optimal activation probability exists at which the system can evolve into an ALL C equilibrium with the smallest required .
Furthermore, periodic interactions appear to have a slightly more pronounced positive influence on cooperative behaviour. Fig. 2(c) and (d) show that the C+D and ALL C regions are more extensive compared to those in stochastic interactions. Interestingly, the threshold for the emergence of cooperation is not influenced by , with the ALL D threshold situated around in Fig. 2 (c) in (d). However, as increases from 0.01 to 1, the required to achieve an ALL C state first decreases and then rises continuously. Even with , effective cooperation can still emerge and predominate with suitable values, as seen in Fig. 2(c). This indicates that small-scale activation may more effectively lead to global cooperation, a phenomenon further examined through spatio-temporal factors in Fig. 6.
III-B Effects of stochastic interactions
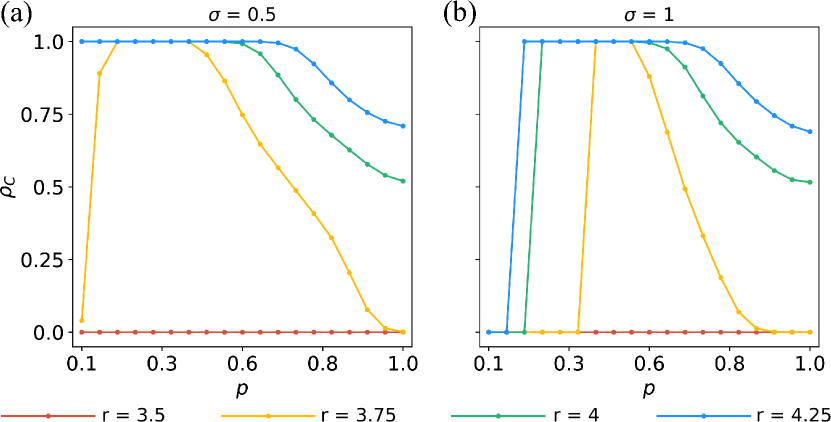
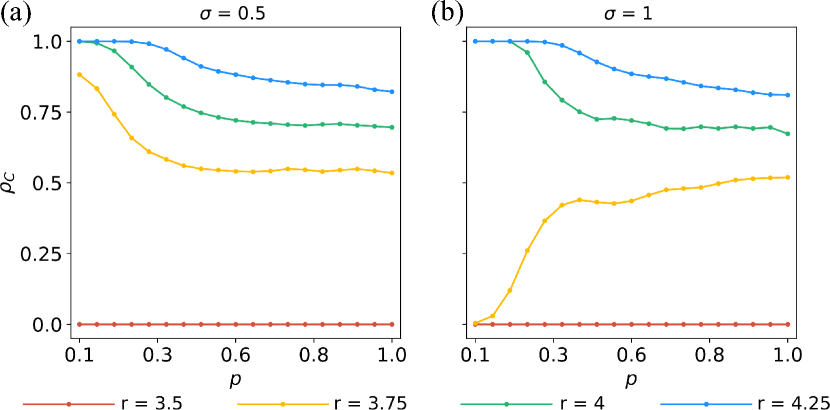
To more precisely quantify the role of stochastic interaction in promoting cooperation and determine the critical exponent, our study investigates the dependence of cooperation level () on activation probability () for varying multiplication factors (), as illustrated in Fig. 3. We observe that for a fixed the proportion of cooperators initially increases with , reaching an optimum, and then decreases as further escalates to 1. This pattern suggests an optimal -range conducive to achieving full cooperation, indicating that maximal cooperative spread under stochastic interaction occurs at an intermediate temporality. This ‘Goldilocks effect’ of temporality, aligning with findings in spatial PDG [31, 38], demonstrates that neither too frequent nor too rare interactions are ideal for promoting cooperation. Moreover, as surpasses this optimal range, starts to decline monotonically, eventually stabilizing at a mixed cooperator-defector (C+D) strategy equilibrium (for and ). Additionally, at a fixed and , a higher correlates with an increased at evolutionary equilibrium, where the plateau’s length expands with but contracts with . Notably, in Fig. 3(b) with , the optimal -value for fostering cooperation is significantly larger compared to in Fig. 3(a). This reflects the real-world scenario where higher basic security from public goods necessitates more frequent interactions to achieve cooperative consensus. In such cases of less active, the disparity in individual gains is minimal, and the strategy learning probability calculated by Eq.5 in each MSC is quiet low.
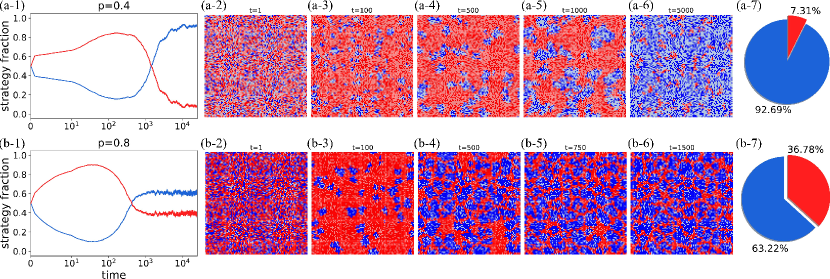
In order to intuitively understand the impact of stochastic interaction on cooperation at the micro level, we examine the yellow curve in Fig. 3(a) for the activation probability of and . Some typical snapshots are provided in Fig. 4. The overall trend shows an initial decline followed by an increase in the prevalence of cooperation in Fig 4 (*-1). Following the framework in Wang et al. (2013) [39], this process encompasses two phases: the enduring (END) phase and the expanding (EXP) phase. The END phase is characterized by a rapid decrease in cooperation and the emergence of large defector clusters. Cooperators, however, persist in the spaces between these clusters, protected by inactive individuals who inhibit the spread of defection, observed in Fig. 4 (*-3). Next, in the EXP phase, small cooperative groups encircled by defectors start to grow. Active individuals at the irregular boundary are more likely to become cooperators due to higher benefits within cooperative clusters, leading to a rapid increase and subsequent stabilization of cooperation levels around a mixed C+D equilibrium. Interestingly, cooperation level at equilibrium is higher at smaller active probability , and the spatial distribution of the strategies shows a great deal of variation in Fig. 4(*-6). As shown in (a-4) to (a-6), although the presence of inactive individuals creates a significant hurdle to forming ideal cooperative clusters, it protects the expansion of cooperative cluster, while a small number of defectors exist in unevenly distributed clusters. By contrast, high-frequency interactions allows defectors to connect and form a mesh structure. This net divides the cooperative group into small size and decreases the level of cooperators, see (b-4) to (b-6).
III-C Dynamics of periodic interactions based on time-lag
Recalling Fig. 2(c) and (d), the periodic interaction mechanism enables cooperation to prevail with a small average active probability. Fig. 5 plots how varies as a function of under different values of , revealing that cooperation is maximized at the combination of intermediate and low . When exceeds the all D threshold in Fig. 2, the proportion of cooperation decreases from 1 with increasing , reaching a C+D mixed equilibrium. Counterintuitively, Fig. 5 shows that the inactivity payoff affects the evolution of cooperation but not the final cooperation level. As increases, the downward trend of slows and stabilizes at a higher level than the equilibrium fraction in Fig. 3. An exception is the yellow line in Fig. 5(b), which presents a positive correlation between and , as is the critical value for cooperation evolution under .
To further explore the reason why periodic interaction shows a significant positive effect when activation frequency is small, Fig. 6 records snapshots of the spatial distribution at different simulation times. As shown, the time difference leads to the phenomenon of periodic shift of the active center at the macro level, and the activity patterns are similar among individuals located in the same region. When one region is active, nearly all individuals within that region participate in games, while others far away are inactive. Comparing Fig. 6(a-*) and (b-*), we observe that higher forms many small-sized C clusters with irregular boundaries, whereas lower produces fewer C clusters with smoother boundaries.
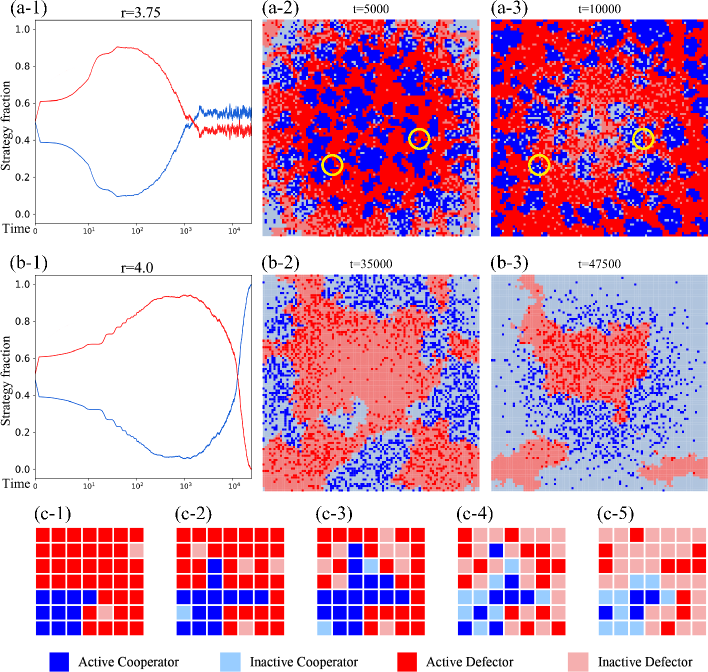
In Fig.6(a-1) and (b-1), the fraction of cooperation decreases during the END period and rises up to 0.55 and 1, respectively, in the EXP period. With , strategy updates are less frequent, leading to a prolonged journey to stochastic equilibrium. The trend of mirrors the population activity rate in Fig.1(c-2), increasing initially and then declining. Fig.6(c-*) illustrates this change in cooperative clusters over time at the micro level. Active individuals at cooperative cluster boundaries can expand outward due to payoff settings, forming cross-like structures as seen in Fig.6(c-1) to (c-3). However, with the shifting active center and an increase in inactive neighbors, these active cooperators face exploitation by defectors, leading to a reduction in their numbers (Fig.6(c-4)) and eventually forming larger, more compact cooperative clusters with smoother boundaries (Fig.6(c-5)). These clusters are more resilient against defection in subsequent active periods. Consequently, sparse activity under a periodic interaction mechanism is more conducive to the formation and integration of robust cooperative clusters. In Fig.6(b-2) and (b-3), these compact cooperative clusters gradually connect and encircle defector clusters, ultimately achieving an ALL C equilibrium.
III-D Robustness verification of spatial heterogeneity
To study the spatial heterogeneity arises from the density of network edges, we consider the following model of homogeneous networks that differ in their node degree.
III-D1 Heterogeneous degree distribution and stochastic interaction
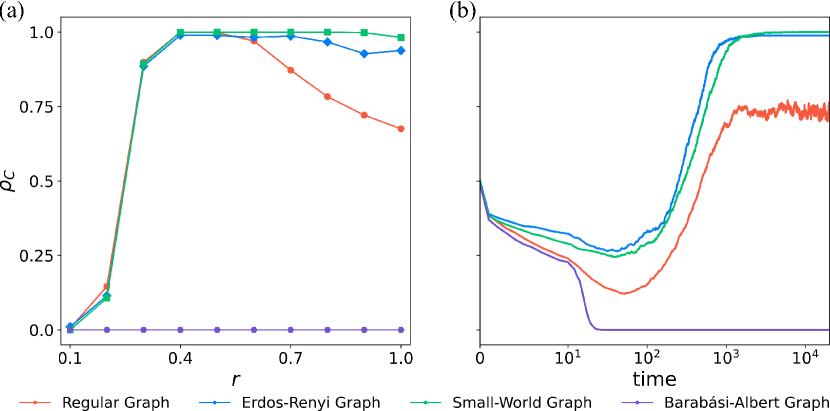
Consistent with the square lattice network, we generate Erdos-Reyni random network (ER) [40], Watts-Strogatz small-world network (SW) [41] and Barabási-Albert scale free network (BA) [42] with the average degree ⟨k⟩ = 4. As shown in Fig. 7, the spatial regularity (similar node degree) is a double-edged sword. On the one hand, the optimal platform for p is not observed in the ER and SW graphs, which means high-frequency stochastic interactions not constrain the flourish of cooperation, see Fig.7 (a). Besides, cooperators have a similar time gaining footholds but smaller fluctuations to reach higher cooperation level at equilibrium in ER and SW networks, see Fig.7 (b), because the social diversity [13] is more conducive to the formation of cooperative clusters. On the other hand, the strong heterogeneity of degree in BA graph fully inhibits cooperation, as inactive individual with high-degree can take free-rides extensively, destroying fragile cooperative structures early in the evolutionary process. The similar phenomenon has been found in periodic interactions.
III-D2 Different group size and periodic interaction
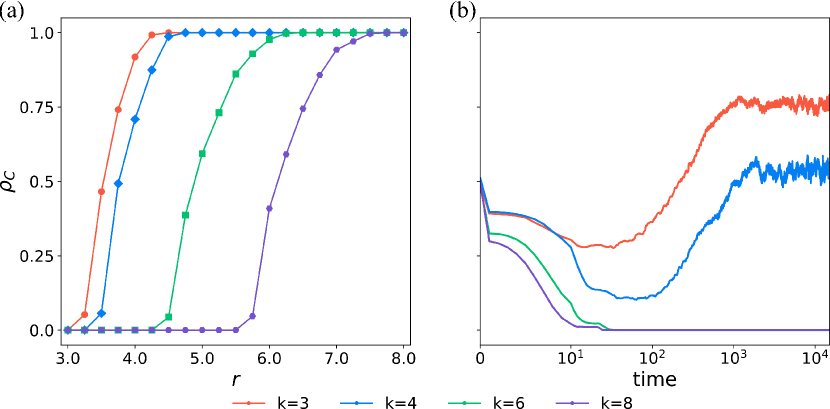
In agreement with the fact in Fig. 6 that cooperation requires a sufficient number of active individuals in a localized area, we may argue that larger groups facilitate the survival of cooperators. Results presented in Fig. 8 evidence clearly that group size plays a decisive role by the evolution of cooperation in PGG on regular graphs with different node degree k = 3, 4, 6 and 8. From a per capita perspective, the enhancement factor required for complete cooperator to emerge and dominance decreases slightly as the group size G=k+1 is enlarged (see Fig.8(a)), which supports the preceding statement. However, the collective gains are susceptible to be free-ridden in large-size group interactions, resulting in the lower cooperation level at equilibrium in Fig. 8(b).
IV THEORETICAL RESULTS
IV-A Dynamical Equation of Cooperators in Structured Populations
Based on the pair approximation approach [37, 43], let and denote the fraction of strategy X and XY pairs in the population, where . Let represent the conditional probability to find a X-player given that the adjacent node is occupied by a Y-player. Based on these definitions, the following relations
imply that the whole system can be described by only two variables and in the pair approximation approach. Specifically, , , , , and .
We first consider the accumulated payoff of AD-player who has AC (AD)-neighbors, and represents the number of active individuals among the nearest neighbors. According to Section II, the total payoff of focal player is accumulated from involved PGGs, but here we assume that the payoff is merely determined by a single PGG. This simplification makes the pair approximation more convenient while causing minor modifications in the systems dynamics [44]. In addition, AD gains nothing when or . Therefore, the expected payoff of an active defector in a PGG is
| (6) |
Similarly, the expected payoff of AC, ID and IC is respectively given as
| (7) |
| (8) |
| (9) |
Next, if the selected AD-player imitates a C-neighbor successfully, then increases by with the transition probability
| (10) |
where is the size of population, which equal to . And the transition probability that decreases by because a selected AC imitates a D-neighbor successfully is
| (11) |
Considering the expression of Fermi function with respect to the intensity of selection , the Eq. 5 can be rewritten as
| (12) |
We assume that every imitation event occurs in one unit of time . Therefore, the derivative of is given by
| (13) |
Simultaneously, a successful adoption of cooperator strategy will increase the number of CC-pairs by and increases by , thus the derivative of CC-pairs is
| (14) |
Furthermore, we can compute the derivative of is
| (15) | ||||
Therefore, Eqs. 13 and 14 that describe the evolutionary dynamics of cooperation can be written as function of and as
| (16) |
IV-B Analysis of weak selection
Based on the dynamical equation 16 we obtained above, our next goal is to investigate the theoretical conditions for promoting cooperation in structured populations. For weak selection , the local frequency equilibrates much more quickly and converge to the stationary state of than . Hence, we have
| (17) |
Furthermore, based on Eq.17 we can obtain the following expressions
| (18) | ||||
and
| (19) |
Accordingly, the time derivative of is
| (20) |
where the differences in expected payoffs of active and inactive individuals are
| (21) |
and
| (22) |
From Eq.20, we can observe that evolutionary direction of the population depends on the sign of and . Therefore, the sufficient condition for cooperation to prevail is
| (23) |

For any and , we plot the colormap of in Eq.23. As shown in Fig.9, larger activation probability is detrimental to cooperation, and there is a negative correlation between the threshold and required to increase cooperator. By comparing the simulation results in Fig.2 with the theoretical approximations, it is found that although there are some tiny deviations, the extended pair approximation method reflects role of probabilistic interaction in the spatial PGGs, especially that the transition line between all C and all D has similar trend.
V CONCLUSION
In real society, individuals exhibit diverse active patterns, alternating between periods of activity and rest. This variability, influenced by differences in biological clocks and geographic locations, means that individuals in different states seldom interact simultaneously. Consequently, actual partnership interactions are dynamic in nature and characterized by temporal variations. In this context, we propose two temporal mechanisms for participation in spatial public goods games: stochastic and periodic. An individual’s state not only influences the payoffs from the game but also affects the strategy updating process. Furthermore, acknowledging the non-exclusive nature of public goods, we introduce a rule for sharing collective benefits. Specifically, inactive individuals are allowed to free-ride only when there are contributions from active cooperators.
The results demonstrate that temporal interaction significantly enhances cooperation, with the level of enhancement being greatly influenced by interaction patterns and activation probability. Notably, the transition line from a mixed C+D to an ALL C state is quasi-concave, revealing an optimal combination of and that maximizes cooperation. In the realm of stochastic interactions, an intermediate value creates an environment conducive to cooperative behaviour, suggesting that a moderate frequency of interactions, rather than continuous engagement, is more effective in promoting cooperation. Conversely, periodic interactions, characterized by synchronized activities within small regions, positively influence cooperative evolution. From a macro perspective, temporal disparities lead to shifts in the active centre, thereby limiting the spread of cooperation to inactive areas. However, at the micro level, the inactivity of neighbouring individuals curtails the outward expansion of cooperative structures, thereby facilitating the formation of more robust cooperator clusters, particularly at lower values. Furthermore, the combination of spatial and temporal heterogeneity is discussed. It reveals that the strong heterogeneity of degree distribution tends to inhibit cooperation, whereas a larger group size promotes cooperation and moderate some defectors inside.
In summary, our study explores the impact of interaction frequency and synchronicity on the evolution of cooperation in spatial PGG. Utilizing Monte Carlo simulations and theoretical calculations, we have demonstrated that maintaining cooperation requires an appropriate balance of interaction frequency and local synchrony. This work potentially positions temporal interaction as an alternative mechanism for enhancing cooperation. It also opens new avenues for investigating the evolution of cooperation and other emergent behaviours from a temporal perspective.
References
- [1] A. S. Griffin and S. A. West, “Kin discrimination and the benefit of helping in cooperatively breeding vertebrates,” Science, vol. 302, no. 5645, pp. 634–636, 2003.
- [2] E. Fehr and U. Fischbacher, “The nature of human altruism,” Nature, vol. 425, no. 6960, pp. 785–791, 2003.
- [3] M. Nowak and R. Highfield, Supercooperators: Altruism, evolution, and why we need each other to succeed. Simon and Schuster, 2011.
- [4] O. Hoegh-Guldberg, D. Jacob, M. Taylor, T. Guillén Bolaños, M. Bindi, S. Brown, I. A. Camilloni, A. Diedhiou, R. Djalante, K. Ebi et al., “The human imperative of stabilizing global climate change at 1.5 c,” Science, vol. 365, no. 6459, p. eaaw6974, 2019.
- [5] J. J. V. Bavel, K. Baicker, P. S. Boggio, V. Capraro, A. Cichocka, M. Cikara, M. J. Crockett, A. J. Crum, K. M. Douglas, J. N. Druckman et al., “Using social and behavioural science to support covid-19 pandemic response,” Nature human behaviour, vol. 4, no. 5, pp. 460–471, 2020.
- [6] G. Hardin, “The tragedy of the commons: the population problem has no technical solution; it requires a fundamental extension in morality.” science, vol. 162, no. 3859, pp. 1243–1248, 1968.
- [7] J. Tanimoto, “Difference of reciprocity effect in two coevolutionary models of presumed two-player and multiplayer games,” Physical Review E, vol. 87, no. 6, p. 062136, 2013.
- [8] J. M. Smith, “Evolution and the theory of games,” in Did Darwin get it right? Essays on games, sex and evolution. Springer, 1982, pp. 202–215.
- [9] D. Y. Kenett, M. Perc, and S. Boccaletti, “Networks of networks–an introduction,” Chaos, Solitons & Fractals, vol. 80, pp. 1–6, 2015.
- [10] M. Perc, J. J. Jordan, D. G. Rand, Z. Wang, S. Boccaletti, and A. Szolnoki, “Statistical physics of human cooperation,” Physics Reports, vol. 687, pp. 1–51, 2017.
- [11] A. Szolnoki, M. Perc, and G. Szabó, “Topology-independent impact of noise on cooperation in spatial public goods games,” Physical Review E, vol. 80, no. 5, p. 056109, 2009.
- [12] G. Abramson and M. Kuperman, “Social games in a social network,” Physical Review E, vol. 63, no. 3, p. 030901, 2001.
- [13] F. C. Santos, M. D. Santos, and J. M. Pacheco, “Social diversity promotes the emergence of cooperation in public goods games,” Nature, vol. 454, no. 7201, pp. 213–216, 2008.
- [14] M. A. Nowak, “Five rules for the evolution of cooperation,” science, vol. 314, no. 5805, pp. 1560–1563, 2006.
- [15] M. A. Nowak, C. E. Tarnita, and T. Antal, “Evolutionary dynamics in structured populations,” Philosophical Transactions of the Royal Society B: Biological Sciences, vol. 365, no. 1537, pp. 19–30, 2010.
- [16] B. Allen, G. Lippner, Y.-T. Chen, B. Fotouhi, N. Momeni, S.-T. Yau, and M. A. Nowak, “Evolutionary dynamics on any population structure,” Nature, vol. 544, no. 7649, pp. 227–230, 2017.
- [17] A. Cavagna, A. Cimarelli, I. Giardina, G. Parisi, R. Santagati, F. Stefanini, and M. Viale, “Scale-free correlations in starling flocks,” Proceedings of the National Academy of Sciences, vol. 107, no. 26, pp. 11 865–11 870, 2010.
- [18] T. Ren and J. Zheng, “Evolutionary dynamics in the spatial public goods game with tolerance-based expulsion and cooperation,” Chaos, Solitons & Fractals, vol. 151, p. 111241, 2021.
- [19] A. K. Fahimipour, F. Zeng, M. Homer, A. Traulsen, S. A. Levin, and T. Gross, “Sharp thresholds limit the benefit of defector avoidance in cooperation on networks,” Proceedings of the National Academy of Sciences, vol. 119, no. 33, p. e2120120119, 2022.
- [20] C. Hauert, S. De Monte, J. Hofbauer, and K. Sigmund, “Volunteering as red queen mechanism for cooperation in public goods games,” Science, vol. 296, no. 5570, pp. 1129–1132, 2002.
- [21] G. Szabó and C. Hauert, “Phase transitions and volunteering in spatial public goods games,” Physical review letters, vol. 89, no. 11, p. 118101, 2002.
- [22] D. Semmann, H.-J. Krambeck, and M. Milinski, “Volunteering leads to rock–paper–scissors dynamics in a public goods game,” Nature, vol. 425, no. 6956, pp. 390–393, 2003.
- [23] F. Fu, C. Hauert, M. A. Nowak, and L. Wang, “Reputation-based partner choice promotes cooperation in social networks,” Physical Review E, vol. 78, no. 2, p. 026117, 2008.
- [24] T. Ren and X.-J. Zeng, “Reputation-based interaction promotes cooperation with reinforcement learning,” IEEE Transactions on Evolutionary Computation, 2023.
- [25] D. Ghosh, M. Frasca, A. Rizzo, S. Majhi, S. Rakshit, K. Alfaro-Bittner, and S. Boccaletti, “The synchronized dynamics of time-varying networks,” Physics Reports, vol. 949, pp. 1–63, 2022.
- [26] P. Holme and J. Saramäki, Temporal network theory. Springer, 2019, vol. 2.
- [27] P. Holme and J. Saramki, “Temporal networks,” Physics reports, vol. 519, no. 3, pp. 97–125, 2012.
- [28] J. M. Pacheco, A. Traulsen, and M. A. Nowak, “Coevolution of strategy and structure in complex networks with dynamical linking,” Physical review letters, vol. 97, no. 25, p. 258103, 2006.
- [29] D. Melamed, A. Harrell, and B. Simpson, “Cooperation, clustering, and assortative mixing in dynamic networks,” Proceedings of the National Academy of Sciences, vol. 115, no. 5, pp. 951–956, 2018.
- [30] J. Zheng, Y. He, T. Ren, and Y. Huang, “Evolution of cooperation in public goods games with segregated networks and periodic invasion,” Physica A: Statistical Mechanics and its Applications, vol. 596, p. 127101, 2022.
- [31] A. Li, L. Zhou, Q. Su, S. P. Cornelius, Y.-Y. Liu, L. Wang, and S. A. Levin, “Evolution of cooperation on temporal networks,” Nature communications, vol. 11, no. 1, p. 2259, 2020.
- [32] T. Hiraoka, N. Masuda, A. Li, and H.-H. Jo, “Modeling temporal networks with bursty activity patterns of nodes and links,” Physical Review Research, vol. 2, no. 2, p. 023073, 2020.
- [33] J. Li, C. Zhang, Q. Sun, Z. Chen, and J. Zhang, “Changing the intensity of interaction based on individual behavior in the iterated prisoner’s dilemma game,” IEEE Transactions on Evolutionary Computation, vol. 21, no. 4, pp. 506–517, 2016.
- [34] X. Li, G. Hao, Z. Zhang, and C. Xia, “Evolution of cooperation in heterogeneously stochastic interactions,” Chaos, Solitons & Fractals, vol. 150, p. 111186, 2021.
- [35] R. S. Edgar, E. W. Green, Y. Zhao, G. Van Ooijen, M. Olmedo, X. Qin, Y. Xu, M. Pan, U. K. Valekunja, K. A. Feeney et al., “Peroxiredoxins are conserved markers of circadian rhythms,” Nature, vol. 485, no. 7399, pp. 459–464, 2012.
- [36] G. Szabó and G. Fath, “Evolutionary games on graphs,” Physics reports, vol. 446, no. 4-6, pp. 97–216, 2007.
- [37] H. Ohtsuki, C. Hauert, E. Lieberman, and M. A. Nowak, “A simple rule for the evolution of cooperation on graphs and social networks,” Nature, vol. 441, no. 7092, pp. 502–505, 2006.
- [38] X. Chen, F. Fu, and L. Wang, “Interaction stochasticity supports cooperation in spatial prisoner’s dilemma,” Physical Review E, vol. 78, no. 5, p. 051120, 2008.
- [39] Z. Wang, S. Kokubo, J. Tanimoto, E. Fukuda, and K. Shigaki, “Insight into the so-called spatial reciprocity,” Physical Review E, vol. 88, no. 4, p. 042145, 2013.
- [40] P. Erdős, A. Rényi et al., “On the evolution of random graphs,” Publ. math. inst. hung. acad. sci, vol. 5, no. 1, pp. 17–60, 1960.
- [41] D. J. Watts and S. H. Strogatz, “Collective dynamics of ‘small-world’networks,” nature, vol. 393, no. 6684, pp. 440–442, 1998.
- [42] A.-L. Barabási and R. Albert, “Emergence of scaling in random networks,” science, vol. 286, no. 5439, pp. 509–512, 1999.
- [43] Z. Sun, X. Chen, and A. Szolnoki, “State-dependent optimal incentive allocation protocols for cooperation in public goods games on regular networks,” IEEE Transactions on Network Science and Engineering, 2023.
- [44] X. Wang and W. Kong, “Spatial dynamics of the public goods game with probabilistic participation,” in 2020 39th Chinese Control Conference (CCC). IEEE, 2020, pp. 6674–6681.