Disparity Driven Heterogeneous Nucleation in Finite-Size Adaptive Networks
Abstract
Phase transitions are crucial in shaping the collective dynamics of a broad spectrum of natural systems across disciplines. Here, we report two distinct heterogeneous nucleation facilitating single-step and multi-step phase transitions to global synchronization in a finite-size adaptive network due to the trade-off between time scale adaptation and coupling strength disparities. Specifically, small intracluster nucleations coalesce either at the population interface or within the populations resulting in the two distinct phase transitions depending on the degree of the disparities. We find that the coupling strength disparity largely controls the nature of phase transition in the phase diagram irrespective of the adaptation disparity. We provide a mesoscopic description for the cluster dynamics using the collective coordinates approach that brilliantly captures the multicluster dynamics among the populations leading to distinct phase transitions. Further, we also deduce the upper bound for the coupling strength for the existence of two intraclusters explicitly in terms of adaptation and coupling strength disparities. These insights may have implications across domains ranging from neurological disorders to segregation dynamics in social networks.
Introduction. Complex systems [1, 2, 3], characterized by their intricate interconnections, often exhibit transitions from incoherence to coherence [4, 5, 6]. Phase transitions are observed in several physical phenomena including crystallization and ferromagnetic transition. Beyond the physical systems, phase transitions in complex networks can shed more light on intriguing biological, ecological, and social problems such as population collapse and species extinction [7], polarization in society [8], and crashes in financial markets [9]. Particularly, transitions from incoherence to synchronization have been extensively studied employing various network topologies of real-world relevance [10, 11, 12]. Traditionally, most studies have been primarily concentrated on static networks. However, a large class of real-world networks co-evolve with their dynamical states and adapt to the prevailing environments. For instance, from intricate dynamics of human brain [13, 14, 15], technological systems [16, 17, 18], and biological networks [19, 20, 21] to social dynamics [22, 23, 24] adaptability manifests in the entire spectrum of complex networks across disciplines.
Recent interest in adaptive dynamical networks has surged due to their potential significance in addressing complex systems [25, 26]. Adaptively coupled phase oscillator models are paradigms for describing the interplay of function and structure in complex systems [27]. Dynamical features such as frequency clusters [28, 29], solitary states [30], recurrent synchronization [31], and heterogeneous nucleation [32] are specific to adaptive dynamical networks [33]. In addition to adaptivity, large-scale systems consist of multiple populations exhibiting diverse and multi-scale behavior [34, 35, 36]. Examples include dynamics of distinct brain regions spanning multiple time scales [37], ecological communities exhibiting different time scales in response to infectious diseases [38, 39, 40], and time scales of social ties formation also vary across communities [41, 42]. These investigations also reveal that time scale disparity plays a nontrivial role in shaping their collective dynamics. Studies have shown that depending on various factors, a system may opt for different routes during phase transition. For instance, multiple nucleation pathways can unfold in crystal formation, each involving distinct intermediate states [43, 44]. Similarly, in the opinion formation dynamics on social networks, individuals can form a cohesive community with consensus or can form fragmented structures known as echo chambers [45, 46]. The ability to manipulate the transition pathways holds immense importance as it allows to steer the system through the appropriate intermediate states under favorable conditions.
In this work, we consider a finite-size adaptive network comprised of two populations with time scale adaptation disparity and coupling strength disparity without
any quenched disorder. We observe two distinct nucleation. In the first scenario, we find a single large interpopulation frequency cluster emerges at the population interface due to the coalescence of small intrapopulation clusters.
The single large inter-frequency-cluster eventually enlarges to the system size as a function of the coupling strength facilitating a multi-step transition to
global synchronization. In sharp contrast, intrapopulation clusters nucleate and coalesce together to manifest two completely entrained intrapopulation clusters
as a function of the coupling strength for a strong intrapopulation adaptation rate. Finally, the two intraclusters merge together for a large coupling strength
resulting in a single-step transition to synchronization. Recently, similar heterogeneous nucleation resulting in multi- and single-step transitions are reported
to be facilitated by distinct quenched disorders [32]. A strong interpopulation coupling strength always favors nucleation of inter-frequency-clusters
leading to multi-step transition even with a strong intrapopulation adaptation rate. Similarly, a strong intrapopulation coupling strength always favors nucleation
of intra-frequency-clusters facilitating single-step transition even with a strong interpopulation adaptation rate. These results reveal that the disparity in the
coupling strength determines the nature of nucleation leading to distinct synchronization transition. We analytically deduce the macroscopic evolution equations
for the cluster dynamics using the collective coordinates framework [47] and show that the latter corroborates the simulation results. Further, we also
deduce the upper bound for the coupling strength for the existence of two intraclusters explicitly, at which the abrupt single-step transition manifests,
in terms of adaptation and coupling strength disparity parameters.
The Model.
We consider a system of globally coupled phase oscillators with adaptive coupling represented as
| (1a) | |||
| (1b) | |||
where and are the natural frequency and the phase of the oscillator () in the population, respectively. Here, we consider two populations . The coupling weights co-evolve with the phases of the oscillators, is the coupling strength, is the time-scale parameter determining the adaptation rate of the coupling weights, and the parameter accounts for different adaptation rules [48, 49]. We have fixed , close to the symmetric rule [32], which is also referred to as Hebbian adaptation rule.
In this model, Eq. (1a) governs the phase dynamics, which is a generalized version of the Kuramoto model with adaptive coupling. The coupling matrix characterizes the network topology, and the dynamics of coupling weights is governed by Eq. (1b). To investigate the nontrivial effect of disparities among populations, we consider equally sized populations with homogeneous(heterogeneous) coupling strength and time scale adaptation among intra-(inter-) population. Further, the interactions are chosen to be symmetric with and . The disparity between intra- and interpopulations coupling strengths is governed by and , where is the coupling strength disparity parameter, and is the control parameter. Analogously, the disparity in time scales is governed by and , where is the adapation disparity parameter and is set to . When , there is neither coupling disparity nor adaptation disparity between and . Intrapopulation coupling strengths and adapations are larger for and smaller for . Note that rescaling of time with the transformations , , and recovers the dynamics of the model, where is a constant factor.

Results. The system of adaptively coupled phase oscillators (1) are numerically solved using the Runge-Kutta 4th order integration scheme. We assign oscillators in the range to the first population, and oscillators in the range are assigned to the second population. The oscillators in each population are sorted in the increasing order of their natural frequencies. ’s are chosen randomly from the interval . We have fixed , and .
Initially, the system is in an incoherent state for , and small coupling strengths. As the coupling strength increases, the oscillators self-organize to global synchronization. The oscillators with larger tend to synchronize more quickly than that with smaller . In the following, we show that the system undergoes qualitatively two distinct routes to synchrony as governed by the disparities among the populations.
We employ the synchronization index [32], that quantify the degree of coherence in the network, represented as
| (2) |
where measures the pairwise frequency synchronization between and oscillator defined as
| (3) |
where is a predefined threshold and is the mean phase velocity of the oscillator calculated after a large transient . For , the system is completely synchronized, whereas indicates complete incoherence.
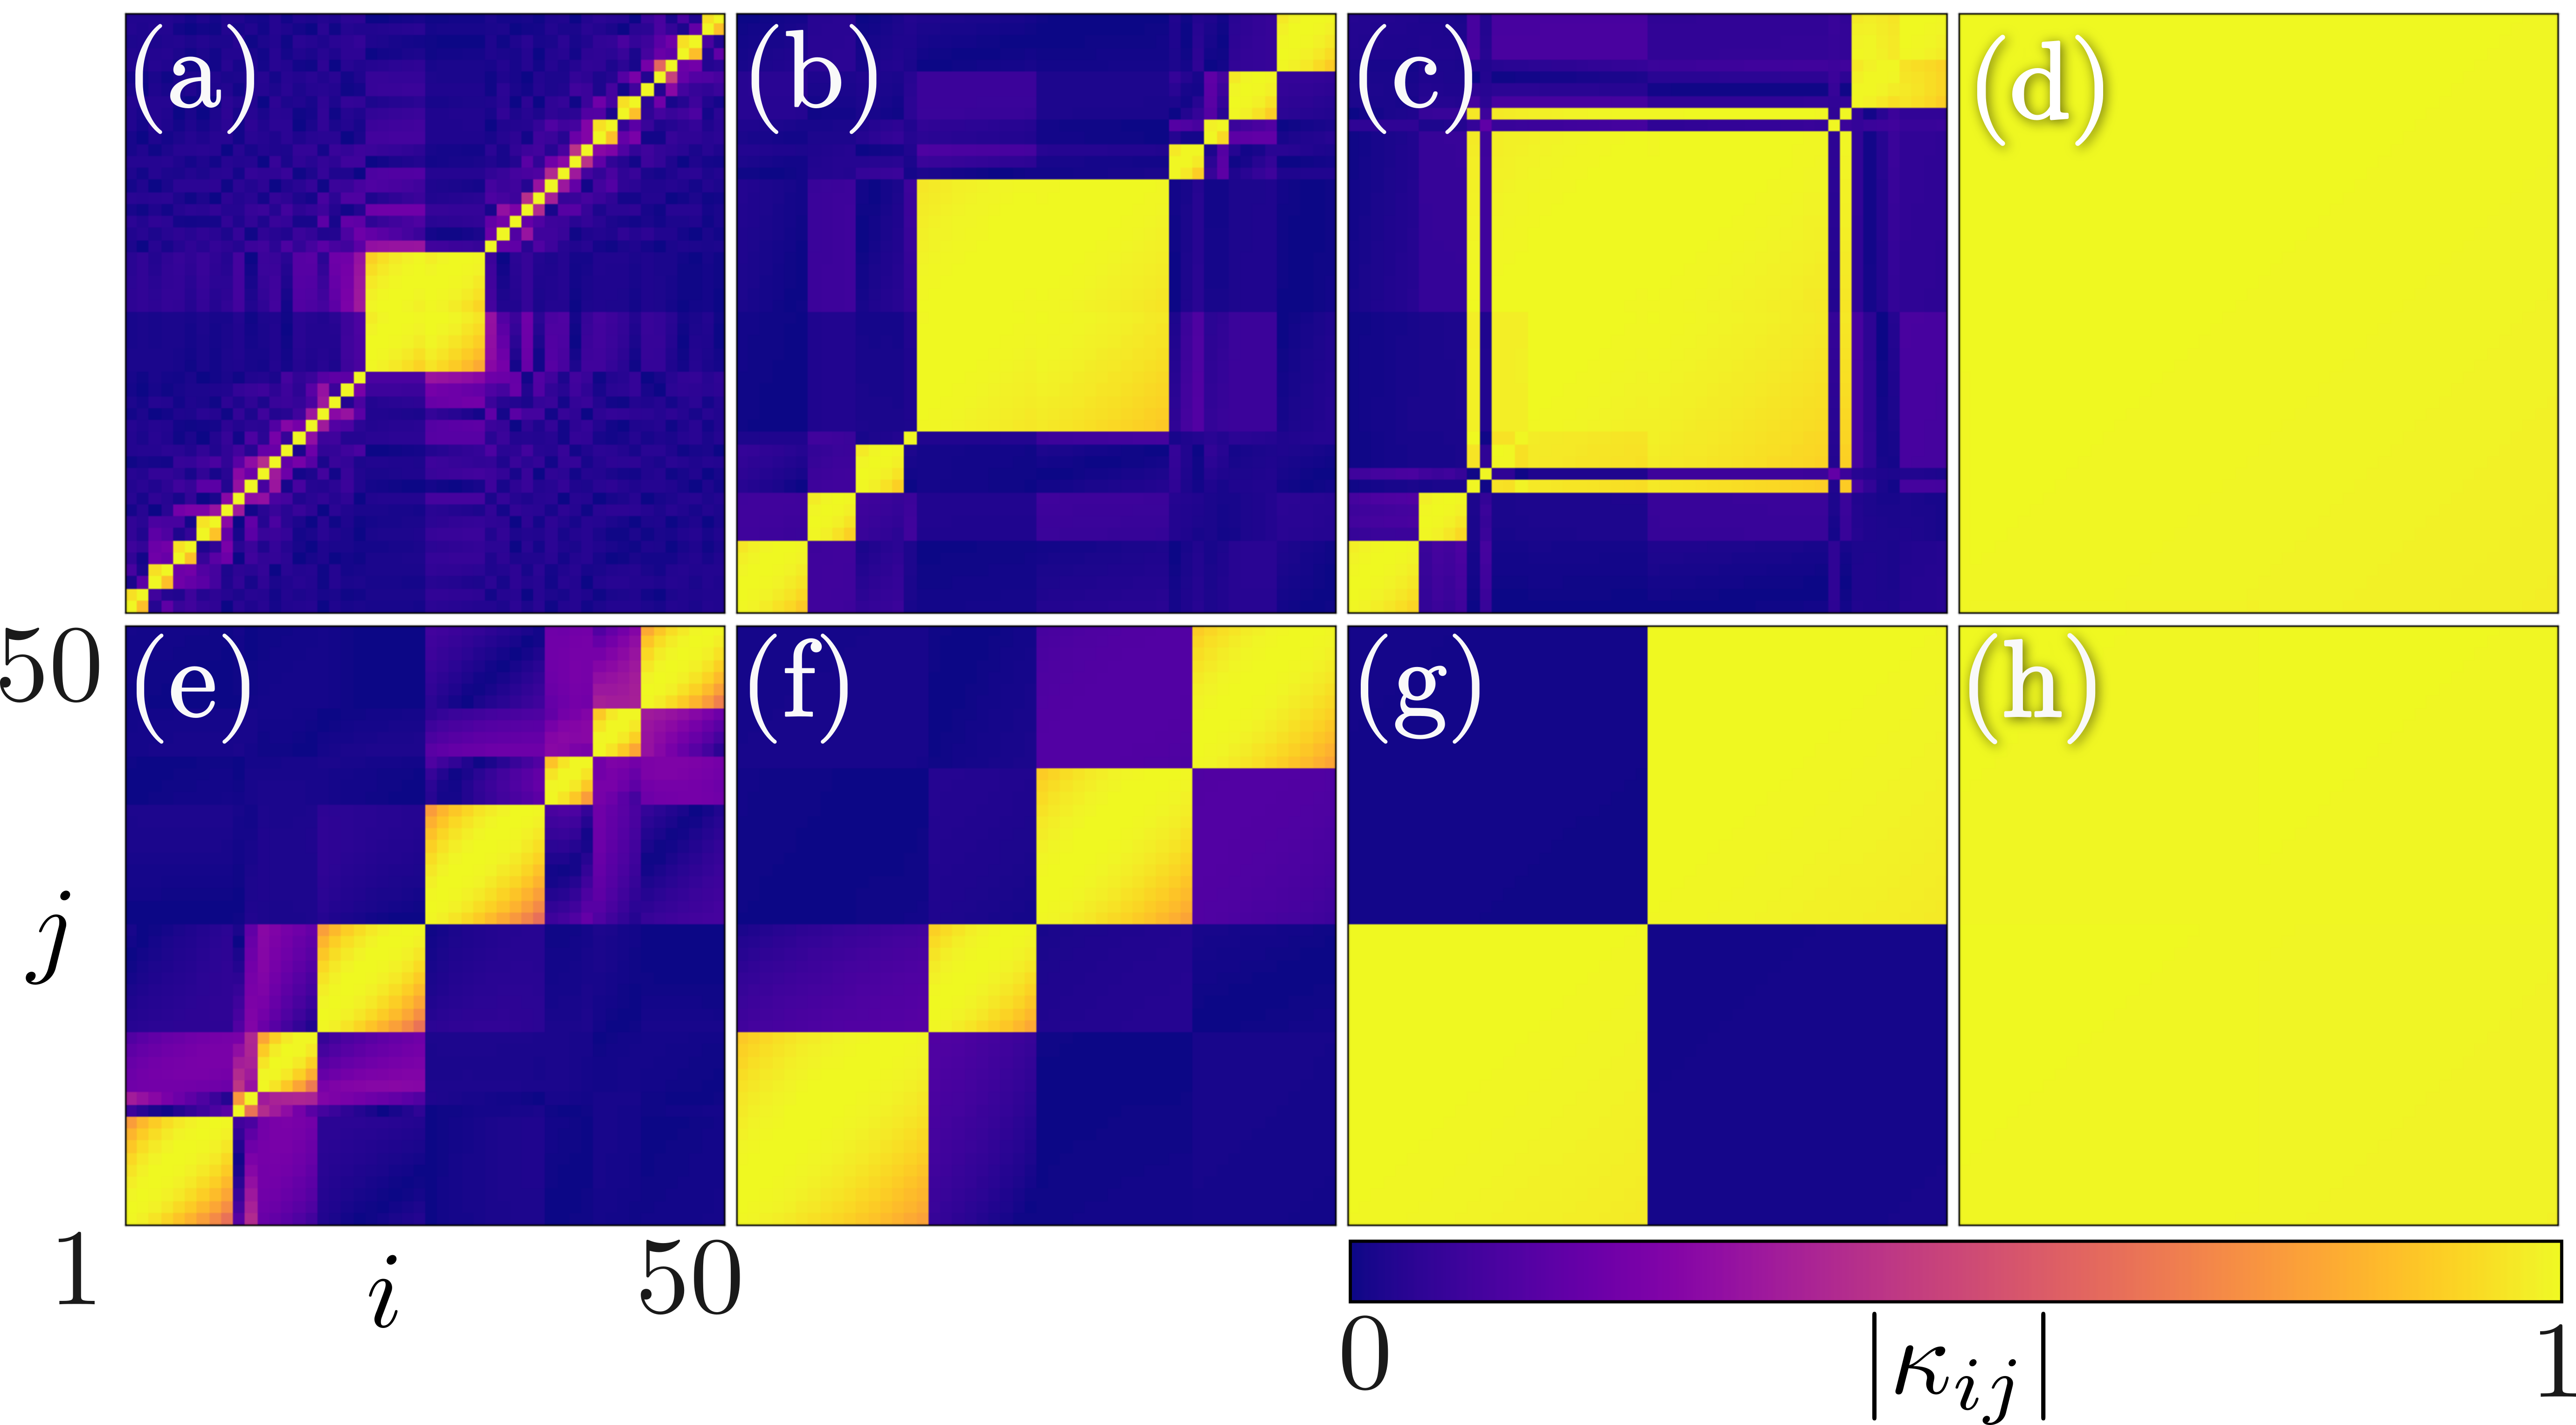
First, we discuss the phase transition facilitated solely by adaptation disparity for . The network (1) exhibits a multi-step transition to global synchronization as a function of for as depicted in Fig. 1 (green/light grey squares). The dynamics of the coupling weights unveil crucial insights on the underlying mechanism for such a transition as they co-evolve with the phases of the oscillators. The snapshots of are plotted in Figs. 2(a)-(d) for . It is evident that a single frequency cluster, entrained by oscillators from both populations, emerges at the interface of the populations, which grows with an increase in the coupling strength due to the subsequent entrainment of smaller intrapopulation clusters. This process of continuous integration of smaller clusters (compare Figs. 2(a)-(c)), as a function of , leads to a staggered rise in the degree of synchronization (see Fig. 1) and eventually results in global synchronization (see Fig. 2(d)). Note that, for , the interpopulation adaptation rate is larger than intrapopulation adaptation, that is , and hence oscillators from different populations rapidly entrained to form nucleations, which grow as a single cluster as observed in Figs. 2(a)-(d).
In stark contrast, for , the network exhibits a single-step transition to global synchronization as corroborated by
in Fig. 1 for (blue/dark grey squares). Again,
uncover the underlying mechanism for such an abrupt synchronization transition. The snapshots of for
are depicted in Figs. 2(e)-(h). Coexisting intrapopulation clusters emerge and subsequently enlarge by the entrainment of
smaller intrapopulation clusters (see Figs. 2(e) and (f)) manifesting entrained subpopulations for a large (see Fig. 2(g)).
Finally, the completely entrained intrapopulation clusters coalesce together resulting in global synchronization (Fig. 2(h))
as corroborated by an abrupt jump in the synchronization index to (see Fig. 1 for ).
Note that the intrapopulation adaptation is larger than interpopulation adaptation for , that is , and consequently,
nucleations are formed within the populations resulting in coexisting intrapopulation clusters. Thus, one can reinforce a particular route to the phase transition
by tuning the time scale of adaptation.
Heat maps of are depicted in the parameter space in Figs. 3(a)-(c) for three distinct .
For , clearly, there is a single-step(multi-step) transition for (see Fig. 3(a)) as discussed above.
Nevertheless, the effect of trade-off between and is evident from Figs. 3(b) and (c) depicted for
and , respectively.
interpopulation coupling strength () is larger than that of intrapopulation () in Fig. 3(b)
for . interpopulation adaption () is also larger in the range of resulting in a multi-step transition.
Despite the intrapopulation adaption () is larger than , a strong
facilitates multi-step transition in the range of in Fig. 3(b). This elucidates that the coupling disparity ()
dominates the adaptation disparity () in facilitating phase transitions. However, when ,
and hence a large facilitates nucleation of clusters within populations resulting in entrained intrapopulations and eventually a single-step transition
despite a large in the range of . Further, when and consequently
only two-cluster state manifest without any global synchronization.
Both facilitate distinct nucleation
within intrapopulations and a single-step transition in the range of in Fig. 3(c) for .
Now, again a large leads to a single-step transition even in the range of (see Fig. 3(c)),
where interpopulation adaptation is larger, which reinforces that the coupling disparity () dominates the adaptation disparity.
However, for and hence
a single large nucleation manifests at the population interface leading to a multi-step transition.

Mesoscopic Dynamics. Being evident that the transition from asynchrony to global synchronization involves the nucleation and merging of frequency clusters, the dynamics of the full system can be captured by cluster level description. We employ a collective coordinate approach to analyze the synchronization of intrapopulation clusters of distinct populations [47, 50, 51, 32]. The dynamical variables corresponding to the phase and coupling weights of an oscillator can be expressed in terms of collective coordinates and with the ansatz,
| (4a) | |||||
| (4b) | |||||
We consider there are number of clusters in the -th population, and clusters are described by indices . The term describes the frequency drift of oscillator within cluster in the population , is its mean natural frequency and describes its collective phase. The intercluster () coupling weights evolve in time. The errors arising in describing the evolution of the phase and coupling weights in terms of collective coordinates can be defined as and , respectively. The evolution equations for the collective coordinates are obtained by requiring the error to be orthogonal to the manifold of the ansatz. The frequency distribution corresponding to cluster of population can be expressed as . Here is the ratio () of oscillators. In the continuum limit, the cluster order parameter becomes with the variance of natural frequencies of the cluster as . Consequently, the dynamics of the collective coordinates is governed by
| (5a) | |||||
| (5b) | |||||
| (5c) | |||||
In the context of mesoscopic description, the synchronization index (2) can be redefined to characterize the synchronization of frequency clusters as
| (6) |
Akin to microscopic context (3), , if otherwise . Although the single-step transition can be described by a minimum of two clusters, the multi-step transition requires a larger number of clusters to describe it. The phase transition displayed by (6), estimated from the evolution equations for the collective coordinates, corresponding to two populations, each having 4 clusters, for two values of is depicted in Fig. 4. It is evident from the figure that the collective coordinates approach clearly displays single-step and multi-step transitions for and , respectively, in agreement with the simulation results in Fig. 1.
Now, an analytical estimate of the upper bound for the coupling strength corresponding to the completely entrained clusters of intrapopulations (Fig. 2(g)) during the single-step transition can be obtained using the perturbative approach in the weak coupling limit [32]. Assuming the intracluster phase difference () grows linearly in time with the relative phase velocity , the collective coordinates can be expressed in the orders of as
| (7a) | ||||
| (7b) | ||||
| (7c) | ||||
Substituting the perturbed equations in (5) leads to the quadratic equation in
| (8) |
The condition for the existence of real solution of (8) requires . Now, the upper bound for the coupling strength for the existence of the two-cluster state can be obtained as
| (9) |
It is evident that depends explicitly on the adaptation and the coupling disparity parameters. For a rough estimate of , one can consider . For the values of the parameters in Fig. 1, the upper bound can be obtained as with , which almost agrees with the single-step transitions in Figs. 1 and 4. Now, the critical curve corresponding to the upper bound can be written as , which is depicted as a dashed curve in Figs. 3(a)-3(c) across which the single-step transition takes place. The finite size effect and the first order approximation for the order parameters and contribute to the error between the analytical curve and the numerical results in Figs. 3.

Discussion and Conclusion.
We have considered a globally coupled finite-size adaptive network, wherein the subpopulations are distinguished by different degrees of time scale adaptation and
coupling strength but with uniform distribution of natural frequencies. We have found that nucleations of intrapopulation frequency clusters
coalesce at the interface of the two populations facilitating the manifestation of a single large interpopulation frequency cluster for a strong interpopulation
adaptation rate, ,
without any coupling strength disparity. Eventually, the single large inter-frequency-cluster grows to the system size as the coupling strength is increased
facilitating a multi-step transition to global synchronization. In contrast, nucleations of intrapopulation frequency clusters coalesce among themselves to manifest
completely entrained two intrapopulation frequency clusters as a function of the coupling strength for a strong intrapopulation adaptation rate ,
without any coupling strength disparity.
Finally, the two intra-frequency-clusters coalesce together facilitating a single-step transition to global synchronization. Synchronization index clearly displays
the two distinct transitions for two distinct values of when .
Further, we found that a strong interpopulation coupling strength, , always favors nucleation of inter-frequency-clusters
leading to multi-step transition even for a strong intrapopulation adaptation rate (). Furthermore, we found that a strong intrapopulation
coupling strength, , always favors nucleation of intra-frequency-clusters facilitating single-step transition even with a strong interpopulation
adaptation rate (). These results corroborate that the degree of disparity in the
coupling strength strongly determines the nature of nucleation leading to distinct synchronization transition. We have analytically deduced the macroscopic evolution equations
for the cluster dynamics using the framework of collective coordinates [47]. The synchronization transitions obtained using the collective coordinates are found to
agree with the simulation results. Further, we have also deduced the upper bound for the coupling strength for the existence of two intraclusters explicitly in terms of adaptation
and coupling strength disparity parameters, which is found to almost match the coupling strength at the onset of abrupt single-step transition.
It is also evident that the mesoscopic description brilliantly captures the multicluster dynamics.
Note that similar heterogeneous nucleation resulting in multi- and single-step transitions are reported to be facilitated by distinct quenched disorders [32], wherein the nucleations emerge at the site of the disorder(s) resulting in multi-(single-)step transitions. However, in our case with uniform distribution of natural frequencies, small intracluster nucleations coalesce either at the population interface or within the populations resulting in multi- and single-step synchronization transitions depending on the trade-off between the adaptation and coupling disparities. Understanding the mechanism of nucleations corresponding to distinct transition due to the inherent disparities of complex real-world systems is of paramount importance as they shed more light on the role of disparities among different regions of the brain in synchronization in unraveling brain functions and neurological disorders [52], segregation and polarization dynamics in social networks [46], etc. Moreover, our findings hold significance in the network control theory, offering strategies to optimize adaptive networks.
Acknowledgments. AK acknowledges the financial support from IISER-TVM. JF acknowledges funding by the Austrian Science Fund (FWF): I 5985-N. The work of V.K.C. is supported by DST-CRG Project under Grant No. CRG/2020/004353 and VKC wish to thank DST, New Delhi for computational facilities under the DST-FIST programme (SR/FST/PS- 1/2020/135) to the Department of Physics. DVS is supported by the DST-SERB-CRG Project under Grant No. CRG/2021/000816.
References
- Boccaletti et al. [2006] S. Boccaletti, V. Latora, Y. Moreno, M. Chavez, and D.-U. Hwang, Complex networks: Structure and dynamics, Physics Reports 424, 175 (2006).
- Strogatz [2001] S. H. Strogatz, Exploring complex networks, nature 410, 268 (2001).
- Newman [2003] M. E. J. Newman, The structure and function of complex networks, SIAM Review 45, 167 (2003).
- Boccaletti et al. [2018] S. Boccaletti, A. N. Pisarchik, C. I. Del Genio, and A. Amann, Synchronization: from coupled systems to complex networks (Cambridge University Press, 2018).
- Dörfler et al. [2013] F. Dörfler, M. Chertkov, and F. Bullo, Synchronization in complex oscillator networks and smart grids, Proceedings of the National Academy of Sciences 110, 2005 (2013).
- Shahal et al. [2020] S. Shahal, A. Wurzberg, I. Sibony, H. Duadi, E. Shniderman, D. Weymouth, N. Davidson, and M. Fridman, Synchronization of complex human networks, Nature communications 11, 3854 (2020).
- Bagchi and Mohanty [2011] D. Bagchi and P. K. Mohanty, Phase transition in an exactly solvable extinction model, Phys. Rev. E 84, 061921 (2011).
- Conover et al. [2021] M. Conover, J. Ratkiewicz, M. Francisco, B. Goncalves, F. Menczer, and A. Flammini, Political polarization on twitter, Proceedings of the International AAAI Conference on Web and Social Media 5, 89 (2021).
- Levy [2008] M. Levy, Stock market crashes as social phase transitions, Journal of Economic Dynamics and Control 32, 137 (2008).
- Arenas et al. [2008] A. Arenas, A. Díaz-Guilera, J. Kurths, Y. Moreno, and C. Zhou, Synchronization in complex networks, Physics Reports 469, 93 (2008).
- Gómez-Gardeñes et al. [2007] J. Gómez-Gardeñes, Y. Moreno, and A. Arenas, Paths to synchronization on complex networks, Phys. Rev. Lett. 98, 034101 (2007).
- Dutta et al. [2023] S. Dutta, P. Kundu, P. Khanra, C. Hens, and P. Pal, Perfect synchronization in complex networks with higher-order interactions, Phys. Rev. E 108, 024304 (2023).
- Gerstner et al. [1996] W. Gerstner, R. Kempter, J. L. Van Hemmen, and H. Wagner, A neuronal learning rule for sub-millisecond temporal coding, Nature 383, 76 (1996).
- Caporale and Dan [2008] N. Caporale and Y. Dan, Spike timing-dependent plasticity: A hebbian learning rule, Annual Review of Neuroscience 31, 25 (2008), pMID: 18275283.
- Röhr et al. [2019] V. Röhr, R. Berner, E. L. Lameu, O. V. Popovych, and S. Yanchuk, Frequency cluster formation and slow oscillations in neural populations with plasticity, PLoS One 14, e0225094 (2019).
- Waldrop [2013] M. M. Waldrop, Smart connections, Nature 503, 22 (2013).
- Morales et al. [2021] G. B. Morales, C. R. Mirasso, and M. C. Soriano, Unveiling the role of plasticity rules in reservoir computing, Neurocomputing 461, 705 (2021).
- Berner et al. [2021] R. Berner, S. Yanchuk, and E. Schöll, What adaptive neuronal networks teach us about power grids, Phys. Rev. E 103, 042315 (2021).
- Proulx et al. [2005] S. R. Proulx, D. E. Promislow, and P. C. Phillips, Network thinking in ecology and evolution, Trends in Ecology & Evolution 20, 345 (2005).
- Gross et al. [2006] T. Gross, C. J. D. D’Lima, and B. Blasius, Epidemic dynamics on an adaptive network, Phys. Rev. Lett. 96, 208701 (2006).
- Rajapakse et al. [2011] I. Rajapakse, M. Groudine, and M. Mesbahi, Dynamics and control of state-dependent networks for probing genomic organization, Proceedings of the National Academy of Sciences 108, 17257 (2011).
- Horstmeyer and Kuehn [2020] L. Horstmeyer and C. Kuehn, Adaptive voter model on simplicial complexes, Phys. Rev. E 101, 022305 (2020).
- Baumann et al. [2020] F. Baumann, P. Lorenz-Spreen, I. M. Sokolov, and M. Starnini, Modeling echo chambers and polarization dynamics in social networks, Phys. Rev. Lett. 124, 048301 (2020).
- Antoniades and Dovrolis [2015] D. Antoniades and C. Dovrolis, Co-evolutionary dynamics in social networks: A case study of twitter, Computational Social Networks 2, 1 (2015).
- Sawicki et al. [2023] J. Sawicki, R. Berner, S. A. M. Loos, M. Anvari, R. Bader, W. Barfuss, N. Botta, N. Brede, I. Franović, D. J. Gauthier, S. Goldt, A. Hajizadeh, P. Hövel, O. Karin, P. Lorenz-Spreen, C. Miehl, J. Mölter, S. Olmi, E. Schöll, A. Seif, P. A. Tass, G. Volpe, S. Yanchuk, and J. Kurths, Perspectives on adaptive dynamical systems, Chaos: An Interdisciplinary Journal of Nonlinear Science 33, 071501 (2023).
- Jüttner and Martens [2023] B. Jüttner and E. A. Martens, Complex dynamics in adaptive phase oscillator networks, Chaos: An Interdisciplinary Journal of Nonlinear Science 33, 053106 (2023).
- Berner [2021] R. Berner, Patterns of synchrony in complex networks of adaptively coupled oscillators (Springer Theses, 2021).
- Berner et al. [2019] R. Berner, E. Scholl, and S. Yanchuk, Multiclusters in networks of adaptively coupled phase oscillators, SIAM Journal on Applied Dynamical Systems 18, 2227 (2019).
- Thamizharasan et al. [2022] S. Thamizharasan, V. K. Chandrasekar, M. Senthilvelan, R. Berner, E. Schöll, and D. V. Senthilkumar, Exotic states induced by coevolving connection weights and phases in complex networks, Phys. Rev. E 105, 034312 (2022).
- Berner et al. [2020] R. Berner, A. Polanska, E. Schöll, and S. Yanchuk, Solitary states in adaptive nonlocal oscillator networks, The European Physical Journal Special Topics 229, 2183 (2020).
- Thiele et al. [2023] M. Thiele, R. Berner, P. A. Tass, E. Schöll, and S. Yanchuk, Asymmetric adaptivity induces recurrent synchronization in complex networks, Chaos: An Interdisciplinary Journal of Nonlinear Science 33 (2023).
- Fialkowski et al. [2023] J. Fialkowski, S. Yanchuk, I. M. Sokolov, E. Schöll, G. A. Gottwald, and R. Berner, Heterogeneous nucleation in finite-size adaptive dynamical networks, Phys. Rev. Lett. 130, 067402 (2023).
- Berner et al. [2023] R. Berner, T. Gross, C. Kuehn, J. Kurths, and S. Yanchuk, Adaptive dynamical networks, Physics Reports 1031, 1 (2023), adaptive dynamical networks.
- Girvan and Newman [2002] M. Girvan and M. E. Newman, Community structure in social and biological networks, Proceedings of the national academy of sciences 99, 7821 (2002).
- Newman [2006] M. E. Newman, Modularity and community structure in networks, Proceedings of the national academy of sciences 103, 8577 (2006).
- Mucha et al. [2010] P. J. Mucha, T. Richardson, K. Macon, M. A. Porter, and J.-P. Onnela, Community structure in time-dependent, multiscale, and multiplex networks, science 328, 876 (2010).
- Betzel and Bassett [2017] R. F. Betzel and D. S. Bassett, Multi-scale brain networks, NeuroImage 160, 73 (2017), functional Architecture of the Brain.
- Garabed et al. [2020] R. B. Garabed, A. Jolles, W. Garira, C. Lanzas, J. Gutierrez, and G. Rempala, Multi-scale dynamics of infectious diseases, Interface Focus 10, 20190118 (2020).
- Brockmann and Helbing [2013] D. Brockmann and D. Helbing, The hidden geometry of complex, network-driven contagion phenomena, Science 342, 1337 (2013).
- Quaranta et al. [2020] G. Quaranta, G. Formica, J. T. Machado, W. Lacarbonara, and S. F. Masri, Understanding covid-19 nonlinear multi-scale dynamic spreading in italy, Nonlinear Dynamics 101, 1583 (2020).
- Flack [2012] J. C. Flack, Multiple time-scales and the developmental dynamics of social systems, Philosophical Transactions of the Royal Society B: Biological Sciences 367, 1802 (2012).
- Saramäki and Moro [2015] J. Saramäki and E. Moro, From seconds to months: an overview of multi-scale dynamics of mobile telephone calls, The European Physical Journal B 88, 1 (2015).
- Guo et al. [2016] C. Guo, J. Wang, J. Li, Z. Wang, and S. Tang, Kinetic pathways and mechanisms of two-step nucleation in crystallization, The journal of physical chemistry letters 7, 5008 (2016).
- Xu et al. [2021] S. Xu, D. Cao, Y. Liu, and Y. Wang, Role of additives in crystal nucleation from solutions: A review, Crystal Growth & Design 22, 2001 (2021).
- Evans and Fu [2018] T. Evans and F. Fu, Opinion formation on dynamic networks: identifying conditions for the emergence of partisan echo chambers, Royal Society open science 5, 181122 (2018).
- Tóth et al. [2021] G. Tóth, J. Wachs, R. Di Clemente, Á. Jakobi, B. Ságvári, J. Kertész, and B. Lengyel, Inequality is rising where social network segregation interacts with urban topology, Nature communications 12, 1143 (2021).
- Gottwald [2015] G. A. Gottwald, Model reduction for networks of coupled oscillators, Chaos: An Interdisciplinary Journal of Nonlinear Science 25, 053111 (2015).
- Aoki and Aoyagi [2009] T. Aoki and T. Aoyagi, Co-evolution of phases and connection strengths in a network of phase oscillators, Phys. Rev. Lett. 102, 034101 (2009).
- Aoki and Aoyagi [2011] T. Aoki and T. Aoyagi, Self-organized network of phase oscillators coupled by activity-dependent interactions, Phys. Rev. E 84, 066109 (2011).
- Hancock and Gottwald [2018] E. J. Hancock and G. A. Gottwald, Model reduction for kuramoto models with complex topologies, Physical Review E 98, 012307 (2018).
- Smith and Gottwald [2020] L. D. Smith and G. A. Gottwald, Model reduction for the collective dynamics of globally coupled oscillators: From finite networks to the thermodynamic limit, Chaos: An Interdisciplinary Journal of Nonlinear Science 30 (2020).
- Stam [2014] C. J. Stam, Modern network science of neurological disorders, Nature Reviews Neuroscience 15, 683 (2014).