Majority or Minority: Data Imbalance
Learning Method for Named Entity Recognition
Abstract
Data imbalance presents a significant challenge in various machine learning (ML) tasks, particularly named entity recognition (NER) within natural language processing (NLP). NER exhibits a data imbalance with a long-tail distribution, featuring numerous minority classes (i.e., entity classes) and a single majority class (i.e., -class). The imbalance leads to the misclassifications of the entity classes as the -class. To tackle the imbalance, we propose a simple and effective learning method, named majority or minority (MoM) learning. MoM learning incorporates the loss computed only for samples whose ground truth is the majority class (i.e., the -class) into the loss of the conventional ML model. Evaluation experiments on four NER datasets (Japanese and English) showed that MoM learning improves prediction performance of the minority classes, without sacrificing the performance of the majority class and is more effective than widely known and state-of-the-art methods. We also evaluated MoM learning using frameworks as sequential labeling and machine reading comprehension, which are commonly used in NER. Furthermore, MoM learning has achieved consistent performance improvements regardless of language, model, or framework.
Index Terms:
natural language processing, named entity recognition, data imbalance, cost-sensitive learningI Introduction
Named entity recognition (NER) [1, 2] is one of many real-world natural language processing (NLP) tasks with significant data imbalance, especially when applied for business purposes, such as corporate information-gathering websites [3] and extracting drug names, diseases, and symptoms from huge amounts of unstructured medical data [4]. NER commonly uses a sequential labeling framework, a form of multiclass classification that predicts labels corresponding to the words in a sentence. In the sequential labeling, all words are divided into either entity words with information (i.e., proper nouns) or non-entity words without information. Each entity word is labeled as a specific class (PERSON, LOCATION, etc…), to which a few samples belong. In contrast, all non-entity words constitute the majority and are labeled as a single class (i.e., the “others” -class). This labeling yields a data imbalance with a long-tail distribution. Between the well-known benchmarks, CoNLL2003 [5] and OntoNotes5.0 [6], the number of samples for the -class significantly exceeds that of the entity class, a condition often leading to misclassifications of entity classes as the -class, causing a considerable decline in the prediction performance of the minority classes. Thus, overcoming this data imbalance is a crucial step toward enhancing the performance of NER.
Conventional machine learning (ML) methods for addressing the data imbalances are categorized into sampling-based methods [7, 8, 9] for inputs and cost-sensitive learning [10, 11, 12] for outputs. The sampling-based method, which adjusts the number of sentences in training, has a certain effect on the ML tasks. However, NER uses a sequential labeling that predicts the labels corresponding to each word in a sentence; thus, it does not mitigate the imbalance. Conversely, cost-sensitive learning addresses the imbalance by designing a loss function for the ML model based on the number of samples in each class. While it is effective for binary classification, NER is a multiclass classification requiring extension of this method. This extension will lead to complex weight adjustments for each class and for cases in which it is not fully capable, thus not falling short of the desired performance.
In this paper, we propose a novel learning method, majority or minority (MoM) learning, to tackle the data imbalance in NER. MoM learning is simple and effective for incorporating the loss computed only for samples whose ground truth is the majority class into the loss of the conventional ML model. Our strategy enables one of cost-sensitive learning, but it differs from the concepts of previous studies, as it does not depend on the difficulty of the classification or the number of samples in the class. The purpose of MoM learning is to enhance the performance by preventing misclassifications of the minority classes (entity classes) as the majority class (the -class). When incorporating the loss of entity classes instead of the -class, the model cannot distinguish whether the prediction misclassified as the -class or as another entity class. Therefore, MoM learning focuses on the -class to recognize misclassifications from -class to the entity classes.
We evaluated MoM learning using four NER datasets [5, 6, 13, 14] and with a variety of ML models, including BERT [15] and RoBERTa [16] which have proven successful in various NLP tasks. The evaluation results demonstrated that MoM learning contributes to consistent improvements in the performance across models and languages. We also confirmed that MoM learning is more effective than those introduced in previous state-of-the-art studies, such as focal loss (FL) [17] and dice loss (DL) [18]. Furthermore, beyond the common sequential labeling, we demonstrated the effectiveness of MoM learning using the machine reading comprehension (MRC) framework, which is becoming the mainstream [19, 20].
Our contributions are summarized as follows: (1) We propose a novel learning method, named majority or minority (MoM) learning, designed to address the data imbalance with a long-tail distribution, which is a significant challenge in ML tasks. (2) We evaluated four commonly NER datasets (English and Japanese) and demonstrated that MoM learning is more effective than conventional methods of both the sequential labeling framework and MRC. (3) MoM learning improved the performance of the entity classes without compromising the performance of the -class in language- and model-agnostic.
II Related Work
This section describes two primary methods for tackling the data imbalance in ML tasks: the sampling-based method and cost-sensitive learning.
II-A Sampling-based Method
Common sampling methods, such as random oversampling (ROS) and random undersampling (RUS), are often used as a first choice. ROS duplicates randomly selected minority samples, whereas RUS utilizes only selected samples for training. These methods enhance the impact of the minority samples and fix the imbalance before training. Potential concerns with these methods are that ROS may lead to overfitting and increase the training time, whereas RUS may discard potentially effective training samples.
To overcome the limitations of these methods, various derived methods have been proposed [21, 22]. However, because NER involves sequential labeling, adjusting the number of sentences in training through these methods, it does not improve the word-related imbalance. Because these methods are unsuitable, especially in NER, where the imbalance are more severe than in other NLP tasks, we constructed a new method based on cost-sensitive learning.
II-B Cost-Sensitive Learning
Weighted cross-entropy (WCE) is commonly employed to address the data imbalance by assigning class-specific weights to the cross-entropy loss based on the number of samples in each class [10, 11, 12]. This method typically increases the weights of classes with few samples and decreases the weights of classes with many samples. Because the distribution based on samples using training and test only sometimes matches, WCE is unlikely to achieve the desired performance.
To overcome the limitations in WCE, FL [17] and DL [18] have demonstrated superior effectiveness in binary classification compared to WCE [23], and these methods have been proven effective in NLP tasks. These methods have been confirmed applicable to multiclass classification models, including extensions such as one-versus-the-rest and one-versus-one, as seen in conventional ML models (e.g., support vector machines [SVMs] and logistic regression). For instance, FL is a loss function to address the imbalance between the background and the target of an image in an object detection task (i.e., binary classification) of computer vision. FL adjusts weights by applying a power of to the predicted probability for each class. Conversely, DL defines loss based on the dice coefficient [24] (synonymous with the F1 score), which is the harmonic mean of precision and recall. To maximize this dice coefficient, the number 1 minus it is defined as the loss function. These method differ from WCE, as they allow weights to be set based on the difficulty in classification rather than the number of samples per class. As a result, the ML model minimizes the loss enabling accurate classifications, and increases the loss for misclassifications.
Our method is based on the cost-sensitive learning, and it addresses the data imbalances by considering losses separately for groups in which the most imbalances occur (i.e., majority and minority groups). When focusing on the groups, MoM learning significantly differs from the concept of adding weights based on the difficulty in classifying such as FL and DL. In addition, MoM learning does not require weights be set for each class, as in WCE.
III Proposed Method
This section describes the proposed method, MoM learning, which was MoM learning is designed for NER to improve the performance of ML models for data imbalance with a long-tail distribution, characterized by the many minority classes and one majority class (i.e., entity classes and -class).
III-A Notation
First, as a common approach to NER, we introduce the notation for sequential labeling. We consider a dataset comprising a set of input sentences and the corresponding training labels , where is the number of sentences in the dataset. The -th sentence split tokens and corresponding training labels are represented as and , respectively. is the number of tokens in the longest sentence in the dataset, and shorter sentences are padded up to .
The training label is annotated using the BIO format [25] in sequential labeling. This format consists of entity classes (e.g., PER, LOC, and ORG) and a non-entity class (i.e., the -class), where the former is represented by prefixing the entity category with B for the first token and I for the rest, as follows: B-PER, I-PER, B-LOC, etc. The sequence of predicted labels is denoted as , where the ML model estimates the predicted probabilities for each token of the sentence .
III-B Majority or Minority (MoM) Learning
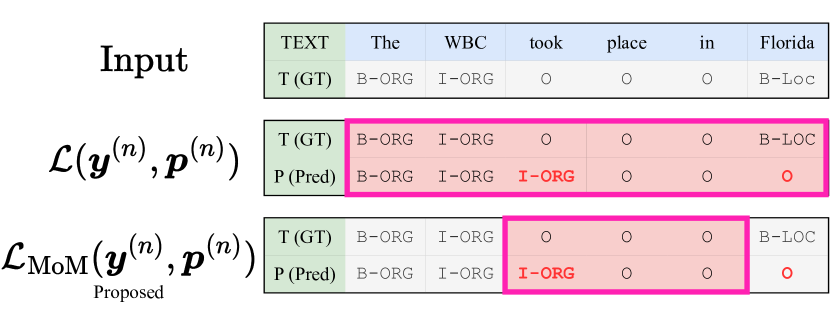
MoM learning is a simple and effective method that incorporates the loss for samples whose ground truth is a single majority class into the loss of an arbitrary conventional ML model. Fig. 1 illustrates the concept of MoM learning, where conventional loss represents an arbitrary loss function of the model, such as cross-entropy, which computes the loss for all samples boxed in red. The term only computes the loss whose ground truth is the -class (i.e., ) framed in red, and incorporates them into the conventional loss. The equation for the is presented as follows:
| (1) |
where is an arbitrary loss function, including cross-entropy, weighted cross-entropy, FL [17], DL [18], etc.
Because focuses only on the -class, certain entity classes misclassified by the model become inconsequential. Hence, functions as a pseudo-binary classification, distinguishing between the -class and the entity classes to detect the misclassifications of classes as entity class. MoM learning enables independence from such factors as the number of class samples, task features, and the model, making it adaptable to similarly imbalanced tasks.
For the -th sentence , the loss function , when applying MoM learning, is written as follows:
| (2) |
where is a hyperparameter that controls the trade-off between and . MoM learning simplifies weights adjustments compared to WCE, with a single hyperparameter . Finally, the model loss is minimized with the training labels for the entire dataset as and the prediction probabilities as :
| (3) |
MoM learning can also be considered a type of multitask learning [26] that improves the performance by learning several similar tasks simultaneously and has achieved good results against the data imbalance in various fields [27, 28, 29].
| Lang. | # train | # val | # test | # class | # -sample | # entities sample | ||
|---|---|---|---|---|---|---|---|---|
| CoNLL2003 [5] | En | 14,041 | 3,250 | 3,453 | 9 | 248,818 | 53,993 | 0.8217 |
| OntoNotes5.0 [6] | En | 75,187 | 9,603 | 9,479 | 37 | 1,441,685 | 190,310 | 0.8834 |
| KWDLC [13] | Ja | 12,836 | 1,602 | 1,613 | 17 | 236,290 | 16,694 | 0.9340 |
| NER Wiki [14] | Ja | 4,274 | 535 | 534 | 17 | 80,944 | 17,552 | 0.8218 |
IV Experiments
This section describes the evaluation experiments used, including sequential labeling and MRC, followed by the datasets, loss functions, and the implementation details. Considering the data variability, the evaluation was based on the average of the results of 10 random seeds in each condition. In all evaluations, we performed paired t-tests () to identify differences between our method and other best methods where is the significance level.
IV-A NER Frameworks
Sequential labeling framework
The sequential labeling classifies at the token level and yield the data imbalance with a long-tail distribution. This framework directly addresses NER as a multiclass classification. Thus, we used the macro F1 score as an evaluation criterion.
MRC framework
Compared to the sequential labeling, the MRC, another practical framework for NER, has been widely used in recent years [19] in binary classification tasks. This framework determines whether each word belongs to a particular class and to find its range. Specifically, for a token in a sentence , the ground truth can be written as , where is the set of entity and non-entity classes. Different from the macro F1 score for sequential labeling, we used the macro F1 score, which matches the index of the predicted start and end points.
| English | |||
|---|---|---|---|
| Model | Pre-train model | CoNLL2003 | OntoNotes5.0 |
| BERT | BERT-base-cased | 0.175 | 0.125 |
| RoBERTa | xlm-roberta-base | 0.209 | 0.041 |
| BERT-MRC | BERT-base-cased | 0.446 | |
| Japanese | |||
| Model | Pre-train model | KWDLC | Wiki |
| BERT | Tohoku University BERT-base | 0.357 | 0.212 |
| RoBERTa | Waseda University RoBERTa-base | 0.291 | 0.248 |
IV-B Datasets
We used four datasets, as shown in Table I: English CoNLL2003 [5], English OntoNotes5.0 [6], Kyoto University web document read corpus (KWDLC; in Japanese) [13], and Stockmark NER wiki (NER wiki; in Japanese) [14]. In addition, we evaluated with four datasets using sequential labeling. For MRC, we used the CoNLL2003, which has been adopted in previous studies, by converting the data from sequential labeling annotations. For the English datasets, we employed the standard training, validation, and test data provided, and for the Japanese datasets without the standard ones we randomly split the data 8:1:1. # -sample and # entities sample are presented the number of -class and entity classes, respectively. The imbalance rate is the ratio of the number of -class samples to the total number of samples.
IV-C Loss Functions
We compared the prediction performance of MoM learning with that of conventional learning methods (i.e., loss functions) that have long been considered state-of-the-art and used widely for the data imbalance.
WCE
The WCE is one of the most generally used weighted loss functions, and we consider the following variants: (1) the inverse class frequency (WCE-1), and (2) a hyperparameter related to the number of samples (WCE-2). The WCE loss, for any class of any one sentence in the NER is defined as follows:
| (4) |
As in our experiments, WCE-1 is set as the inverse class frequency and WCE-2 is set as , used in a DL paper [18], where is the number of samples for class , is the total number of train samples and is a hyperparameter.
FL
The FL [17] is a more robust and versatile loss [32, 33] proposed later than WCE:
| (5) |
where is a hyperparameter to reduce the relative loss for well-classified samples. Because FL was designed for binary classification, we extended the FL with a one-versus-the-rest method in the sequential labeling.
DL
The DL [18] was designed to reduce both false positives and false negatives and has long been considered a state-of-the-art method focused on MRC:
| (6) |
where and are hyperparameters of reducing the relative loss for well-classified samples and smoothing, respectively.
| CoNLL2003 | OntoNotes5.0 | KWDLC | Stockmark NER Wiki | |||||||||
| Prec. | Rec. | F1 | Prec. | Rec. | F1 | Prec. | Rec. | F1 | Prec. | Rec. | F1 | |
| BERT | 90.16 | 91.86 | 91.00 | 87.41 | 89.07 | 88.23 | 70.92 | 73.96 | 72.41 | 77.32 | 81.04 | 79.13 |
| w/ WCE-1 | 89.73 | 92.15 | 90.93 | 85.66 | 90.28 | 87.91 | 62.79 | 78.32 | 69.70 | 73.65 | 80.28 | 76.82 |
| (-0.07) | (-0.32) | (-2.71) | (-2.31) | |||||||||
| w/ WCE-2 | 89.94 | 92.22 | 91.07 | 86.81 | 89.67 | 88.22 | 68.86 | 77.23 | 72.80 | 75.72 | 81.19 | 78.36 |
| (+0.07) | (-0.01) | (+0.39) | (-0.77) | |||||||||
| w/ FL | 90.33 | 92.03 | 91.17 | 87.62 | 89.15 | 88.39 | 71.88 | 74.27 | 73.05 | 77.79 | 81.53 | 79.61 |
| (+0.17) | (+0.16) | (+0.64) | (+0.48) | |||||||||
| w/ MoM | 90.41 | 92.27 | 91.33 | 87.39 | 89.84 | 88.60 | 72.54 | 74.13 | 73.32 | 78.13 | 81.61 | 79.83 |
| (proposed) | (+0.33) | (+0.37) | (+0.91) | (+0.70) | ||||||||
| CoNLL2003 | OntoNotes5.0 | KWDLC | Stockmark NER Wiki | |||||||||
| Prec. | Rec. | F1 | Prec. | Rec. | F1 | Prec. | Rec. | F1 | Prec. | Rec. | F1 | |
| RoBERTa | 89.93 | 91.56 | 90.74 | 88.24 | 90.00 | 89.11 | 77.11 | 81.66 | 79.31 | 81.07 | 84.45 | 82.72 |
| w/ WCE-1 | 85.86 | 91.31 | 88.50 | 59.55 | 82.59 | 69.20 | 46.85 | 77.38 | 58.31 | 39.51 | 49.58 | 43.98 |
| (-2.24) | (-19.91) | (-21.00) | (-38.74) | |||||||||
| w/ WCE-2 | 89.88 | 91.94 | 90.90 | 86.61 | 90.49 | 88.51 | 68.86 | 77.23 | 72.80 | 75.72 | 81.19 | 78.36 |
| (+0.16) | (-0.60) | (-6.51) | (-4.36) | |||||||||
| w/ FL | 90.97 | 91.11 | 91.04 | 88.35 | 90.09 | 89.22 | 80.12 | 82.44 | 81.28 | 81.41 | 85.07 | 83.24 |
| (+0.30) | (+0.11) | (+1.93) | (+0.52) | |||||||||
| w/ MoM | 91.11 | 91.27 | 91.19 | 88.34 | 90.16 | 89.25 | 81.10 | 82.60 | 81.85 | 81.85 | 85.23 | 83.54 |
| (proposed) | (+0.45) | (+0.14) | (+2.54) | (+0.82) | ||||||||
| w/ MoM | BERT | ||||||
|---|---|---|---|---|---|---|---|
| Prec. | Rec. | F1 | Prec. | Rec. | F1 | Diff | |
| MISC | 79.18 | 84.58 | 81.78 | 79.21 | 84.04 | 81.54 | +0.24 |
| LOC | 92.91 | 93.50 | 93.20 | 92.60 | 93.49 | 93.04 | +0.16 |
| ORG | 89.87 | 93.17 | 91.54 | 89.90 | 92.70 | 91.27 | +0.27 |
| PER | 97.66 | 97.88 | 97.77 | 97.76 | 97.55 | 97.65 | +0.12 |
| 99.72 | 99.28 | 99.50 | 99.69 | 99.31 | 99.50 | 0.00 | |
| CoNLL2003 | |||
| Prec. | Rec. | F1 | |
| BERT-MRC (baseline) | 92.43 | 92.22 | 92.32 |
| BERT-MRC + FL | 92.95 | 92.10 | 92.52 |
| (+0.20) | |||
| BERT-MRC + DL | 92.69 | 92.43 | 92.56 |
| (+0.24) | |||
| BERT-MRC + MoM | 92.99 | 92.51 | 92.75 |
| (proposed) | (+0.43) | ||
IV-D Implementation Details
Models
We utilized pre-trained models, as shown in Table II, where the input length of these models was determined by the maximum number of tokens in a sentence () with padding tokens ([PAD]) used for filling the remaining space to maintain a consistent length. We fine-tuned in 10 epochs using the Adam optimizer [34] for each task.
During sequential labeling, we used pre-trained BERT [15] and RoBERTa [16] as baseline models. In the latter part of the -dimensional special classification ([CLS]) token of these models, we attached a new head of two-layered fully connected neural networks, and the head was trained to minimize the cross-entropy loss for each token. As such, these models output the predicted probabilities of each class corresponding to the words in the text. We set to 768, a learning rate of and a batch size of 64, respectively.
In MRC, we used BERT-MRC [19] as the baseline model, where the latter part of the [CLS] token, we used the same architecture as sequential labeling with changed to . As such, this model outputs a range corresponding to an entity for a sentence and binary classification. We set a learning rate of and a batch size of 32, respectively.
Hyperparameters
Tree-Structured Parzen Estimator (TPE) [30], implemented in the Bayesian optimization library Optuna [31], to maximize the F1 score of the validation data. For the sequential labeling experiments, the hyperparameters of WCE-2 () and FL () were explored in the pre-determined range of 1.0-10.0 and 0.0-10.0, respectively, considering their papers [17, 18]. For the MRC experiments, we set the hyperparameters of FL and those of DL and , which is based on the DL hyperparameters carefully tuned in [18]. The hyperparameters of MoM () were explored in the pre-determined range of 0.0-1.0 in both frameworks. We show the results of tuning the MoM hyperparameter in Table II.
V Results
Tables III and IV present a comparison of the performances of each method using BERT and RoBERTa in sequential labeling. We confirmed that MoM learning consistently outperforms other tested methods across all four datasets, regardless of these models. In all results (4 datasets 2 models), the performance using MoM learning was significant at against the other best method (FL). In the OntoNotes5.0 results with RoBERTa (marked as ), MoM learning was slightly less significant, but it was significant compared to the baseline CE. The results using WCE-1 and WCE-2 demonstrated a poor performance compared to the baseline, and the reason for this are discussed in Sec. VI.
Table V presents a comparison between the baseline with/without MoM learning for each entity in the CoNLL2003. The prefixes of the entity classes B and I are merged to show the average performance of the respective classes, resulting in nine classes (e.g., B-PER, I-PER, B-LOC and ) becoming five classes (e.g., PER, LOC, and ). We confirm that the MoM learning improves the performance of entity classes without compromising the performance of the -class.
Table VI presents the performance with the CoNLL2003 dataset using the MRC. The results confirm MoM learning also demonstrated the best performance and was significant at , against the other best method DL.
VI Discussion
The most important factor in NER is the score of the entity classes, rather than the overall score, including -class, as the prediction performance of NER generally concerns the score including the -class. In practical situations in which entities are extracted and utilized, the performances of the entity classes hold greater significance. Although MoM learning appears a marginal improvement, we confirm MoM learning improves the performance of minor entity classes without sacrificing the performance of the major -class, regardless of the language and models.
For WCE, we attempted two methods (i.e., WCE-1 and WCE-2); however, a poor performance than the baseline CE was observed, highlighting the challenges posed by multiclass NER with its inherent long-tail distribution. As evidenced by various ML tasks, conventional weighting methods struggle with the delicate design of loss functions dependent on specific datasets and tasks [35, 36]. Thus, the experiments in Tables III and IV highlight the difficulty of applying WCE weighting to the sequential labeling of NER.
MoM learning was effective at sequential labeling and MRC, especially the latter, where we observe the role of MoM learning in monitor the number of entities. For example, in the sentence “Estadio Santiago Bernabéu opened in 1974.”, “Estadio”, “Santiago” and “Bernabéu” are assigned the classes B-LOC, I-LOC, I-LOC, and other words are assigned the -class, respectively. when considering a basic sentence, it is highly likely that the word (“opened”) following the last word (“Bernabéu”) of the entity belongs to I-LOC or -class because sequences of different entity words are extremely rate, such as LOCATION after PERSON. Because MoM learning focus more on -class words, the model can learn whether the final word belongs to the I-LOC or -class. In other words, the MoM can monitor how many entity words are consecutive, which is a factor in the improved performance of the words at the end of the entity.
VII Conclusion
In this paper, we proposed a novel learning method, MoM learning, to address NER task characterized by the data imbalance with a long-tail distribution consisting of a single class with many samples (the majority class) and multiple classes with a few samples (the minority classes). MoM learning is a simple and effective method that suppresses misclassifications of majority as minority classes by incorporating the loss of samples which ground truth is the majority class into the loss of conventional ML models. Evaluation experiments using four datasets (English and Japanese) showed that MoM learning outperforms existing and even state-of-the-art methods in addressing data imbalances regardless of language, model, or framework, whether sequential labeling or MRC.
References
- [1] D. Nadeau and S. Sekine, “A survey of named entity recognition and classification,” Lingvisticae Investigationes, vol. 30, no. 1, pp. 3–26, 2007.
- [2] G. Lample, M. Ballesteros, S. Subramanian, K. Kawakami, and C. Dyer, “Neural architectures for named entity recognition,” arXiv preprint arXiv:1603.01360, 2016.
- [3] J. Guo, G. Xu, X. Cheng, and H. Li, “Named entity recognition in query,” in Proc. of the 32nd international ACM SIGIR conference on Research and development in information retrieval, 2009, pp. 267–274.
- [4] R. Ramachandran and K. Arutchelvan, “Named entity recognition on bio-medical literature documents using hybrid based approach,” Journal of Ambient Intelligence and Humanized Computing, pp. 1–10, 2021.
- [5] E. T. K. Sang and F. De Meulder, “Introduction to the CoNLL-2003 Shared Task: Language-Independent Named Entity Recognition,” in Proc. of the Seventh Conference on Natural Language Learning at HLT-NAACL 2003, 2003, pp. 142–147.
- [6] S. Pradhan, A. Moschitti, N. Xue, H. T. Ng, A. Björkelund, O. Uryupina, Y. Zhang, and Z. Zhong, “Towards robust linguistic analysis using ontonotes,” in Proc. of CoNLL, 2013, pp. 143–152.
- [7] S. Pouyanfar, Y. Tao, A. Mohan, H. Tian, A. S. Kaseb, K. Gauen, R. Dailey, S. Aghajanzadeh, Y.-H. Lu, S.-C. Chen et al., “Dynamic sampling in convolutional neural networks for imbalanced data classification,” in Proc. of MIPR, 2018, pp. 112–117.
- [8] M. Buda, A. Maki, and M. A. Mazurowski, “A systematic study of the class imbalance problem in convolutional neural networks,” Neural networks, vol. 106, pp. 249–259, 2018.
- [9] T. Mikolov, I. Sutskever, K. Chen, G. S. Corrado, and J. Dean, “Distributed representations of words and phrases and their compositionality,” Proc. of NeurIPS, vol. 26, 2013.
- [10] H. Adel, F. Chen, and Y.-Y. Chen, “Ranking convolutional recurrent neural networks for purchase stage identification on imbalanced Twitter data,” in Proc. of EACL, 2017, pp. 592–598.
- [11] H. T. Madabushi, E. Kochkina, and M. Castelle, “Cost-sensitive bert for generalisable sentence classification on imbalanced data,” in Proc. of NLP4IF, 2019, pp. 125–134.
- [12] J. Li and L. Xiao, “syrapropa at semeval-2020 task 11: Bert-based models design for propagandistic technique and span detection,” in Proc. of SemEval, 2020, pp. 1808–1816.
- [13] M. Hangyo, D. Kawahara, and S. Kurohashi, “Building a diverse document leads corpus annotated with semantic relations,” in Proc. of PACLIC, 2012, pp. 535–544.
- [14] T. Omi, “stockmarkteam/ner-wikipedia-dataset: Japanese Named Entity Extraction Dataset using Wikipedia,” 2021. [Online]. Available: https://github.com/stockmarkteam/ner-wikipedia-dataset
- [15] J. Devlin, M.-W. Chang, K. Lee, and K. Toutanova, “BERT: Pre-training of Deep Bidirectional Transformers for Language Understanding,” in Proc. of NAACL-HLT, 2019, pp. 4171–4186.
- [16] Y. Liu, M. Ott, N. Goyal, J. Du, M. Joshi, D. Chen, O. Levy, M. Lewis, L. Zettlemoyer, and V. Stoyanov, “Roberta: A robustly optimized bert pretraining approach,” CoRR preprint arXiv:1907.11692, 2019.
- [17] T.-Y. Lin, P. Goyal, R. Girshick, K. He, and P. Dollár, “Focal loss for dense object detection,” in Proc. of ICCV, 2017, pp. 2980–2988.
- [18] X. Li, X. Sun, Y. Meng, J. Liang, F. Wu, and J. Li, “Dice loss for data-imbalanced nlp tasks,” in Proc. of ACL, 2020, pp. 465–476.
- [19] X. Li, J. Feng, Y. Meng, Q. Han, F. Wu, and J. Li, “A unified mrc framework for named entity recognition,” in Proc. of ACL, 2020, pp. 5849–5859.
- [20] Y. Zhang and H. Zhang, “Finbert–mrc: Financial named entity recognition using bert under the machine reading comprehension paradigm,” Neural Processing Letters, pp. 1–21, 2023.
- [21] S. Barua, M. M. Islam, X. Yao, and K. Murase, “MWMOTE–majority weighted minority oversampling technique for imbalanced data set learning,” IEEE TKDE, vol. 26, no. 2, pp. 405–425, 2012.
- [22] Y.-P. Zhang, L.-N. Zhang, and Y.-C. Wang, “Cluster-based majority under-sampling approaches for class imbalance learning,” in Proc .of ICIFE, 2010, pp. 400–404.
- [23] T. D. Tran, M. N. Ha, L. H. B. Nguyen, and D. Dinh, “Improving multi-grained named entity recognition with BERT and focal loss,” ICIC Express Letters, Part B: Applications, vol. 12, no. 3, pp. 291–299, 2021.
- [24] R. R. Shamir, Y. Duchin, J. Kim, G. Sapiro, and N. Harel, “Continuous dice coefficient: a method for evaluating probabilistic segmentations,” CoRR preprint arXiv:1906.11031, 2019.
- [25] L. A. Ramshaw and M. P. Marcus, “Text chunking using transformation-based learning,” in Natural language processing using very large corpora, 1999, pp. 157–176.
- [26] R. Caruana, “Multitask learning,” Machine learning, vol. 28, no. 1, pp. 41–75, 1997.
- [27] Y. Zhang, Y. Wei, and Q. Yang, “Learning to multitask,” Proc. of NeurIPS, vol. 31, 2018.
- [28] S. Kitada, H. Iyatomi, and Y. Seki, “Conversion prediction using multi-task conditional attention networks to support the creation of effective ad creatives,” in Proc. of KDD, 2019, pp. 2069–2077.
- [29] A. Spangher, J. May, S.-R. Shiang, and L. Deng, “Multitask semi-supervised learning for class-imbalanced discourse classification,” in Proc. of EMNLP, 2021, pp. 498–517.
- [30] J. Bergstra, R. Bardenet, Y. Bengio, and B. Kégl, “Algorithms for hyper-parameter optimization,” Advances in neural information processing systems, vol. 24, 2011.
- [31] T. Akiba, S. Sano, T. Yanase, T. Ohta, and M. Koyama, “Optuna: A next-generation hyperparameter optimization framework,” in Proc. of KDD, 2019, pp. 2623–2631.
- [32] R. Iikura, M. Okada, and N. Mori, “Improving bert with focal loss for paragraph segmentation of novels,” in Distributed Computing and Artificial Intelligence, 17th International Conference. Springer, 2021, pp. 21–30.
- [33] J. Liu, X. Duan, R. Zhang, Y. Sun, L. Guan, and B. Lin, “Relation classification via bert with piecewise convolution and focal loss,” Plos one, vol. 16, no. 9, p. e0257092, 2021.
- [34] D. P. Kingma and J. Ba, “Adam: A method for stochastic optimization,” arXiv preprint arXiv:1412.6980, 2014.
- [35] S. Valverde, M. Cabezas, E. Roura, S. González-Villà, D. Pareto, J. C. Vilanova, L. Ramió-Torrentà, À. Rovira, A. Oliver, and X. Lladó, “Improving automated multiple sclerosis lesion segmentation with a cascaded 3d convolutional neural network approach,” NeuroImage, vol. 155, pp. 159–168, 2017.
- [36] S. Jadon, “A survey of loss functions for semantic segmentation,” in Proc. of CIBCB, 2020, pp. 1–7.