Formation and Study of a Spherical Plasma Liner for Plasma-Jet-Driven Magneto-Inertial Fusion
Abstract
Plasma-jet-driven magneto-inertial fusion (PJMIF) is an alternative approach to controlled nuclear fusion which aims to realize a line-replaceable dense plasma liner as a repetitive spherical compression driver. First experimental measurements on the formation of a spherical Argon plasma liner formed from 36 discrete pulsed plasma jets are obtained on the Plasma Liner Experiment (PLX). Liner uniformity and morphology, plasma density, and temperature are assessed at times throughout the implosion process.
I Introduction:
Magneto-inertial fusion (MIF, also called magnetized target fusion or MTF) is an approach to controlled nuclear fusion which marries aspects of both magnetic confinement fusion and inertial confinement fusion methods, enabling controlled fusion at more modest values of both confinement time and density [1, 2]. Many MIF compression approaches and configurations have been proposed and studied, including the MagLIF Z-pinch configuration [3], shear-flow-stabilized Z pinches [4], spherical piston-driven liquid metal liners [5], rotationally stabilized liquid metal liners[6], and staged-gas-puff Z-pinches[7]. Notably, MagLIF experiments have successfully produced thermonuclear conditions and significant neutron yields from the compression of preheated magnetized deuterium fuel, on implosion timescales significantly longer than can be tolerated in pure inertial fusion.
The plasma-jet-driven magneto-inertial fusion (PJMIF) [8] concept is an MIF approach in which the requisite heavy compressive liner is formed from the merging and spherical convergence of an array of discrete plasma jets. PJMIF aims to access an attractive subsection of the MIF physics parameters space, namely that of the moderate velocity (50-150 km/s) compression of high-beta high-Hall-parameter targets which have shown promise in MagLIF [2]. If successful, this architecture would enable repetitive line-replaceable operation with a significant standoff distance between the fusion plasma and driver hardware, which is a significant challenge facing all pulsed fusion concepts, in particular those seeking to utilize electrical pulsed-power as the primary energy source [1, 8].
There are several key questions regarding the viability of the PJMIF approach, including whether conditions of sufficient energy density and fusion gain can be attained while maintaining the physical standoff that is the attractiveness of the approach, whether sufficient uniformity of a spherical liner can be attained from the merger of discrete jets in the face of jet-on-jet shock waves and deceleration-phase Rayleigh-Taylor instabilities [9, 10, 11], and whether effective magnetic insulation of a standoff target plasma can be achieved in spherical implosion geometry. Prior investigations have shed light on several of these questions, with analytical and computational modeling predicting the feasibility of significant fusion gain [12], the realization of high-performance modular plasma guns to produce controlled plasma jets [13], and laboratory experiments studying the merging and formation processes of multiple plasma jets at representative velocities [14, 15].
In the present work, fully spherical plasma liners have been formed and investigated at the Plasma Liner Experiment (PLX). This experiment uses 36 individual argon plasma jets, enabling observation of the integrated liner assembly process for the first time. The discussion of the full liner experimental campaign is organized as follows: Section II details the pulsed power setup and plasma jet formation and tuning, Section III describes what plasma properties are measured and the diagnostics used to do so, and Section IV presents the results of the diagnostic suite and implications for PJMIF as a whole. Considerations necessary for continuation and an eventual reactor-scale device are explored in Section VI as well as a concluding summary of points.
II Experiment:

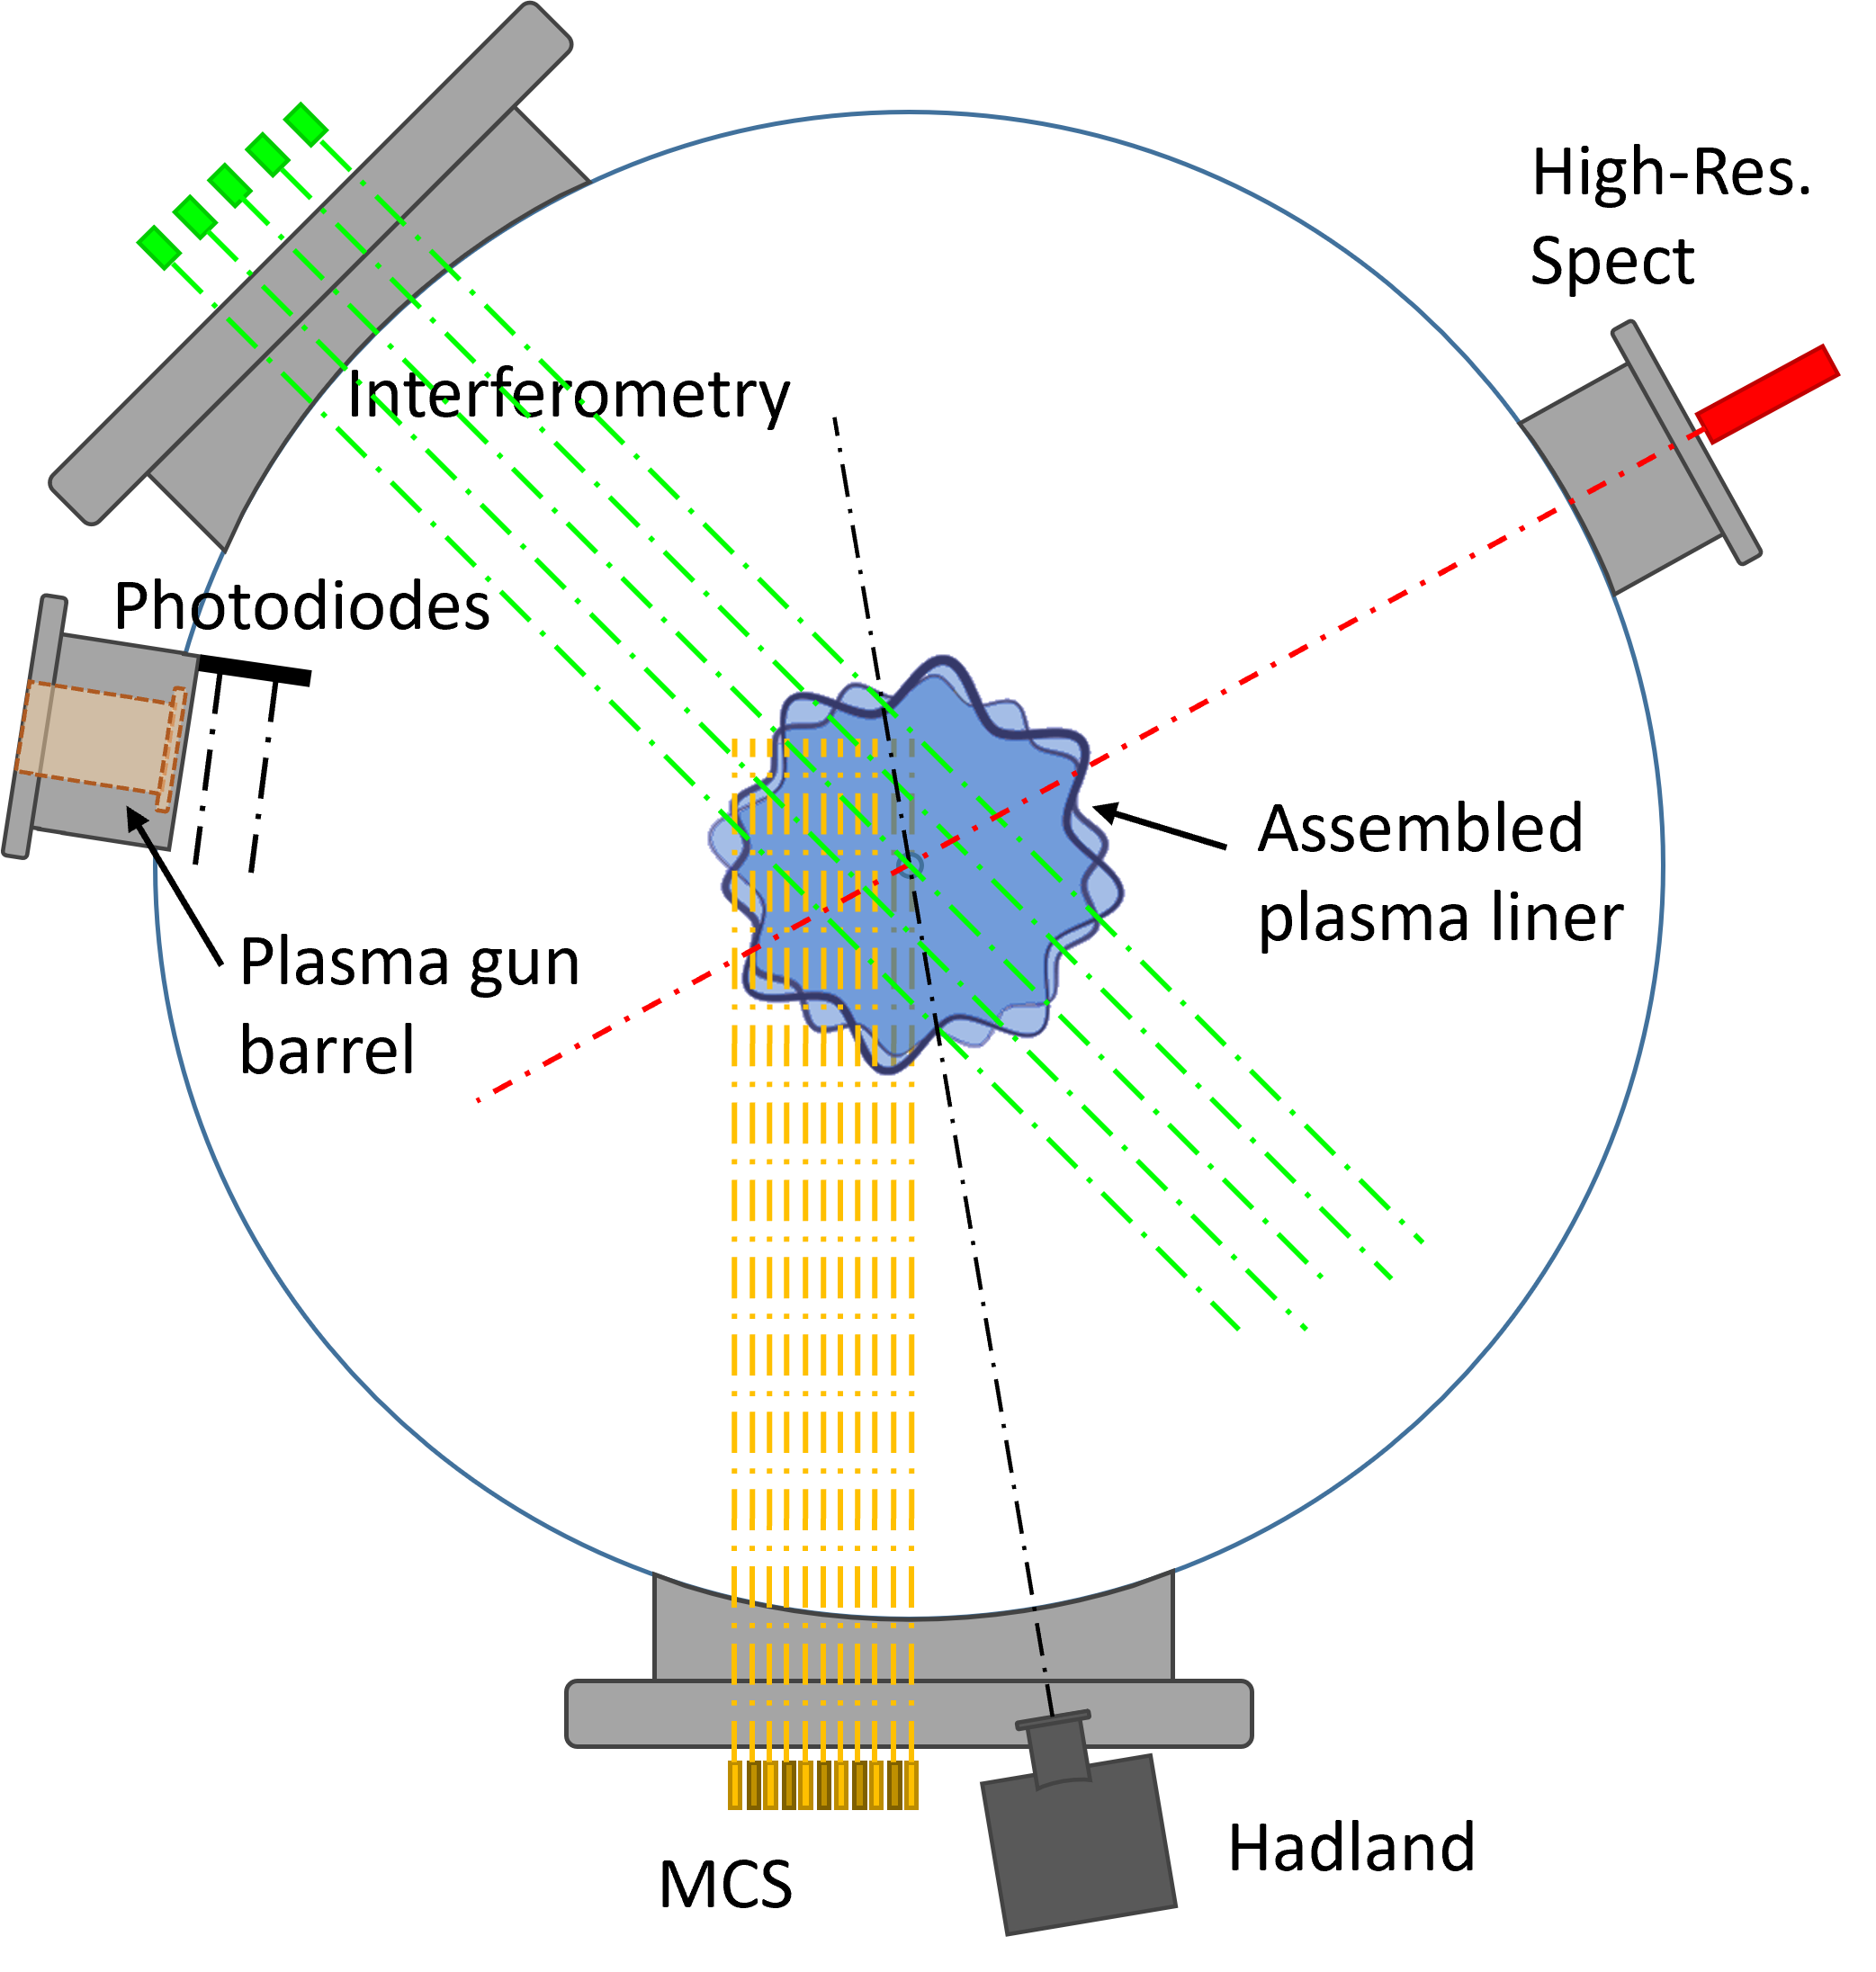
PLX consists of a 3-meter diameter chamber and 36 attached plasma guns, shown in Fig. 1 along with a rendered cross section of the chamber and notional plasma liner and target within [16]. The plasma guns are positioned quasi-spherically over the chamber, with a typical full-angle between adjacent guns of 22 degrees. Chamber vacuum base pressure just before the plasma is injected into the chamber is typically around 1 torr, increasing to 10 Torr when a turbopump gate valve is closed before the plasma shot.
The plasma guns that supply the liner-forming plasma jets are contoured-gap coaxial plasma railguns - the unique contoured shape of the inner electrode alleviates the blowby instability in such geometries that can hinder outgoing jet quality. The guns used in the present PLX work are similar to those described in detail in Ref[13], although the PLX ones are a newer and more compact design. The stored energy per gun per pulse is 4.5-6 kJ, which accelerates jets of total mass 1 mg of argon plasma to typical tunable velocities between 30 and 70 km/s out of a barrel that is 8.5 cm in diameter. Most of the plasma gun capacitor banks and spark-gap switches are mounted directly onto the chamber to minimize transfer inductance to the plasma load and increase energy coupling. Due to space access limitations around the lowest ports of the PLX chamber, nine guns are instead linked to their capacitor banks via an array of transmission lines, referred to hereafter as transmission line (TL) guns. Plasma properties of the jets at the time of ejection have been explored in previous publications [17]; typically for a given jet around ejection time, eV and cm-3.
Four distinct collections of capacitor banks are activated when firing a PLX shot. The first is a high voltage (19.0 kV) modified-Blumlein trigger network for the plasma gun gas valves (GV). This sends 36 trigger pulses down coaxial cables trigger 36 spark gap switches operating the gas valve capacitor banks of the plasma guns. Each jet has a separate 100 J GV capacitor bank, powering a custom fast-acting gas puff valve that supplies the neutral argon gas injection into the guns. An adjustable time delay passes while gas valves operate and neutral gas flows into the bore of the plasma guns, typically 480 microseconds in the current experiments. Thirdly, another modified-Blumlein trigger network fires, to breakdown the parallel spark-gaps for the main gun banks. These banks have 575 F rated to 5 kV peak voltage, and provide most of the current to form and accelerate the plasma jet. The main bank is discharged across a set of six spark-gap switches to the coaxial rail electrodes, again to minimize transfer inductance and prolong switch electrode lifetime. Operating voltages are set to 4.0 kV for non-TL guns, while the TL guns described above are charged 4.5 kV to compensate for the increased transfer inductance of their transmission lines. Time is defined as when the main trigger pulse for the main accelerating banks is sent. Pressure adjustments can be made to many of the spark-gap switches on an individual basis to ensure they all break down properly with the trigger pulse. A resistive circuit in parallel with the PFN spark-gap trigger switches produces pre-ionization at the breech - this preionization reduces time jitter of the bulk plasma breakdown and subsequent acceleration generated by the main bank.
These component voltages can be adjusted for varying effects: a higher main trigger voltage can reduce firing jitter but increases probability of prefiring and arcing between components; main bank charge voltage establishes the overall energy with which the jets are ionized and accelerated; GV charge voltages establish how much gas is injected into the breach and subsequently accelerated. Tuning the individual jet velocity is essential in this experiment, in order to ensure the jets arrive in the chamber at the same time and merge together with as high degree of spherical symmetry as possible. Adjusting the GV bank voltage provided the most robust means of tuning jet velocity, with the effect that a constant main bank energy accelerating a lower gas injected to higher ultimate velocity. To achieve a nominal jet front velocity of 50 km/s for each of the 36 jets, adjustments to this GV bank voltage for each individual gun are made approximately 2 seconds to firing to fine-tune the respective jet velocity. This tuning method enables significantly more flexible and easier adjustment than the previous method of introducing ballast impedence wires in series with the GV described in Appendix B of Ref[18]. Results in this paper are obtained using a nominal best tune of each gun to 50 km/s. The process of determining the best tune is described in Section III.2. Mach number , with , where adiabatic index is assumed and is the Argon ion mass. To estimate M, we will use calculations from previous work examining the exiting jet for temperature and . With these values, estimated ejection Mach number in the present experiment is around .
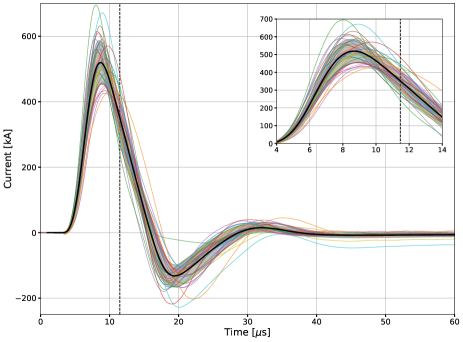
GV and main bank discharges are monitored using a set of Rogowski coils (six for the main bank, one for GV). Jet ejection time is taken as 2.5 s after the peak of the main bank signal. This ejection time relative to the signal peak is due to the Rogowski coils being positioned at the transmission lines at the back of the gun before the plasma travels down the barrel length and is expelled which takes about an additional 2.5 s. Fig. 2 shows a set of all 36 main bank Rogowski signals, the mean signal and standard deviation zone around it, and the mean ejection time given by the dashed line. Current ringing that can be observed after the primary accelerating current corresponding to the signal peak, as the underdamped capacitor circuit discharges its remaining energy into residual trailing plasma in the gun.
III Diagnostics:
A suite of diagnostics is used to interrogate the plasma liner properties throughout the merge and stagnation process. Time-resolved laser interferometry measurements of line-integrated plasma density are acquired over the duration of each shot, and a multi-frame fast camera images the plasma at several times throughout each shot. A collection of single-frame wide-view cameras are also used for imaging. Photodiode time-of-flight pairs are used measure individual jet velocities for each of the 36 plasma jets. Individual gun performance is also monitored using Rogowski coils that measure the main accelerating current of each gun (see Fig. 2). An imaging spectrometer provides electron temperature and charge state information and high-resolution spectrometer is used to verify electron density and jet slowing at chamber center. Diagnostics lacking inherent time-resolution are instead triggered at varying times for different shots to build up an average picture of temporal evolution of the liner.
III.1 Imaging
A multi-frame intensified Hadland UHSi24 camera in 12-frame mode and outfitted with a 24 mm focal length lens at f-number 11, provides a focused view of the chamber center where the ultimate liner stagnation occurs. A typical exposure time per frame of 25 ns is used with adjustable framerate set to 200 kHz. Additionally, a set of four single-frame PCO Pixelfly-USB cameras each outfitted with a 2.7 mm focal length fisheye lens at f-number 16 provide 1 s exposure wide-angle images of the entire chamber and liner assembly and convergence process. These are set into the chamber via re-entrant ports described in detail in Ref[19] so as to provide each with a view of the entire chamber interior. These Pixelfly cameras originally were intended to be used together (as a set of 6) to determine jet velocities of all 36 jets within a single shot [19], but the photodiode method described in the next subsection proved to be a more reliable method for jet velocimetry.
III.2 Photodiodes
Each gun is equipped with two light-collecting fibers positioned along the jet trajectory and spaced by 2 cm which feed to two photodiodes having sufficiently fast risetime to track the jet (5 ns). The 2 cm separation distance was selected as a compromise between two competing considerations: there must be enough time separation between the signals that the available digitization rate of 40 MHz does not significantly contribute to uncertainty (i.e. there are sufficient samples separating the two signals), and the closer together the fibers are the signals are more likely to be closely correlated in shape which enables easier analysis.
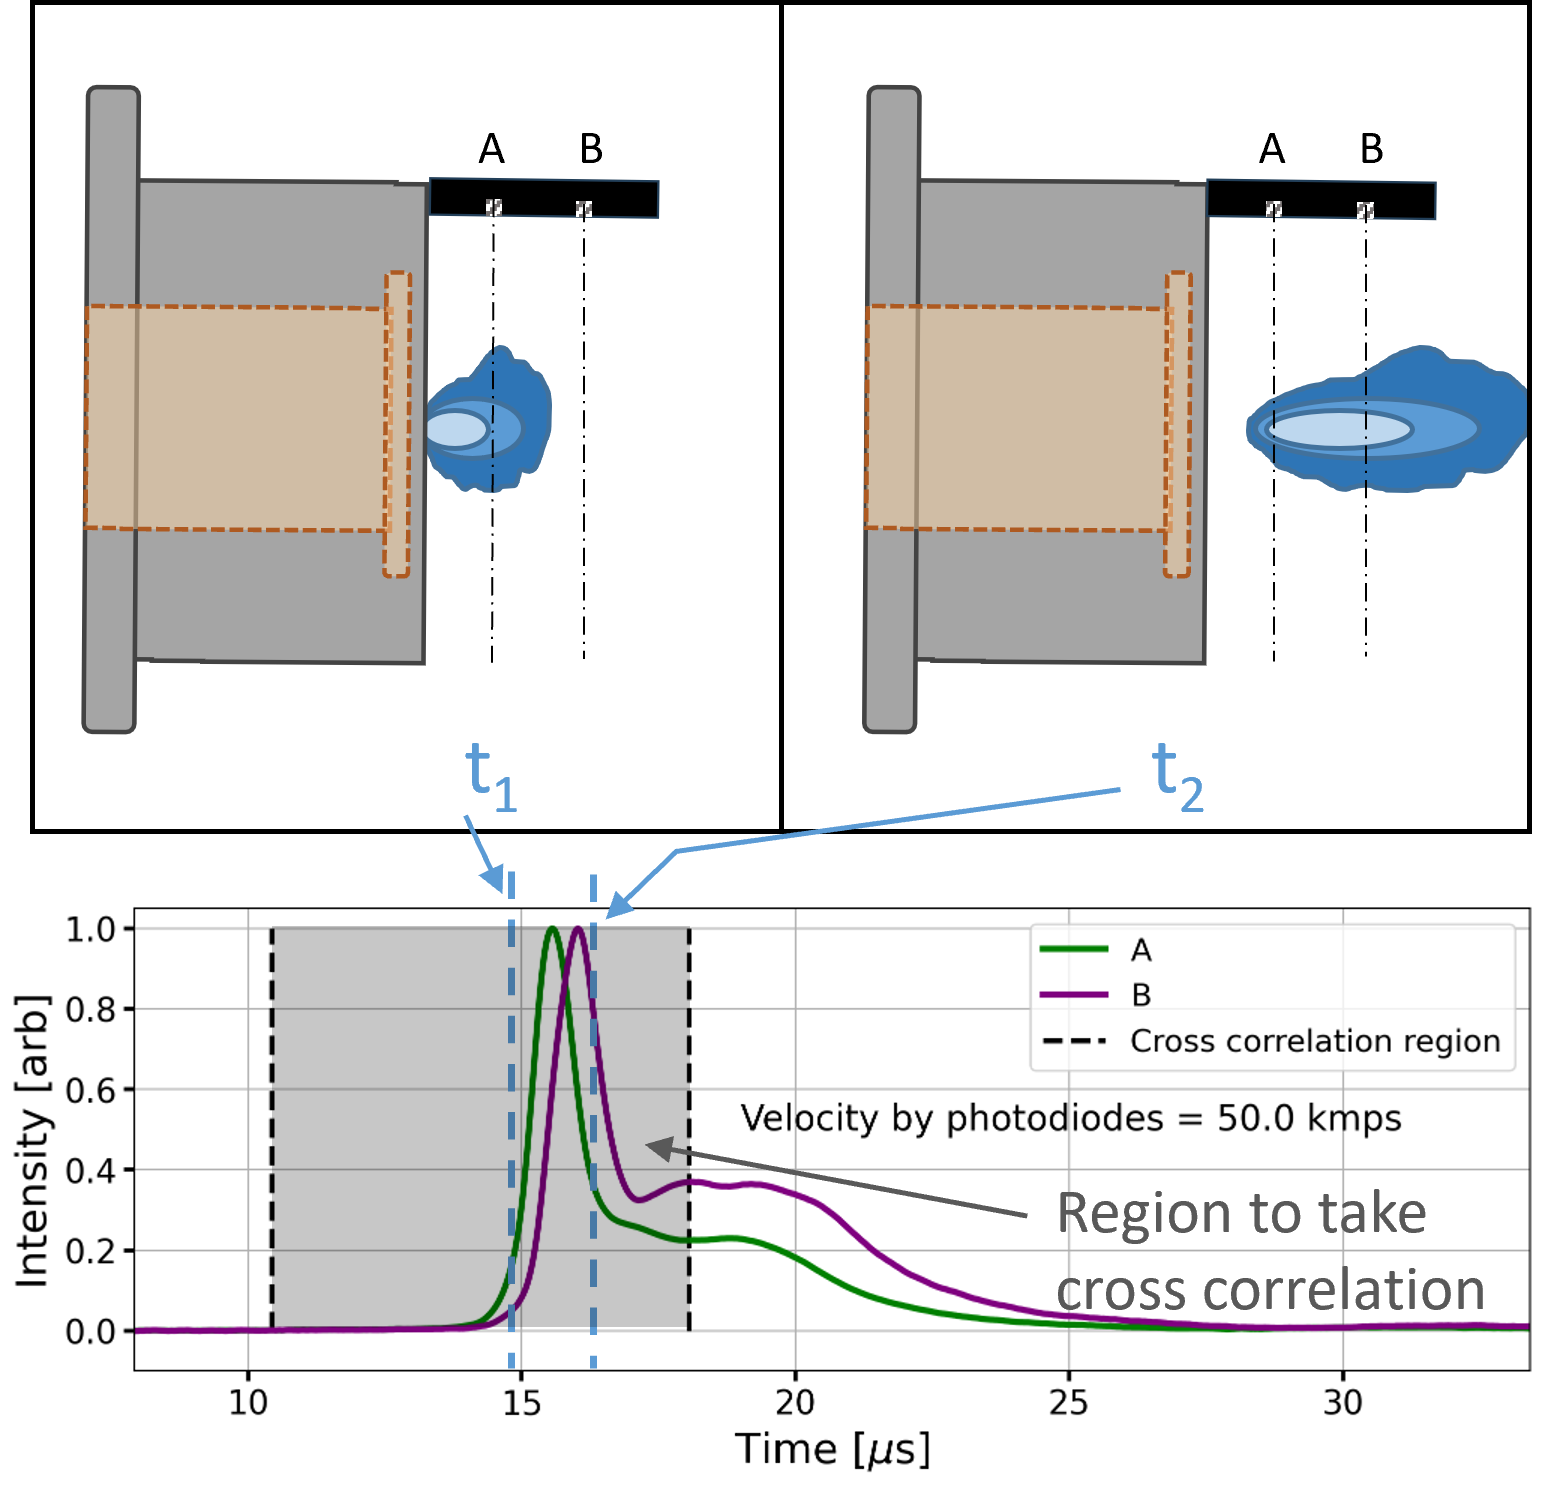
Fig. 4 shows a diagram of the two photodiode views of a jet, at two times of jet emergence from the gun cavity. The corresponding locations on normalized sample signal readouts are also indicated, along with the region within which a cross correlation is applied. The bounds of the cross correlation region are selected to be a few microseconds before the signal rises, and a few microseconds after the signal peak. This provides the jet front velocity. The jets consist of a distribution of directed velocities with the trailing portion being slower than the jet front, resulting in an extended column of plasma. The velocity analysis focused on the front region is used because it is this front forms the spherical liner to compress the MIF target and is therefore most relevant. The photodiode analysis process is automated and repeated for each gun and enables velocities to be measured immediately following each shot and tuned as desired by adjusting the GV bank voltage - this we call the tuned velocity setting.
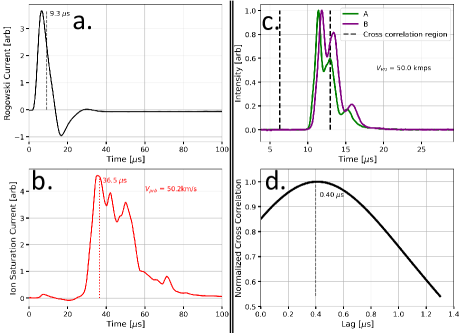
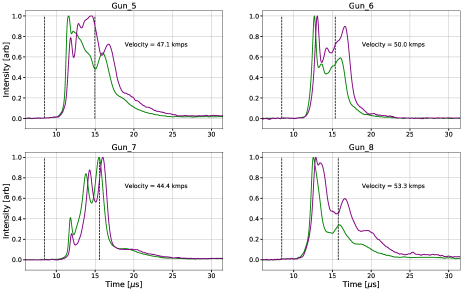
This photodiode pair time-of-flight velocimetry methodology was cross-checked by taking a set of shots with a single gun at a time while positioning a single-tip Langmuir probe at chamber center, and obtaining a jet velocity via the plasma time-of-flight to the probe () and comparing to the velocity inferred via the photodiode signals (). A typical comparison is shown in Fig. 5. We define the jet arrival time to the probe as the location corresponding to 20% of the full integral of the probe signal. This generally matches well with the first peak-like feature in the signal, as seen in subfigure b.
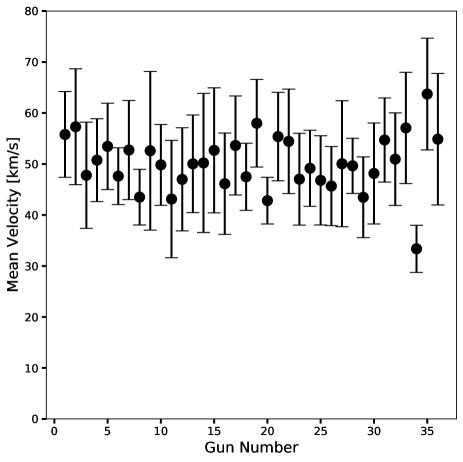
It was found that even with a careful analysis methodology, the photodiode velocimetry incurred additional shot-to-shot variation in inferred velocity compared to the probe time-of-flight technique. This is believed to be due to early time spatial structure and inhomogeneity in the plasma jet. A tune setting was selected for final use if the mean velocity measured on the photodiodes was 50 10 km/s over about 5 shots.
III.3 High-Resolution Monochromator
Single-emission-line shapes are acquired using a 2 m double-pass (for a 4 m focal length) high-resolution monochromator (McPherson 2062DP) with 2400 mm-1 grating and 50 m slit width, with the resulting spectrum captured with a 1 s exposure on a PCO Pixelfly camera. The emission studied in this work is the Ar II 480.60 nm line due to its relatively high intensity among the other visible band Ar II emission lines, in addition to a lack of local lines from higher ionization states or impurities. The line of sight (LOS) of this spectrometer is directly through PLX chamber center.
For this plasma emission line profile, there are three primary plasma factors that we find to impact the observed shape. Bulk motion of the plasma throughout the LOS causes Doppler shift of the observed emission wavelength, and a distribution of bulk plasma motion results in a corresponding distribution of shifts. Doppler broadening associated with the plasma temperature of this distribution is also present. Finally, Stark broadening associated with the electron density in the vicinity of emitters also impact the observed shape.
At the stagnation densities of cm-3, the time required for equilibration of electron and ion temperatures is far shorter than the s timescales over which the plasma evolves. We assess this using the Coulomb collision expression for temperature equilibration given in Eq. 1 in which species corresponds to ions and to electrons, and is the energy-exchange frequency in units of s-1 between electrons and ions given in Eq. 2:
| (1) |
| (2) |
With typical expected conditions of eV, cm-3, and supposing ion temperature is moderately elevated at eV, the resulting time required for temperature equilibration between electrons and ions is on the order of nanoseconds. Thus, and are also clamped to values around 2.5 eV - as indicated by broadband emission spectroscopy results in Section IV.3. Thus ultimately, Doppler broadening is found to be negligible in comparison to the other two broadening mechanisms, meaning that the high resolution lineshapes are more useful for density and residual velocity inference than for temperature determination.
III.4 Multi-Chord Interferometry
Line-integrated electron density is obtained in this work via a multi-chord heterodyne laser interferometry system [20]. The laser emission is produced using a 320 mW, 561 nm solid state laser, is split into multiple lower-power beams and injected into the chamber through five single-mode fiber optic cables with each probe beam about 0.3 cm in diameter. The scene chords of the interferometer are aligned parallel to one another, with a central chord passing through the center of the chamber, and the others in pairs, offset from the central by 12.75 cm and 25.5 cm respectively. Thus the chords measure the coarse radial density profile as well as provide a check against the spherical symmetry of the liner (if a perfectly spherical plasma liner is formed, the signals on the chord pairs should perfectly match). After passing through the plasma, the probe beams are compared with a reference beam of the interferometer in the Mach-Zender configuration, and the line-integrated electron density is computed based on the relative phase shift [21, 20].
III.5 Spatially-Resolved Emission Spectroscopy
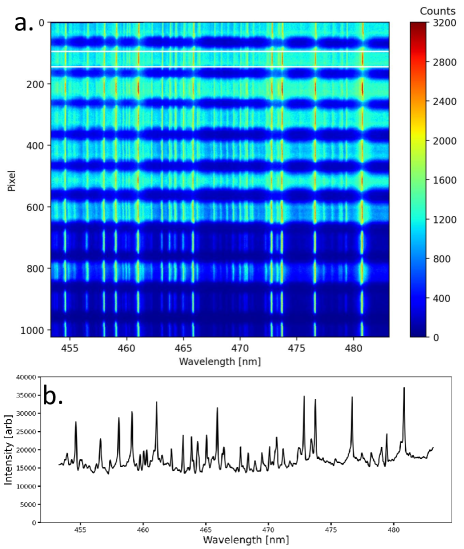
Spatially-resolved visible plasma emission spectra provides insight into LOS-integrated behavior of electron temperature via relative line emission intensities, and relative plasma density via observed Bremsstrahlung emission intensity. In the Multi-Chord Spectrometer (MCS), data is collected along 11 fiber-coupled lines of sight through 2.5 cm diameter collimators mounted outside the chamber. This light is sent through an imaging spectrometer, a Chromex 500is with 0.5 m focal length, a 1200 grooves/mm grating and 50 m slit for an effective resolution of 0.08 nm over the wavelength range used, 453.3 nm to 482.2 nm. A relative intensity calibration was applied based on a calibrated tungsten Thorlabs SLS201L lamp shining through the same set of windows and optics as the PLX plasma light traverses. An additional calibration measure was taken to normalize the total amount of light collected through each fiber; to do so, each fiber was illuminated individually with the lamp and imaged with constant camera settings, allowing for comparison of counts vs. wavelength for all fibers.
A sample spectral image is shown in Fig. 6, as well as a spectrum corresponding to the highlighted region of fiber 2 after vertical summing of region signal counts and applying the intensity calibration. This process is repeated for respective fiber regions to obtain the 11 chordal spectra per image. The presence or lack of emissions from the Ar ionization stages constrains the temperature regime to electron temperatures of few eV. More precisely, the best-fit line-integrated electron temperature is inferred by comparing the observed emission spectrum to a set synthetic spectra of varying temperature generated by the collisional-radiative spectral analysis model PrismSPECT. PrismSPECT generates an emission spectrum based on excited state densities that it calculates via a collisional-radiative model in a non-local thermodynamic equilibrium regime. The atomic level scheme utilized in the model includes excited states up to Ar IV, after which only ground states of ionic stages are considered (and are all of negligible populations).
The measured-to-synthetic spectra comparison is made after having subtracted off the continuum background from the MCS spectra. The PLX liner sweeps up residual air in the chamber as it travels inwards, so the observed spectra contain N and O lines in addition to the Ar lines, though no other contaminants are observed. The different chords of the MCS observe different amounts of these N and O lines relative to the Ar lines, so modeled spectra are generated for different elemental compositions as well. After the entire set of composite synthetic spectra at varying and compositions are generated, a simple least-squares method is performed to select that which matches closest to the observed MCS spectrum for a given chord, and we take that as the LOS-integrated representative temperature for that chord.
Another characteristic that the MCS provides is LOS-averaged plasma density relative to that of the central chord (this doesn’t involve comparison to PrismSPECT). This is a relative measurement due to lack of absolute intensity calibration with the spectrometers. Not considering all factors which do not depend strongly on density, the free-free (Bremsstrahlung) emissivity scales as:
| (3) |
and the free-bound (radiative recombination) emissivity scales as:
| (4) |
Our plasma is primarily comprised of Ar+ and Ar2+, so electron density . Given this, the combination of free-free emission and free-bound radiation scales as , so we need only have a reasonable knowledge of and mean charge state to have the necessary scaling relation between continuum intensity to spatially-resolved relative plasma density. These characteristics are quantified in Section IV.3. A notable feature discussed in that section is the presence of N and O constituents in the plasma which add their own contributions to and thus complicate the scaling behavior in and - however, we will still retain the relation as an approximation.
IV Results:
IV.1 Imaging
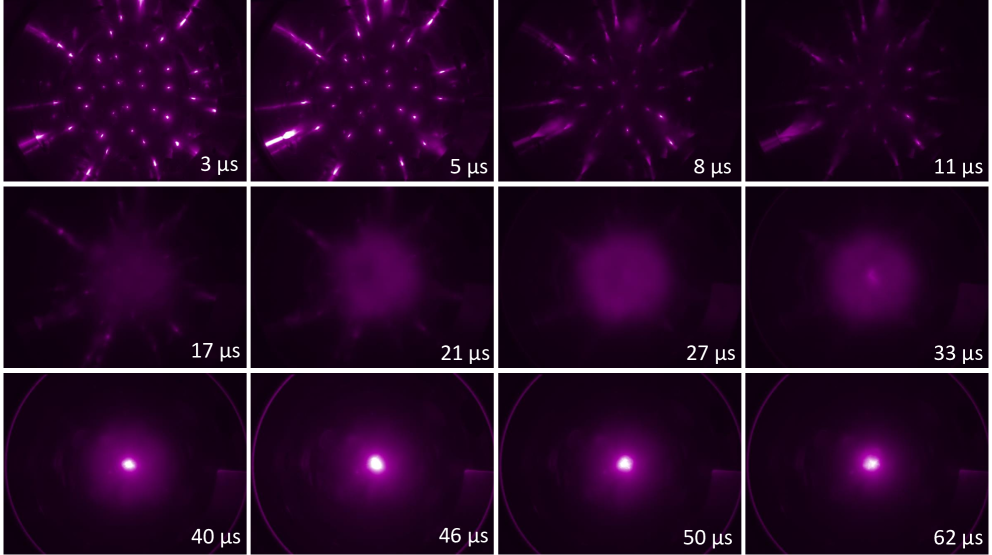
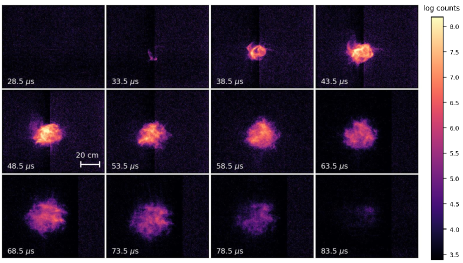
A series of images from the Pixelfly fisheye cameras is shown Fig. 7, and illustrates the general behavior from jet ejection to initial merge and finally to central stagnation. The liner assembly begins between 11 and 17 s. Stagnation and the brightest moment occurs around 46 s. It should be noted that because each image corresponds to a different shot, jet velocities may deviate slightly between each image as a result of shot-to-shot variation (see Fig. 11). In contrast, the set of images shown in Fig. 8 are from a single shot using the multi-frame camera Hadland camera. Both the Pixelfly images and Hadland images indicate a uniform liner is indeed formed by the 36 discrete jets with shockless morphology en route to chamber center, as opposed to earlier observations using a smaller subset of guns [18, 17] operating at different conditions. Hadland multi-frame imaging of the process for a single shot also shows a liner stagnation which maintains good sphericity, deviating slightly in some frames towards a more oblate shape. This may be related to the 9 TL guns on the bottom of the chamber which necessarily fire with slightly different settings than the other guns as discussed in Section II. The dissipation time that the overall emission strength recedes back to background levels is around 40 s after stagnation.
IV.2 Jet Velocities and Liner Merge
Photodiode signals for several guns are shown in Fig. 9 in which one observes a diversity of photodiode signal shapes observed. One potential source of the form variation is that the jets are expelled from the gun with more turbulent structure than anticipated. This variation in shapes practically means that certain jets have their velocities determined more reliably than others.
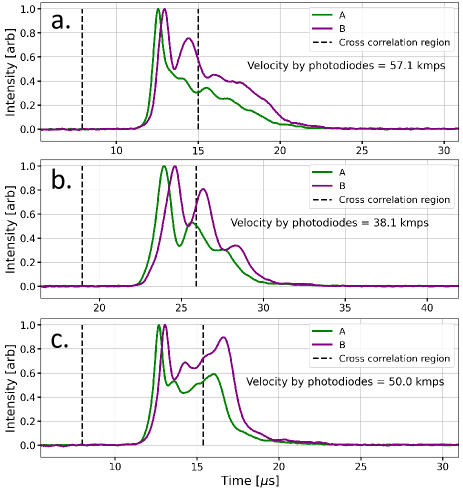
Velocities averaged over a set of 30 shots are shown in Fig. 10. Uncertainties are more so a result of shot-to-shot variation rather than in the analysis methodology. This variation is visualized in Fig. 11, in which the three shots shown give rather different velocity values, which can be qualitatively confirmed by noting the separation of the two signals in e.g. subplot a. versus those in b. Although shot-to-shot variation is evident in the magnitude of the error bars, mean values over the shot series are generally fall within 10 km/s of the targeted 50 km/s with few outliers - the tuning of gun 34 for example was ineffective as the reduction in GV voltage necessary to elevate its velocity also prevented its firing at all. The velocity determination method discussed in Section III.2 in about 10% of cases return clearly erroneous velocity values (by-hand calculation based on signal separation in these cases sharply disagrees with those calculated via the cross correlation method) - to discard these as outliers, for a given jet on a given shot, only calculated front velocities between 20 and 85 km/s are accepted. With present gun settings it is unlikely jets are fired at velocities truly outside these bounds.
IV.3 Spatially Resolved Spectroscopy
| Model Property | Value (Ar / N / O) |
|---|---|
| Overall ion density | cm-3 |
| Plasma thickness | 15 cm |
| Matched electron temperature | 2.5 eV |
| Matched composition | 0.6 / 0.18 / 0.22 |
| Matched mean ion charge | 1.8 / 1.4 / 1.2 |
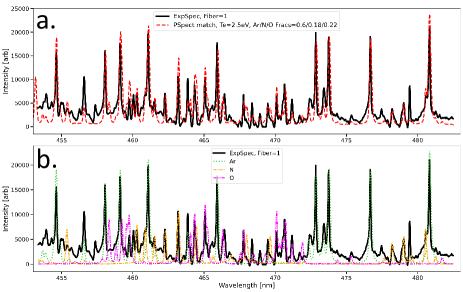
While the combination of shot-to-shot velocity variation and jet-to-jet variation within a single shot constrains attainable liner uniformity, it remains sufficiently minimal to provide some interesting results throughout the merge process by examining a collection of shots. Spectra observed with the MCS spatially-resolved spectroscopy system indicates a marked rise in presence of air lines closer to the central chord (chord 1). A sample spectrum from the central chord of the MCS is shown in Fig. 12, along with synthetic PrismSPECT spectra generated using the characteristics denoted in Table 1. The best matching synthetic spectrum of a set with varying properties is the red curve in subfigure b., corresponding to an electron temperature of 2.5 eV, an Ar fraction of 0.6, and the remaining composition split nearly equally between N and O species. That N and O are present in roughly equal quantities instead of a fraction similar to air suggests that some oxygen is desorbed from plasma-facing surfaces in the chamber during a shot, elevating it more than the ordinary air fraction. The fraction of N and O increases for the LOS closer to chamber center. Mean charge state is another parameter determined via this PrismSPECT comparison, with argon for the above conditions.
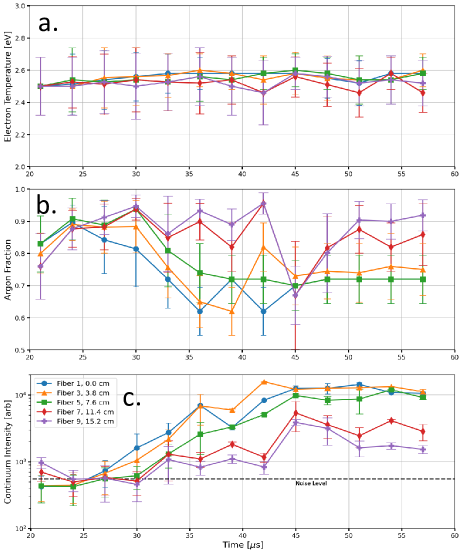
Performing the comparison to PrismSPECT for all fibers at times throughout liner formation and implosion provides a number of interesting insights, summarized in Fig. 13. There is a center-wards (lower fiber number) decrease in Ar amount observed in subfigure b. is not attributable to changes in electron temperature which remains at about 2.5 0.18 eV over space and time as indicated in subfigure a., and is instead evidence of the residual chamber air being swept up by the liner front. The unchanging nature of was also observed in an earlier PLX study involving merging of only a few guns [18]. Another striking feature of the spectra is evolution of continuum emission intensity from increasing Bremsstrahlung and bound-free emissions illustrated in subfigure c. This provides relative plasma density behavior spatially and temporally, as the continuum intensity scales as , as discussed in Section III.5.
IV.4 High Resolution Spectroscopy
The high resolution spectrometer described in Section III.3 captures a finely resolved profile of the Ar II 480.60 nm emission line. This profile shape originates through a convolution of several mechanisms - the easiest of these to analyze is the instrumental profile whose typically Gaussian shape is the profile constituent originating from optical components, not the plasma itself. Stark broadening manifests as a Lorentzian profile in response to the electric microfield from electrons and ions in the vicinity of emitting ions, and therefore scales linearly with the plasma density. Associated Stark widths for different densities for this line are obtained in Ref. 24. The last profile contribution is a composite effect from each jet conferring a Doppler shifted profile with the previously mentioned broadening freatures due to the projection of the jet’s radial velocity onto the spectral LOS.
To analyze the share of these attributes in the observed emission profile, a technique was developed that models the incoming jets as cylinders of uniform diameter and singular speed rather than a distribution of speeds. These cylindrical jets intersect the instrument’s LOS which itself is approximated as a narrower cylinder at an angle corresponding to the gun port location relative to the collection optics port. As a result, jets originating close to the collection optics port and close to the polar opposite location will contribute a greater proportion of light to the overall profile because they have a greater intersection volume, and will also be Doppler shifted the most due to the shallow angle of jet with respect to optics LOS. Using this framework, resultant composite profiles can be reconstructed for a set of values of plasma bulk velocities and densities, and seeing which best match the observed data, bearing in mind that the simplicity of the analysis model will contribute some uncertainty.
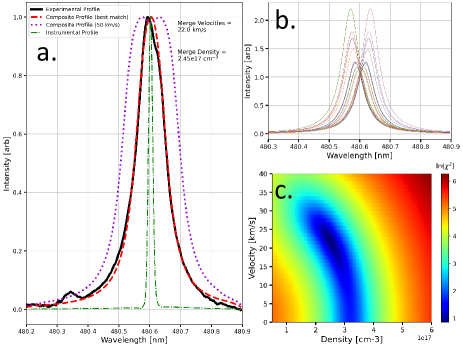
Carrying out this analysis on a shot very near stagnation time, the results are given in Fig. 14. Subfigure a. shows the experimentally observed profile, the reconstructed profile with the indicated parameters, and the instrumental profile obtained by looking at the H emission line using a low pressure discharge hydrogen lamp. Subfigure b. indicates the individual component profiles corresponding to each jet - note the varying amplitude and Doppler shifts depending on the gun’s placement relative to the collection optics. Subfigure c. shows the quality of match between the reconstructed profile and the experimental one (lower values indicate better matching) as a function of model parameters of jet speeds and plasma density. A particularly interesting result is that to capture the observed profile, we must reconstruct using velocities about 20 km/s or less, much less than our ejected jet velocities. Indeed, using a velocity closer to the ejection velocities of 50 km/s produces not only a profile which tends to be too broad, but also is double-peaked with a valley in between (see purple curve in Fig. 14), features not observed in experimental data.
IV.5 Interferometry
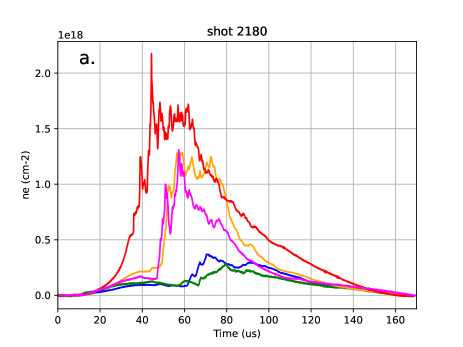
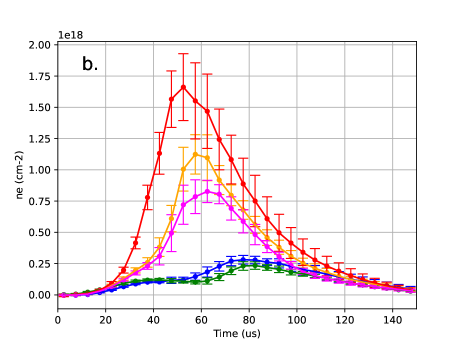
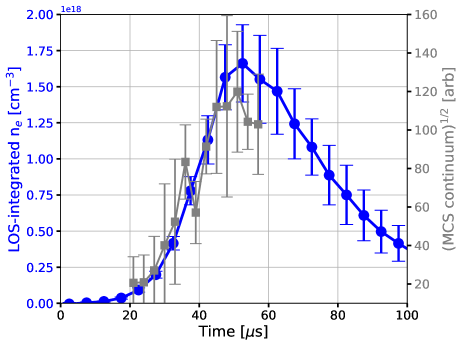
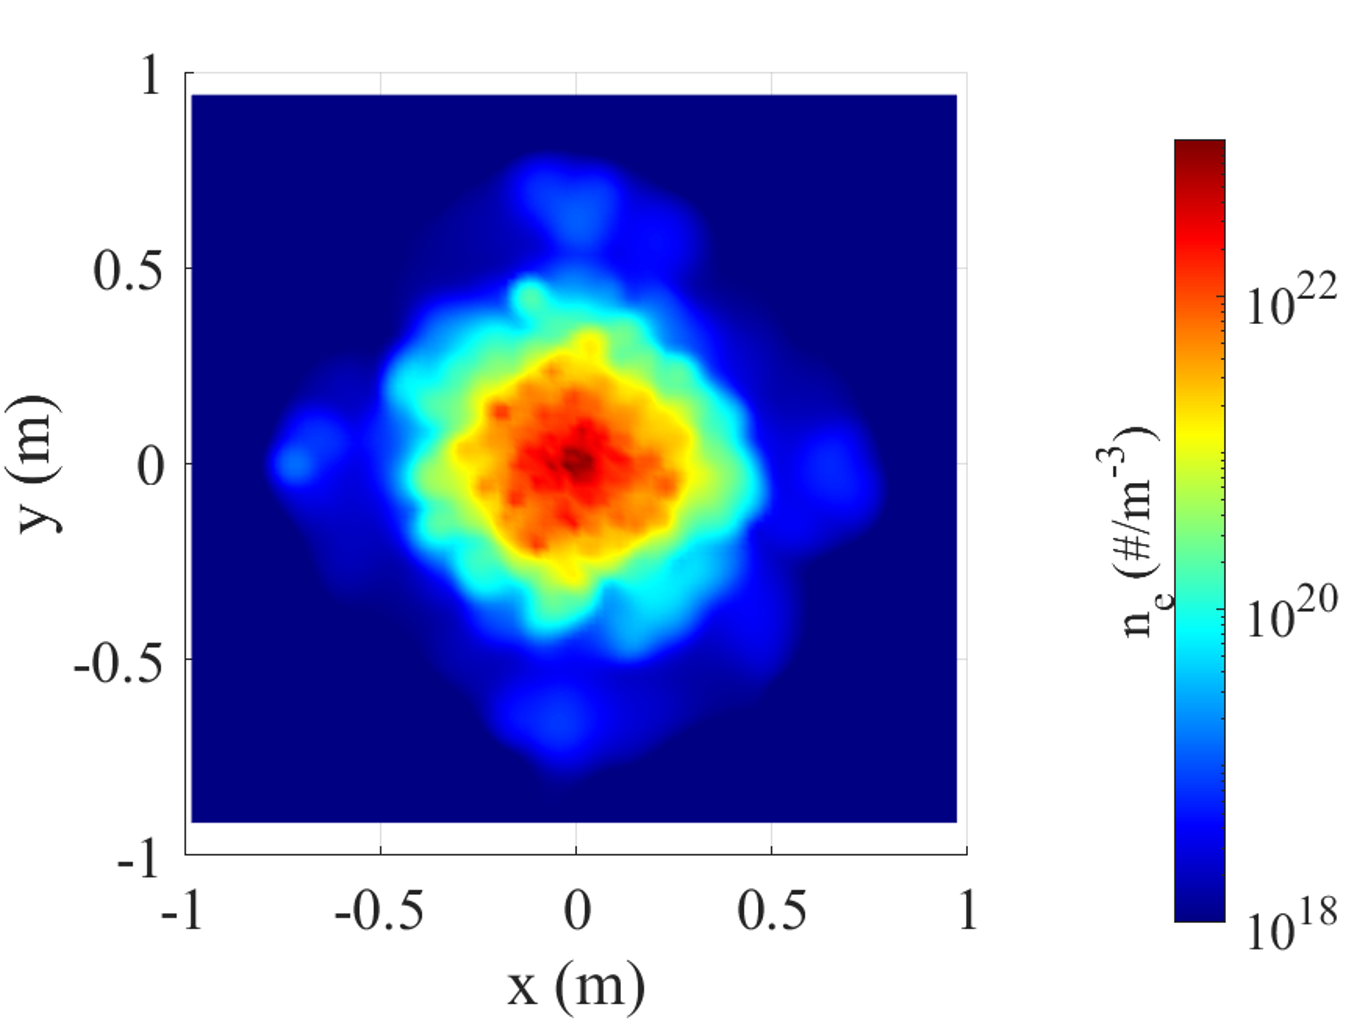
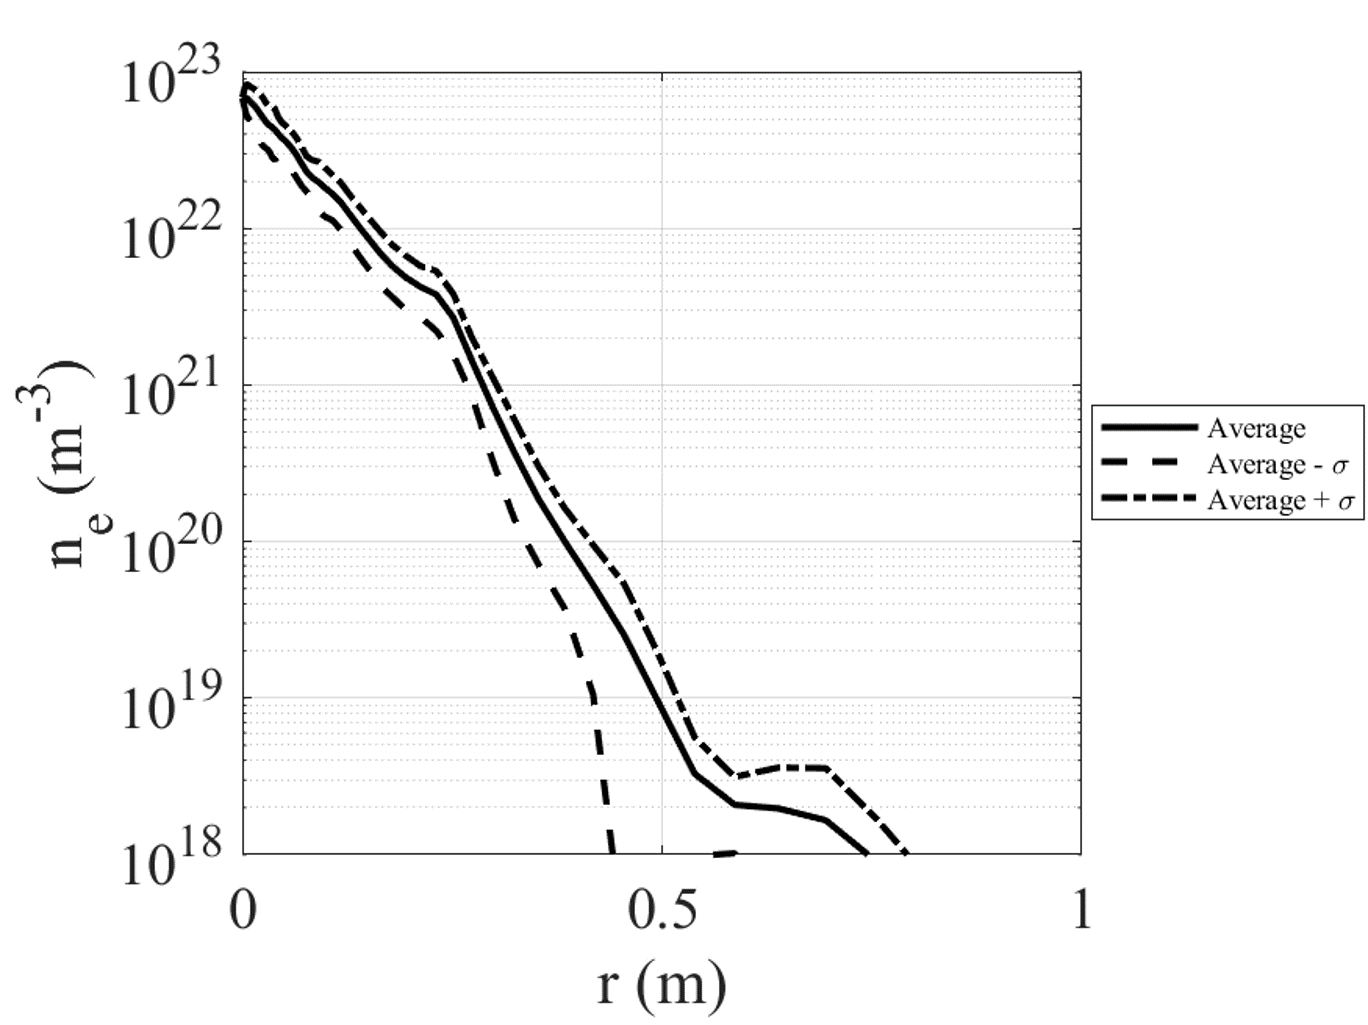
Inspection of the interferometry traces on both individual shots and multi-shot averages in Fig. 15 reveals several features. As the leading edge of the jets arrive, a slow increase of density is observed, preceding a sharp increase on the central chord. At later time, similar sharp increases are observed on the off-radial chords. In comparison with the experimental images in Fig. 8, it is clear that the sharp increase is connected to the formation of the expanding luminous region on center, which is the collisional stagnation of the liner and subsequent expansion / rebound of the stagnated liner plasma. The paired chords display decent symmetry within shot-to-shot variation on the early time rise of the density, with variations becoming observable on the rebound in both magnitude and timing of the rebound arrival. This is likely indicative of a small systematic asymmetry in the jet-to-jet delivered mass and pressure, leading to the observed asymmetry in the rebound over many shots. Spatial and temporal behavior of electron density determined from MCS continuum intensity as shown in Fig. 16 are in general agreement with that determined via interferometry, and the time of peak density corresponds well with the bright stagnation time seen in Figs. 7 and 8.
V Discussion:
V.1 Liner Uniformity
A major question in PJMIF is whether a sufficiently smooth and uniform spherical liner can be formed from the merging of discrete hypersonic jets, particularly in the face of density perturbations from shock waves between the merging jets. The inertial fusion field in particular has encountered many manifestations of the Rayleigh-Taylor instability when attempting liner implosions, and found in all cases that smooth liners and shells of the utmost uniformity are essential to avoid enhanced instability growth. In these experiments and has been noted in previous works, the absence of the sharp density gradients caused by shock waves upon initial plasma jet merging can be attributed to significant kinetic interpenetration between the jets [25, 26, 17]. The characteristic ion-ion interpenetration length is given by:
| (5) |
in which is the slowing frequency through ion-ion collisions, given by:
| (6) |
where is the Coulomb logarithm between counterstreaming ions and , is the mean charge state, is the ion/proton mass ratio, is the energy associated with velocity , in units of eV, and is density in cm-3. If ions and are of the same element (argon in this case), then the interpenetration length scales as . As such, the velocity, merging angle, and charge state of the jets exert a large control over the degree of interpenetration. If plasma-jet-driven liner implosions are scaled up to greatly increased plasma density, one can expect decreased jet interpenetration and re-emergence of collisional shock waves between the primary plasma jets. Due to the strong dependence of interpenetration length on velocity, increases in jet velocity concomitant with increases in liner density would have offsetting effects, resulting in the persistence of significant interpenetration even at many orders of magnitude greater energy densities. The exact termination point of this scaling is not empirically known, but we conjecture that it will at maximum end with densities corresponding to the onset of optical thickness of the liner plasma, inhibiting effective radiative cooling of the liner and lead to an increase in liner average charge state , leading to the rapid onset of liner collisionality. Future work may shed light on these and other detailed aspects of the jet merging and convergence phase and how they may be affected when scaling towards fusion-relevant conditions. The current experiment provides effectively, a single encouraging data point, showing that a liner free of primary shock waves can be assembled at these conditions.
V.2 Liner Ram Pressure
We can determine bounds of peak ram pressure () by combining the initial jet velocities measured from photodiodes () for the upper bound velocity, and high-resolution () spectroscopy for lower bound velocity, plasma density from interferometry, and from MCS results to obtain . To estimate from interferometry we take the peak line-integrated value of about cm-2, over the apparent domain that imaging indicates to be brightest - around 15 cm. Thus the upper bound of ram pressure is about 123 bar, and the lower bound is about 20 bar. This level is consistent with modeling predictions that have incorporated the present jet lengths of cm and moderate Mach numbers , revealing that there is a significant loss in liner density and ram pressure incurred due to the volumetric expansion of the individual jets en route to the liner merging radius, as well the extended length of the individual jets. If a thinner liner with sharper radial density profile can be formed, possibly by use of jets with higher Mach number and optimized launch velocity profile, the ram pressure has potential to be increased by many orders of magnitude at a given energy scale. Another path to increasing liner ram pressure and energy density is to simply decrease the liner standoff distance, effectively making the chamber smaller and starting the jets at a lesser radius. While this is attractive for the liner performance, it puts increased demands on the eventual system components to survive in a harsher fusion heat and radiation environment, and may complicate reactor engineering [27].
VI Conclusions:
The present set of experiments at PLX delivers the most substantial experimental measurements to date to investigate the feasibility of the PJMIF liner formation approach. Spatial and temporal measurements are obtained of an argon liner formed via the merger of 36 discrete plasma jets, following the liner evolution through jet launch, merging, spherical convergence, stagnation, and rebound. Notably, conditions of moderate interpenetration between primary jets are observed to lead to the absence of dense primary shock structures in the early liner, allowing increased density uniformity to be achieved. If primary shock waves are mitigated in this way, it seems that arbitrarily smooth liners may be able to be formed with corresponding improvements in primary jet parameters and control. A clear transition from initial kinetic interpenetration to collisional interaction is observed, in accordance with theoretical expectation. The obtained diagnostic measurements also provide achieved absolute parameter values of ram pressure, stagnation density and temperature, useful for benchmarking computational models and understanding the scaling of plasma liners to increased energy density. The results provide a first singular data point for these benchmarking purposes – future experiments could seek to verify theoretical liner scalings by exploring the effect of perturbations to liner parameters.
Acknowledgements.
The authors would like to thank Tom Byvank, Edward Cruz, Levi Grantz, Ricardo Martinez, and many others in the community who have contributed greatly to the PLX project and the current experiments, as well as the pioneers of the PJMIF concept and PLX experiment, Francis Thio and Scott Hsu, respectively. The information, data or work presented herein was funded in part by the Advanced Research Projects Agency-Energy (ARPA-E), U.S. Department of Energy under Award Numbers 20/CJ000/03/02 and DE-AR0001268, BETHE program. The views and opinions of authors expressed herein do not necessarily state or reflect those of the United States Government or any agency thereof. This work was supported by the U.S. Department of Energy in part through the Los Alamos National Laboratory. Los Alamos National Laboratory is operated by Triad National Security, LLC, for the National Nuclear Security Administration of U.S. Department of Energy (Contract No. 89233218CNA000001).Data Availability
The data that support the findings of this study are available from the corresponding author upon reasonable request.
References
- Hsu et al. [2018] S. C. Hsu, S. J. Langendorf, K. C. Yates, J. P. Dunn, S. Brockington, A. Case, E. Cruz, F. D. Witherspoon, M. A. Gilmore, J. T. Cassibry, R. Samulyak, P. Stoltz, K. Schillo, W. Shih, K. Beckwith, and Y. C. F. Thio, “Experiment to form and characterize a section of a spherically imploding plasma liner,” IEEE Transactions on Plasma Science 46, 1951–1961 (2018).
- Thio et al. [2019] Y. C. F. Thio, S. C. Hsu, F. D. Witherspoon, E. Cruz, A. Case, S. Langendorf, K. Yates, J. Dunn, J. Cassibry, R. Samulyak, P. Stoltz, S. J. Brockington, A. Williams, M. Luna, R. Becker, and A. Cook, “Plasma-jet-driven magneto-inertial fusion,” Fusion Science and Technology 75, 581–598 (2019).
- Yager-Elorriaga et al. [2022] D. Yager-Elorriaga, M. Gomez, D. Ruiz, S. Slutz, A. Harvey-Thompson, C. Jennings, P. Knapp, P. Schmit, M. Weis, T. Awe, G. Chandler, M. Mangan, C. Myers, J. Fein, B. Galloway, M. Geissel, M. Glinsky, S. Hansen, E. Harding, D. Lamppa, W. Lewis, P. Rambo, G. Robertson, M. Savage, G. Shipley, I. Smith, J. Schwarz, D. Ampleford, K. Beckwith, K. Peterson, J. Porter, G. Rochau, and D. Sinars, “An overview of magneto-inertial fusion on the z machine at sandia national laboratories,” Nuclear Fusion 62 (2022), 10.1088/1741-4326/ac2dbe.
- Zhang et al. [2019] Y. Zhang, U. Shumlak, B. A. Nelson, R. P. Golingo, T. R. Weber, A. D. Stepanov, E. L. Claveau, E. G. Forbes, Z. T. Draper, J. M. Mitrani, H. S. McLean, K. K. Tummel, D. P. Higginson, and C. M. Cooper, “Sustained neutron production from a sheared-flow stabilized z pinch,” Physical Review Letters 122 (2019), 10.1103/PhysRevLett.122.135001.
- O’Shea et al. [2018] P. O’Shea, M. Laberge, M. Donaldson, M. Delage, A. Mossman, M. Reynolds, P. de Vietien, and G. F. Team, “Magnetized target fusion at general fusion: An overview,” in 60th Annual Meeting of the APS Division of Plasma Physics, Portland, Oregon, USA (2018) pp. 5–9.
- Turchi et al. [1976] P. Turchi, A. Cooper, R. Ford, and D. Jenkins, “Rotational stabilization of an imploding liquid cylinder,” Physical Review Letters 36, 1546 (1976).
- Wessel et al. [2015] F. J. Wessel, P. Ney, R. Presura, et al., “Fusion in a staged -pinch,” IEEE Transactions on Plasma Science 43, 2463–2468 (2015).
- Thio et al. [2001] Y. C. F. Thio, C. E. Knapp, R. C. Kirkpatrick, R. E. Siemon, and P. J. Turchi, “A physics exploratory experiment on plasma liner formation,” Journal of Fusion Energy 20, 1–11 (2001).
- Lindl [1995] J. Lindl, “Development of the indirect-drive approach to inertial confinement fusion and the target physics basis for ignition and gain,” Physics of Plasmas 2, 3933–4024 (1995).
- Craxton et al. [2015] R. S. Craxton, K. S. Anderson, T. R. Boehly, V. N. Goncharov, D. R. Harding, J. P. Knauer, R. L. McCrory, P. W. McKenty, D. D. Meyerhofer, J. F. Myatt, A. J. Schmitt, J. D. Sethian, R. W. Short, S. Skupsky, W. Theobald, W. L. Kruer, K. Tanaka, R. Betti, T. J. B. Collins, J. A. Delettrez, S. X. Hu, J. A. Marozas, A. V. Maximov, D. T. Michel, P. B. Radha, S. P. Regan, T. C. Sangster, W. Seka, A. A. Solodov, J. M. Soures, C. Stoeckl, and J. D. Zuegel, “Direct-drive inertial confinement fusion: A review,” Physics of Plasmas 22, 110501 (2015).
- Karino et al. [2016] T. Karino, S. Kawata, S. Kondo, T. IInuma, T. Kubo, H. Kato, and A. I. Ogoyski, “Target implosion uniformity in heavy-ion fusion,” Laser and Particle Beams 34, 735–741 (2016).
- Knapp and Kirkpatrick [2014] C. E. Knapp and R. Kirkpatrick, “Possible energy gain for a plasma-liner-driven magneto-inertial fusion concept,” Physics of Plasmas 21 (2014).
- Witherspoon et al. [2009] F. D. Witherspoon, A. Case, S. J. Messer, R. Bomgardner II, M. W. Phillips, S. Brockington, and R. Eltonc, “A contoured gap coaxial plasma gun with injected plasma armature,” Review of Scientific Instruments 80 (2009), 10.1063/1.3202136.
- Merritt et al. [2012a] E. C. Merritt, A. L. Moser, S. C. Hsu, C. S. Adams, J. P. Dunn, A. M. Holgado, and M. A. Gilmore, “Experimental evidence for collisional shock formation via two obliquely merging supersonic plasma jets,” Physics of Plasmas 21 (2012a), 10.1063/1.4872323.
- Hsu et al. [2015] S. Hsu, A. Moser, E. Merritt, C. Adams, J. Dunn, S. Brockington, A. Case, M. Gilmore, A. Lynn, S. Messer, et al., “Laboratory plasma physics experiments using merging supersonic plasma jets,” Journal of Plasma Physics 81, 345810201 (2015).
- Hsu et al. [2012] S. C. Hsu, T. J. Awe, S. Brockington, A. Case, J. T. Cassibry, G. Kagan, S. J. Messer, M. Stanic, X. Tang, D. R. Welch, and F. D. Witherspoon, “Spherically imploding plasma liners as a standoff driver for magnetoinertial fusion,” IEEE Transactions on Plasma Science 40, 1287–1298 (2012).
- Langendorf et al. [2019] S. J. Langendorf, K. C. Yates, S. C. Hsu, C. Thoma, and M. Gilmore, “Experimental study of ion heating in obliquely merging hypersonic plasma jets,” Physics of Plasmas 26 (2019), doi: 10.1063/1.5108727.
- Yates et al. [2020] K. C. Yates, S. J. Langendorf, S. C. Hsu, J. P. Dunn, S. Brockington, A. Case, E. Cruz, F. D. Witherspoon, Y. C. F. Thio, J. T. Cassibry, K. Schillo, and M. Gilmore, “Experimental characterization of a section of a spherically imploding plasma liner formed by merging hypersonic plasma jets,” Physics of Plasmas 27 (2020), 10.1063/1.5126855.
- LaJoie et al. [2023] A. L. LaJoie, F. Chu, S. Langendorf, J. Cassibry, A. Vyas, and M. Gilmore, “Multi-camera imaging to characterize jet and liner uniformity on the plasma liner experiment (plx),” Review of Scientific Instruments 94 (2023), 10.1063/5.0101674.
- Merritt et al. [2012b] E. C. Merritt, A. G. Lynn, M. A. Gilmore, and S. C. Hsu, “Multi-chord fiber-coupled interferometer with a long coherence length laser,” Review of Scientific Instruments 83 (2012b), 10.1063/1.3697731.
- Chu et al. [2023] F. Chu, A. L. LaJoie, B. D. Keenan, L. Webster, S. J. Langendorf, and M. Gilmore, “Experimental measurements of ion diffusion coefficients and heating in a multi-ion-species plasma shock,” Physical Review Letters 130 (2023), 10.1103/PhysRevLett.130.145101.
- Prince and Robertson [1966] J. F. Prince and W. W. Robertson, “Continuum radiation in an argon positive column,” Journal of Chemical Physics 45, 2577–2584 (1966).
- Wilbers et al. [1991] A. Wilbers, G. Kroesen, C. Timmermans, and D. Schram, “The continuum emission of an arc plasma,” Journal of Quantitative Spectroscopy and Radiative Transfer 45, 1–10 (1991).
- Aparicio et al. [1998] J. A. Aparicio, M. A. Gigosos, V. R. González, C. Pérez, M. I. de la Rosa, and S. Mar, “Measurement of stark broadening and shift of singly ionized ar lines,” Journal of Physics B: Atomic, Molecular and Optical Physics 31, 1029–1048 (1998).
- Cagas et al. [2023] P. Cagas, J. Juno, A. Hakim, A. LaJoie, F. Chu, S. Langendorf, and B. Srinivasan, “An investigation of shock formation vs shock mitigation of colliding plasma jets,” Physics of Plasmas 30 (2023), 10.1063/5.0135389.
- Moser and Hsu [2015] A. L. Moser and S. C. Hsu, “Experimental characterization of a transition from collisionless to collisional interaction between head-on-merging supersonic plasma jets,” Physics of Plasmas 22 (2015), 10.1063/1.4920955.
- Rolison et al. [2019] L. M. Rolison, M. L. Fensin, Y. Francis Thio, S. C. Hsu, and E. J. Cruz, “Neutronics calculations for a hypothetical plasma-jet-driven magneto-inertial-fusion reactor,” Fusion Science and Technology 75, 438–451 (2019).