Influence of particle size polydispersity on dynamical heterogeneities in dense particle packings
Abstract
The dynamics of dense particle packings near the jamming transition is characterized by correlated particle motion. The growth of dynamical heterogeneities, or strong spatial variations in the motion of the particles constituting the system, is a hallmark feature of slow glassy dynamics. We report here a systematic confocal microscopy study that characterizes the cooperative dynamics of fluorescently-labelled colloidal particles in dense aqueous suspensions. We demonstrate that jammed particulate suspensions can be fluidized by increasing the width of the particle size distribution. Our molecular dynamics simulations, performed to numerically investigate the effects of continuous-size polydispersity on dense particle packing dynamics, show an excellent match with our experimental results. Besides shedding light on the fundamental aspects of particle-scale dynamics at the jamming-unjamming transition, our findings are significant in the processing of commonly-encountered dense suspensions such as paints, cosmetics, and food.
I Introduction
If the temperature of a molecular system is lowered very rapidly, it can undergo kinetic arrest even while its structure remains disordered or liquid-like Gotze and Sjogren (1992); Angell (1995); Berthier and Biroli (2011); Karmakar, Dasgupta, and Sastry (2014). The temperature at which this transition occurs, commonly referred to as the laboratory glass transition temperature (), depends on the material properties and cooling rate. Changes in dielectric constant, viscosity, and thermodynamic properties like enthalpy, free volume, heat capacity, and thermal expansion coefficient are frequently used to identify the glass transition point Stearns, Duling, and Johnson (1966); Černošek et al. (2002); White and Lipson (2016). However, the structure and dynamics of molecular glass-forming materials, constituted by sub-nanometer sized entities, are inaccessible in laboratory experiments with standard measurement techniques. In this context, soft materials such as colloidal suspensions, constituted by macromolecules that statistically behave as scaled-up atoms, have been used extensively as models in the investigation of the physics of condensed matter systems Marcelja, Mitchell, and Ninham (1976); Pusey (2008). Dense colloidal suspensions, for example, have been studied experimentally and through numerical simulations to unravel the structural and dynamical properties of glass-forming materials Ganapathi, Sood, and Ganapathy (2022). As the sizes of the constituent particles in dense colloidal suspensions are several orders larger than those of atoms or molecules, their relaxation processes are amenable to measurement using common laboratory techniques such as bright field and confocal microscopy, dynamic light scattering, etc. Pusey (2008). In contrast to a molecular system which can be transformed to a glass by a rapid temperature quench, the transition of a dense colloidal suspension to a glassy state can be achieved by increasing the volume fraction of the dispersed phase comprising colloidal particles Pusey and van Megen (1987). Particles constituting a dense system are trapped in cages formed by neighbouring particles and move in a correlated manner to break the caging Weeks and Weitz (2002a) and eventually attain an equilibrium state. A progressive slowing down of particle dynamics and the simultaneous growth of the characteristic length scale associated with cooperatively rearranging particles are ubiquitous near the glass transition volume fraction Saha, Joshi, and Bandyopadhyay (2014); Gadige et al. (2017).
The transition of a supercooled liquid to a glassy state is accompanied by a rapid rise in its relaxation time or viscosity Berthier et al. (2005); Karmakar, Dasgupta, and Sastry (2014); Tamborini, Royall, and Cicuta (2015); Murarka and Bagchi (2003). Some theories of the glass transition e.g., random first order transition (RFOT) theory predicts a divergence of the relaxation time at a finite temperature or volume fraction. For colloidal systems, this theory suggests a glass transition at in three dimensions Adhikari, Karmakar, and Sastry (2022), very close to the jamming transition which occurs at . Nevertheless, the glass transition and the jamming transition are believed to be very different, with their estimated transition densities departing significantly from each other with increasing dimension. This is in complete agreement with recent analytical work on the glass transition near an upper critical dimension, Mangeat and Zamponi (2016). Mode coupling theory (MCT), on the other hand, predicts a glass transition in these systems at a volume fraction for monodisperse systems Götze (2009); Janssen (2018). Interestingly, experiments show that particle dynamics persist above the MCT glass transition volume fraction, though they slow down considerably due to the growth of cooperatively rearranging regions (CRRs) Brambilla et al. (2009).
It is unfeasible to prepare a size-monodisperse colloidal system in the laboratory, with size-polydispersity being an unavoidable part of any experimental system. For samples of negligible size polydispersity (smaller than 5%), a dense system eventually settles in crystalline configurations. Since glasses are characterized by disorder and metastability that can be sustained only in the presence of particle size polydispersity Auer and Frenkel (2001); Hermes and Dijkstra (2010), the intrinsic polydispersity in colloidal systems has been exploited exhaustively for studying glassy dynamics. It is well-known that the presence of size polydispersity shifts the glass transition volume fraction to a value that is higher than that predicted for a monodisperse system Schaertl and Sillescu (1994).
Particle dynamics in dilute colloidal suspensions are purely diffusive, and particle displacements are well-characterized by Gaussian distribution functions Sonntag, Strenge, and Vincent (1987). While particle dynamics are restricted within cages for short observation times in dense particulate suspensions, a cage-hopping phenomenon, facilitated by the cooperative motions of particles, dominates at long waiting times Hunter and Weeks (2012); Kasper, Bartsch, and Sillescu (1998). Such particle displacements between cages results in a structural relaxation process characterized by an -relaxation time scale. The cage-hopping phenomenon breaks the symmetry of particle motion, with the distribution of displacements deviating significantly from Gaussian statistics Saltzman and Schweizer (2006); Sengupta and Karmakar (2014). The distribution of particle displacements is then characterized by clear exponential tails that become pronounced at low temperatures or high volume fractions. These tails are often associated with hopping motions by fast-moving particles and result in a multimodal and broad distribution of the diffusion constants in the system. Interestingly, the exponential tail in the probability distribution of particle displacements, often called the Van Hove function, can be completely rationalized by considering the growth of the length scale characterising the dynamical heterogeneity in the system Bhowmik, Tah, and Karmakar (2018). Such distributions are often quantified using a non-Gaussian parameter Thorneywork et al. (2016), defined as the ratio of the fourth to the second moments of the probability distribution of particle displacements. The time at which the peak in appears, which is correlated but always smaller than the -relaxation time, is computed using the two-point overlap correlation function or the self intermediate scattering function , where is the wave vector and is time Dauchot, Marty, and Biroli (2005); Kob and Andersen (1995a). The presence of peaks in , as reported in experimental studies Bhowmik, Tah, and Karmakar (2018); Shell, Debenedetti, and Stillinger (2005), indicates spatiotemporal heterogeneities within the system.
Dynamical heterogeneities, which arise near the jamming transitions of granular materials, colloidal suspensions, molecular and supercooled liquids due to very broad distributions of the distinct dynamical relaxation rates, have been quantified successfully using four-point correlation functions Dasgupta and Ramaswamy (1992); Karmakar, Dasgupta, and Sastry (2009, 2014); Candelier, Dauchot, and Biroli (2009); Maggi et al. (2012); Donati et al. (2002). The dynamics of a dense, bi-disperse granular material under cyclic shear in a quasi two-dimensional geometry were found to be strongly correlated but spatially heterogeneous as its jamming transition was approached Dauchot, Marty, and Biroli (2005). Using a novel method based on local topology Abate and Durian (2007), the evolution of spatially heterogeneous dynamics and their connection with the local structure were studied for a quasi-two-dimensional granular system of air fluidized beads approaching the jamming transition. In another study involving a binary colloidal suspension in a quasi-two-dimensional geometry, the size of the dynamical heterogeneity was characterized in terms of a dynamical correlation length that grew rapidly during the crystal-to-glass transition Yunker, Zhang, and Yodh (2010). Fragility, the rate at which a system approaches its glass transition, and the simultaneous growth of dynamical heterogeneities have been shown to be closely correlated Adam and Gibbs (1965); Sastry (2001); Adhikari, Karmakar, and Sastry (2021), with the growth of dynamical heterogeneity much stronger in fragile glass formers. These results are very robust across varying spatial dimensions. Interestingly, dynamical heterogeneity decreases with increasing spatial dimensions, and the system becomes more mean-field-like near the upper critical dimensionAdhikari, Karmakar, and Sastry (2021), . The decrease in the growth of dynamical heterogeneity with increasing spatial dimensions is accompanied by a decrease in the fragility of the system, in complete agreement with earlier results for three-dimensional systems Flenner and Szamel (2015). In colloidal glasses where fragility is determined by particle-scale elasticity, the suspension viscosity and particle relaxation time increase dramatically for a very small change in near the glass transition Mattsson et al. (2009). Fragility also depends strongly on the stiffness and size polydispersity of the constituent particles and the compressible interactions between them Van Der Scheer et al. (2017).
Molecular dynamics simulations have reported that size polydispersity smears out the kinetic arrest of particles in dense packings due to a lubrication effect Abraham, Bhattacharrya, and Bagchi (2008); Zaccarelli, Liddle, and Poon (2015). Another theoretical study concluded that fragility of a supercooled liquid decreases with polydispersity due to significant alterations in the potential energy landscape Abraham, Bhattacharrya, and Bagchi (2008). This was verified experimentally for soft colloidal glassy suspensions Behera et al. (2017). Often in the literature, the extent of heterogeneity is quantified in terms of the number of correlated particles, , which is estimated from the four-point dynamic susceptibility Abate and Durian (2007). Theoretical studies have computed nonlinear susceptibilities to quantify the extent of cooperatively rearranging regions in spin glasses, dense colloidal systems, and Lennard Jones liquids Bouchaud and Biroli (2005); Narumi et al. (2011); Glotzer, Novikov, and Schrøder (2000); Lačević et al. (2003). exhibits a peak near the -relaxation time of the particles Dasgupta and Ramaswamy (1992); Karmakar, Dasgupta, and Sastry (2009); Flenner et al. (2009), with the height of the peak directly correlated with the average number of particles, , participating in cooperative rearrangements during structural relaxation. Although this gives a rough estimate of the number of particles that exhibit cooperative motion, a precise estimation of requires one to compute the associated dynamical heterogeneity length scale, , as a function of volume fraction or temperature via a detailed finite size scaling analysis of the peak height of Karmakar, Dasgupta, and Sastry (2009); Chakrabarty et al. (2017), or from the wave vector dependence of the four-point structure factor, , computed at the -relaxation time Flenner and Szamel (2010). These analyses are significantly more challenging in experiments than in computer simulation studies due to experimental limitations in acquiring adequate statistics while probing dense systems.
We report systematic experiments and simulations to evaluate the effect of continuous-size polydispersity on the correlated motion of particles in dense packings approaching kinetic arrest. We prepared dense colloidal microgel suspensions by synthesising fluorescent Poly(N-isopropylacrylamide) or PNIPAM particles with continuous-size polydispersities. We controlled the polydispersity index (PDI), defined as the ratio of the standard deviation to the mean of a Gaussian particle size distribution, by controlling reaction rates during particle synthesis. The evolution of particle dynamics with time was observed by tracking individual particles using a confocal microscope. We quantified the growth of dynamical heterogeneities in these polydisperse systems by calculating four-point dynamic susceptibility functions, Dasgupta and Ramaswamy (1992); Lačević et al. (2003); Karmakar, Dasgupta, and Sastry (2009), as a function of time . Our measurements provide detailed information on the effect of particle polydispersity on the relaxation dynamics, spatiotemporal heterogeneity, and the number of correlated particles in cooperatively rearranging regions in disordered materials approaching their dynamically arrested states. Our work demonstrates that suppression of dynamic heterogeneities and enhanced suspension fluidization can be achieved by increasing particle PDI, medium temperature and suspension dilution. Our molecular dynamics simulations, performed to obtain for crowded packings of particles having continuous-size polydispersity, match our experimental results very well.
II Material and methods
II.1 Functionalization of dye and synthesis of PNIPAM particles
We synthesized polydisperse PNIPAM particles using a semi-batch method Still et al. (2013); Behera et al. (2017) in which the continuous size polydispersity (PDI) of the particles was controlled by varying the flow rate of the reaction ingredients during the synthesis process. The flow rate values for different batches are reported in Table.S1 in Supplementary Information. All chemicals for synthesis were purchased from Sigma-Aldrich. For our confocal experiments, we needed to attach fluorescein dye molecules to PNIPAM particles. To functionalize the dye, we added gm of fluorescein with ml of dry tetrahydrofuran in a ml round bottom flask. After mixing for min under nitrogen purging, ml of triethylamine was added. This mixture was stirred for 15 min in a nitrogen environment. The round bottom flask was kept in an ice bath, and ml of acryloyl chloride was slowly added under stirring conditions. The mixture was kept overnight to equilibrate and was eventually filtered to remove the triethylammonium chloride salt. The filtered sample was treated with nitrogen gas for min and then dried in a desiccator equipped with a rotor pump. The dried fluorescent crosslinker was stored at C.
To synthesize PNIPAM particles, we added 2 gm N-isopropylacrylamide monomer (NIPAM 99%), 0.05 gm - methylenbisacrylamide crosslinker (MBA), 0.0083 gm of 2-aminoethylmethacrylate hydrochloride co-monomer (AEMA) and 0.1 gm of functionalized fluorescein in 50 mL Milli-Q water in a three-necked round bottom (RB) flask. The middle neck of the RB flask was connected to a reflux condenser. The RB flask was kept inside an oil bath to maintain a uniform temperature. The other two necks of the round bottom flask were used as inlet and outlet. The ingredients in the RB flask were stirred at 500 rpm for 20 minutes under purging. 30 mL of the sample was taken out using a syringe for later use. The temperature of the oil bath was increased to 80∘C, and 0.0114 gm ammonium persulfate (APS) dissolved in 2 mL of water was added to initiate polymerization a free radical precipitation reaction. Nucleation sites started to form within 5 mins. The sample of 30 mL volume that was extracted earlier was next injected at different flow rates between 0.5 ml/min and 0.8 ml/min using a syringe pump to produce particles with distinct continuous size distributions that were quantified by estimating their PDI values. After the process was completed, the latices were cooled down rapidly in an ice bath and were purified by repeated centrifugations.
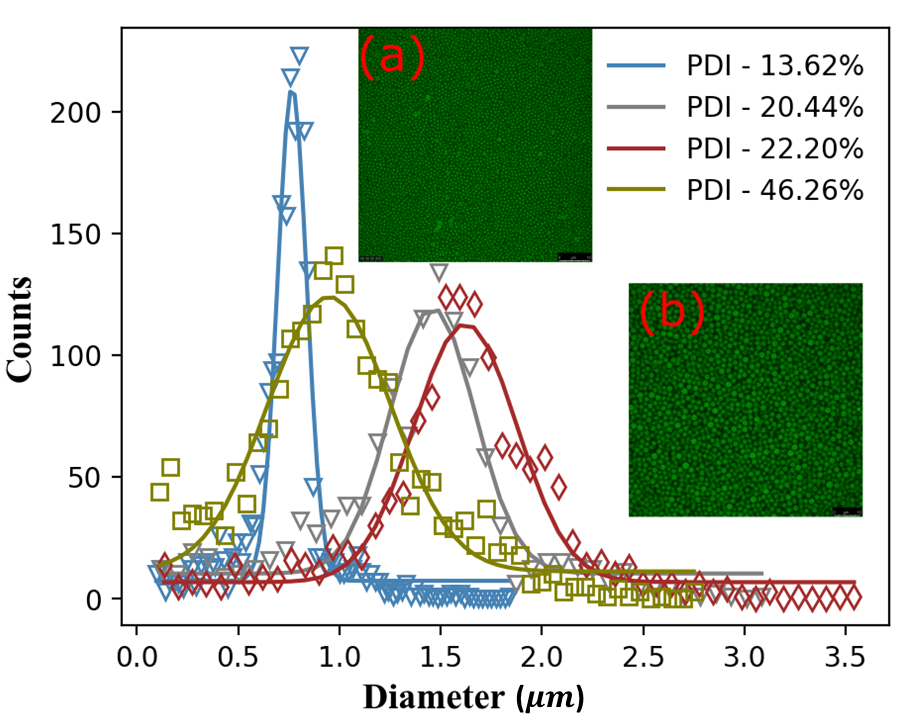
The size distributions of two representative batches of polydisperse fluorescent PNIPAM particles in suspension have been presented in Fig.1. PNIPAM particles are thermoresponsive (thermoresponsivity data acquired from an aqueous PNIPAM suspension prepared by us is presented in Fig.S1(a) of Supplementary Information) and show a swelling-deswelling transition at a lower critical solution temperature (LCST) of C Heskins and Guillet (1968); Hirokawa and Tanaka (1984). The volume fraction of aqueous PNIPAM suspensions can therefore be tuned by controlling temperature across the LCST Appel, Fölker, and Sprakel (2016).
II.2 Confocal microscopy
Below the LCST, PNIPAM particles swell by absorbing water and have a negligible refractive index mismatch with the surrounding water medium. It is therefore impossible to distinguish individual PNIPAM particles in brightfield microscopy. As discussed in the previous section, we attached fluorescein dye to PNIPAM particles and imaged the fluorescent PNIPAM particles using a Leica TCS SP8 confocal microscope. The attached dye was excited using a 488 nm Argon laser, and a photomultiplier tube was used to record the output signal at a higher wavelength. We performed XY directional scanning to resolve the motion of individual particles in dense PNIPAM suspensions that were loaded in a sample cell constructed using a glass slide and a coverslip separated by two coverslips. The schematic of the sample cell is shown in Fig.S2 in Supplementary Information. After loading the sample, UV glue was used to seal the open ends of the sample cell that was kept inside a temperature-controlled enclosure box. Imaging was performed using a Nikon 100x oil immersion objective lens of numerical aperture, NA = 1.4. All experiments were performed in the temperature range 25∘C - 31∘C which lies below the lower critical solution temperature (LCST). The average sizes of the swollen particles do not change appreciably in this temperature range, as seen in Supplementary Information Fig.S1(b).
II.3 Mean squared displacement (MSD)
The mean square displacements (MSDs) of PNIPAM particles in 2D experiments and Lennard Jones particles in 3D computer simulations were computed to estimate their average dynamics for different particle area fractions (Eqn.1a used for our 2D experiments), volume fractions (Eqn.1b used for the 3D computer simulations), particle PDIs, and medium temperatures using the formulae:
| (1a) |
| (1b) |
Here, represents the delay time, is the initial time of measurement of a particle trajectory, , and are the coordinates of the -th particle, is the total number of particles (), and is an average over .
II.4 Four point susceptibility, , and number of correlated particles,
We calculate two-point correlation functions () and four-point susceptibilities (four-point correlation functions, ) to characterize the relaxation time scales and heterogeneous (correlated) dynamics in dense suspensions. We define a two-point overlap correlation function by averaging over a variable over all particles and initial times Dauchot, Marty, and Biroli (2005):
| (2) |
| (3) |
where is the displacement of the -th particle during a delay time (estimated from the initial time ), is a probe length that removes the decorrelations that might happen due to vibration of particles in cages in a dense suspension and is the total number of particles. In Eqn.(2), the exponential form arises from the calculation of a spatial overlap function Dauchot, Marty, and Biroli (2005). If the displacement of the -th particle is less than the probe length , (Eqn.2) will be close to 1, while for displacements larger than , will be closer to 0. We have systematically varied the probe length, , across a range of length scales. Fluctuations in were subsequently quantified by estimating the four-point susceptibility or the four-point correlation function as follows:
| (4) |
Finally, we identified the length scale that corresponds to the strongest peak in , and therefore maximally non-Gaussian dynamics. This length scale is designated as the optimal probe length, . We have used to calculate the two-point correlation function using Eqn.3, and eventually the four-point correlation function using Eqn.4 to quantify the extents of dynamically heterogeneous regions in the sample. The number of correlated particles in a dynamical heterogeneity, , was estimated using the formula Abate and Durian (2007):
| (5) |
where is the peak value of at the optimal probe length and is the magnitude of at the delay time corresponding to the peak in . All analyses and numerical calculations were performed using Python 3.10 (Jupyter notebook).
III Results and Discussion
III.1 Experimental Results
Aqueous suspensions of fluorescent PNIPAM particles were loaded in the sample cell and imaged in two dimensions using a confocal microscope. The depth of field of the setup was estimated to be nm. The imaging plane was fixed at above the lower coverslip to avoid any wall effects. Images of different batches of PNIPAM particles in suspension, synthesized by varying the flow rates of the reaction ingredients, were analyzed to calculate particle size distributions and particle size polydispersity indices (PDI). For PDI calculation, we used a suspension of intermediate particle number density so that the edges of individual particles could be detected accurately. The confocal images were analysed using ImageJ to estimate the diameter distributions of the different batches of particles. The distributions of particle diameters (hollow symbols in Fig.1) were fitted using Gaussian functions (solid lines in Fig.1) and the mean and width of each distribution was computed. The size polydispersity indices (PDIs) of the particles synthesized in different batches by using different flow rates of the reaction ingredients were calculated as percentages using the formula, PDI .
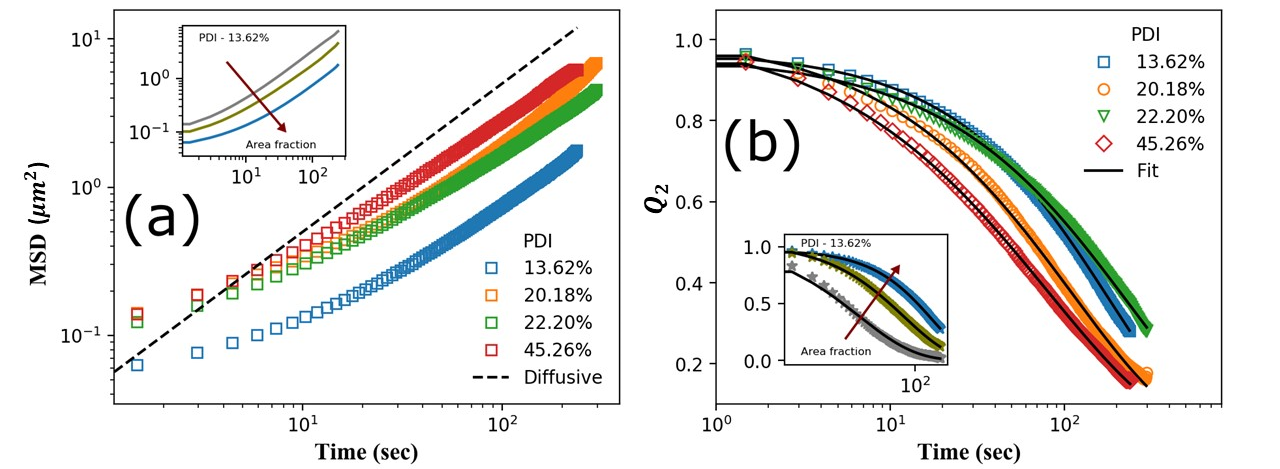
To compute the particle dynamics, image sequences were acquired for mins at frames/sec, and PNIPAM particles from the central regions of the images were tracked using a video spot tracker software (Computer Integrated Systems for Microscopy and Manipulation) https://cismm.web.unc.edu/ . If a particle moved beyond this plane during the experiment, further tracking of that particle was abandoned. We have calculated the area fractions, , of PNIPAM particles in dense suspensions by binarizing two-dimensional images after setting appropriate intensity threshold values such that individual particles could be distinguished from the background. MSDs were determined delay time and plotted in Fig.2(a) for aqueous suspensions of PNIPAM particles of four distinct PDI values, prepared at a high particle area fraction (). MSD data for particles having a fixed PDI () and of varying suspension area fractions, , are shown in the inset. The observed enhancement in MSDs with increasing PDI indicates the onset of unjamming or fluidization, and is reminiscent of earlier results Zaccarelli, Liddle, and Poon (2015); Behera et al. (2017). Furthermore, we see from the inset of Fig.2(a) that the calculated MSDs decrease with an increase in particle area fraction due to constrained particle motion in increasingly jammed environments. Increasing suspension area fraction and decreasing particle PDI, therefore, have analogous effects on suspension jamming. In Fig.2(a), we note the emergence of very weak plateaus at low delay times in the MSDs of suspensions of particles having lower particle PDI values due to particle caging Hunter and Weeks (2012); Weeks and Weitz (2002b). The MSD increases at later times and approaches a line of slope 1 ( marked by a dashed line), which indicates onset of the cage escape process cooperative diffusion Kegel, , and van Blaaderen (2000). We note that the extent of the plateau in the MSD reduces with increase in PDI and decrease in area fraction, thereby pointing to the enhanced fluidization of the system under these conditions.
| PDI | (sec) | PDI | (steps) | ||||||
|---|---|---|---|---|---|---|---|---|---|
| 13.62% | 0.65 | 181.810.45 | 0.800.003 | 4.06 | 13.06% | 0.6230 | 2211.6516.08 | 0.700.005 | 4.35 |
| 20.18% | 0.66 | 111.430.91 | 0.670.005 | 1.81 | 17.37% | 0.6230 | 790.806.78 | 0.590.003 | 2.26 |
| 22.20% | 0.65 | 229.561.13 | 0.700.005 | 1.80 | 21.77% | 0.6230 | 229.754.31 | 0.580.006 | 1.33 |
| 45.26% | 0.65 | 80.440.42 | 0.600.002 | 0.82 | 38.67% | 0.6230 | 156.633.14 | 0.550.006 | 0.41 |
The two-point and four-point correlation functions, computed using Eqns.3 and 4, for data acquired from a dense sample with and PDI = are displayed in Supplementary Fig.S3 for different probe lengths . As expected, relaxes at a faster rate and peaks are shorter when probe lengths are sub-optimal. As increases, the decay time of the two-point correlation function becomes slower, while the peak height of grows higher. When exceeds an optimal value , the peak in is seen to reduce. The optimal probe lengths at which the fluctuations of , or the peak heights of , are maximum for all the samples are tabulated in Table.S2 of Supplementary Information. The sample dynamics are expected to be maximally heterogeneous at Dauchot, Marty, and Biroli (2005); Abate and Durian (2007).
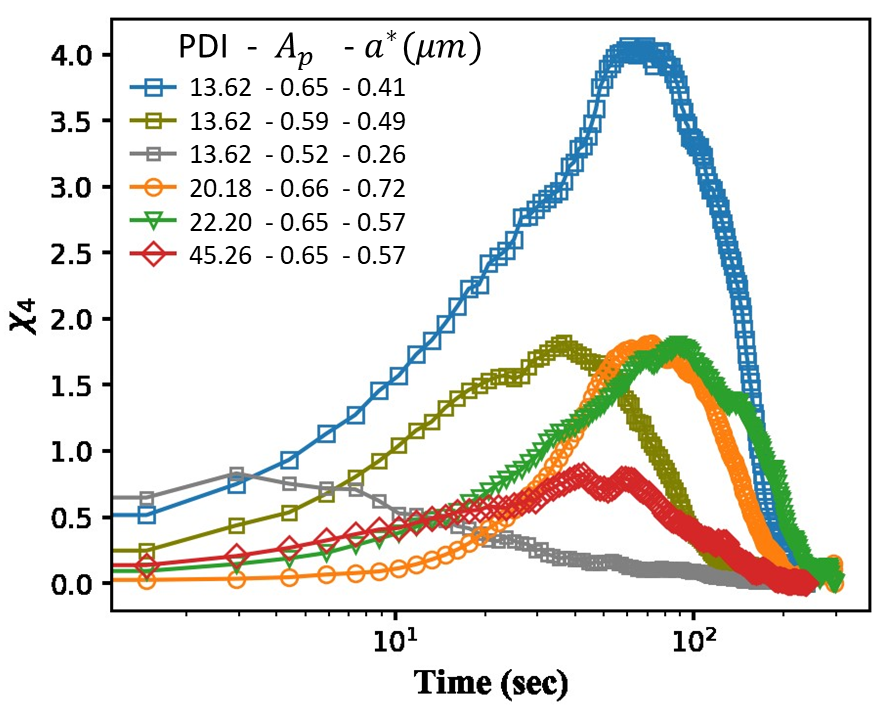
In Fig.2(b), we display the time-decays of estimated from the MSD data (Fig.2(a)) acquired from all the samples. We see that decays faster with increase in particle PDI. For a fixed low particle PDI of , relaxes faster with decreasing area fraction (inset of Fig.2(b)). We have fitted the two-point correlation data with stretched exponential functions, Diaz Vela and Simmons (2020) to compute the characteristic decay times . In the expression for , the fitting parameters and are the prefactor and the stretching exponent respectively. The fitted parameters and are displayed in Table I. We note from the values of that the relaxation process speeds up considerably with increase in particle PDI. We note that while fits to experimental data reveal the actual decay times, the time scales extracted from simulations are related to the number of simulation steps. As discussed earlier, the four-point susceptibility, , can be physically interpreted as a measure of the spatiotemporal variation of . In Fig.3, extracted from experiments with suspensions of different PDIs and area fractions, , are plotted at the optimal probe lengths evaluated as described earlier and tabulated in Table.S2 in Supplementary Information. Finally, we have tabulated the peak heights of the four-point susceptibility functions, , in Table I to systematically study the extent of spatiotemporal heterogeneities in dense PNIPAM suspensions of different area fractions constituted by particles of different PDIs.
It has been reported that while the peak height of is proportional to the extent of dynamical heterogeneity present in the system, the time scale corresponding to the peak position of is comparable to the -relaxation time scale of the sample Karmakar (2016). From the data plotted in Fig.3, we see that the peak becomes weaker as area fraction of the suspension, , is decreased and as particle PDI and sample temperature are increased. A decrease in peak indicates a loss of spatiotemporal correlations. The observed fluidization of the sample with increasing dilution, achieved by decreasing suspension area fraction, is consistent with the predictions of the jamming phase diagram Liu and Nagel (1998). We have also checked that the peak value of decreases with increasing temperature for fixed PDI and area fraction. The data is plotted in Fig.S4 in Supplementary Information. When the sample temperature is raised or particle number density is reduced, the accelerated diffusion of PNIPAM particles results in suspension unjamming. Finally, we note from Fig.3 that an increase in PDI enhances the lubrication effect as described in earlier reports Abraham, Bhattacharrya, and Bagchi (2008); Zaccarelli, Liddle, and Poon (2015) and also results in suspension unjamming.
III.2 Molecular dynamics simulation
We next verify our experimental results by numerically studying the effects of continuous particle size polydispersity on the dynamics of particle packings. We model inter-particle interactions using a Lennard Jones potential, , where is the dispersion energy and corresponds to the minimum center-center distance between particles at which the potential is zero. The Lennard-Jones potential has been used extensively to study supercooled colloidal suspensions and their approach towards the glass transition. In our attempt to qualitatively study the effect of particle size polydispersity on the cooperative particle dynamics and dynamical heterogeneity in the sample, we have selected the Lennard Jones potential Kob and Andersen (1995b) because of its ubiquity in the study of glassy dynamics. We note that the key results of our study are expected to be insensitive to details of the inter-particle potential or number of spatial dimensions. We have introduced polydispersity in size by incorporating a normally distributed function having mean = 0 and standard deviation = 1. In this work, the distribution of sizes () of particles is defined as , where is the normal distribution function. The tails of the distribution have been removed to exclude the biggest and smallest particles.
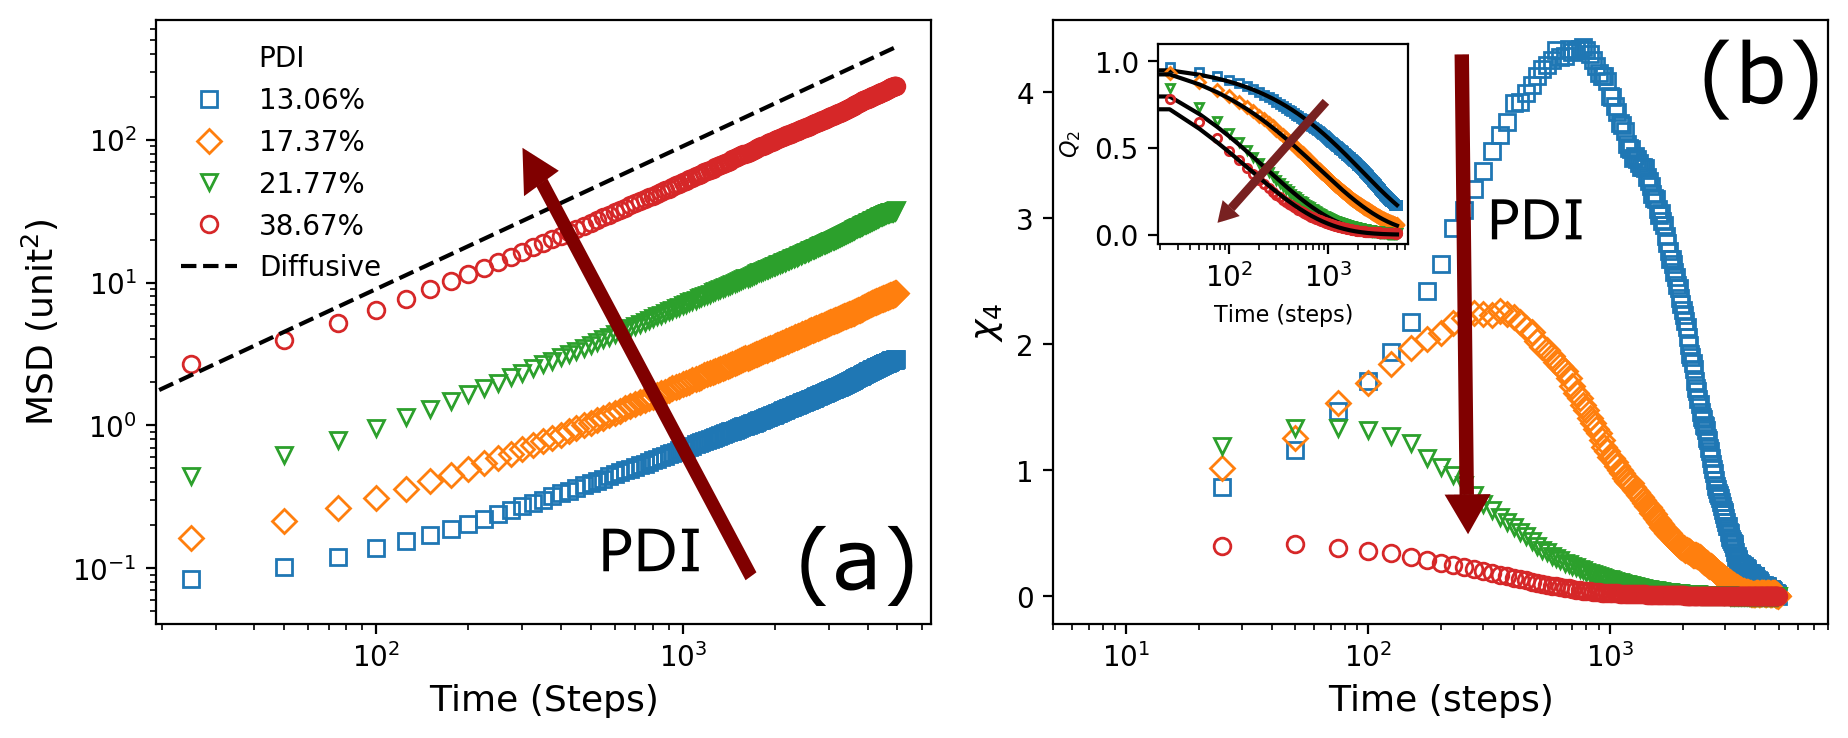
In the molecular dynamics (MD) simulations, the systems were equilibrated at high temperatures to avoid artefacts arising from the initial particle configuration. Furthermore, the simulations were performed in microcanonical ensembles by fixing the volume fraction, , at for a system with particles and for particle PDI values , , and . These parameters were chosen to ensure that the simulations match the experimental conditions. The temperature is fixed at 0.9 (Lennard-Jones unit). We selected seven different regions from the system, each having particles. The usual metrics, the MSD, , and are calculated by averaging over all seven regions to ensure adequate statistics and maximum overlap with experimental conditions. In Fig.4(a), the simulated mean square displacements (MSDs) are plotted for dense suspensions comprising particles with different PDIs. We see that the computed MSD values increase for samples with higher particle PDIs, thereby verifying our experimental result that increasing continuous size polydispersity can drive the fluidization of jammed particulate suspensions.
Next, four-point correlation functions corresponding to the optimal probe lengths, , extracted from simulations using Eqn. 4 and tabulated in Table S2 of Supplementary Information, are plotted time in Fig.4(b). As in the experiments, is chosen independently for each sample and represents the value of at which the peak height of is maximum (Table.S2 in Supplementary Information). We note that , the height of the peak, reduces and shifts to an earlier time for a particle assembly that is characterized by a higher PDI. These results are consistent with our experimental observations. We therefore note that heterogeneous dynamics driven by cooperative particle motion are most significant in dense suspensions characterized by lower particle PDIs. Two-point correlation functions, , for optimal probe length values and several particle PDIs are plotted in the inset of Fig.4(b). In a result that is consistent with our earlier experimental observation plotted in Fig.2(b), we note that the two-point correlation functions, , decay faster as PDI is increased at a fixed area fraction.
Finally, we have performed simulations while also increasing temperatures ( = and ) and volume fractions ( = , and ) for particle packings having the lowest PDI (). This data, presented in Supplementary Information Figs.S5 (a-d), again confirms our earlier experimental results that particle dynamics accelerate with increasing temperature (Fig.S5(a)) and decreasing volume fraction (Fig.S5(b)). The gradual increase in the slope of the MSD plot with increasing temperature in Fig.S5(a) and decreasing in Fig.S5(b) point to enhanced diffusion under these conditions. This observation verifies our earlier claim that the breaking of particle cages due to dilution or increase in temperature can both give rise to accelerated dynamics over long time scales. Our conclusion is supported by the simultaneous decrease in with increasing temperature and decreasing volume fraction (increasing dilution), which suggest reduction in the extent of dynamical heterogeneities under these conditions (Supplementary Information Figs.S5 (c) and (d)).
III.3 Estimation of and a modified jamming-unjamming phase diagram
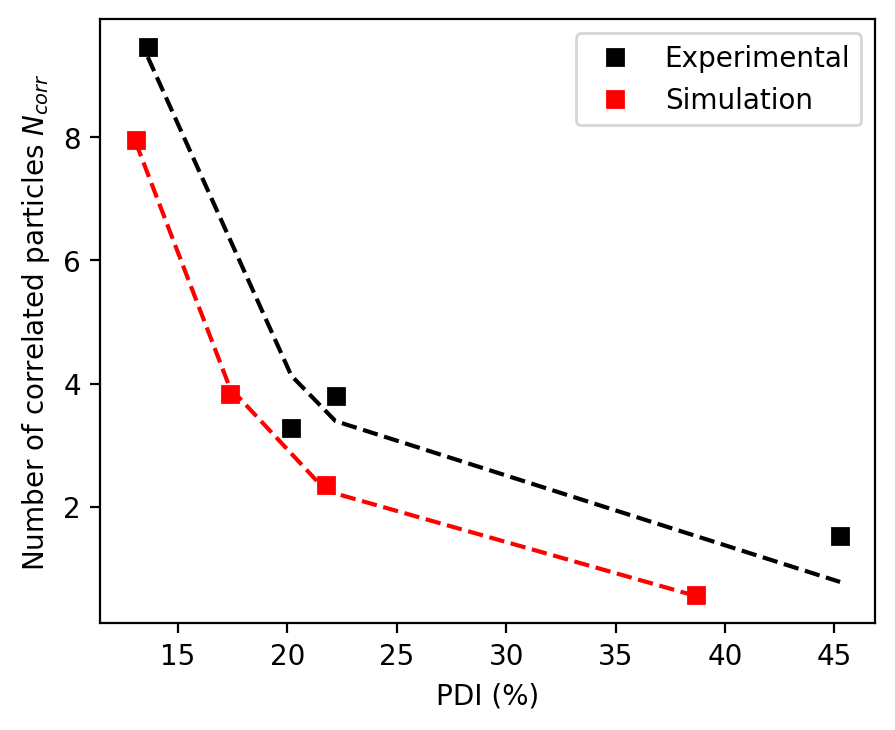
We estimate the characteristic length scales of the cooperatively rearranging regions in dense polydisperse suspensions by plotting , computed from both experiments and simulations using Eqn. 5, vs. PDI, in Fig.5. In spite of the differences in interparticle potential and system dimensionality in our experiments and simulations, we note that decreases with increasing PDI in both cases. We conclude therefore that dense particulate systems can be unjammed by increasing the continuous size polydispersity of the constituent particles at constant medium temperature and particle density.
It is well known that the random close packing fraction of a suspension shifts towards a higher volume fraction with increasing size polydispersity Schaertl and Sillescu (1994). As the smaller particles in polydisperse particle packings are more mobile, they effectively fill the voids between larger particles to create new packing configurations that are more compact than those achieved in size-monodisperse particle assemblies. Consequently, the dynamics of polydisperse particle assemblies can remain fluid-like above the random close packing volume fraction for monodisperse systems Hermes and Dijkstra (2010). By performing systematic experiments and simulations, we have demonstrated here that jammed suspensions can be fluidized effectively by increasing the particle polydispersity index (PDI) and sample temperature (T) and by decreasing particle density / concentration ( in experiments and in simulations). As already discussed for particle packing with large PDIs, the small particles having higher mobilities can effectively enhance the lubrication effect Abraham, Bhattacharrya, and Bagchi (2008). Furthermore, increasing temperature and dilution also contribute to increasing particle mobility, thereby accelerating the average dynamics of the suspension. Our experiments and simulations therefore provide an intuitive description of jamming-unjamming dynamics that is insensitive to system dimension and details of interparticle interactions.
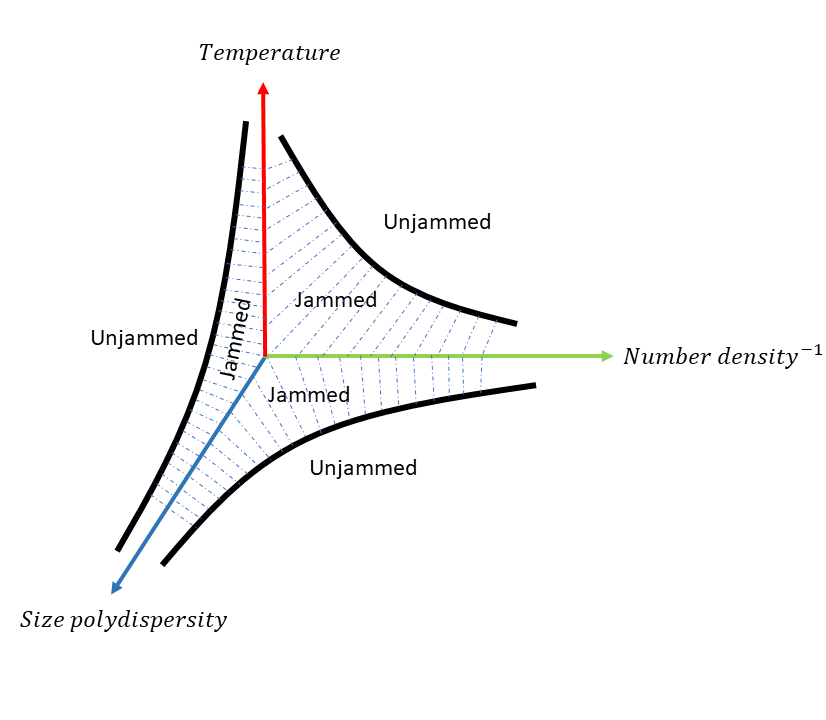
Finally, we propose a modified phase diagram to highlight the jamming to unjamming transition in dense particle packings. While fluidization by increase in temperature, decrease in packing fraction and increase in attractive interactions and applied stress have been discussed in earlier works Liu and Nagel (1998); Trappe et al. (2001); Farris (1968); Gadige et al. (2017), our study suggests a new strategy of suspension unjamming via an increase in particle PDI. A change in PDI changes the nature of correlated motion and dynamical heterogeneity in the samples, thereby modifying the emergent dynamical properties. Our three-dimensional jamming-unjamming phase diagram, displayed in Fig.6, highlights that enhancement of particle polydispersity is an alternate new route to achieve unjamming.
IV Conclusions
Using particle tracking experiments and molecular dynamics simulations, we report the presence of dynamically heterogeneous regions in dense particle packings for low particle polydispersity indices (PDIs) and at low temperatures. We have presented here the first direct measurements of the dependence of the size of dynamical heterogeneity (in terms of ) on particle polydispersity index (PDI). In contrast to earlier work in which two batches of monodisperse particles of incommensurate sizes were mixed to prepare a bidisperse glass Candelier, Dauchot, and Biroli (2009); Zhang et al. (2011); Avila et al. (2014), the present work estimates the dynamics of jammed states constituted by particles having continuous size distributions. We compute mean square displacements to estimate the average dynamics of particles in dense packings and extract multipoint correlation functions to characterize their heterogeneous dynamics. The weakening of particle caging with increase in PDI is evident from our analyses. The observed speeding up of the structural relaxation process with increasing particle PDI can be explained by considering that the faster dynamics of smaller particles in dense systems facilitates accelerated cage rearrangements due to efficient void-filling. This results in reduction of cage-breaking time scales and accelerated suspension dynamics. The particle dynamics are expected to be maximally heterogeneous at the time scale of the structural relaxation process due to the large non-Gaussian displacements of a small fraction of constituent particles during the cage rearrangement process Saltzman and Schweizer (2006); Shell, Debenedetti, and Stillinger (2005). For dense colloidal suspensions, therefore, particle caging and cage-breaking phenomena are strongly dependent on the particle size distribution, which dictates the characteristic time scales associated with particle dynamics in crowded environments.
The spatiotemporal heterogeneities in the dynamics of dense suspensions are studied here by changing the particle area fraction (in experiments) or volume fraction (in simulations) at a fixed PDI, and by also changing particle PDIs at a fixed or . The time and length scales associated with spatiotemporal heterogeneities are extracted from four-point susceptibilites, . The growth of correlations is more prominent for suspensions constituted by particles having narrower size distributions. The presence of heterogeneous and correlated dynamics in dense suspensions, as shown by us via careful experiments and molecular dynamics simulations, points to the analogous natures of the jamming and glass transitions. Despite the distinct features of the interaction potentials and boundary conditions in our experiments and simulations, the observed results exhibit a notable similarity. An increase in the number of particles undergoing correlated motion in suspensions characterized by lower PDIs indicates the existence of a growing length scale Tah, Mutneja, and Karmakar (2021) during the kinetic arrest phenomenon. Besides demonstrating the disappearance of correlated and heterogeneous particle dynamics with increasing particle size distributions, we also show that dynamical heterogeneity vanishes with increase in dilution and temperature. Our work clearly illustrates that the kinetic arrest phenomenon can be controlled by changing particle size polydispersities. It would be interesting to study the influence of local order on the emergence and disappearance of dynamical heterogeneities in future work.
Supplementary material
The supplementary materials provide information on both the synthesis process and the characterization of the particles. Figures illustrating the dependence on probe length are included, and a table presents data regarding the optimal probe length. Additionally, the supplementary information file contains figures that provides further insights into the temperature and volume fraction dependencies.
Author Declarations
Conflict of Interest
The authors have no conflicts to disclose.
Contribution statement
Rajkumar Biswas: Data curation; Formal Analysis; methodology; software; visualization; original draft preparation. Anoop Mutneja: Methodology; software. Smarajit Karmakar: Supervision; original draft preparation; resources. Ranjini Bandyopadhyay: Conceptualization; supervision; project administration; original draft preparation; resources.
Acknowledgements
The authors thank Yatheendran K.M. and Vasudha K.N. for their help during the experiments. R. Biswas and R. Bandyopadhyay would like to acknowledge Lucas Goehring for useful discussion and Sayantan Chanda for his suggestions. S. Karmakar would like to acknowledge support through the Swarna Jayanti Fellowship Grant No. DST/SJF/PSA-01/2018-19 and SB/SFJ/2019-20/05.
Data Availability Statement
The data that support the findings of this study are available from the corresponding author upon reasonable request.
References
References
- Gotze and Sjogren (1992) W. Gotze and L. Sjogren, “Relaxation processes in supercooled liquids,” Reports on progress in Physics 55, 241 (1992).
- Angell (1995) C. A. Angell, “Formation of glasses from liquids and biopolymers,” Science 267, 1924–1935 (1995).
- Berthier and Biroli (2011) L. Berthier and G. Biroli, “Theoretical perspective on the glass transition and amorphous materials,” Reviews of modern physics 83, 587 (2011).
- Karmakar, Dasgupta, and Sastry (2014) S. Karmakar, C. Dasgupta, and S. Sastry, “Growing length scales and their relation to timescales in glass-forming liquids,” Annu. Rev. Condens. Matter Phys. 5, 255–284 (2014).
- Stearns, Duling, and Johnson (1966) R. S. Stearns, I. Duling, and R. H. Johnson, “Relationship of glass transition temperature to viscosity-temperature characteristics of lubricants,” Industrial & Engineering Chemistry Product Research and Development 5, 306–313 (1966).
- Černošek et al. (2002) Z. Černošek, J. Holubová, E. Černošková, and M. Liška, “Enthalpic relaxation and the glass transition,” J Optoelectron Adv Mater 4, 489–503 (2002).
- White and Lipson (2016) R. P. White and J. E. Lipson, “Polymer free volume and its connection to the glass transition,” Macromolecules 49, 3987–4007 (2016).
- Marcelja, Mitchell, and Ninham (1976) S. Marcelja, D. Mitchell, and B. Ninham, “Phase transitions in aqueous suspensions of spherical colloid particles,” Chemical Physics Letters 43, 353–357 (1976).
- Pusey (2008) P. Pusey, “Colloidal glasses,” Journal of Physics: Condensed Matter 20, 494202 (2008).
- Ganapathi, Sood, and Ganapathy (2022) D. Ganapathi, A. Sood, and R. Ganapathy, “Structural origin of excitations in a colloidal glass-former,” The Journal of Chemical Physics 156, 214502 (2022).
- Pusey and van Megen (1987) P. N. Pusey and W. van Megen, “Observation of a glass transition in suspensions of spherical colloidal particles,” Physical Review Letters 59, 2083 (1987).
- Weeks and Weitz (2002a) E. R. Weeks and D. Weitz, “Properties of cage rearrangements observed near the colloidal glass transition,” Physical Review Letters 89, 095704 (2002a).
- Saha, Joshi, and Bandyopadhyay (2014) D. Saha, Y. M. Joshi, and R. Bandyopadhyay, “Investigation of the dynamical slowing down process in soft glassy colloidal suspensions: comparisons with supercooled liquids,” Soft Matter 10, 3292–3300 (2014).
- Gadige et al. (2017) P. Gadige, D. Saha, S. K. Behera, and R. Bandyopadhyay, “Study of dynamical heterogeneities in colloidal nanoclay suspensions approaching dynamical arrest,” Scientific reports 7, 1–9 (2017).
- Berthier et al. (2005) L. Berthier, G. Biroli, J. Bouchaud, L. Cipelletti, D. E. Masri, D. L’Hote, F. Ladieu, and M. Pierno, “Direct experimental evidence of a growing length scale accompanying the glass transition,” Science 310, 1797–1800 (2005).
- Tamborini, Royall, and Cicuta (2015) E. Tamborini, C. P. Royall, and P. Cicuta, “Correlation between crystalline order and vitrification in colloidal monolayers,” Journal of Physics: Condensed Matter 27, 194124 (2015).
- Murarka and Bagchi (2003) R. K. Murarka and B. Bagchi, “Diffusion and viscosity in a supercooled polydisperse system,” Physical Review E 67, 051504 (2003).
- Adhikari, Karmakar, and Sastry (2022) M. Adhikari, S. Karmakar, and S. Sastry, “Dependence of the glass transition and jamming densities on spatial dimension,” arXiv preprint arXiv:2204.02936 (2022).
- Mangeat and Zamponi (2016) M. Mangeat and F. Zamponi, “Quantitative approximation schemes for glasses,” Physical Review E 93, 012609 (2016).
- Götze (2009) W. Götze, Complex dynamics of glass-forming liquids: A mode-coupling theory, Vol. 143 (Oxford University Press on Demand, 2009).
- Janssen (2018) L. M. Janssen, “Mode-coupling theory of the glass transition: A primer,” Frontiers in Physics 6, 97 (2018).
- Brambilla et al. (2009) G. Brambilla, D. El Masri, M. Pierno, L. Berthier, L. Cipelletti, G. Petekidis, and A. B. Schofield, “Probing the equilibrium dynamics of colloidal hard spheres above the mode-coupling glass transition,” Physical Review Letters 102, 085703 (2009).
- Auer and Frenkel (2001) S. Auer and D. Frenkel, “Suppression of crystal nucleation in polydisperse colloids due to increase of the surface free energy,” Nature 413, 711–713 (2001).
- Hermes and Dijkstra (2010) M. Hermes and M. Dijkstra, “Jamming of polydisperse hard spheres: The effect of kinetic arrest,” EPL (Europhysics Letters) 89, 38005 (2010).
- Schaertl and Sillescu (1994) W. Schaertl and H. Sillescu, “Brownian dynamics of polydisperse colloidal hard spheres: Equilibrium structures and random close packings,” Journal of Statistical Physics 77, 1007–1025 (1994).
- Sonntag, Strenge, and Vincent (1987) H. Sonntag, K. Strenge, and B. Vincent, “Diffusion of colloidal particles,” in Coagulation Kinetics and Structure Formation (Springer, 1987) pp. 38–57.
- Hunter and Weeks (2012) G. L. Hunter and E. R. Weeks, “The physics of the colloidal glass transition,” Reports on progress in physics 75, 066501 (2012).
- Kasper, Bartsch, and Sillescu (1998) A. Kasper, E. Bartsch, and H. Sillescu, “Self-diffusion in concentrated colloid suspensions studied by digital video microscopy of core- shell tracer particles,” Langmuir 14, 5004–5010 (1998).
- Saltzman and Schweizer (2006) E. J. Saltzman and K. S. Schweizer, “Non-gaussian effects, space-time decoupling, and mobility bifurcation in glassy hard-sphere fluids and suspensions,” Physical Review E 74, 061501 (2006).
- Sengupta and Karmakar (2014) S. Sengupta and S. Karmakar, “Distribution of diffusion constants and stokes-einstein violation in supercooled liquids,” The Journal of chemical physics 140, 224505 (2014).
- Bhowmik, Tah, and Karmakar (2018) B. P. Bhowmik, I. Tah, and S. Karmakar, “Non-gaussianity of the van hove function and dynamic-heterogeneity length scale,” Physical Review E 98, 022122 (2018).
- Thorneywork et al. (2016) A. L. Thorneywork, D. G. Aarts, J. Horbach, and R. P. Dullens, “On the gaussian approximation in colloidal hard sphere fluids,” Soft Matter 12, 4129–4134 (2016).
- Dauchot, Marty, and Biroli (2005) O. Dauchot, G. Marty, and G. Biroli, “Dynamical heterogeneity close to the jamming transition in a sheared granular material,” Physical Review Letters 95, 265701 (2005).
- Kob and Andersen (1995a) W. Kob and H. C. Andersen, “Testing mode-coupling theory for a supercooled binary lennard-jones mixture. ii. intermediate scattering function and dynamic susceptibility,” Physical Review E 52, 4134 (1995a).
- Shell, Debenedetti, and Stillinger (2005) M. S. Shell, P. G. Debenedetti, and F. H. Stillinger, “Dynamic heterogeneity and non-gaussian behaviour in a model supercooled liquid,” Journal of Physics: Condensed Matter 17, S4035 (2005).
- Dasgupta and Ramaswamy (1992) C. Dasgupta and S. Ramaswamy, “Search for a thermodynamic basis for the glass transition,” Physica A: Statistical Mechanics and its Applications 186, 314–326 (1992).
- Karmakar, Dasgupta, and Sastry (2009) S. Karmakar, C. Dasgupta, and S. Sastry, “Growing length and time scales in glass-forming liquids,” Proceedings of the National Academy of Sciences 106, 3675–3679 (2009).
- Candelier, Dauchot, and Biroli (2009) R. Candelier, O. Dauchot, and G. Biroli, “Building blocks of dynamical heterogeneities in dense granular media,” Physical Review Letters 102, 088001 (2009).
- Maggi et al. (2012) C. Maggi, R. Di Leonardo, G. Ruocco, and J. C. Dyre, “Measurement of the four-point susceptibility of an out-of-equilibrium colloidal solution of nanoparticles using time-resolved light scattering,” Physical Review Letters 109, 097401 (2012).
- Donati et al. (2002) C. Donati, S. Franz, S. C. Glotzer, and G. Parisi, “Theory of non-linear susceptibility and correlation length in glasses and liquids,” Journal of non-crystalline solids 307, 215–224 (2002).
- Abate and Durian (2007) A. R. Abate and D. Durian, “Topological persistence and dynamical heterogeneities near jamming,” Physical Review E 76, 021306 (2007).
- Yunker, Zhang, and Yodh (2010) P. Yunker, Z. Zhang, and A. G. Yodh, “Observation of the disorder-induced crystal-to-glass transition,” Physical Review Letters 104, 015701 (2010).
- Adam and Gibbs (1965) G. Adam and J. H. Gibbs, “On the temperature dependence of cooperative relaxation properties in glass-forming liquids,” The journal of chemical physics 43, 139–146 (1965).
- Sastry (2001) S. Sastry, “The relationship between fragility, configurational entropy and the potential energy landscape of glass-forming liquids,” Nature 409, 164–167 (2001).
- Adhikari, Karmakar, and Sastry (2021) M. Adhikari, S. Karmakar, and S. Sastry, “Spatial dimensionality dependence of heterogeneity, breakdown of the stokes–einstein relation, and fragility of a model glass-forming liquid,” The Journal of Physical Chemistry B 125, 10232–10239 (2021).
- Flenner and Szamel (2015) E. Flenner and G. Szamel, “Fundamental differences between glassy dynamics in two and three dimensions,” Nature communications 6, 7392 (2015).
- Mattsson et al. (2009) J. Mattsson, H. M. Wyss, A. Fernandez-Nieves, K. Miyazaki, Z. Hu, D. R. Reichman, and D. A. Weitz, “Soft colloids make strong glasses,” Nature 462, 83–86 (2009).
- Van Der Scheer et al. (2017) P. Van Der Scheer, T. Van De Laar, J. Van Der Gucht, D. Vlassopoulos, and J. Sprakel, “Fragility and strength in nanoparticle glasses,” ACS nano 11, 6755–6763 (2017).
- Abraham, Bhattacharrya, and Bagchi (2008) S. E. Abraham, S. M. Bhattacharrya, and B. Bagchi, “Energy landscape, antiplasticization, and polydispersity induced crossover of heterogeneity in supercooled polydisperse liquids,” Physical Review Letters 100, 167801 (2008).
- Zaccarelli, Liddle, and Poon (2015) E. Zaccarelli, S. M. Liddle, and W. C. Poon, “On polydispersity and the hard sphere glass transition,” Soft Matter 11, 324–330 (2015).
- Behera et al. (2017) S. K. Behera, D. Saha, P. Gadige, and R. Bandyopadhyay, “Effects of polydispersity on the glass transition dynamics of aqueous suspensions of soft spherical colloidal particles,” Physical Review Materials 1, 055603 (2017).
- Bouchaud and Biroli (2005) J.-P. Bouchaud and G. Biroli, “Nonlinear susceptibility in glassy systems: A probe for cooperative dynamical length scales,” Physical Review B 72, 064204 (2005).
- Narumi et al. (2011) T. Narumi, S. V. Franklin, K. W. Desmond, M. Tokuyama, and E. R. Weeks, “Spatial and temporal dynamical heterogeneities approaching the binary colloidal glass transition,” Soft Matter 7, 1472–1482 (2011).
- Glotzer, Novikov, and Schrøder (2000) S. C. Glotzer, V. N. Novikov, and T. B. Schrøder, “Time-dependent, four-point density correlation function description of dynamical heterogeneity and decoupling in supercooled liquids,” The Journal of Chemical Physics 112, 509–512 (2000).
- Lačević et al. (2003) N. Lačević, F. W. Starr, T. Schrøder, and S. C. Glotzer, “Spatially heterogeneous dynamics investigated via a time-dependent four-point density correlation function,” The Journal of chemical physics 119, 7372–7387 (2003).
- Flenner et al. (2009) E. Flenner, J. Das, M. C. Rheinstädter, and I. Kosztin, “Subdiffusion and lateral diffusion coefficient of lipid atoms and molecules in phospholipid bilayers,” Physical Review E 79, 011907 (2009).
- Chakrabarty et al. (2017) S. Chakrabarty, I. Tah, S. Karmakar, and C. Dasgupta, “Block analysis for the calculation of dynamic and static length scales in glass-forming liquids,” Physical Review Letters 119, 205502 (2017).
- Flenner and Szamel (2010) E. Flenner and G. Szamel, “Dynamic heterogeneity in a glass forming fluid: Susceptibility, structure factor, and correlation length,” Physical review letters 105, 217801 (2010).
- Still et al. (2013) T. Still, K. Chen, A. M. Alsayed, K. B. Aptowicz, and A. Yodh, “Synthesis of micrometer-size poly (n-isopropylacrylamide) microgel particles with homogeneous crosslinker density and diameter control,” Journal of colloid and interface science 405, 96–102 (2013).
- Heskins and Guillet (1968) M. Heskins and J. E. Guillet, “Solution properties of poly (n-isopropylacrylamide),” Journal of Macromolecular Science—Chemistry 2, 1441–1455 (1968).
- Hirokawa and Tanaka (1984) Y. Hirokawa and T. Tanaka, “Volume phase transition in a non-ionic gel,” in AIP Conference Proceedings, Vol. 107 (American Institute of Physics, 1984) pp. 203–208.
- Appel, Fölker, and Sprakel (2016) J. Appel, B. Fölker, and J. Sprakel, “Mechanics at the glass-to-gel transition of thermoresponsive microgel suspensions,” Soft Matter 12, 2515–2522 (2016).
- (63) https://cismm.web.unc.edu/, “Video spot tracker,” .
- Weeks and Weitz (2002b) E. R. Weeks and D. A. Weitz, “Subdiffusion and the cage effect studied near the colloidal glass transition,” Chemical physics 284, 361–367 (2002b).
- Kegel, , and van Blaaderen (2000) W. K. Kegel, , and A. van Blaaderen, “Direct observation of dynamical heterogeneities in colloidal hard-sphere suspensions,” Science 287, 290–293 (2000), https://www.science.org/doi/pdf/10.1126/science.287.5451.290 .
- Diaz Vela and Simmons (2020) D. Diaz Vela and D. S. Simmons, “The microscopic origins of stretched exponential relaxation in two model glass-forming liquids as probed by simulations in the isoconfigurational ensemble,” The Journal of Chemical Physics 153, 234503 (2020).
- Karmakar (2016) S. Karmakar, “An overview on short and long time relaxations in glass-forming supercooled liquids,” in Journal of Physics: Conference Series, Vol. 759 (IOP Publishing, 2016) p. 012008.
- Liu and Nagel (1998) A. J. Liu and S. R. Nagel, “Jamming is not just cool any more,” Nature 396, 21–22 (1998).
- Kob and Andersen (1995b) W. Kob and H. C. Andersen, “Testing mode-coupling theory for a supercooled binary lennard-jones mixture i: The van hove correlation function,” Physical Review E 51, 4626 (1995b).
- Trappe et al. (2001) V. Trappe, V. Prasad, L. Cipelletti, P. Segre, and D. A. Weitz, “Jamming phase diagram for attractive particles,” Nature 411, 772–775 (2001).
- Farris (1968) R. Farris, “Prediction of the viscosity of multimodal suspensions from unimodal viscosity data,” Transactions of the Society of Rheology 12, 281–301 (1968).
- Zhang et al. (2011) Z. Zhang, P. J. Yunker, P. Habdas, and A. Yodh, “Cooperative rearrangement regions and dynamical heterogeneities in colloidal glasses with attractive versus repulsive interactions,” Physical Review Letters 107, 208303 (2011).
- Avila et al. (2014) K. E. Avila, H. E. Castillo, A. Fiege, K. Vollmayr-Lee, and A. Zippelius, “Strong dynamical heterogeneity and universal scaling in driven granular fluids,” Physical Review Letters 113, 025701 (2014).
- Tah, Mutneja, and Karmakar (2021) I. Tah, A. Mutneja, and S. Karmakar, “Understanding slow and heterogeneous dynamics in model supercooled glass-forming liquids,” ACS omega 6, 7229–7239 (2021).