Resurgence of superconductivity and the role of hole band in FeSe1-xTex
Abstract
Iron-chalcogenide superconductors display rich phenomena caused by orbital-dependent band shifts and electronic correlations. Additionally, they are potential candidates for topological superconductivity due to the band inversion between the Fe bands and the chalcogen band. Here we present a detailed study of the electronic structure of the nematic superconductors FeSe1-xTex () using angle-resolved photoemission spectroscopy to understand the role of orbital-dependent band shifts, electronic correlations and the chalcogen band. We assess the changes in the effective masses using a three-band low energy model, and the band renormalization via comparison with DFT band structure calculations. The effective masses decrease for all three-hole bands inside the nematic phase followed by a strong increase for the band with orbital character. Interestingly, this nearly-flat band becomes more correlated as it shifts towards the Fermi level with increasing Te concentrations and as the second superconducting dome emerges. Our findings suggests that the hole band, which is very sensitive to the chalcogen height, could be involved in promoting an additional pairing channel and increasing the density of states to stabilize the second superconducting dome in FeSe1-xTex. This simultaneous shift of the hole band and enhanced superconductivity is in contrast with FeSe1-xSx.
I Introduction
Iron-chalcogenide superconductors (FeCh) display a wide variety of complex electronic phases due to their multi-band nature, small Fermi-energies and large orbital-dependent electronic correlations [1, 2, 3]. These stabilize rich phase diagrams that include electronic nematic and spin-density wave phases [4, 5], topological surface states [6] and bring the system in the proximity of a BCS-BEC transition [7]. The electronic nematic phase manifests as a spontaneous breaking of the rotational symmetry induced by orbital and momentum dependent band shifts [8, 9]. Studies under small amounts of applied strain along the symmetry breaking channel lead to a divergent elastoresistivity close to the transition temperature, revealing its electronic origin [10, 11, 12, 13].
Although, nematic critical fluctuations have been suggested to enhance superconductivity [14], the nematic phase is usually accompanied by a spin-density wave, making it difficult to isolate which interaction is driving the superconductivity [15, 16, 17, 18]. Moreover, the finite coupling with the lattice can be detrimental on the critical nematic fluctuations and superconductivity [4, 19]. FeSe is a unique system which harbours an extended and tunable nematic electronic phase in the absence of long range magnetic order, whilst still stablizing superconductivity at low temperatures [20]. Studies of the superconducting gap have suggested a sign-changing pairing symmetry which is consistent with a spin-fluctuation mechanism [21, 22, 23], but competing Néel and stripe magnetic fluctuations are found in FeSe [24, 22]. In the presence of non-magnetic disorder both superconductivity and nematicity is suppressed in Fe1-xCuxSe studies [25].
The nematic order of FeSe can be effectively tuned via isoelectronic substitution of Se with S or Te, and the band structure is very sensitive to the chalcogen height above the conducting planes [13, 26]. In addition, the Te substitution causes the chalcogen band to shift down towards the hole pockets of the Fe bands and induce a band inversion at the Fermi level [27], which could stabilize topological surface states [28, 6, 29, 15]. The orbital dependence of the electronic correlations becomes significant for high Te concentration where the band with orbital character experiences a large increase in effective mass relative to other bands with orbital character [1, 30, 31].
Single crystals inside the nematic phase of FeSe1-xTex series with low Te content have only recently become available, as the chemical vapour transport techniques have overcome the phase separation [32, 33]. Recent studies have determined the superconducting phase diagram which harbours two superconducting regimes, one dome inside the nematic phase followed by a second dome which emerges at the nematic end point, proposed to be driven by critical nematic fluctuations [34].
In this paper, we report a detailed ARPES study of the nematic FeSe1-xTex single crystals and determine the evolution of the low-energy features and the role of electronic correlations. Employing a detailed multi-band model, we extract the effective masses of all three hole bands which decrease with increasing Te concentration as both the nematic order and superconducting phases are suppressed. We find that the effective mass of the hole band with character displays a non-monotonic variation reaching a minimum before increasing significantly with the Te substitution. Simultaneously, the hole band shifts towards the Fermi level, which could open a new pairing channel for superconductivity and an enhancement in the density of states, potentially stabilizing a second superconducting dome. The dependence of the ARPES spectra enables us to assess the contribution of the chalcogen band, which is instrumental in the formation of topological superconductivity. Lastly, we explore the evolution of the electron pockets with Te concentration and find that size of the pockets increase, whereas the nematic splitting slowly reduces as the nematic phase has a extended compositional range.
II Results
II.1 The evolution of the hole bands
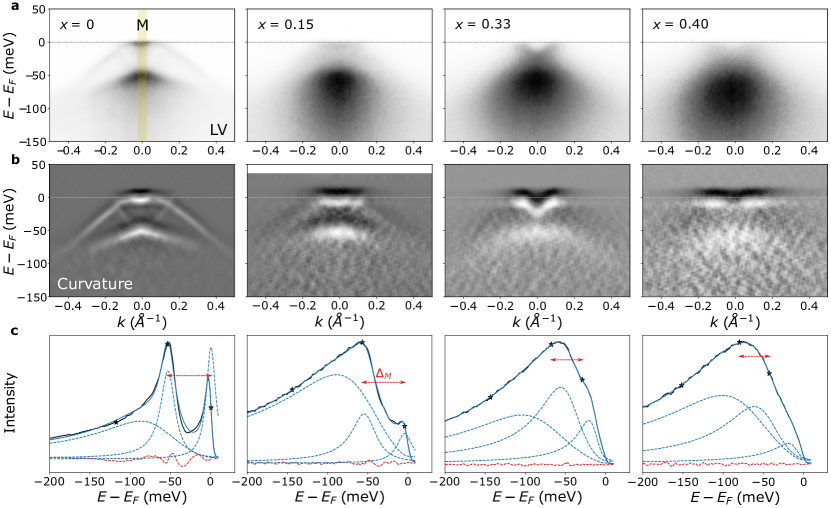
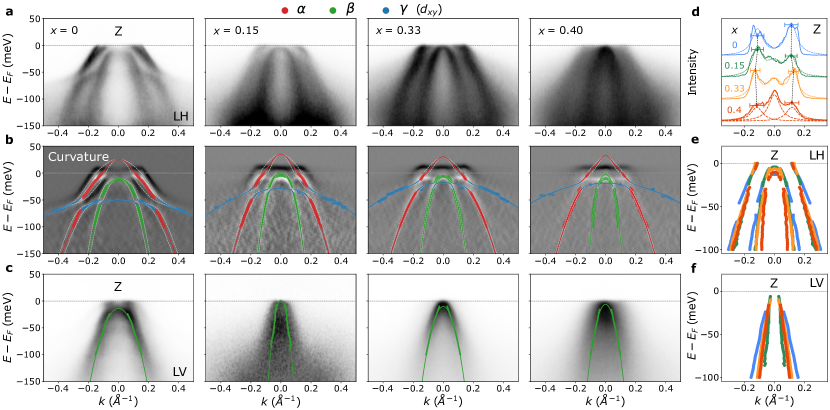
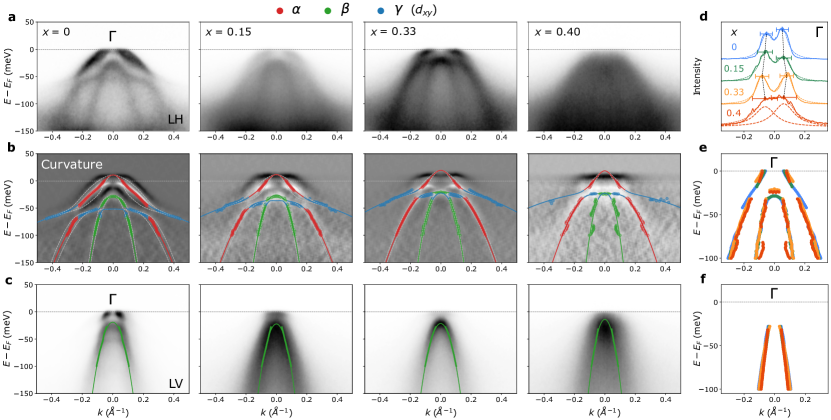
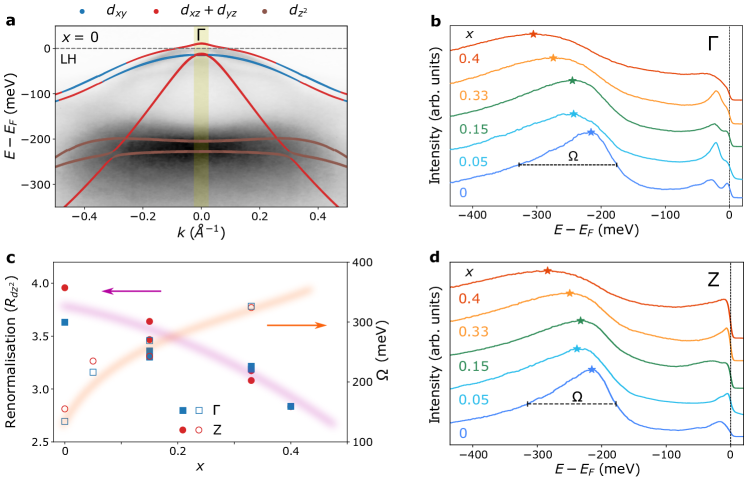
The band structure of tetragonal FeSe, which is dominated by the bands with Fe 3 orbital character at the Fermi level (), consists of multiple hole pockets in the centre of the Brillouin zone and electron pockets in the corners of it. Fig. 1(a) shows the measured hole band dispersions along the direction for different compositions of FeSe1-xTex. To highlight weaker spectral features for some of the bands, we have calculated the corresponding curvature [35], as illustrated in Fig. 1(b). We clearly observe two dispersive bands with mixed orbital character, labelled as the band for the outer hole band and the band for the inner band. A third much flatter band with dominant orbital character, labelled , has a weaker spectral weight and is seen meV below the Fermi level in FeSe [13]. As the intensity of ARPES data is proportional to the matrix elements, which are dependent on the properties of both the incident light and the excited electrons, we also use the linear vertical (LV) polarisation to isolate the hole band, as shown in Fig. 1(c) [36]. Moreover, matrix elements suppress significantly the intensity associated with bands of orbital character in both polarisations. Therefore, the band is mainly visible via hybridization with the and bands and it can be visualized using the curvature analysis in Fig. 1(b).
Next, we discuss the band dispersions of the and hole bands shown in Fig. 1(b). To quantify precisely their position we use both momentum distribution curves (MDCs) (fitted to pairs of symmetric Lorentzian peaks in Fig. 1(d)) and the maximum in the energy distribution curves (EDCs) to define the top of the band which is located mainly below . We observe that the hole band clearly crosses the Fermi level (see Fig. 1(c)), whereas the spectral weight of the band only emerges from as a central peak in the MDC spectrum at , as shown in Fig. 1(d). In tetragonal FeSe the band forms a 3D hole pocket, however upon entering the nematic phase this pocket is pushed below the Fermi-level [37, 3]. By suppressing the nematic phase with S substitution, the pocket re-emerges at FeSe0.89S0.11 [37, 3] However, with Te substitution, in which the nematic phase extends over a larger compositional range towards [34], the shift of this band is less pronounced. Interestingly, the band shifts significantly from a binding energy around 50 meV to 20 meV towards the Fermi level at both high symmetry points (see Figs. 1(b) and S6 in the Supplementary Material (SM)) This is in contrast to findings for the FeSe1-xSx series, where the band is relatively unaffected by isoelectronic substitution up to [38]. However, these findings are in good agreement with the prediction of the DFT calculations which shows that the band only begins to shift for value of Å(see Fig. S3(d) in the SM).
Fig. 1(e) and (f) show that the extracted band dispersions for the and hole bands become narrower, suggesting a decrease in the effective masses with increasing Te concentration. The extracted values of the Fermi wavevector, , suggest that the size of the hole pocket hardly varies with increasing Te concentration, consistent with studies at higher values [39] (see Figs. 1(d) and S7 in the SM)
The nematic order parameter, is usually estimated from the energy splitting between the and hole bands, given by [40, 41]. As the spin-orbit coupling (SOC) parameter, meV for FeSe at high temperatures inside the tetragonal phase [13, 42, 20], and at low temperatures increase towards meV, the value of was estimated as 29meV for FeSe [42, 20]. With S isoelectronic substitution decreases and at low temperatures the hole band crosses the Fermi level and forms the 3D pocket at point [37, 38, 3]. In contrast, the splitting for FeSe1-xTex remains around 38(3) meV due to two competing effects: one caused by the reduction in the nematic order parameter with increasing and the second caused by the enhanced SOC splitting (DFT calculations predict a variation from 82 meV for FeSe to 177 meV for FeTe at the point, as shown in Fig. S1 in the SM).
II.2 The role of the chalcogen band
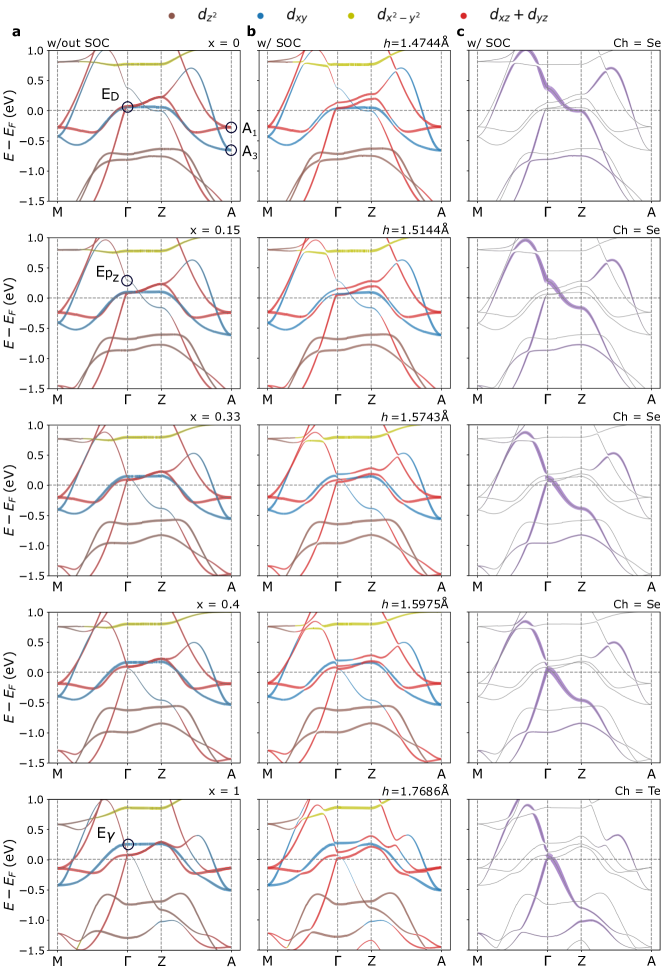
The position of the band and its interaction with the hole bands is complex and heavily dependent on the chalcogen height, , which strongly changes with the Te concentration, , as shown in Fig. S1 and S2 in the SM. The chalcogen band, which is predicted to be located above the Fermi level at the point in FeSe, intercepts vertically all three hole bands along the direction (see in Fig. S1 in the SM) . Due to symmetry reasons, the crossing between the inner hole band and the chalcogen band is proposed to create a band inversion, allowing topological surface states to form [6, 15]. Based on the DFT predictions, this crossing first occurs at the point for Å, and its hybridisation with the inner hole band creates a gap (along the direction). As a consequence the band and the inner hole band smoothly merge and their orbital characters mix, resulting in a pseudo-inner hole band having a larger degree of orbital character [27].
In order to assess the contribution of the band in experiments, we perform a quantitative analysis of the ARPES intensity of the band in relation to the band, . This relative intensity is evaluated at the two high-symmetry points with different values ( and ) giving the ratio . We find this ratio to increase beyond , as shown in Figs. 1 and S7 in the SM. This variation in intensity indicates an alteration in the orbital character of the bands due to hybridization with other bands. However, changes in intensity due to nematic effects and the contribution from the band should manifest equally at the and point. Thus, the variations in the intensity ratio suggest that the matrix elements have changed for the band due to the interaction with the band, which is strongly dependent. This is in agreement with previous studies which have highlighted the presence of the band at in [43, 27, 44]. Additionally, we observe the emergence of a central peak in the MDCs at for , which could also be due to the enhanced intensity of the band at .
II.3 The low-energy model and effective masses
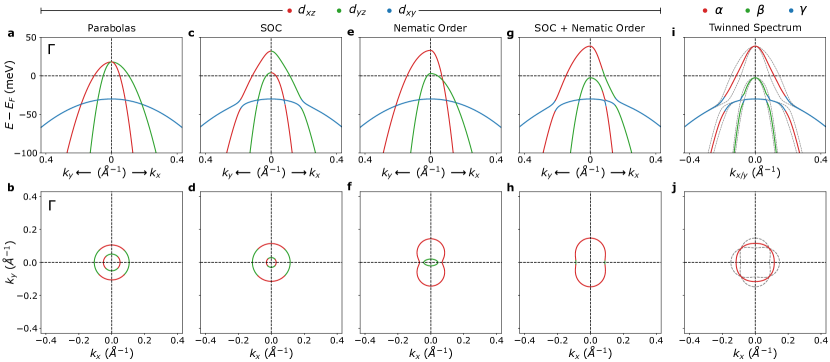
In order to quantify the evolution of the electronic correlations and band shifts of the hole bands of FeSe1-xTex as a function of Te concentration, we employed a low energy three-band model to describe the effective masses of the , and bands. This model contains essentially three parabolic dispersions in the presence of SOC and the nematic order. This approach is an extension of the model developed from Refs. [45, 40, 46] to accommodate the third hole band, , as detailed in Fig. S4 in the SM. To constrain the parameters of the model we fixed to be proportional to the nematic transition temperature, , such that meV for FeSe, as reported in Ref. [13, 42]. This additional constraint was introduced to account for the fact that the nematic order parameter is difficult to estimate from the splitting between the and hole bands, . This is caused by the lack of experimental data above the Fermi level and linewidth broadening caused by the impurity scattering and averaging over two different domains, as detailed in the SM.
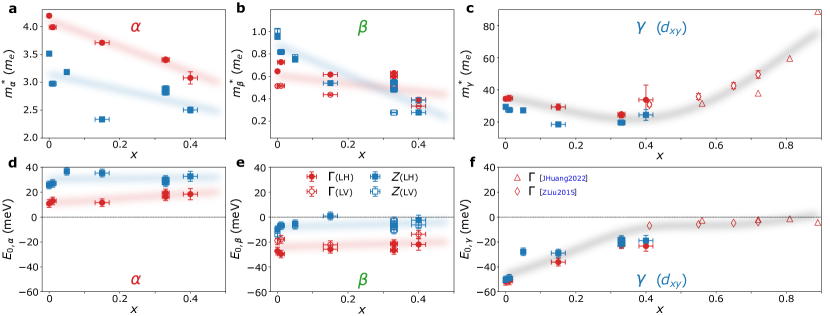
Fig. 2 shows the extracted effective masses, , from the three-band model as a function of Te concentration. For the and hole bands, decreases with increasing Te substitution. This is similar to the renormalisation factor for the band, as shown in Fig. S8(c) in the SM. In contrast, the effective mass of the hole band displays a non-monotonic behaviour, as it decreases inside the nematic phase (from towards a minimum close to ) and then increases to values twice as large as those seen in FeSe at [30, 31].
The renormalisation factors for each band can be estimated from the ratio of the experimental effective masses to the band masses evaluated from DFT calculations. The estimated values for FeSe are 3.5 and 1.8 for the and band, respectively, which is in close agreement to those previously reported [47]. However, for the band we determine a value , whereas previous studies give values between 8 and 10 [13, 47]. This discrepancy lies within our use of the curvature analysis, which gives us a larger momentum range to constrain the fit and our consideration for the SOC between the and bands.
II.4 Evolution of the electron pockets
Fig. 3(a) shows the evolution of the ARPES spectra corresponding to the electron pockets centred at the high-symmetry point for different Te substitutions. We observe significant changes between the spectra for the different compositions, as compared with FeSe, in particular at high Te concentration () where only one large electron pocket is detected. The DFT calculations in the tetragonal phase indicate that there are two degenerate points ( corresponds to two bands with character whereas is for two bands of character) [40] (see Fig. S1 in the SM). The energy separation between spectral features along the EDC at the point, defined as , is finite inside the tetragonal phase and found to be meV for FeSe0.82S0.18 [3]. However, as the nematic phase emerges the degeneracy of the two points are lifted (see Fig. S10 in the SM) the value of has been originally interpreted as a parameter to quantify the nematic order [48, 49, 50], increasing towards meV [13] in bulk FeSe or meV in thin films of FeSe [49].
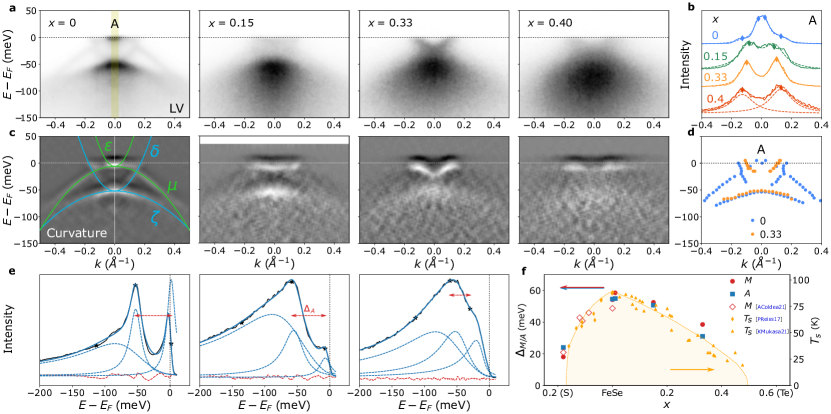
Fig. 3(e) illustrates the estimation of for different FeSe1-xTex from the EDC curves, as the separation between the two upper-most Lorentzian centres where the energy broadening is assumed to be linearly dependent on energy. This linear energy dependence, often associated to a marginal Fermi-liquid behaviour in iron-based superconductors [51], is evaluated by analysing the hole band dispersion, as shown in Fig. 1(c) and Fig. S6(c) in the SM. Fig. 3(f) shows that there is a direct correlation between and the structural transition , similar to FeSe1-xSx [3], which decreases as the nematic order is suppressed with increasing Te substitution. However, to assess the precise nematic electronic order parameter any additional splitting would need to be quantified for single domain detwinned samples under applied strain, as in the case of FeSe [40, 52, 46, 50, 48, 49, 9].
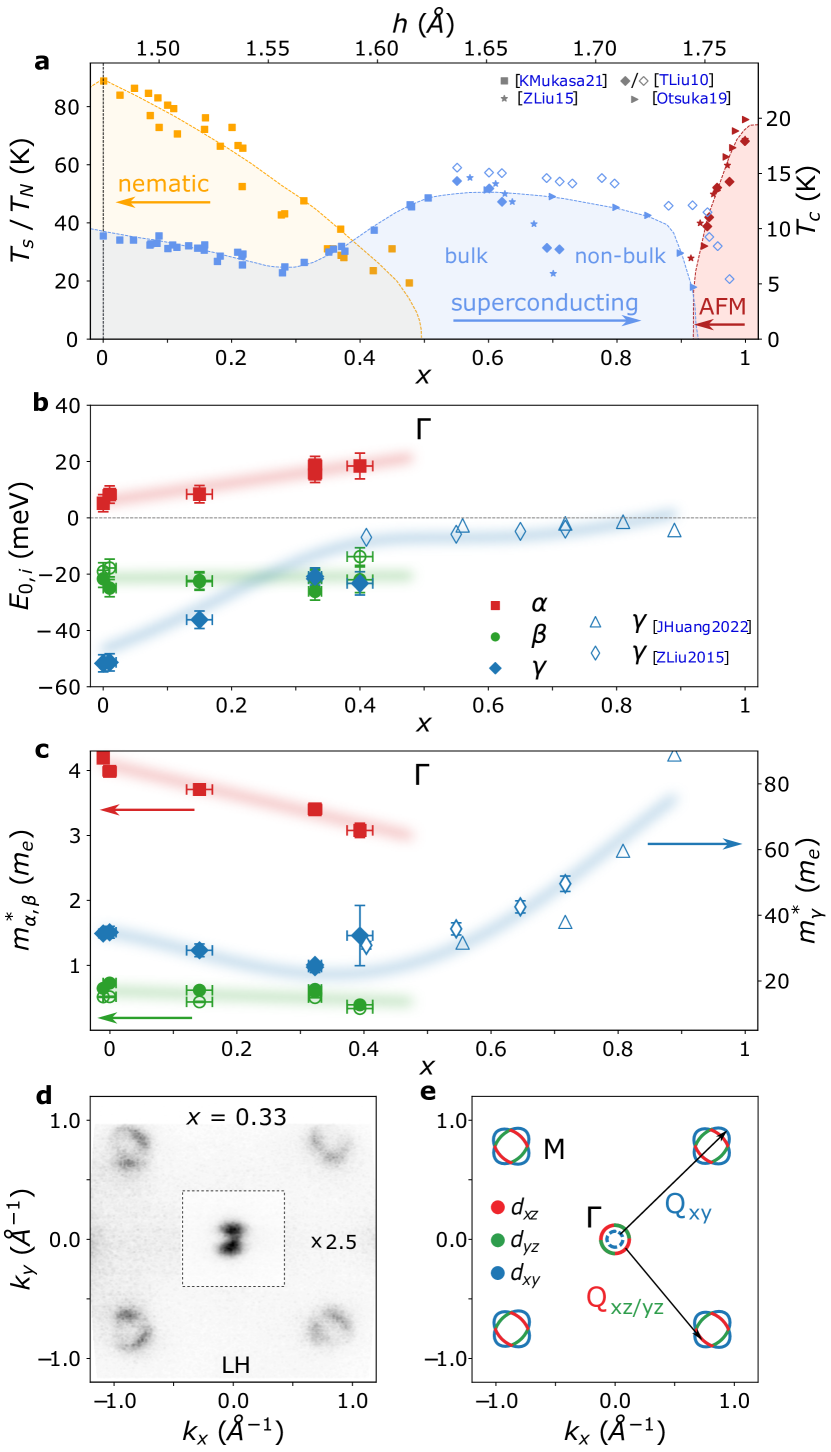
Fig. 3(d) shows a comparison between the different band dispersions centered at the point, using the extremal values from the curvature plots due to their weak features. Interestingly, we find the position of the hole-like band dispersion, , remains unchanged up to , as shown in Fig. 3(c), where this continues even for higher Te concentrations () [30]. Furthermore, only one electron pocket is resolved for higher (using the MDC curves in Fig. 3(b)) and the values increase with Te concentration. This is possibly due to the electron pockets becoming more isotropic as the nematic phase is suppressed. Additionally, the Fermi surfaces map of (see Fig. 4(e)) shows that the size of the electrons pockets relative to the hole pockets is larger, suggesting that the system may be slightly electron doped (the average values for = 0.4 is 0.12 Å-1 for the electron pockets and 0.09 Å-1 for the hole pockets).
III Discussion
The phase diagram of FeSe1-xTex illustrates the suppression of the nematic phase with increasing the Te concentration, , as shown in Fig. 4(a). The superconducting transition temperature, , decreases inside the nematic phase towards a minimum of K around , followed by an increase towards 13 K above . This resurgent superconducting dome extends over a large range and becomes filamentary as the system approaches the bi-collinear magnetic order close to FeTe [53]. Fig. 4(c) shows that the effective masses, of the , and hole bands decrease by increasing , which correlates with the reduction of the renormalisation factor associated the hole band, as shown in Fig. S8(c) in the SM. Interestingly, the reduction of the effective mass of the hole band, which crosses the Fermi level, is accompanied by the suppression of superconductivity inside the nematic phase, suggesting this hole pocket is likely to be involved in the superconducting pairing. This is consistent with previous trends detected from quantum oscillations in FeSe1-xSx, where both the effective mass and the superconducting transition temperature, , reach a maximum near , followed by a strong suppression towards FeS [54, 3, 38], as well as for FeSe0.89S0.11 under pressure [4].
The changes in the effective masses also reflect the potential role played by the chalcogen band. The rate of decrease of the effective mass, , for the band with the Te concentration, , is very similar for both high symmetry points. On the other hand, the effective mass for the lighter band decreases faster at the point, as compared with the point (Fig. 2(b)). When the band intersect the band the orbital mixing between the two is strongest at the Z point. As the orbital is assumed to be less correlated than the Fe orbitals [43], it is expected that the effective mass of the band should be further reduced at the point relative to the point, in agreement with the observed experimental trends.
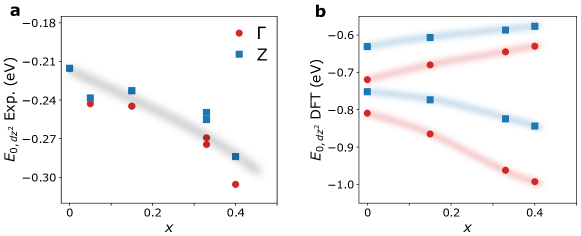
Fig. 4(b) and Fig. 2(d-f) show the Fermi energies, , of the different bands estimated from the low-energy model as a function of , indicating that and bands experience minimal variation. On the other hand, the band with the orbital character varies significantly and shifts towards the Fermi level up to , then it plateaus in its vicinity. Experimentally, there is a degree of uncertainty whether the band crosses the Fermi level [1, 39, 7] or not [30, 31], and this discrepancy could be due to the amount of excess Fe in these systems [7]. Regardless, this is the region in the phase diagram where the second superconducting dome is stabilized, suggesting that the hole band with orbital character could be involved in pairing. Furthermore, the strong shift of the band towards the Fermi level and the accompanying enhancement of superconductivity was also seen in thin films of FeSe1-xTex/CaF2 [56].
To understand the significant shift towards the Fermi level of the band one can consider two mechanisms. Firstly, DFT predicts that the band moves up linearly with Te concentration, , as the chalcogen height, , increases and the lattice expands (see Figs. 4(b) and Fig. S1 in the SM). Secondly, variations of the bandwidth, due to electronic correlations, will also cause the Fermi energy to change, which can be crudely scaled as . Thus, by combining the effect of the lattice and of the electronic correlations, the changes in the position of the band could be described by a phenomenological model, . Fig. 4(c) shows a fit to the experimental positions of the band, where is the weight of the lattice effect, is the weight of the bandwidth and is an arbitrary offset ( is taken as a 5th order polynomial fit from Fig. 2(c)). We find the fit captures the initial increase followed by a plateau for . For even higher values a new hole-like pocket with orbital character was detected at the point for due to the increase in electronic correlations which leads to the loss of the spectral weight of the band [31].
The presence of the third hole band with orbital close to the Fermi level and its involvement in pairing could manifest in different ways. Firstly, the hybridisation of the hole band with the band would lead to a reduction in the Fermi velocity, thus increasing the density of states and enhancing superconductivity. Secondly, the orbital mixing between these bands would open up a new pairing channel which connects to the orbital character at the electron pocket with the hole pockets (see Fig. 4(e)). Thirdly, a new pairing channel could be achieved if is smaller than the superconducting gap, as in this regime the band can play the role of an incipient band [57]. The superconducting pairing in FeSe is proposed to be mediated by spin fluctuations between the hole and electron pockets with orbital character along (Fig. 4(e)) [23, 58, 24, 17]. A similar vector, , that would connect the channel and the observation of stripe magnetic fluctuations in FeSe1-xTex could suggest that the second superconducting dome may also be driven by spin fluctuations [59, 60, 53]. However, neutron scattering studies also observe the development of () spin fluctuations which compete with superconductivity [53]. This competition is evident as the suppression of superconductivity, towards FeTe, is accompanied by the development of a double-stripe magnetic order with a wave vector [55].
There is a strong contrast between FeSe1-xTex and FeSe1-xSx series, which displays no enhancement of outside the nematic phase and the hole band is located 50 meV below the Fermi level [3]. Additionally, quantum oscillations found a direct correlation between the evolution of the effective mass of the band and in FeSe1-xSx [54], which also occurs inside the nematic phase of FeSe1-xTex. These trends change significantly in the vicinity of the nematic end point of FeSe1-xTex (), as the effective masses for the and hole bands remain rather constant [30, 31], whereas the superconductivity is enhanced (see Fig. 4(a)). On the other hand, both the effective mass for the band and increase at a similar composition . This suggests that the mechanism for superconductivity likely changes across the phase diagram of FeSe1-xTex [30, 61] and the hole band , with orbital character, plays an important role.
An alternative mechanism for the enhancement of superconductivity can be related to its proximity to the nematic end point. Theoretically, nematic fluctuations should support superconductivity in both an or -wave pairing channel [19, 1], and elastoresistivity studies find a divergence of the nematic susceptibility near its end point [34]. However, studies of FeSe0.89S0.11 under pressure suggest the critical fluctuations could either be quenched via the coupling of the nematic order to the lattice [4] or obscured within the nematic islands of a quantum Griffiths phase [62]. Moreover, other hallmarks of a quantum critical point in FeSe1-xTex, such as the divergence of the effective masses at the nematic end point and/or a linear dependence of resistivity in temperature are not observed [5]. These systems are rather bad metals, with large linewidths in the ARPES spectra, which could be caused by the large distribution of the Se and Te ions (chalcogen heights differ by 0.24 Å) [63] and the stabilization of the interstitial Fe that could act as additional scattering centers.
The evolution of the band structure and the significant shifts of the band via Te substitution have implications on other studies. The chalcogen height is an important parameter that influences the changes in the band structure, magnetic ground state and superconductivity [26, 64]. For example, , could be shifted towards higher values with applied pressure in other iron chalcogenides, despite the shrinking of the unit cell. Theoretical studies of FeSe and NMR studies of FeSe0.88S0.12 have suggested that the hole band could lead to the enhanced superconducting dome induced by pressure [65, 66]. However, pressure also induces magnetic order and the maximum in is often located at the end point of the magnetic phase in FeSe1-xSx [67, 5], suggesting that magnetic fluctuations are important for superconducting pairing.
IV Conclusion
In this study we present a comprehensive investigation of the low-temperature band structure of the nematic FeSe1-xTex series. We identify a direct correlation between the changes in the nematic transition with the spectral features in the dispersions at the corner of the Brillouin zone, in agreement with other studies on iron-chalcogenide superconductors. Additionally, the changes in the relative intensities of spectra corresponding to the inner and outer hole bands reflect the contribution of the band, as it is brought towards the Fermi level by increasing Te concentration.
By using a low-energy three-band model, which captures much of the underlying electronic properties, we extract the effective mass for the hole bands that show an unexpected decrease inside the nematic phase. These findings are consistent with the decrease in the renormalisation associated the higher energy bands. On the other hand, the effective mass of the third hole band with orbital character has a local minimum before increasing significantly in the tetragonal region. Concomitantly, we detect the gradual shift of this, rather flat, hole band towards the Fermi-level with increasing Te concentration, which could lead to an enhancement of the density of states and the opening of a new pairing channel. This effect could be responsible for the emergence of the second superconducting dome outside the nematic phase involving the hole band with orbital character, in contrast to the superconducting dome inside the nematic phase. These trends occur at the same time as the chalcogen height increases, and our findings may have implications for other studies, like those under applied pressure. Moreover, at high Te concentration, the resistivity of FeSe1-xTex reflects bad metallic behaviour but superconductivity remains rather robust. Our findings suggest changes in the superconducting mechanism between that emerging from the nematic phase, with rather weak electronic correlations, and the second superconducting dome outside the nematic phase. Further theoretical studies that aim to understand the superconducting mechanisms in these systems could consider the presence of the orbitally dependent electronic correlations, the enhanced density of states induced by a nearly-flat band with orbital character and potentially the significant effects caused by the local variation in the chalcogen height.
Methods Single crystals of FeSe1-xTex were grown via the new chemical vapour transport method [68] and screened via transport studies and X-ray diffraction (XRD). The nematic transition, was evaluated from the temperature dependence of the longitudinal resistivity (as the extremum in the first derivative as a function of temperature) as well as from X-ray studies, and compared with a previous report [5]. After each ARPES experiment, we also performed Energy Dispersive X-ray (EDX) spectroscopy studies to directly measure the composition of each investigated crystal and these values are reported here.
ARPES measurements were performed at the I05 beamline at the Diamond Light Source synchrotron using a MBS A1 hemispherical analyser giving a combined energy resolution of 3 meV [69]. The incident photon energy was varied between 23-100 eV to probe the dependence of the electronic structure and to identify the high-symmetry points. The single crystals were cleaved in-situ using a top-post and all measurements were performed at the base temperature of 10 K and under ultrahigh vacuum at mbar. The beamspot was m which is much larger than the nematic domains of the samples [70]. Therefore, all spectra are a superposition of the two orthogonal domains. Besides the reported data on new crystals of FeSe1-xTex, we compare our results to previous ARPES data on FeSe from Refs. [13, 20] and the tetragonal system, FeSe0.82S0.18, reported previously in Refs. [38, 3].
To complement the experimental data, we have performed DFT band structure calculations using the Wien2k software in the GGA approximation with and without SOC [71] which are presented in the SM. These calculations were performed in the tetragonal phase with lattice parameters taken from Refs. [38, 5, 72], as listed in Table 1 in the SM.
Acknowledgements We thank Luke Rhodes for useful discussions on the low-energy model. ABM acknowledge scholarship funding from the Department of Physics, via OxPEG and the Diamond Light Source. We thank Diamond Light Source for access to Beamline I05 (Proposals No. SI30564, SI29118) that contributed to the results presented here. This work was mainly supported by EPSRC (Grants No. EP/I004475/1 and No. EP/I017836/1) and the Oxford Centre for Applied Superconductivity. A.A.H. acknowledges the financial support of the Oxford Quantum Materials Platform Grant (EP/M020517/1). A.A.H. acknowledges the financial support of the Deutsche Forschungsgemeinschaft (DFG, German Research Foundation) TRR288–422213477 (project B03). The authors would like to acknowledge the use of the University of Oxford Advanced Research Computing (ARC) facility in carrying out part of this work [73]. A.I.C. acknowledges support from an EPSRC Career Acceleration Fellowship (Grant No. EP/I004475/1).
Data availability In accordance with the EPSRC policy framework on research data, access to the data will be made available from the Oxford University Research Archive ORA (https://ora.ox.ac.uk/) using the following link http://dx.doi.org/10.5287/ora-e9k5bn9e8.
Author contributions A.B.M., T.K, M.D.W, A.I.C performed ARPES measurements. A.AH., S.J.S grew the crystals; A.B.M analyzed the ARPES data; A.B.M., T.K, M.D.W, A.I.C discussed the results and manuscript preparation. A.B.M and A.I. C wrote the manuscript with contributions from all authors.
Competing interests The authors declare no competing interests.
Additional information Supplementary information is available for this paper.
References
- Tamai et al. [2010] A. Tamai, A. Y. Ganin, E. Rozbicki, J. Bacsa, W. Meevasana, P. D. C. King, M. Caffio, R. Schaub, S. Margadonna, K. Prassides, M. J. Rosseinsky, and F. Baumberger, Strong Electron Correlations in the Normal State of the Iron-Based FeSe0.42Te0.58 Superconductor Observed by Angle-Resolved Photoemission Spectroscopy, Phys. Rev. Lett. 104, 097002 (2010).
- Yi et al. [2015] M. Yi, Z.-K. Liu, Y. Zhang, R. Yu, J.-X. Zhu, J. Lee, R. Moore, F. Schmitt, W. Li, S. Riggs, J.-H. Chu, B. Lv, J. Hu, M. Hashimoto, S.-K. Mo, Z. Hussain, Z. Mao, C. Chu, I. Fisher, Q. Si, Z.-X. Shen, and D. Lu, Observation of universal strong orbital-dependent correlation effects in iron chalcogenides, Nature Communications 6, 10.1038/ncomms8777 (2015).
- Coldea [2021] A. I. Coldea, Electronic Nematic States Tuned by Isoelectronic Substitution in Bulk FeSe1-xSx, Frontiers in Physics 8, 10.3389/fphy.2020.594500 (2021).
- Reiss et al. [2020] P. Reiss, D. Graf, A. A. Haghighirad, W. Knafo, L. Drigo, M. Bristow, A. J. Schofield, and A. I. Coldea, Quenched nematic criticality and two superconducting domes in an iron-based superconductor, Nature Physics 16, 89 (2020).
- Mukasa et al. [2021] K. Mukasa, K. Matsuura, M. Qiu, M. Saito, Y. Sugimura, K. Ishida, M. Otani, Y. Onishi, K. Hashimoto, J. Gouchi, R. Kumai, Y. Uwatoko, T. Shibauchi, and Y. Mizukami, High-pressure phase diagrams of FeSe1-xTex: correlation between suppressed nematicity and enhanced superconductivity, Nature Communications , 1 (2021).
- Zhang et al. [2018] P. Zhang, K. Yaji, T. Hashimoto, Y. Ota, T. Kondo, K. Okazaki, Z. Wang, J. Wen, G. D. Gu, H. Ding, and S. Shin, Observation of topological superconductivity on the surface of an iron-based superconductor, Science 360, 182 (2018).
- Rinott et al. [2017] S. Rinott, K. B. Chashka, A. Ribak, E. D. L. Rienks, A. Taleb-Ibrahimi, P. L. Fevre, F. Bertran, M. Randeria, and A. Kanigel, Tuning across the BCS-BEC crossover in the multiband superconductor Fe1+ySexTe1-x: An angle-resolved photoemission study, Science Advances 3, e1602372 (2017).
- Fernandes and Vafek [2014a] R. M. Fernandes and O. Vafek, What drives nematic order in iron-based superconductors?, Nature Physics 10, 97 (2014a).
- Fedorov et al. [2016] A. Fedorov, A. Yaresko, T. K. Kim, Y. Kushnirenko, E. Haubold, T. Wolf, M. Hoesch, A. Grüneis, B. Büchner, and S. V. Borisenko, Effect of nematic ordering on electronic structure of FeSe, Scientific Reports 6, 36834 (2016).
- Kuo et al. [2016] H.-H. Kuo, J.-H. Chu, J. C. Palmstrom, S. A. Kivelson, and I. R. Fisher, Ubiquitous signatures of nematic quantum criticality in optimally doped Fe-based superconductors, Science 352, 958 (2016).
- Bartlett et al. [2021] J. M. Bartlett, A. Steppke, S. Hosoi, H. Noad, J. Park, C. Timm, T. Shibauchi, A. P. Mackenzie, and C. W. Hicks, Relationship between Transport Anisotropy and Nematicity in FeSe, Phys. Rev. X 11, 021038 (2021).
- Ghini et al. [2021] M. Ghini, M. Bristow, J. C. A. Prentice, S. Sutherland, S. Sanna, A. A. Haghighirad, and A. I. Coldea, Strain tuning of nematicity and superconductivity in single crystals of FeSe, Phys. Rev. B 103, 205139 (2021).
- Watson et al. [2015a] M. D. Watson, T. K. Kim, A. A. Haghighirad, N. R. Davies, A. McCollam, A. Narayanan, S. F. Blake, Y. L. Chen, S. Ghannadzadeh, A. J. Schofield, M. Hoesch, C. Meingast, T. Wolf, and A. I. Coldea, Emergence of the nematic electronic state in FeSe, Phys. Rev. B 91, 155106 (2015a).
- Böhmer et al. [2022] A. E. Böhmer, J.-H. Chu, S. Lederer, and M. Yi, Nematicity and nematic fluctuations in iron-based superconductors, Nature Physics 18, 1412 (2022).
- Fernandes et al. [2022] R. M. Fernandes, A. I. Coldea, H. Ding, I. R. Fisher, P. J. Hirschfeld, and G. Kotliar, Iron pnictides and chalcogenides: a new paradigm for superconductivity, Nature 601, 35 (2022).
- Shibauchi et al. [2014] T. Shibauchi, A. Carrington, and Y. Matsuda, A quantum critical point lying beneath the superconducting dome in iron pnictides, Annual Review of Condensed Matter Physics 5, 113 (2014).
- Gu et al. [2017] Y. Gu, Z. Liu, T. Xie, W. Zhang, D. Gong, D. Hu, X. Ma, C. Li, L. Zhao, L. Lin, Z. Xu, G. Tan, G. Chen, Z. Y. Meng, Y.-f. Yang, H. Luo, and S. Li, Unified phase diagram for iron-based superconductors, Phys. Rev. Lett. 119, 157001 (2017).
- Malinowski et al. [2020] P. Malinowski, Q. Jiang, J. J. Sanchez, J. Mutch, Z. Liu, P. Went, J. Liu, P. J. Ryan, J.-W. Kim, and J.-H. Chu, Suppression of superconductivity by anisotropic strain near a nematic quantum critical point, Nature Physics 16, 1189 (2020).
- Labat and Paul [2017] D. Labat and I. Paul, Pairing instability near a lattice-influenced nematic quantum critical point, Phys. Rev. B 96, 195146 (2017).
- Coldea and Watson [2018] A. I. Coldea and M. D. Watson, The Key Ingredients of the Electronic Structure of FeSe, Annual Review of Condensed Matter Physics 9, 125 (2018).
- Sprau et al. [2017] P. O. Sprau, A. Kostin, A. Kreisel, A. E. Böhmer, V. Taufour, P. C. Canfield, S. Mukherjee, P. J. Hirschfeld, B. M. Andersen, and J. C. S. Davis, Discovery of orbital-selective Cooper pairing in FeSe, Science 357, 75 (2017).
- Kreisel et al. [2020] A. Kreisel, P. J. Hirschfeld, and B. M. Andersen, On the Remarkable Superconductivity of FeSe and Its Close Cousins, Symmetry 12, 10.3390/sym12091402 (2020).
- Rhodes et al. [2018] L. C. Rhodes, M. D. Watson, A. A. Haghighirad, D. V. Evtushinsky, M. Eschrig, and T. K. Kim, Scaling of the superconducting gap with orbital character in fese, Phys. Rev. B 98, 180503 (2018).
- Wang et al. [2016] Q. Wang, Y. Shen, B. Pan, Y. Hao, M. Ma, F. Zhou, P. Steffens, K. Schmalzl, T. R. Forrest, M. Abdel-Hafiez, X. Chen, D. A. Chareev, A. N. Vasiliev, P. Bourges, Y. Sidis, H. Cao, and J. Zhao, Strong interplay between stripe spin fluctuations, nematicity and superconductivity in FeSe, Nature Materials 15, 159 (2016).
- Zajicek et al. [2022] Z. Zajicek, S. J. Singh, H. Jones, P. Reiss, M. Bristow, A. Martin, A. Gower, A. McCollam, and A. I. Coldea, Drastic effect of impurity scattering on the electronic and superconducting properties of Cu-doped FeSe, Phys. Rev. B 105, 115130 (2022).
- Kumar et al. [2012] J. Kumar, S. Auluck, P. K. Ahluwalia, and V. P. S. Awana, Chalcogen height dependence of magnetism and Fermiology in FeTexSe1-x, Superconductor Science and Technology 25, 095002 (2012).
- Wang et al. [2015] Z. Wang, P. Zhang, G. Xu, L. K. Zeng, H. Miao, X. Xu, T. Qian, H. Weng, P. Richard, A. V. Fedorov, H. Ding, X. Dai, and Z. Fang, Topological nature of the FeSe0.5Te0.5 superconductor, Phys. Rev. B 92, 115119 (2015).
- Lauke et al. [2020] L. Lauke, R. Heid, M. Merz, T. Wolf, A.-A. Haghighirad, and J. Schmalian, Band engineering of Dirac cones in iron chalcogenides, Phys. Rev. B 102, 054209 (2020).
- Chen et al. [2020] C. Chen, K. Jiang, Y. Zhang, C. Liu, Y. Liu, Z. Wang, and J. Wang, Atomic line defects and zero-energy end states in monolayer Fe(Te,Se) high-temperature superconductors, Nature Physics 16, 536 (2020).
- Liu et al. [2015] Z. K. Liu, M. Yi, Y. Zhang, J. Hu, R. Yu, J.-X. Zhu, R.-H. He, Y. L. Chen, M. Hashimoto, R. G. Moore, S.-K. Mo, Z. Hussain, Q. Si, Z. Q. Mao, D. H. Lu, and Z.-X. Shen, Experimental observation of incoherent-coherent crossover and orbital-dependent band renormalization in iron chalcogenide superconductors, Phys. Rev. B 92, 235138 (2015).
- Huang et al. [2022] J. Huang, R. Yu, Z. Xu, J.-X. Zhu, J. S. Oh, Q. Jiang, M. Wang, H. Wu, T. Chen, J. D. Denlinger, S.-K. Mo, M. Hashimoto, M. Michiardi, T. M. Pedersen, S. Gorovikov, S. Zhdanovich, A. Damascelli, G. Gu, P. Dai, J.-H. Chu, D. Lu, Q. Si, R. J. Birgeneau, and M. Yi, Correlation-driven electronic reconstruction in FeTe1-xSex, Communications Physics 5, 10.1038/s42005-022-00805-6 (2022).
- Xing et al. [2021] X. Xing, Y. Sun, X. Yi, M. Li, J. Feng, Y. Meng, Y. Zhang, W. Li, N. Zhou, X. He, J.-Y. Ge, W. Zhou, T. Tamegai, and Z. Shi, Electronic transport properties and hydrostatic pressure effect of FeSe0.67Te0.33 single crystals free of phase separation, Superconductor Science and Technology 34, 055006 (2021).
- Ovchenkov et al. [2021] Y. A. Ovchenkov, D. A. Chareev, E. S. Kozlyakova, E. E. Levin, M. G. Mikheev, D. E. Presnov, A. S. Trifonov, O. S. Volkova, and A. N. Vasiliev, Phase separation near the charge neutrality point in FeSe1-xTex crystals with , Superconductor Science and Technology 35, 015011 (2021).
- Ishida et al. [2022] K. Ishida, Y. Onishi, M. Tsujii, K. Mukasa, M. Qiu, M. Saito, Y. Sugimura, K. Matsuura, Y. Mizukami, K. Hashimoto, and T. Shibauchi, Pure nematic quantum critical point accompanied by a superconducting dome, Proceedings of the National Academy of Sciences 119, e2110501119 (2022).
- Zhang et al. [2011] P. Zhang, P. Richard, T. Qian, Y.-M. Xu, X. Dai, and H. Ding, A precise method for visualizing dispersive features in image plots, Review of Scientific Instruments 82, 043712 (2011).
- Zhang et al. [2012] Y. Zhang, C. He, Z. R. Ye, J. Jiang, F. Chen, M. Xu, Q. Q. Ge, B. P. Xie, J. Wei, M. Aeschlimann, X. Y. Cui, M. Shi, J. P. Hu, and D. L. Feng, Symmetry breaking via orbital-dependent reconstruction of electronic structure in detwinned NaFeAs, Phys. Rev. B 85, 085121 (2012).
- Watson et al. [2015b] M. D. Watson, T. K. Kim, A. A. Haghighirad, S. F. Blake, N. R. Davies, M. Hoesch, T. Wolf, and A. I. Coldea, Suppression of orbital ordering by chemical pressure in FeSe1-xSx, Phys. Rev. B 92, 121108 (2015b).
- Reiss et al. [2017] P. Reiss, M. D. Watson, T. K. Kim, A. A. Haghighirad, D. N. Woodruff, M. Bruma, S. J. Clarke, and A. I. Coldea, Suppression of electronic correlations by chemical pressure from FeSe to FeS, Phys. Rev. B 96, 121103 (2017).
- Ieki et al. [2014] E. Ieki, K. Nakayama, Y. Miyata, T. Sato, H. Miao, N. Xu, X.-P. Wang, P. Zhang, T. Qian, P. Richard, Z.-J. Xu, J. S. Wen, G. D. Gu, H. Q. Luo, H.-H. Wen, H. Ding, and T. Takahashi, Evolution from incoherent to coherent electronic states and its implications for superconductivity in FeTe1-xSex, Phys. Rev. B 89, 140506 (2014).
- Fernandes and Vafek [2014b] R. M. Fernandes and O. Vafek, Distinguishing spin-orbit coupling and nematic order in the electronic spectrum of iron-based superconductors, Phys. Rev. B 90, 214514 (2014b).
- Xing et al. [2017] R.-Q. Xing, L. Classen, M. Khodas, and A. V. Chubukov, Competing instabilities, orbital ordering, and splitting of band degeneracies from a parquet renormalization group analysis of a four-pocket model for iron-based superconductors: Application to FeSe, Phys. Rev. B 95, 085108 (2017).
- Watson et al. [2017] M. D. Watson, A. A. Haghighirad, H. Takita, W. Mansuer, H. Iwasawa, E. F. Schwier, A. Ino, and M. Hoesch, Shifts and Splittings of the Hole Bands in the Nematic Phase of FeSe, Journal of the Physical Society of Japan 86, 053703 (2017).
- Lohani et al. [2020] H. Lohani, T. Hazra, A. Ribak, Y. Nitzav, H. Fu, B. Yan, M. Randeria, and A. Kanigel, Band inversion and topology of the bulk electronic structure in FeSe0.45Te0.55, Phys. Rev. B 101, 245146 (2020).
- Li et al. [2023] Y. F. Li, S. D. Chen, M. Garcia-Diez, M. I. Iraola, H. Pfau, Y. L. Zhu, Z. Q. Mao, T. Chen, M. Yi, P. C. Dai, J. A. Sobota, M. Hashimoto, M. G. Vergniory, D. H. Lu, and Z. X. Shen, Spectroscopic evidence for topological band structure in FeTe0.55Se0.45, arXiv.2307.03861 (2023).
- Cvetkovic and Vafek [2013] V. Cvetkovic and O. Vafek, Space group symmetry, spin-orbit coupling, and the low-energy effective Hamiltonian for iron-based superconductors, Phys. Rev. B 88, 134510 (2013).
- Rhodes et al. [2021] L. C. Rhodes, J. Böker, M. A. Müller, M. Eschrig, and I. M. Eremin, Non-local dxy nematicity and the missing electron pocket in FeSe, npj Quantum Materials 6, 10.1038/s41535-021-00341-6 (2021).
- Maletz et al. [2014] J. Maletz, V. B. Zabolotnyy, D. V. Evtushinsky, S. Thirupathaiah, A. U. B. Wolter, L. Harnagea, A. N. Yaresko, A. N. Vasiliev, D. A. Chareev, A. E. Böhmer, F. Hardy, T. Wolf, C. Meingast, E. D. L. Rienks, B. Büchner, and S. V. Borisenko, Unusual band renormalization in the simplest iron-based superconductor FeSe1-x, Phys. Rev. B 89, 220506 (2014).
- Yi et al. [2019] M. Yi, H. Pfau, Y. Zhang, Y. He, H. Wu, T. Chen, Z. R. Ye, M. Hashimoto, R. Yu, Q. Si, D.-H. Lee, P. Dai, Z.-X. Shen, D. H. Lu, and R. J. Birgeneau, Nematic Energy Scale and the Missing Electron Pocket in FeSe, Phys. Rev. X 9, 041049 (2019).
- Zhang et al. [2016] Y. Zhang, M. Yi, Z.-K. Liu, W. Li, J. J. Lee, R. G. Moore, M. Hashimoto, M. Nakajima, H. Eisaki, S.-K. Mo, Z. Hussain, T. P. Devereaux, Z.-X. Shen, and D. H. Lu, Distinctive orbital anisotropy observed in the nematic state of a FeSe thin film, Phys. Rev. B 94, 115153 (2016).
- Watson et al. [2016] M. D. Watson, T. K. Kim, L. C. Rhodes, M. Eschrig, M. Hoesch, A. A. Haghighirad, and A. I. Coldea, Evidence for unidirectional nematic bond ordering in FeSe, Phys. Rev. B 94, 201107 (2016).
- Fink et al. [2021] J. Fink, E. D. L. Rienks, M. Yao, R. Kurleto, J. Bannies, S. Aswartham, I. Morozov, S. Wurmehl, T. Wolf, F. Hardy, C. Meingast, H. S. Jeevan, J. Maiwald, P. Gegenwart, C. Felser, and B. Büchner, Linkage between scattering rates and superconductivity in doped ferropnictides, Phys. Rev. B 103, 155119 (2021).
- Christensen et al. [2020] M. H. Christensen, R. M. Fernandes, and A. V. Chubukov, Orbital transmutation and the electronic spectrum of FeSe in the nematic phase, Phys. Rev. Research 2, 013015 (2020).
- Liu et al. [2010] T. J. Liu, J. Hu, B. Qian, D. Fobes, Z. Q. Mao, W. Bao, M. Reehuis, S. A. J. Kimber, K. Prokeš, S. Matas, D. N. Argyriou, A. Hiess, A. Rotaru, H. Pham, L. Spinu, Y. Qiu, V. Thampy, A. T. Savici, J. A. Rodriguez, and C. Broholm, From (,0) magnetic order to superconductivity with (,) magnetic resonance in Fe1.02Te1-xSex, Nature Materials 9, 718 (2010).
- Coldea et al. [2019] A. Coldea, S. Blake, S. Kasahara, A. Haghighirad, M. Watson, W. Knafo, E. Choi, A. McCollam, P. Reiss, T. Yamashita, M. Bruma, S. Speller, Y. Matsuda, T. Wolf, T. Shibauchi, and A. Schofield, Evolution of the low-temperature Fermi surface of superconducting FeSe1-xSx across a nematic phase transition, npj Quantum Materials 4, 10.1038/s41535-018-0141-0 (2019).
- Otsuka et al. [2019] T. Otsuka, S. Hagisawa, Y. Koshika, S. Adachi, T. Usui, N. Sasaki, S. Sasaki, S. Yamaguchi, Y. Nakanishi, M. Yoshizawa, S. Kimura, and T. Watanabe, Incoherent-coherent crossover and the pseudogap in Te-annealed superconducting Fe1+yTe1-xSex revealed by magnetotransport measurements, Phys. Rev. B 99, 184505 (2019).
- Nakayama et al. [2021] K. Nakayama, R. Tsubono, G. N. Phan, F. Nabeshima, N. Shikama, T. Ishikawa, Y. Sakishita, S. Ideta, K. Tanaka, A. Maeda, T. Takahashi, and T. Sato, Orbital mixing at the onset of high-temperature superconductivity in FeSe1-xTex/CaF2, Phys. Rev. Research 3, L012007 (2021).
- Chen et al. [2015] X. Chen, S. Maiti, A. Linscheid, and P. J. Hirschfeld, Electron pairing in the presence of incipient bands in iron-based superconductors, Phys. Rev. B 92, 224514 (2015).
- Mazin et al. [2008] I. I. Mazin, D. J. Singh, M. D. Johannes, and M. H. Du, Unconventional Superconductivity with a Sign Reversal in the Order Parameter of LaFeAsO1-xFx, Phys. Rev. Lett. 101, 057003 (2008).
- Li et al. [2021] Y. Li, N. Zaki, V. O. Garlea, A. T. Savici, D. Fobes, Z. Xu, F. Camino, C. Petrovic, G. Gu, P. D. Johnson, J. M. Tranquada, and I. A. Zaliznyak, Electronic properties of the bulk and surface states of Fe1+yTe1-xSex, Nature Materials 20, 1221 (2021).
- Argyriou et al. [2010] D. N. Argyriou, A. Hiess, A. Akbari, I. Eremin, M. M. Korshunov, J. Hu, B. Qian, Z. Mao, Y. Qiu, C. Broholm, and W. Bao, Incommensurate itinerant antiferromagnetic excitations and spin resonance in the FeTe0.6Se0.4 superconductor, Phys. Rev. B 81, 220503 (2010).
- Yin et al. [2011] Z. P. Yin, K. Haule, and G. Kotliar, Kinetic frustration and the nature of the magnetic and paramagnetic states in iron pnictides and iron chalcogenides, Nature Materials 10, 932 (2011).
- Reiss et al. [2021] P. Reiss, D. Graf, A. A. Haghighirad, T. Vojta, and A. I. Coldea, Signatures of a Quantum Griffiths Phase Close to an Electronic Nematic Quantum Phase Transition, Phys. Rev. Lett. 127, 246402 (2021).
- Tegel et al. [2010] M. Tegel, C. Löhnert, and D. Johrendt, The crystal structure of FeSe0.44Te0.56 , Solid State Communications 150, 383 (2010).
- Kuroki et al. [2009] K. Kuroki, H. Usui, S. Onari, R. Arita, and H. Aoki, Pnictogen height as a possible switch between high- nodeless and low- nodal pairings in the iron-based superconductors, Phys. Rev. B 79, 224511 (2009).
- Yamakawa and Kontani [2017] Y. Yamakawa and H. Kontani, Nematicity, magnetism, and superconductivity in FeSe under pressure: Unified explanation based on the self-consistent vertex correction theory, Phys. Rev. B 96, 144509 (2017).
- Kuwayama et al. [2021] T. Kuwayama, K. Matsuura, J. Gouchi, Y. Yamakawa, Y. Mizukami, S. Kasahara, Y. Matsuda, T. Shibauchi, H. Kontani, Y. Uwatoko, and N. Fujiwara, Pressure-induced reconstitution of Fermi surfaces and spin fluctuations in S-substituted FeSe, Scientific Reports 11, 17265 (2021).
- Matsuura et al. [2017] K. Matsuura, Y. Mizukami, Y. Arai, Y. Sugimura, N. Maejima, A. Machida, T. Watanuki, T. Fukuda, T. Yajima, Z. Hiroi, K. Y. Yip, Y. C. Chan, Q. Niu, S. Hosoi, K. Ishida, K. Mukasa, S. Kasahara, J.-G. Cheng, S. K. Goh, Y. Matsuda, Y. Uwatoko, and T. Shibauchi, Maximizing Tc by tuning nematicity and magnetism in FeSe1-xSx superconductors, Nature Communications 8, 1143 (2017).
- Terao et al. [2019] K. Terao, T. Kashiwagi, T. Shizu, R. A. Klemm, and K. Kadowaki, Superconducting and tetragonal-to-orthorhombic transitions in single crystals of , Phys. Rev. B 100, 224516 (2019).
- Hoesch et al. [2017] M. Hoesch, T. K. Kim, P. Dudin, H. Wang, S. Scott, P. Harris, S. Patel, M. Matthews, D. Hawkins, S. G. Alcock, T. Richter, J. J. Mudd, M. Basham, L. Pratt, P. Leicester, E. C. Longhi, A. Tamai, and F. Baumberger, A facility for the analysis of the electronic structures of solids and their surfaces by synchrotron radiation photoelectron spectroscopy, Review of Scientific Instruments 88, 10.1063/1.4973562 (2017).
- Rhodes et al. [2020] L. C. Rhodes, M. D. Watson, A. A. Haghighirad, D. V. Evtushinsky, and T. K. Kim, Revealing the single electron pocket of FeSe in a single orthorhombic domain, Phys. Rev. B 101, 235128 (2020).
- Blaha et al. [2020] P. Blaha, K. Schwarz, F. Tran, R. Laskowski, G. K. H. Madsen, and L. D. Marks, WIEN2k: An APW+lo program for calculating the properties of solids, The Journal of Chemical Physics 152, 074101 (2020).
- Li et al. [2009] S. Li, C. de la Cruz, Q. Huang, Y. Chen, J. W. Lynn, J. Hu, Y.-L. Huang, F.-C. Hsu, K.-W. Yeh, M.-K. Wu, and P. Dai, First-order magnetic and structural phase transitions in Fe1+ySexTe1-x, Phys. Rev. B 79, 054503 (2009).
- ARC [2023] University of Oxford Advanced Research Computing Service https://doi.org/10.5281/zenodo.22558 (2023).
- Damascelli [2004] A. Damascelli, Probing the electronic structure of complex systems by ARPES, Physica Scripta T109, 61 (2004).
V Supplemental Material
DFT calculations
To be able to compare the ARPES experiments and understand the evolution of the band structure in FeSe1-xTex, we have performed detailed density functional theory (DFT) calculations in the tetragonal structure for two separate series. We use the GGA approximation as implemented in Wien2k [71] on the ARC server at the University of Oxford [73].
Firstly, DFT calculations were performed using the experimental parameters, as listed in Supplementary Table S1. The input parameters in the DFT calculations of FeSe1-xTex assume that the chalcogen site is occupied by Se and to account for different compositions the lattice parameters and the chalcogen height are modified (after Ref. [5]), whereas for FeTe the structure is taken from Ref. [72]. Due to the isoelectronic substitution of a larger Te ion for Se, the lattice parameter and the value of varies significantly whereas the lattice parameter hardly changes in FeSe1-xTex. We find that the band shifts to lower binding energy as the unit cell expands and it has little dependence, suggesting a quasi-two dimensional pocket, as shown in Supplementary Figure. S1. The two bands also shift as their average position move away from , but their separation also increases, whereas the degenerate point of the bands (as indicated by in Supplementary Figure S1a), hardly changes by increasing . However, the band is highly sensitive to Te substitution and it has a strong dependence. It is predicted to cross the Fermi level in FeSe and shift to higher binding energies with increasing , whereas the dependence of the band becomes stronger for FeTe, suggesting the development of stronger interlayer coupling and a warping of the Fermi surface.
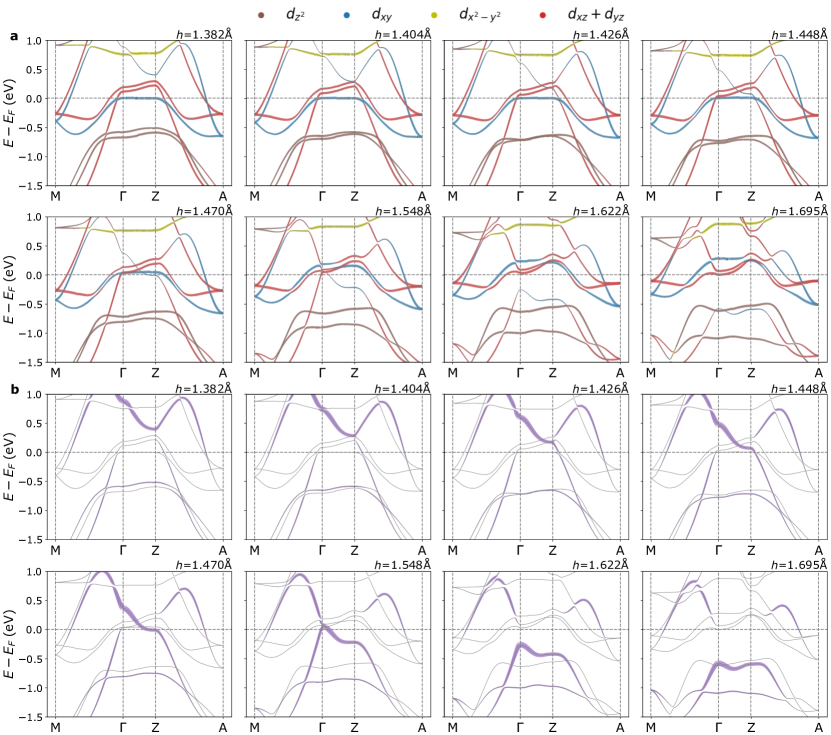
Secondly, further calculations were performed for FeSe whereby only the chalcogen height, , was varied (see Supplementary Figure S2). By varying the values of , it reveals a strong shift of the band. The full series nicely illustrates the hybridisation of the band and the inner hole band, as the band shifts from being above to below with increasing . At low values (Å), the is isolated from the hole bands creating an electron-like dispersion. However, as increases, the band shifts and crosses these hole bands ( Å), where it hybridises strongly with the inner hole band (or band). Along the direction, this creates a gap such that the band appears to smoothly merge with the inner hole band forming the pseudo- band. Moreover, we also observe the band to shift to lower binding energies, but the degenerate point () remains relatively constant as increases. Therefore, the effect of tuning is rather similar to the isoelectronic substitution discussed above.
| FeSe1-xTex | chalcogen | (Å) | (Å) | (Å) | |
|---|---|---|---|---|---|
| Se | 3.7651 | 5.5178 | 1.4744 | 0.2672 [38] | |
| Se | 3.7766 | 5.6435 | 1.5144 | 0.2683 [5] | |
| Se | 3.7862 | 5.8120 | 1.5743 | 0.2709 [5] | |
| Se | 3.7900 | 5.8775 | 1.5975 | 0.2718 [5] | |
| Te | 3.8120 | 6.2517 | 1.7686 | 0.2791 [72] |
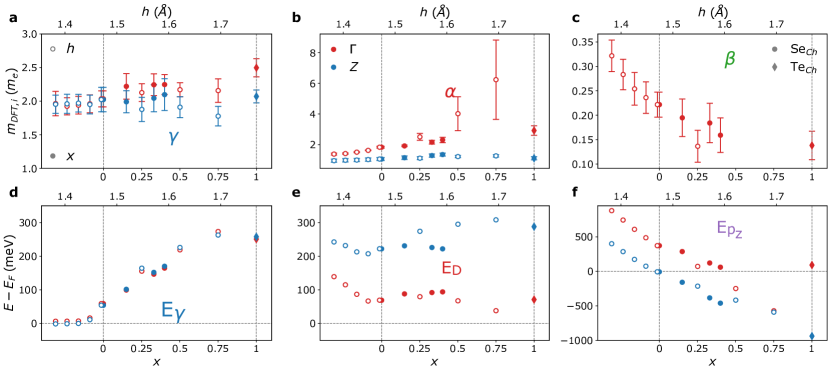
To quantitatively compare the DFT with experiments we extract the band masses and Fermi-energies of each band, as shown in Supplementary Figure S3. To extract these parameters we use the calculations in the absence of the spin-orbit coupling (see Supplementary Figure S1a) and each band was fitted to a parabola. The band mass variation of the band from FeSe to FeTe is small and remains close to 2, whereas for the band, the band mass is similar but increases; more so at the point. However, for the band, the band mass is very light (below 0.5 ) and slightly decreases. similar to the trend found for the experimental effective mass (see Fig. 2). Moreover, band mass values of the band at point are excluded here due to the strong hybridisation with the chalcogen band.
Supplementary Figure S3 shows a comparison between the extracted values of the band mass and the Fermi energy of each band, as determined from the first DFT series, corresponding to the Te substitution, and the second series, in which only is varied. We observe that the two DFT series produce very similar results with the exception of the band mass of the band. Supplementary Figure S3b shows that the band can become extremely flat at high values of , whereas the variation from FeSe to FeTe is much smaller. Moreover, another surprising result was the band does not shift for Å and only for values above this, suggesting that FeSe is close to a threshold point where the orbitals of Fe no longer strongly interact with the chalcogen atoms.
The low-energy three-band model used to describe the hole bands
Here we present the three-band model used to parameterize the behaviour of the hole band dispersions at the high symmetry points (Fig.1) and (Supplementary Figure S6). This model consists of three-parabolic dispersions in the presence of both spin-orbit coupling and the nematic order. It is based on models previously discussed in Refs. [45, 40, 46] and expanded to accommodate the third hole band of character, , as detailed in Supplementary Figure S4. The Hamiltonian to describe this three-band model is given by,
| (1) |
which conserves the point group symmetry around both the and high symmetry points. Here corresponds to the SOC between the bands of and character ( and ) and relates to the SOC of the bands of character and the third additional band of character (the band). One should note that has the units of velocity as the SOC is momentum dependent. Moreover, is the nematic order parameter, which reflects the change in symmetry from C4 to C2. Supplementary Figure S4 illustrates the effect of different parameters on the low-energy model, where SOC and the nematic order are added in stages.
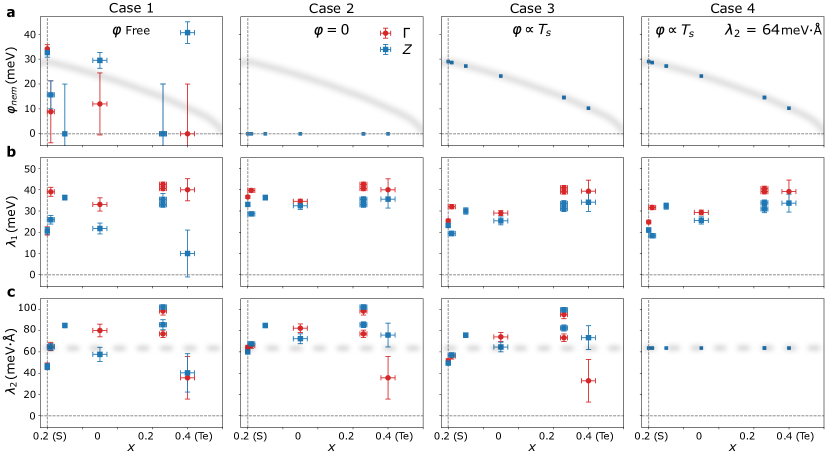
To constrain the different parameters and to estimate of the SOC terms, this low-energy model was applied to the ARPES data in four separate ways. Supplementary Figure S5 presents the values of , and for the different cases, where the extracted terms remain consistent between the cases.
As the Te content increases the linewidths broaden, resulting in a larger uncertainty in the evaluated band dispersions and the corresponding nematic splitting. Due to these effects, the model applied to FeSe1-xTex data becomes insensitive to the nematic order parameter, and it was fixed to be proportional to . Moreover, the value of seemed relatively constant for each approach and is assumed to not drastically effect the key model parameters, subsequently in the fourth and final case it was fixed to an average value of 64 meVÅ. For , the value of gradually increases with increasing the Te concentration. This is in broad agreement with the predictions of DFT where the SOC splitting between the and bands increases from 93 to 101 meV at the from FeSe towards FeTe.
Lastly, as the experimental data is twinned, the extracted band positions are an average of the two domains. Therefore, the employed model takes the average of equation 1 when and , such that both domains are combined.
The effect of the band
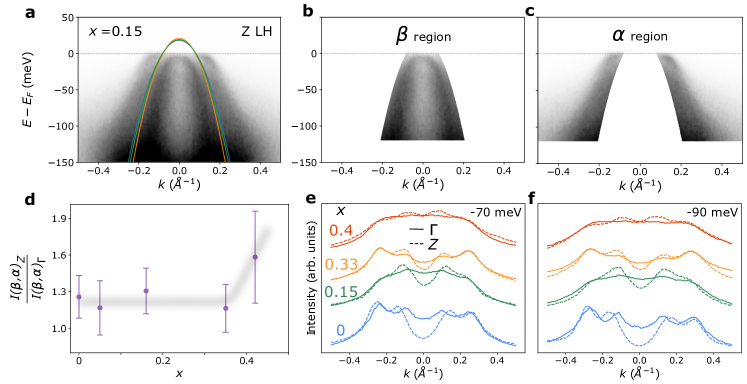
The band inversion due to the crossing of the chalcogen band with the band is illustrated in Supplementary Figure S2. This effect is predicted to first occur at the point when the chalcogen height is set to Å, however experimentally it was suggested that this inversion takes place for FeSe0.5Te0.5 [43, 27, 29]. As the and band interact, they exchange their orbital character, which in turn affects the matrix elements and thus the intensity of the ARPES spectra. Therefore, to quantify the presence of the band, we assess the spectral intensity of the band relative to the band at both high-symmetry points points ( and ). To perform this analysis we integrate the intensity between two spectral regions which relate to the and bands (see Supplementary Figure S7b and c). Lastly, by taking the ratio between the and points, effects that are independent, such as nematic effects and the hybridisation with the band, are cancelled out.
We find that the relative intensity of the band increases at the point with respect to the point as the Te concentration increases beyond , as shown in Supplementary Figure S7d. The upturn observed for could suggest the influence of the band as it begins to hybridise with the band. A similar analysis was performed in Ref. [43, 44], where the spectral intensity of the band was evaluated relative to a surface state. The dependence of this relative intensity was then used to establish the presence of the band. Furthermore, the spectral intensity of the band, relative to the band, is seen to vary with the Te concentration by comparing the MDCs curves taken at -70 meV and -90 meV (Supplementary Figure S7e and f respectively).
The evolution of the bands with orbital character
Here we focus on the behaviour of the bands located at the Brillouin zone centre at higher binding energy. Fig S8a shows a broad feature at 220 meV in the ARPES spectra of FeSe centred around the point. While only one spectral feature can be resolved in the experiments, DFT calculations predicts two different dispersion corresponding to the bands with orbital character. We estimate that a renormalisation factor of 3.9 brings the calculations in agreement with the experimental feature of FeSe, as shown in Supplementary Figure S8a. Supplementary Figure S8b and d shows that the spectral feature of the bands (as determined from EDCs centred at and the point) shifts towards higher binding energy and broadens with the Te substitution (see Supplementary Figure S8c), in agreement with a previous report [30]. Although this broadening, , is likely to occur due to the splitting of the two bands, as predicted by the DFT calculations (see Supplementary Figure S9b), other mechanisms are expected to also contribute. Firstly, as bands move to higher binding energy there is a natural broadening of the spectral function [74], and secondly broadening caused by the impurity scattering and disorder is likely to increase as a function of Te concentration. To estimate the renormalisation factor of the bands (), we assess the ratio between the energy separation between the top of the hole band and the average position of the bands from calculations and experiments. DFT predicts that the average position of the two bands should also shift to higher binding energies as Te concentration is increased, yet we find that still decreases as a function of Te composition, as shown in Supplementary Figure S8c.
Quantifying the nematic order affecting the electron pockets
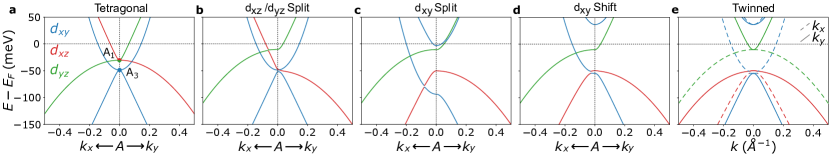
Supplementary Figure S10a shows the band structure of tetragonal FeSe where there are two degenerate points, one associated with the and bands (A1) and one with bands (A3). As the nematic order manifests the degeneracy of the bands should be lifted, conforming to broken crystal symmetry (see Supplementary Figure S10b). In contrast, the orbital does not conform to the broken symmetry channel, yet an anisotropic hopping of this orbital still lifts the degeneracy (see Supplementary Figure S10c) [40, 46, 48]. To probe the nematic order, previous studies have measured the separation between spectral features along an EDC taken at the Brillouin corner, , where this separation was assigned to different types of orbital effects [48, 40, 52, 3].
In order to quantify the separation in the spectral features, , we fit the EDC spectra to Lorentzian curves with a broadening that is linearly dependent on the binding energy using the following expression:
| (2) |
where is the Lorentzian index such that , and are the amplitude, offset and broadening of the Lorentzian curve respectively. The broadening contains an energy independent term, , which is fixed for all Lorentzians, as this would represent a scattering term due to impurities, and an energy dependent term with as the coefficient. This linear dependence is a hallmark of a marginal Fermi-liquid, found in other Fe-based superconductors [51]. Supplementary Figure S11c shows the fitting procedure to assess , where for all compositions, three different peaks are used and is the separation between the two top most peaks. One should also note that the maximum of a Lorentzian with an energy dependent broadening will not be equal to the centre of the Lorentzian, as clearly shown in Supplementary Figure S11c.