On the Readiness of Scientific Data for a Fair and Transparent Use in Machine Learning
Abstract
To ensure the fairness and trustworthiness of machine learning (ML) systems, recent legislative initiatives and relevant research in the ML community have pointed out the need to document the data used to train ML models. Besides, data-sharing practices in many scientific domains have evolved in recent years for reproducibility purposes. In this sense, the adoption of these practices by academic institutions has encouraged researchers to publish their data and technical documentation in peer-reviewed publications such as data papers. In this study, we analyze how this scientific data documentation meets the needs of the ML community and regulatory bodies for its use in ML technologies. We examine a sample of 4041 data papers of different domains, assessing their completeness and coverage of the requested dimensions, and trends in recent years, putting special emphasis on the most and least documented dimensions. As a result, we propose a set of recommendation guidelines for data creators and scientific data publishers to increase their data’s preparedness for its transparent and fairer use in ML technologies.
1 Introduction
The growing influence of machine learning (ML) technologies in our society raises scientific and political concerns about the potential harms they may cause. Datasets are critical in these systems, and recent research has highlighted them as one of the root causes of unexpected and harmful consequences in ML applications. Recent studies, for example, observed gender-biased classifiers for computer-aided diagnosis due to imbalances in training data [1, 2], or ML models for pneumonia detection failing to generalize to other hospitals due to specific conditions during the collection of the images used to train them [3]. This situation has prompted the interest of regulatory agencies and the ML community in general in developing data best practices, such as building proper dataset documentation. Public regulatory initiatives, such as the European AI ActaaaAI Act required documentation: Annex IV: https://www.euaiact.com/annex/4 and the AI Right of Billsbbbhttps://www.whitehouse.gov/ostp/ai-bill-of-rights/, as well as relevant scientific works [4, 5], have proposed general guidelines for developing standard dataset documentation. Such proposals identify a number of dimensions, such as the dataset’s provenance or potential social issues, that could influence how the dataset is used and the quality and generalization of the ML models trained with it.
Interest in data-sharing practices was already widespread in many scientific fields, determined, among others, by the need to reproduce scientific experiments [6]. The adoption of FAIR principles [7] and data management plans [8] by research institutions has encouraged researchers to publish their data with technical and scientific documentation, such as data papers. Recent research has focused on how to improve data-sharing practices through this type of documents, working on specific aspects such as the peer-review process for data papers [9], data citation practices [10], data publishers’ guidelines [11], and data reuse [12].
The use of this type of data for the training of ML models is making good data practices even more important. However, research has yet to be conducted on the suitability of these data-sharing practices and the data dimensions required by the ML community. In this sense, the goal of this paper is to study the presence (and evolution) of such dimensions in current data papers published by the scientific community. To do so, we analyzed 4041 open access data papers published in two interdisciplinary data journals: Nature’s Scientific Data and Elsevier’s Data in Brief. We examined the full manuscripts regarding the demanded dimensions which are detailed in Section 2. The analysis was aided by an ML pipeline that included a Large Language Model (LLM) at its core, designed to extract specific dimensions from the manuscripts.
As we detail in our results—cf. Section 3—we noticed a significant contrast in the presence of the required dimensions. Those already explicitly requested in the publisher submission guidelines, such as the data recommended uses or a general description of the collection process, are consistently present. In contrast, details about the data generalization limits and its social concerns, the profiles of the team collecting and annotating the data, and the data maintenance policies need to be much better documented if we want to ensure ML models trained on trustworthy and reliable data. To help with this, in Section 4, we propose a set of recommendation guidelines for data creators and scientific data publishers to increase the presence of the least documented dimensions as a way to improve their data for its transparent and fair use in machine learning. The ML extraction pipeline and the entire dataset used in the analysis are openly available [13].
2 Background
The need for proper documentation for datasets in the ML field is well defined in the well-known publication Datasheets for Datasets[4], a work inspired by datasheets in the electronics industry. In this work (among others), the authors identify data aspects for each phase of the data creation process—design, gathering, and annotations—that could affect how the dataset should be used or the quality of ML models trained. In Table 1, we summarize the main dimensions covered in this section.
| Dimensions | Subdimensions | Target explanation |
| Uses | Recommended uses | Recommended uses and gaps the dataset intends to fill |
| Generalization limits | Non-recommended uses and data generalization limits | |
| Social concerns | If represent people: biases, sensitivity and privacy issues | |
| Maintenance Policies | Maintainers & policies (erratum, updates, deprecation) | |
| Tested using an ML approach | Models and metrics the dataset have been tested on | |
| Collection | Description | Description of the process and its categorization |
| Profile of the collection team | Profile of the gathering team | |
| Profile of the collection target | If represent people, their demographic profile | |
| Speech context in language datasets | If language datasets, contextual information of the spoken language | |
| Collection sources & infrastructure | The source of the data and the infrastructure used to collect it | |
| Annotation | Description | Description of the process and its categorization |
| Profile of the annotator team | Profile of annotation the team | |
| Annotation infrastructure | The tools used to annotate the data | |
| Annotation validation | Validation methods applied over the annotations |
The Uses dimensions of the data refer to how this data should or should not be used and its potential social effects. In terms of Recommended uses, Datasheets for Datasets, among other works[14, 15, 16], propose to document the purposes and gaps the dataset intends to fill. Also, they demand rationales about the Generalization limits of the data and the potential Social concerns if the data represents people. For instance, data gathered from patients of a single hospital may have generalization limits for various reasons. The most obvious is data distribution, where, for instance, a cohort of patients is not representative of the whole population [3]. Also, some of the ML community works [17] express concerns about the Maintenance of the data. Setting an erratum to inform potential errors, an updating timeframe, or deprecation policies are remarked as useful practices while releasing data.
Data provenance is also the focus of these works. Documenting specific details about the Collection and Annotation process is stated as a need to evaluate properly the suitability of the data for specific applications. For instance, recent studies [3] have shown that the use of specific devices and practices during the collection of chest lung cancer images could raise a biases in data, leading to spurious correlations [18] of the ML model, and providing incorrect accuracy metrics. These examples illustrate the usefulness of knowing information about the Sources & Infrastructure, such as the scanners used to get MRI images, and other contextual attributes of the data. As another example, the annotation Infrastructure used, such as a labeling software, and the Validation methods applied over the labels could reduce the potential bias of the data and could give us clues about the data generalization limits. In that sense, a data user may provide more confidence to a record of data labeled by a group of people together with the inter-annotator agreement between them than labeled by a single one.
Also, there is a demand to characterize the people who have participated in the provenance steps of the data, as they add subjectivity to it [19]. For instance, a dataset curated by a team of experts in the field or curated by a crowdsourcing service, such as Amazon Mechanical Turk, could not assign the same values. Therefore standalone data without information about the team involved in its creation may not be useful to evaluate the suitability of the data for an application. As creating data involves more people every time, there is a need to go beyond “the authors” of the dataset and Profile the collection team and the annotation team of the data. Beyond those who actively created the data, recent works [20] also stress the need to profile passive participants of the dataset creation. For instance, if the data is collected by or represents people, a profile of these people should also be required (Profile of the collection target). This practise is widely integrated in health data where the profile of the cohort of patients is highly relevant. Finally, for natural language data, which has gained relevance to the recent emergence of large language models, recent works [15] also stress the need to document contextual information about the speech (Speech Context) such as the specific dialect or the modality of the text. For instance, a natural language dataset gathered from Australian speakers may reduce the accuracy of models trained to support users in the United States due to different accents and language communication styles.
3 Results
This section reports on the results of our analysis. We first provide some information on the representativeness of the sample, describing the size and diversity of the data papers, and second, we report on the presence or absence of the information dimensions that characterize a good dataset for ML training purposes. We also provide a temporal evolution of such data to see whether the situation is improving.
3.1 Size and diversity of the sample
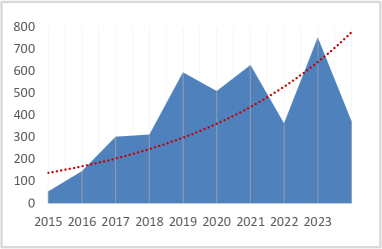
The analyzed sample comprises 4041 data papers extracted from two interdisciplinary scientific journals. In Figure 1, we can see an apparent growing trend in the number of papers published between 2015 and 2023, with 2021 being an exception due to the effect of COVID-19 on general scientific production. Note also that the absolute value for 2003 is smaller as we only collected data until June of 2023. The 16,5% of the sample’s data papers are related to people, and this is the subsample we used to calculate the presence of the Social concerns and the Profile of the collection targets dimensions in the next section as these metrics are only relevant for people-related datasets.
As an indication of the diversity of our dataset, Table 3.1 shows the 10 most popular topics of the uses of the data in the analyzed sample, showing the sample diversity. The topics related to the Conservation of biodiversity, RNA sequencing for gene analysis, and Chemistry and Physics are the most common ones. Other topics, such as Breast Cancer and Magnetic Resonance Imaging (MRI), are very interrelated, where most of the datasets around Breast Cancer are composed of MRI images. On the other hand, topics such as COVID-19 have appeared quickly in 2021 and are decreasing over time, as they are strongly correlated with a temporal event such as the coronavirus pandemic. The full results of the topic analysis can be found in our open repository [13].
| Topic | Related data papers (Sample’s percentage) | Example |
|---|---|---|
| Conservation of biodiversity | 352 (8,7%) | "To study the biodiversity and distribution of fish species, and assess the conservation status of fish species." [21] |
| RNA sequencing for gene analysis | 297 (7,4%) | "Quality control and data analysis in RNA-seq experiments, including quality analysis of raw sequencing data…" [22] |
| Chemistry and physics | 203 (5,0%) | "Soil chemistry analysis, soil classification, and land use analysis in New Zealand’s major agricultural regions." [23] |
| Breast Cancer | 181 (4,5%) | "MRI image processing procedures and constructing breast models for studying the effects of chemotherapy on breast cancer patients." [24] |
| Magnetic resonance imaging | 142 (3,5%) | "Preprocessing of functional MRI data, including motion correction, slice-timing correction, non-brain removal…" [25] |
| Covid19 | 104 (2,6%) | "To identify geographies for surveillance and inform global health security…" [26] |
| Smart Homes | 61 (1,5%) | "Gain a deep understanding of residential energy use, analyze household behavior and opinions on energy choices…" [27] |
| Precipitation | 60 (1,5%) | "Comparing different precipitation datasets with observations from GHCN-D 80 for the continental United States except Alaska…" [28] |
| Data Urban Transport | 56 (1,4%) | "Analyzing the impacts of congestion in functional urban areas, benchmarking functional urban areas according to accessibility…" [29] |
| Cropland | 54 (1,3%) | "Optimizing agricultural production strategies and water resources management, as well as validating crop yield…" [30] |
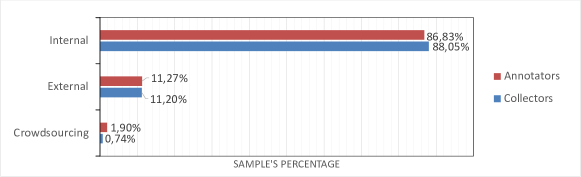
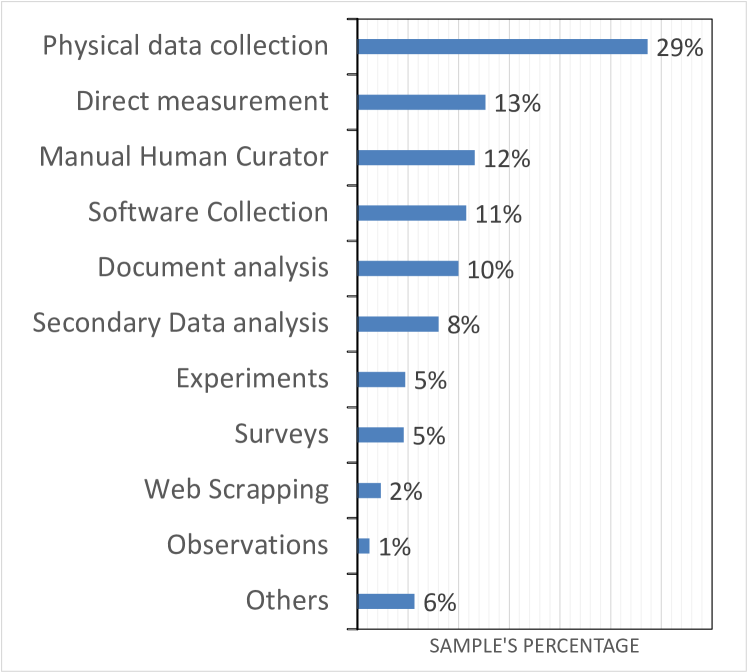
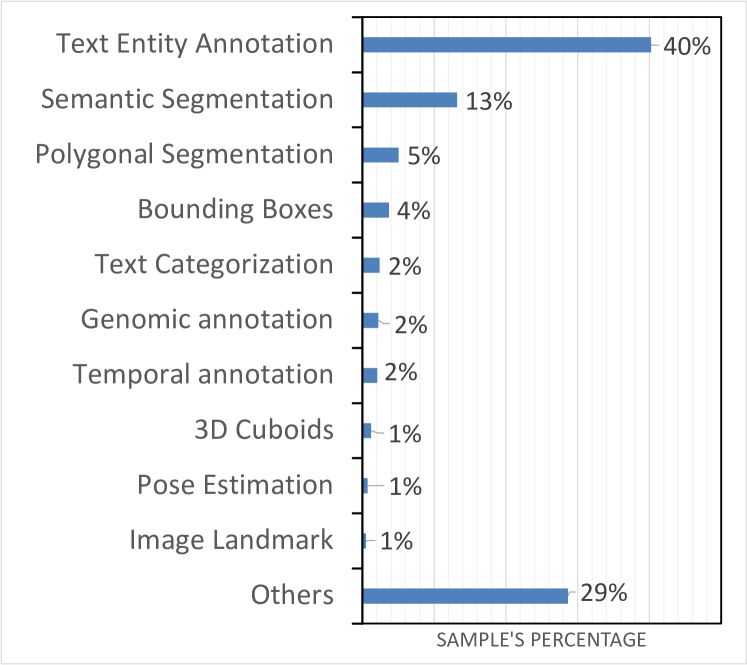
Our sample shows diversity in terms of the annotation and collection processes types as well. For instance, Figure 4 depicts the distribution of the most common data collection types with Physical data collection, Direct measurements, Document analysis, Manual human curator, and Software collection (all above 10%) being the most common ones. Moreover, Table 4 shows that nearly 88,05% of the teams who participated in data collection were internal teams (authors of the study or close collaborators), 11,20% were external teams, and only 0,74% used crowdsourcing practices to collect the data. Regarding the annotation process, only 42,28% of the analyzed data papers employ an annotation process involving humans. Figure 4 shows that the most common type of annotation is Text Entity Annotation, followed by Semantic segmentation, Polygonal segmentation and Bounding boxes. Compared to the collection processes, 29% of the processes were classified as Others. The results for team type are similar to the results for the collection process, with a high percentage of external teams (11,27%) and crowdsourcing teams (1,90%).
3.2 Dimensions presence in scientific data documentation
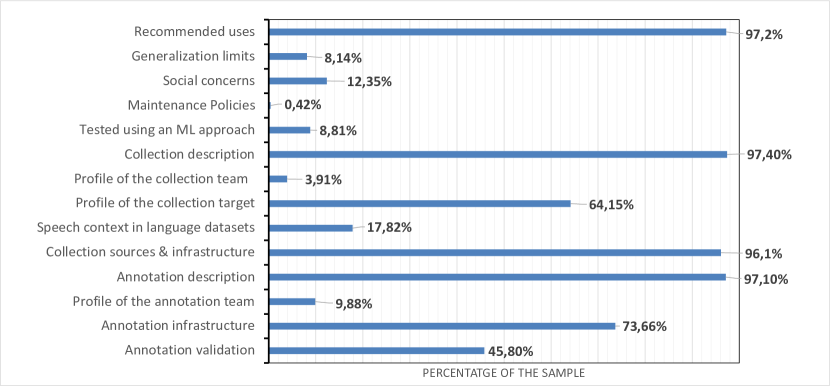
In this section, we go across the dimension presented in Section 2, analyzing its presence in the data papers. Figure 6 depicts the overall results. We can see that dimensions such as the Recommended uses (97,2%), Collection description (97,4%), Collection sources & infrastructure (96,1%), and the Annotation description (97,1%) have a very high presencecccDue to the extraction method’s tolerance, very high percentages can be understood as dimensions informed in all the analyzed data papers.. This is a sharp contrast with several other dimensions that are much less documented. For these less-documented dimensions, we depict their evolution between 2015 and 2023 in Figure 6, and in the remainder of this section, we will take a closer look at them. Some of these show an encouraging improvement over the last years but still remain at very low levelsdddNote that our analysis focuses on whether a given metric is present or not in the dataset. We do not penalize data papers if the metric is present but with a low-level detail or incomplete..
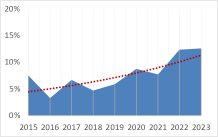
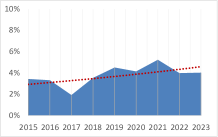
Generalization limits: Only 8,14% of the data papers report on the Generalization limits of the data. Despite the low results in Figure 5(a) we can see an increasing tendency over the years where the limits informed in 2022 (12,35%) are higher than in 2016 (3,3%). Looking closer at those data papers that disclose generalization limits, we observed that the informed limits relate to different aspects of the dataset. For instance, some of them point to specific non-recommended uses such as a climate dataset that states: "data presented here are not suitable for trend analysis –(at the US-Mexico and Canadian borders)–, since they use many stations that do not span the full temporal period 1950–2013"[31]. On the other hand, some data papers point to specific procedures to use the data properly. For instance, a dataset for climate forecasting in East Africa states: "Users should take into account CenTrends’ spatial error information when evaluating inter-seasonal and multi-annual rainfall anomalies. This type of information is poorly conveyed by cross-validation" [32]. Also, we found data papers discussing the limits of the theoretical approach of the data, such as a dataset about human footprint in environments stating: "Our work is subject to… limitations. First, like all attempts to map cumulative pressures, we did not fully account for all human pressures…"[33].
We also found disclosed limits linked to the gathering processes. For instance, a dataset to develop and test movement recognition points to specific issues during the collection process: "In any use involving the amputated subjects (database 3), the users should keep in mind that in two amputated subjects (subjects 7 and 8) the number of electrodes was reduced to ten due to insufficient space and that three amputated subjects (subjects 1, 3 and 10) asked to interrupt the experiment before its end due to fatigue or pain"[34]. Finally, there are also limitations in terms of the annotation process. For instance, a genome dataset points at the use of an automatic algorithm to annotate the data: "the TOBG genomes have been generated using an automated process without manual assessment, and therefore, all downstream research should independently assess the accuracy of genes, contigs, and phylogenetic assignments for organisms of interest" [35].
Social concerns: Out of the data papers representing people (16,5% of the total sample), only 12,35% are disclosing Social Concerns of the data. Curiously enough, datasets involving people do not tend to be better documented than the average, at least in terms of data limitations. Looking closer at the data papers disclosing social concerns, we observed that mentions to social biases are the most common, followed by privacy and sensitivity issues. As an example of a social bias, the Columbia Open Health Data states: "clinical databases contain a base population biased towards people with higher levels of existing conditions, thus biasing the measurements to overestimate the prevalence relative to the general population"[36].
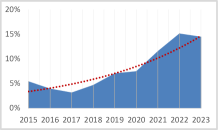
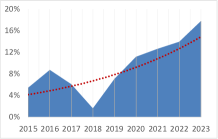
Maintenance policies and ML tested dimensions: Data paper almost never discuss recommended Maintenance policies; we only detected a 0,42% (17). Looking at the few data papers that do cover this aspect, policies are basically restricted to the the updating timeframe for the data [37] and the maintenance of the sensor and instruments gathering the data [38, 39]. In terms of papers documenting ML models that have already been tested on the data, only the 8,81% report this information. However, looking at Figure 5(c) we can see a clear growing tendency probably due to the popularization of ML technologies.
Profile of the collection team and the collection targets: In terms of collection processes, the Profiles of the collection team is present only in 3,91% of the data papers, and looking at Figure 5(d), we can observe that the tendency over the years tends to be flat. Beyond the low presence, if we look closer at those data papers profiling the team, they often do it in the author’s information section, disclosing only basic information such as affiliation, provenance, and job level. In addition, we also detected a subset of them being false positives as, instead of profiling the collection team, they were actually profiling the target of the collection process, much more common (64,15%) in data papers that are about people. The high presence of this dimension could be explained as profiling targets’ demographics is a mature practice in the healthcare field (e.g., the demographics of patient cohorts are crucial to include them or not in experiments or treatments). However, we also found complete profiles of the targets in data from other field such as analyzing factors influencing trading on pedestrian [40], or exploring the time perspective of Swedish citizens [41].
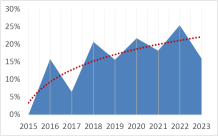
Speech context in language datasets: This dimension was only present in 17,82% of the relevant subsample though with a slight uptake in recent years (Figure 5(f)). The need for documenting the speech context was firmly stated by Bender et al. [15] in 2018, being one of the potential causes of this change in the tendency. Some examples of datasets disclosing proper speech context are Arabic diversified audio datasets [42], or a speech corpus for Quechua Collao [43], however, the information is mixed along the data papers and no structured form is provided as Bender at al.[15] initially states.
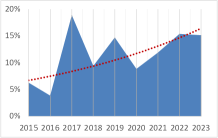
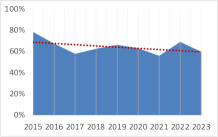
Profile of the annotation team and annotation infrastructure and validation: Finally, regarding the annotation process, we can see that the Profiles of the annotation team is present only in 9,88% of the data papers (more informed than the collection team), but looking at Figure 5(g), an contrasting to the collection process, it is improving (4,2% in 2015 to 18% in 2023). On the other hand, the Annotation Infrastructure is present in 73,66% of the sample, and information about Annotation Validation methods is present only in 45,80% in the analyzed sample. In both cases, the tendency across years is flat, without any relevant changes.
4 Discussion
This section discusses additional conclusions from our analysis and presents a set of recommendations to increase the presence of the demanded dimension in scientific data documentation. We also discuss current metadata infrastructure challenges and future trends in scientific data discoverability.
4.1 Improving submission guidelines
One of the first insights from the results presented in the last section is the contrast between the most and least documented dimensions. We have observed that the most documented dimensions are explicitly mentioned in the authors’ submission guidelines of the data journals. For instance, Scientific Data points the following regarding Data uses; "Background: […] The section should also briefly outline the broader goals that motivated the creation of this dataset and the potential reuse value…eeeFrom the template provided in https://www.nature.com/sdata/publish/submission-guidel” Date: 20/10/2023". As another example, in disclosing information about data sources, Data-in-Brief states "Please mention where the data were collected (e.g., geographical coordinates) or where the data are stored (typically your affiliation)…fffFrom the template provided in https://www.data-in-brief.com/content/authorinfo. Date: 20/10/2023". In conclusion, we observed that the publisher’s guidelines are a strong tool to ensure the documentation quality of datasets as the research community follows them strongly. Therefore, we present a set of specific suggestions to the current guidelines aimed at strengthening the presence and completeness of the less documented dimensions.
Guidelines for data generalization limits and social concerns
As we observed in the last section, the data generalization limits affect all stages of the data creation process. We propose asking authors about the generalization limits of their data using a structured report highlighting the various aspects we observed in this study. Furthermore, in the case of datasets gathered or representing people, we propose adding specific aspects pointing to social group biases as well as sensitivity and privacy issues. Table 3 summarizes the recommendations for the dimensions of data generalization limits and social concerns. In addition, beyond the limitations aspects identified in this study, a consistent taxonomy of the data limitation aspects would be a useful tool for data creators to reason about the generalization limits of their data. In that sense, building this taxonomy seems a promising research line with a potential impact on improving data-sharing practices.
Guidelines for profiling the teams behind the data creation process
Recent works in the ML community state that profiling the teams involved in the dataset creation in its documentation is essential. The main reason to do that is transparency, but also, having information about who is behind the data creation gives users more confidence and trust in the system [44]. Also, as a particular case of the team’s type, the labor work behind the data has raised concerns in the ML community[45, 20] about the quality of the data and the worker’s labor conditionsggghttps://time.com/6247678/openai-chatgpt-kenya-workers/. Despite this, we observed that the teams involved in the different provenance processes are scarcely documented, and there is a need to find solutions to this situation. In that sense, to engage authors to profile the different teams participating in the dataset creation, we propose to provide a generic Data participant profile, shown in Table 3, for every provenance process (annotation, collection, preprocessing) that involved people, along with the submission guidelines.
Guidelines for annotation processes
We observed that annotation processes are worse informed than gathering processes. For instance, at least 26,34% annotated datasets do not mention the infrastructure they use to annotate them, where gathering processes are practically always informed in that sense. The same occurs with the label validation methods, where practically 41% of data papers with an annotation process do not mention any. To improve this situation, we propose to add specific statements, shown in Table 3 inside the methods section of the submissions guidelines. With these statements, we aim to encourage authors to disclose the infrastructure and the validation methods applied over the labels, as well as the annotations guidelines given to the annotator team.
4.2 Explicitly covering new dimensions for the future use of scientific data, especially in ML settings
To better prepare for the long-term use of the published datasets we suggest two specific improvements in the data papers documentation guidelines.
Maintenance policies for evolving the data
Data has an evolving nature, as the reality it aims to represent. Despite this, we found a few papers outlining data maintenance policies. Data papers rarely contain information about how often the data will be updated, how users can contribute and report errors found in it, and how authors will fix them. The most common informed updating policies are an informal commitment of the authors, such as Mahood et al. [46] "Will be actively maintained and updated yearly and upon request… by the authors". This situation contrasts with the recent ML community works, such as Luccioni et al.[17] and Gebru et al.[47], which states the importance of documenting these practices. In these works, the authors stated that datasets could be updated or even deprecated for many reasons, such as legal enforcement or the apparition of ethical issues in the data (such as the case of ImageNet [48]).
In our view, one of the main reasons this situation happens is the inherent static form of scientific publication. The data papers’ static form may be limited to represent the nature of the dataset. However, other types of scientific publications, such as the Original Software Publication, have adopted an evolving nature, encouraging authors to update and evolve their published artefacts. We propose a similar approach for scientific data papers where authors can state the current status of the data artefact and guidelines for their future evolution. In Table 3 we outlined the main concepts of the Maintenance policies dimensions.
Adding data licenses and structured ML experiments results
Even if the number of data papers, as shown in Figure 5(c), that are designed with ML in mind is still low, we can be sure that most (if not all) of those datasets will be part of some ML pipeline in the future due to the data-hungry tendency of ML. So, we need methods to let authors think about the potential use of their data in ML approaches and methods to protect their rights.
In this sense, we propose the integration of the Montreal Data License [49] template in the submission form. This license template helps authors to decide how to disclose the data’s rights towards its use in ML technologies in a structured way. It also helps to disclose the authors intentions in the use of the data in ML. Data could not be suited for ML for many reasons, and potential ML practitioners need to be aware of authors’ thoughts on this. We would also like to encourage authors to test themselves their data using ML approaches. For this, we propose to annotate the results of ML experiments in a structured form as shown in Table 3. A structured form can be later included in the publishers metadata, enhancing the discoverability of the data through search engines (as Google Dataset Search via CroissanthhhCroissant main repository: https://github.com/mlcommons/croissant format), and facilitating the inclusion of the data in popular ML platforms such as Huggingfaceiiihttps://www.huggingface.co or Kagglejjjhttps://www.kaggle.com.
| Data generalization limits and social concerns | |
|---|---|
| Recommendations: | How to use the data properly and specific non-recommended uses. |
| Design limitations: | Data limits regarding data distribution and composition, and the theoretical approaches behind data design. |
| Provenance & source limitations: | Limits generated by the collection/annotation or inherited from the data sources |
| Maintenance policies (To be released in every version) | |
| Maintainers & updating timeframes: | Who are the current maintainers of the dataset and how can be contacted. Is there a plan to update the dataset with new data or with corrections. |
| Erratum & contribution guidelines: | How errors can be reported, and how people can contribute to the dataset |
| Deprecation policies: | Which are the current plans for deprecating the dataset |
| ML approaches using tested with the dataset | |
| Machine learning task: | Specific task description (character recognition, pose estimation, classification, etc.). |
| Machine-learning model & metrics: | The ML model name trained with the data and metrics (F1, accuracy, precision, recall). |
| References: | The reference to source code and relevant leadebords. |
| Data participants profile (For each provenance process involving people) | |
| Participants: | Number of the team members and high-level description of the team. |
| Demographics information: | Age, gender, country/region, race/ethnicity, native language, socioeconomic status, etc. |
| Team type and labour information: | Internal, external, crowd-sourcing or citizen science (volunteers) teams. If team is crowd-sourcing authors should disclose labour information, such as range salary, country of the contractor, labour union policies, etc. |
| Qualifications: | Members training and qualifications in relevant disciplines regarding the specific task applied over the dataset. |
| Annotation guidelines, infrastructure and validation | |
| Annotation guidelines: | The guidelines shared with the annotator team and how the annotation can be reproduced. |
| Infrastructure: | Which infrastructure (software, or physical) have been used to label the data. |
| Validation methods: | Validation methods applied over the labels (e.g., inter-annotation agreements). |
4.3 Metadata is not enough, text analysis tools are still needed
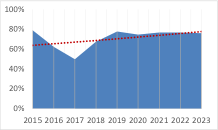
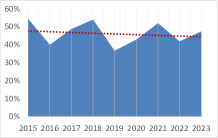
Unfortunately, metadata may be wrong or incomplete even for the most common fields. For instance, one of the dimensions typically found in metadata is the funding information. Funding agencies often request this information as proof of the research to justify the grants, and authors are motivated to disclose this information within the submission process. But if we compare the percentage of papers disclosing funding information (Figure 7) we see that this number is smaller than the number we can detect by running a text analysis on the Acknowledgments section.
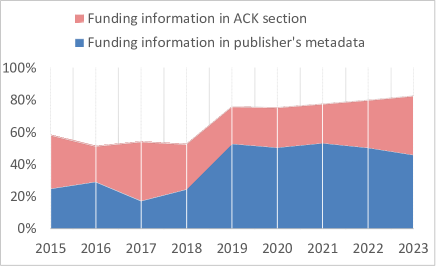
Indeed, although metadata for annotating funders has been implemented over the years, and it is supposed to be mandatory to justify research funding, the number of data authors that do not use them is still high. This situation stresses that the cultural changes in the community are slow, and even if the proposals for this work are quickly implemented, they will require time to be adopted by the research community. For other dimensions, situations may be even worse. Therefore, to complement all the existing and future initiatives to put in place better guidelines for authors, we still require text analysis methods such as the one we used in this same paper to automatically enrich the paper metadata.
4.4 Machine-readable description of the dimensions to improve data discoverability
Searching and evaluating the suitability of a dataset for a particular use case is a difficult task. As stated in Section 2, many aspects could influence the quality of the ML models trained with it, such as the demographics of the collection and annotation team or the particular generalization limits of the data. In that sense, search queries for datasets with annotators of the same geographic zone or gathered from a specific kind of patient are still complex to resolve using the current data search engines and data repositories.
In response to this situation, recent initiatives such as DescribeML [5] and CroissantkkkCroissant main repository: https://github.com/mlcommons/croissant are proposing structured ways for documenting datasets for machine learning. These structured formats are built on top of the works we presented in Section 2 and facilitate the automatic search and analysis of the presented dimensions. Moreover, popular data search engines, such as the Google Dataset Search [50], are starting to integrate these initiatives, showing their potential in the future of the data discoverability. Therefore, and beyond improving the publisher’s submission guidelines, we propose capturing the recommended dimensions in a structured format (compliant with some of the standard and initiatives mentioned before), for instance, during the data paper’s submission process.
5 Methods
Sample Selection
The efforts for improving data-sharing practices in the scientific field has trigger the creation of research data journals and tracks, e.g. see these compilations of data journals [51, 52, 53], devoted to publish mainly data papers (more than 50% of their total publication volume). To build our data sample, we selected from this list the journals meeting the following criteria: 1) Journal is active at July of 2023 and publish data papers regularly, 2) it publishes data papers from different scientific fields (inter-disciplinary scope), 3) it publishes data papers written in English. Filtering by this criteria, we have selected Scientific Data and Data in Brief as candidates. Scientific Data published by Nature was funded in 2014, with 3100 data descriptors published so far and covering the whole range of natural sciences disciplines. Data-in-Brief is published by Elsevier, also funded in 2014 and with 9315 data notes published from all the scientific disciplines.
Collecting the sample of data papers
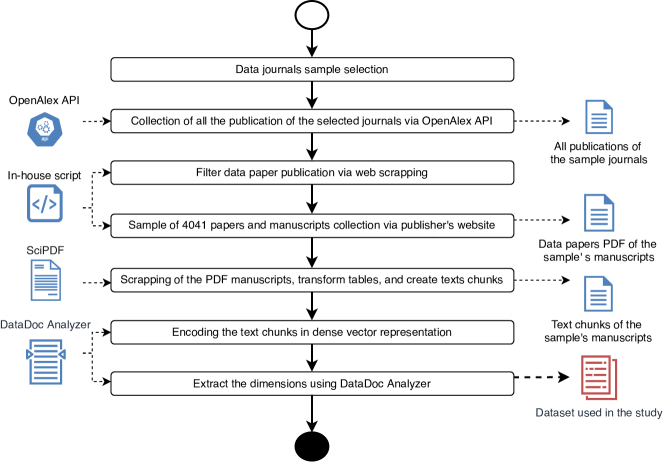
For this study we analyzed the full manuscripts of the data papers. To collect such manuscripts we relied on OpenAlex API [54], a major database commonly used in large-scale bibliographic analysis, which, recent studies (Jiao et al[51]), has pointed as one of the most complete databases in indexing data papers. To separate the data papers from other regular papers, and given that the own paper classification was not reliable (data papers are often indexed as regular papers), we develop an in-house python script (also available in our repository) to check one by one the type of the paper in the publisher’s website. The specific page for each paper was derived from its DOI. From the obtained list of data papers (3100 in Scientific Data and 9315 in Data-in-Brief) we selected a random sample, of data papers published between 2015 and July 2023, ending up with a sample of 4041 data papers, (2549 from Scientific Data and 1492 from Data-in-brief). Finally, we got the full manuscripts in PDF format using the DOI and accessing again the publisher’s website.
Manuscripts and text preparation
To prepare the texts for the automatic extraction of dimensions data, we have parsed each manuscript using the SciPDF library [55], that employs the GROBID[56] service under the hood. From the parsed documents we excluded the headers, footers, and the references section. Then we divided each section in different chunks composed of the title and text of the sections with a maximum of 1000 words (600-700 tokens). For longer sections, we created a new chunk of the section with an overlap of 300 characters with the previous chunk and also starting with the section title to provide context to the chunks. We have implemented this chunking strategy because we observed that the rhetoric structure in scientific articles provides good context and improves the performance of language models in retrieving relevant passages regarding to specific questions.
For the figures and tables present in each data paper we used Tabula.py [57] to extract the data together with its caption. Figures caption has been added as another chunk to the ones created previously. Then, we parsed the tables to HTML, and along with the caption and the paragraphs referencing the table, we used a Language Model (text-davinci-003) from the OpenAI API service to generate an explanation of the tables content using the table. This explanation then was added as yet another chunk. It has been useful to detect if some dimensions, such as the demographics of the team, where maybe present in the tables content.
Dimensions extraction and analysis
To extract the dimensions presented in Section 2 we applied the method presented in [58], which implements a Retrieval Augmented Generation (RAG) approach specifically targeting these dimensions. It works by combining a retrieval model and a chain of prompts on top of the retrieved paragraphs. Both, the identification of the candidate paragraphs and the type and concrete verbalization of the prompts, are tailored to each individual dimension to maximize the chances of detecting it. As a final step, a zero-shot classification strategy, also presented in the previous work, using a fine-tuned version of BART [59] on the MultiNLI (MNLI) dataset [60] is used to determine whether the result of the chain includes the target dimension. This whole process has been applied to each preprocessed manuscript to generate the data points used in our analysis. Figure 8 summarizes these steps.
In addition, we made a topic analysis of the generated uses explanations using BERTopic [61]. In that sense, we did a semi-supervised analysis, generating the topics from the data, and then reducing it and cleaning non-relevant ones. The representation of the topics shown in Table 1 has been generated with a fine-tune layer using a language models (flan-t5-large). The full results are published together with the data.
In conclusion, the data used to perform this study is composed of a list of the 4041 data papers, enriched with the dimension extracted and with the results of the topic analysis. As Giner et al.[58] reports in their approach, language models have a tendency to hallucinate, and despite the different strategies implemented to reduce this issue, we need to keep this in mind when looking the data. In that sense, the report of his study have reported preliminary accuracy metrics for each dimensions, being of 88,26% for the uses, 70% of the collection, and 81,25% for the annotation dimension.
Data availability
The data used in this study is published in an online repository and archived in Zenodo with a permanent identifier to facilitate its findability [13]. The data maintainer is Giner-Miguelez, co-author of this work, and can be contacted for reporting issues (errata) or further contributions to the data. Issues and contributions can also be reported through Zenodo’s open repository link. There is no set timeframe for data updates, and any data deprecation will be announced in the Zenodo-linked repository. As data does not represent people directly, we cannot infer potential social concerns directly from it. Aside from the topic analysis, we did not test the data with any machine learning approach. However, because data can be used to train ML models, practitioners should be aware of the limitations presented before using it.
The data extracted using the Giner et al. [58] approach cannot be understood as a gold truth because the underlying models are limited in accuracy and may suffer from hallucinations. Because of these issues, we only recommend using the data for statistical analysis of its trends. The data sources were the OpenAlex API service [54] and the data publishers’ website (Nature’s Scientific Data and Elsevier’s Data in Brief), and we have not detected any explicit bias inherited from them. The data collection and curation were done by the three authors of the paper (internal team), who are based in Spain and Luxembourg, during 2023. The method section explains the provenance processes carried out by the authors, and the archived repository contains the calculus and charts generated from the data.
Code availability
The code used to perform the analysis of this work has been published in the same public repository as the data along with the instruction to reproduce the extraction process of the data.
Acknowledgements
This research has been partially supported by the Spanish government (LOCOSS - PID2020-114615RB-I00), the AIDOaRt project, which has received funding from the ECSEL Joint Undertaking (JU) under grant agreement No 101007350. The JU receives support from the European Union’s Horizon 2020 research and innovation programme and Sweden, Austria, Czech Republic, Finland, France, Italy, and Spain. Jordi Cabot is supported by the Luxembourg National Research Fund (FNR) PEARL program, grant agreement 16544475.
Authors contribution
The authors of the manuscript have been contributed equally to this work.
Competing interests
The authors declare no competing interests.
References
- [1] Larrazabal, A. J., Nieto, N., Peterson, V., Milone, D. H. & Ferrante, E. Gender imbalance in medical imaging datasets produces biased classifiers for computer-aided diagnosis. \JournalTitleProceedings of the National Academy of Sciences 117, 12592–12594 (2020).
- [2] Abbasi-Sureshjani, S., Raumanns, R., Michels, B. E., Schouten, G. & Cheplygina, V. Risk of training diagnostic algorithms on data with demographic bias. In Interpretable and Annotation-Efficient Learning for Medical Image Computing: Third International Workshop, iMIMIC 2020, Second International Workshop, MIL3ID 2020, and 5th International Workshop, LABELS 2020, Held in Conjunction with MICCAI 2020, Lima, Peru, October 4–8, 2020, Proceedings 3, 183–192 (Springer, 2020).
- [3] Zech, J. R. et al. Variable generalization performance of a deep learning model to detect pneumonia in chest radiographs: A cross-sectional study. \JournalTitlePLOS Medicine 15, 1–17 (2018).
- [4] Gebru, T. et al. Datasheets for datasets. \JournalTitleCommunications of the ACM 64, 86–92 (2021).
- [5] Giner-Miguelez, J., Gómez, A. & Cabot, J. A domain-specific language for describing machine learning datasets. \JournalTitleJournal of Computer Languages 101209 (2023).
- [6] Tedersoo, L. et al. Data sharing practices and data availability upon request differ across scientific disciplines. \JournalTitleScientific data 8, 192 (2021).
- [7] Wilkinson, M. D. et al. The fair guiding principles for scientific data management and stewardship. \JournalTitleScientific data 3, 1–9 (2016).
- [8] Rolando, L. et al. Data management plans as a research tool. \JournalTitleBulletin of the Association for Information Science and Technology 41, 43–45 (2015).
- [9] Mayernik, M. S., Callaghan, S., Leigh, R., Tedds, J. & Worley, S. Peer review of datasets: When, why, and how. \JournalTitleBulletin of the American Meteorological Society 96, 191–201 (2015).
- [10] Silvello, G. Theory and practice of data citation. \JournalTitleJournal of the Association for Information Science and Technology 69, 6–20 (2018).
- [11] Kim, J. An analysis of data paper templates and guidelines: types of contextual information described by data journals. \JournalTitleScience Editing 7, 16–23 (2020).
- [12] Faniel, I. M., Frank, R. D. & Yakel, E. Context from the data reuser’s point of view. \JournalTitleJournal of Documentation 75, 1274–1297 (2019).
- [13] Giner-Miguelez, J., Gómez, A. & Cabot, J. Archived data supporting the study "On the readiness of scientific data for a fair and transparent use in machine learning", 10.5281/zenodo.10518218 (2024).
- [14] McMillan-Major, A. et al. Reusable templates and guides for documenting datasets and models for natural language processing and generation: A case study of the HuggingFace and GEM data and model cards. In Proceedings of the 1st Workshop on Natural Language Generation, Evaluation, and Metrics, 121–135 (ACM, Online, 2021).
- [15] Bender, E. M. & Friedman, B. Data statements for natural language processing: Toward mitigating system bias and enabling better science. \JournalTitleTransactions of the Association for Computational Linguistics 6, 587–604 (2018).
- [16] Holland, S., Hosny, A., Newman, S., Joseph, J. & Chmielinski, K. The dataset nutrition label. \JournalTitleData Protection and Privacy, Volume 12: Data Protection and Democracy 12, 1 (2020).
- [17] Luccioni, A. S. et al. A framework for deprecating datasets: Standardizing documentation, identification, and communication. In Proceedings of the 2022 ACM Conference on Fairness, Accountability, and Transparency, FAccT ’22, 199–212 (Association for Computing Machinery, New York, NY, USA, 2022).
- [18] Geiger, R. S. et al. Garbage in, garbage out? do machine learning application papers in social computing report where human-labeled training data comes from? In Proceedings of the 2020 Conference on Fairness, Accountability, and Transparency, FAT* ’20, 325–336 (Association for Computing Machinery, New York, NY, USA, 2020).
- [19] Rostamzadeh, N. et al. Healthsheet: Development of a transparency artifact for health datasets. In 2022 ACM Conference on Fairness, Accountability, and Transparency, FAccT ’22, 1943–1961 (Association for Computing Machinery, New York, NY, USA, 2022).
- [20] Díaz, M. et al. Crowdworksheets: Accounting for individual and collective identities underlying crowdsourced dataset annotation. In Proceedings of the 2022 ACM Conference on Fairness, Accountability, and Transparency, 2342–2351 (2022).
- [21] Rodeles, A. A., Galicia, D. & Miranda, R. Iberian fish records in the vertebrate collection of the museum of zoology of the university of navarra. \JournalTitleScientific Data 3, 1–7 (2016).
- [22] Emon, B. et al. Mechanosensitive changes in the expression of genes in colorectal cancer-associated fibroblasts. \JournalTitleScientific Data 10, 350 (2023).
- [23] Shen, Q. et al. Data on the organic matter characteristics of new zealand soils under different land uses. \JournalTitleData in brief 21, 620–638 (2018).
- [24] Xing, Y., Duan, Y., P. Indurkar, P., Qiu, A. & Chen, N. Optical breast atlas as a testbed for image reconstruction in optical mammography. \JournalTitleScientific Data 8, 257 (2021).
- [25] Aerts, H. et al. Pre-and post-surgery brain tumor multimodal magnetic resonance imaging data optimized for large scale computational modelling. \JournalTitleScientific Data 9, 676 (2022).
- [26] Ramshaw, R. E. et al. A database of geopositioned middle east respiratory syndrome coronavirus occurrences. \JournalTitleScientific data 6, 318 (2019).
- [27] Jridi, O. & Nouri, F. Z. Survey of socio-economic and contextual factors of households’ energy consumption. \JournalTitleData in Brief 5, 327–332 (2015).
- [28] Karger, D. N., Wilson, A. M., Mahony, C., Zimmermann, N. E. & Jetz, W. Global daily 1 km land surface precipitation based on cloud cover-informed downscaling. \JournalTitleScientific Data 8, 307 (2021).
- [29] Christodoulou, A., Dijkstra, L., Christidis, P., Bolsi, P. & Poelman, H. A fine resolution dataset of accessibility under different traffic conditions in european cities. \JournalTitleScientific data 7, 279 (2020).
- [30] Cheng, M. et al. High-resolution crop yield and water productivity dataset generated using random forest and remote sensing. \JournalTitleScientific Data 9, 641 (2022).
- [31] Livneh, B. et al. A spatially comprehensive, hydrometeorological data set for mexico, the us, and southern canada 1950–2013. \JournalTitleScientific data 2, 1–12 (2015).
- [32] Funk, C. et al. The centennial trends greater horn of africa precipitation dataset. \JournalTitleScientific data 2, 1–17 (2015).
- [33] Venter, O. et al. Sixteen years of change in the global terrestrial human footprint and implications for biodiversity conservation. \JournalTitleNature communications 7, 12558 (2016).
- [34] Atzori, M. et al. Electromyography data for non-invasive naturally-controlled robotic hand prostheses. \JournalTitleScientific data 1, 1–13 (2014).
- [35] Tully, B. J., Graham, E. D. & Heidelberg, J. F. The reconstruction of 2,631 draft metagenome-assembled genomes from the global oceans. \JournalTitleScientific data 5, 1–8 (2018).
- [36] Ta, C. N., Dumontier, M., Hripcsak, G., Tatonetti, N. P. & Weng, C. Columbia open health data, clinical concept prevalence and co-occurrence from electronic health records. \JournalTitleScientific data 5, 1–17 (2018).
- [37] Brlík, V. et al. Long-term and large-scale multispecies dataset tracking population changes of common european breeding birds. \JournalTitleScientific data 8, 21 (2021).
- [38] Tang, L. et al. Chinese industrial air pollution emissions based on the continuous emission monitoring systems network. \JournalTitleScientific Data 10, 153 (2023).
- [39] Kohler, M. et al. a meteorological dataset of the west african monsoon during the 2016 dacciwa campaign. \JournalTitleScientific Data 9, 174 (2022).
- [40] Ajakaiye, O. O. et al. Datasets on factors influencing trading on pedestrian bridges along ikorodu road, lagos, nigeria. \JournalTitleData in brief 19, 1584–1593 (2018).
- [41] Garcia, D., Al Nima, A. & Lindskär, E. Time perspective and well-being: Swedish survey questionnaires and data. \JournalTitleData in Brief 9, 183–193 (2016).
- [42] Lataifeh, M. & Elnagar, A. Ar-dad: Arabic diversified audio dataset. \JournalTitleData in Brief 33, 106503 (2020).
- [43] Paccotacya-Yanque, R. Y., Huanca-Anquise, C. A., Escalante-Calcina, J., Ramos-Lovón, W. R. & Cuno-Parari, Á. E. A speech corpus of quechua collao for automatic dimensional emotion recognition. \JournalTitleScientific Data 9, 778 (2022).
- [44] Chen, C. & Sundar, S. S. Is this ai trained on credible data? the effects of labeling quality and performance bias on user trust. In Proceedings of the 2023 CHI Conference on Human Factors in Computing Systems, 1–11 (2023).
- [45] Barbosa, N. M. & Chen, M. Rehumanized crowdsourcing: A labeling framework addressing bias and ethics in machine learning. In Proceedings of the 2019 CHI Conference on Human Factors in Computing Systems, 1–12 (2019).
- [46] Mahood, A. L., Lindrooth, E. J., Cook, M. C. & Balch, J. K. Country-level fire perimeter datasets (2001–2021). \JournalTitleScientific data 9, 458 (2022).
- [47] Gebru, T. et al. Datasheets for datasets. \JournalTitleCommunications of the ACM 64, 86–92 (2021).
- [48] Yang, K., Qinami, K., Fei-Fei, L., Deng, J. & Russakovsky, O. Towards fairer datasets: Filtering and balancing the distribution of the people subtree in the imagenet hierarchy. In Proceedings of the 2020 Conference on Fairness, Accountability, and Transparency, FAT* ’20, 547–558 (Association for Computing Machinery, New York, NY, USA, 2020).
- [49] Benjamin, M. et al. Towards standardization of data licenses: The montreal data license. \JournalTitlearXiv preprint arXiv:1903.12262 (2019).
- [50] Brickley, D., Burgess, M. & Noy, N. Google dataset search: Building a search engine for datasets in an open web ecosystem. In The World Wide Web Conference, 1365–1375 (2019).
- [51] Jiao, C., Li, K. & Fang, Z. How are exclusively data journals indexed in major scholarly databases? an examination of four databases. \JournalTitleScientific Data 10, 737 (2023).
- [52] Candela, L., Castelli, D., Manghi, P. & Tani, A. Data journals: A survey. \JournalTitleJournal of the Association for Information Science and Technology 66, 1747–1762 (2015).
- [53] Walters, W. H. Data journals: incentivizing data access and documentation within the scholarly communication system. \JournalTitleInsights: the UKSG journal 33 (2020).
- [54] Priem, J., Piwowar, H. & Orr, R. Openalex: A fully-open index of scholarly works, authors, venues, institutions, and concepts. \JournalTitlearXiv preprint arXiv:2205.01833 (2022).
- [55] Achakulvisut, T. SciPDF main repository. https://github.com/titipata/scipdf_parser (2023). Accessed: November 2023.
- [56] Romary, L. & Lopez, P. GROBID - Information Extraction from Scientific Publications. \JournalTitleERCIM News 100 (2015).
- [57] Ariga, A. Tabula main repository. https://github.com/chezou/tabula-py (2023). Accessed: November 2023.
- [58] Giner-Miguelez, J., Gómez, A. & Cabot, J. Datadoc analyzer: A tool for analyzing the documentation of scientific datasets. In Proceedings of the 32nd ACM International Conference on Information and Knowledge Management, 5046–5050 (2023).
- [59] Lewis, M. et al. BART: Denoising sequence-to-sequence pre-training for natural language generation, translation, and comprehension. In Jurafsky, D., Chai, J., Schluter, N. & Tetreault, J. (eds.) Proceedings of the 58th Annual Meeting of the Association for Computational Linguistics, 7871–7880 (Association for Computational Linguistics, Online, 2020).
- [60] Williams, A., Nangia, N. & Bowman, S. A broad-coverage challenge corpus for sentence understanding through inference. In Walker, M., Ji, H. & Stent, A. (eds.) Proceedings of the 2018 Conference of the North American Chapter of the Association for Computational Linguistics: Human Language Technologies, Volume 1 (Long Papers), 1112–1122 (Association for Computational Linguistics, New Orleans, Louisiana, 2018).
- [61] Grootendorst, M. Bertopic: Neural topic modeling with a class-based tf-idf procedure. \JournalTitlearXiv preprint arXiv:2203.05794 (2022).