The Impact of the Third Dredge-up and Mass Loss in Shaping the Initial-Final Mass Relation of White Dwarfs
Abstract
The initial-final mass relation (IFMR) plays a crucial role in understanding stellar structure and evolution by linking a star’s initial mass to the mass of the resulting white dwarf. This study explores the IFMR in the initial mass range using full PARSEC evolutionary calculations supplemented with COLIBRI computations to complete the ejection of the envelope and obtain the final core mass. Recent works have shown that the supposed monotonicity of the IFMR is interrupted by a kink in the initial mass range , due to the interaction between recurrent dredge-up episodes and stellar winds in carbon stars evolving on the thermally-pulsing asymptotic giant branch phase. To reproduce the IFMR non-monotonic behavior we investigate the role of convective overshooting efficiency applied to the base of the convective envelope () and to the borders of the pulse-driven convective zone (), as well as its interplay with mass loss. We compare our models to observational data and find that must vary with initial mass in order to accurately reproduce the IFMR’s observed kink and slopes. We find some degeneracy between the overshooting parameters when only the IFMR information is used. Nonetheless, this analysis provides valuable insights into the internal mixing processes during the TP-AGB phase.
1 Introduction
The Thermally-Pulsing Asymptotic Giant Branch (TP-AGB) phase is the final evolutionary stage of low- and intermediate-mass stars (), which ends when the envelope is ejected by stellar winds in the interstellar medium and the bare central core cools as a carbon-oxygen (C-O) white dwarf (Karakas & Lattanzio, 2014; Herwig, 2005).
The evolution of the TP-AGB phase is heavily influenced by processes that are difficult to model from first principles, such as turbulent convection, stellar winds, long-period variability, and various dredge-up episodes (collectively designated as third dredge-up, or TDU). Furthermore, these processes interact with one another and do not occur smoothly during the TP-AGB evolution, but they may vary greatly in characteristics and efficiency over a thermal pulse cycle (TPC).
We recall that the TDU is responsible for the formation of carbon stars, characterized by a photospheric C/O ratio larger than one. In fact, at the stage of the maximum luminosity produced by the thermal instabilities of the He-burning shell, the bottom of the convective envelope may stretch inside the region involved in the thermal pulse nucleosynthesis, bringing newly synthesized carbon produced by the triple-alpha reaction to the surface (Herwig, 2005). Unfortunately, the TDU is highly dependent on the physics prescriptions and numerical treatments (Frost & Lattanzio, 1996; Mowlavi, 1999) of the stellar evolution code, resulting in a wide heterogeneity of TP-AGB models and results (Straniero et al., 1997; Herwig, 2000; Stancliffe et al., 2005; Weiss & Ferguson, 2009; Cristallo et al., 2011; Marigo et al., 2013; Karakas, 2014; Ventura et al., 2018).
One method for constraining the efficiency of the TDU is to reproduce the carbon star luminosity functions in various galaxies with different age-metallicity relations and known star formation histories (Groenewegen & de Jong, 1993; Marigo et al., 1999; Marigo & Girardi, 2007; Pastorelli et al., 2019, 2020).
The semi-empirical initial final mass relation (IFMR) of C-O white dwarfs provides another approach to calibrating the TDU in Milky Way carbon stars, as demonstrated in a few studies (Kalirai et al., 2014; Marigo et al., 2020; Marigo, 2022a).
Following the exploration in these works, this research focuses on the semi-empirical IFMR, with the goals of reproducing semi-empirical behavior using recent data and retrieving information on the TDU using full self-consistent TP-AGB stellar models. To recover the semi-empirical IFMR, we will specifically investigate the role of mass loss and convective overshooting applied to the base of the convective envelope and the borders of the pulse-driven convective zone (PDCZ).
The IFMR is an important tool for understanding stellar evolution because it provides insight into the processes that occur during the star’s lifetime, in particular setting constraints on the amount of mass lost by stellar winds (Marigo, 2013; Kalirai et al., 2014; Marigo, 2022a, b).
In general, the IFMR predicts that more massive stars will produce more massive remnants. Over the years improvements on the semi-empirical IFMR have been achieved thanks to new observations and refined treatments in stellar evolution codes. (Weidemann, 2000; Williams et al., 2004; Kalirai et al., 2008, 2009; Salaris et al., 2009; Williams et al., 2009; Kalirai et al., 2014; Cummings et al., 2018, 2019, and references therein).
Recently, with the addition of new WDs data belonging to open clusters with ages of 1.5-2.5 Gyr, Marigo et al. (2020) found a kink in the IFMR at about , that suddenly interrupts the commonly assumed monotonic behavior. Surprisingly, the white dwarfs at the peak, which are all members of the open cluster NGC 7789, reach masses of , which have previously been associated with stars with .
The IFMR kink is interpreted as the signature of the lowest-mass stars in the Milky Way that evolved into carbon stars during the TP-AGB phase. According to Marigo et al. (2020), these carbon stars are expected to have undergone shallow third dredge-up events, resulting in low photospheric C/O and modest carbon excess with respect to oxygen, C-O. Under these conditions, carbonaceous dust grains cannot condense in sufficient quantities to cause a strong wind, so the TP-AGB lifetime is prolonged and the core mass can grow more than usually predicted. Theoretically, the key to this behavior is the use of mass-loss prescriptions for carbon stars that are dependent on carbon excess, which are based on state-of-the-art dynamical models (Mattsson et al., 2010; Eriksson et al., 2014; Bladh et al., 2019).
An independent study of AGB stars in Galactic open clusters using Gaia EDR3 recently confirmed these findings (Marigo et al., 2021). In the initial mass range of the kink, they found carbon stars with dust-free spectra and irregular small-amplitude pulsations (implying very low mass loss as estimated from spectral energy distribution fitting) with current core masses of , consistent with WD masses (see Figure 8 of that paper).
The paper is structured as follows. Section 2 presents and discusses the input physics and technical details of our PARSEC models. In Section 3, we recall the evolutionary properties of low- and intermediate-mass stars with references to our tracks. Section 4 describes how to estimate the final mass of the white dwarf and the shape of the IFMR. Our concluding remarks end the paper in Section 5.
2 Input Physics
The code and main input physics used in PARSEC V2.0 is described thoroughly in Bressan et al. (2012), Tang et al. (2014), Chen et al. (2014), Fu et al. (2018), Costa et al. (2019a, b) and Nguyen et al. (2022). Here we summarise the relevant points for the low- and intermediate-mass stars treated in this work.
Our sets of TP-AGB tracks have solar-like metallicity , with a solar-scaled chemical composition from Caffau et al. (2011). The helium content is given by with (Komatsu et al., 2011) and (Bressan et al., 2012). Equation of state tables are calculated using the FREEEOS code developed by A. W. Irwin111http://freeeos.sourceforge.net/. Nuclear reaction rates includes a total of 72 reactions and tracks 32 isotopes: 1H, D, 3He, 4He, 7Li, 7Be, 12C, 13C, 14N, 15N, 16O, 17O, 18O, 19F, 20Ne, 21Ne, 22Ne, 23Na, 24Mg, 25Mg, 26Mg, 27Al, 28Al, 29Si, 30S, 31Ar, 40Ca, 44Ti, 48Cr, 52Fe, 56Ni, 60Zn. The primary energy-generating nuclear reactions are all included; a list with references can be found in Table 1 of Fu et al. (2018) and Costa et al. (2021). We now detail the physics inputs and go over all of the updates for dealing with the TP-AGB phase.
Opacity tables in the low-temperature regime () are calculated with ÆSOPUS (Marigo & Aringer, 2009; Marigo et al., 2022) and have been updated to track the variation of carbon, nitrogen and oxygen abundances due to consecutive dredge-up events and hot-bottom burning. In the high-temperature regime, , we use the opacity tables provided by the Opacity Project At Livermore (OPAL; Iglesias & Rogers, 1996). Conductive opacities are incorporated following Itoh et al. (2008).
Nuclear reaction network and mixing are solved together with diffusive equations (Costa et al., 2019b). Regions unstable to convection are defined by the Schwarzchild criterion. The diffusion coefficient within these zones is derived from the mixing-length theory framework (Böhm-Vitense, 1958) and we adopt a mixing length parameter according to the calibration of the standard solar model (Bressan et al., 2012). is fixed across the whole evolution. At each border of all unstable zones we include convective overshooting. These regions are considered radiative. Moreover, core overshooting is treated as a ballistic process (Bressan et al., 1981), while the diffusion coefficient for the convective envelope and pulse-driven convective zone overshooting is calculated with the scheme proposed by Herwig (2000):
| (1) |
where is the radial coordinate of the convective border according to the Schwarzchild criterion and is the distance inside the convective region at which overshooting begins to be applied and where the diffusion coefficient is equal to . The minimum value of the diffusion coefficient is set to , below which no mixing is allowed. For simplicity we assume (Choi et al., 2016). We define and respectively as the overshooting parameters at the bottom of the convective envelope and in the PDCZ. In the latter, convective overshooting is applied on both borders of the instability region. Previous studies have shown indications of overshooting in the PDCZ (Herwig, 2000; Wagstaff et al., 2020) but there is no general agreement yet. A first principle analysis indicates that the inertia of the convective eddies in the PDCZ is not enough to make them overcome the Schwarzchild border (Lattanzio et al., 2017). This may imply that there must be another mechanism able to mix over the canonical border of the PDCZ. Exponential overshooting is a simple and effective prescription that can overcome the canonical convective border while lacking a more physically sound scheme.
As described by Bressan et al. (2012) and Nguyen et al. (2022), we apply core and envelope overshooting depending on the initial mass of the track. We define as the minimum initial mass that has a convective core during the main sequence. For we do not apply core overshooting, and ; for we apply maximum core and envelope overshooting, as and ; for both parameters ( and ) scale linearly with the initial mass. We will refer to this set of models as or ”fiducial” value. and are the corresponding values of and calibrated on the RGB bump and blue loop width for the previous envelope overshooting prescription (Alongi et al., 1991; Christensen-Dalsgaard et al., 2011; Bressan et al., 2015; Fu et al., 2018). The conversion from the previous to the exponential overshooting prescriptions has been performed by matching the position and width of the RGB bump in the HR diagram for low-mass and intermediate-mass. During central He-burning phase the efficiency of core overshooting is set to for every initial mass, which gives consistent horizontal branch and AGB lifetimes with R2 ratio observed in globular clusters (Bressan et al., 1986; Constantino et al., 2016). We do not suppress the occurrence of breathing pulses (Sweigart & Demarque, 1973; Castellani et al., 1985), but their efficiency decreases with the inclusion of non-local core overshooting (Bressan et al., 1986). We do not include the effects of rotation or magnetic fields, and the only extra-mixing comes from overshooting.
Mass loss is treated as follows: we assume no stellar wind up to the end of the main sequence. Once the star leaves the main sequence (MS) and proceeds through the red giant branch we use the Reimers’ law with (Reimers, 1975). After the core He-burning is complete and early AGB begins, the stellar wind is described as a two-stage process. The entire formulation of mass loss on the AGB is taken from Marigo et al. (2020). For luminosities below the tip of the red-giant branch, we assume the Alfven waves-driven wind by Cranmer & Saar (2011). Above this threshold, while the photospheric C/O remains below unity, the mass loss is caused by pulsations and radiation pressure on silicate dust grains (Bloecker, 1995) with . As the star surface becomes carbon-rich, with a low carbon excess with respect to oxygen, it enters a phase with little or no amounts of dust, and the stellar wind is described by pulsating models of almost dust-free atmospheres (Winters et al., 2000). Finally, when the carbon excess is large enough ( depending on current mass, luminosity and effective temperature) to form significant amounts of carbonaceous dust we use the state-of-the-art dynamical atmosphere models by Mattsson et al. (2010), Eriksson et al. (2014) and Bladh et al. (2019).
Lastly, we developed, tested, and used a shell-shifting-like treatment for accelerating the calculation during quiescent interpulses (details in Appendix A).
We calculated a total of 439 tracks distributed on 24 sets. The pre-TP-AGB evolution of each track in every set has been calculated with fiducial envelope overshooting , as explained above. Details are discussed in the following section. Then, each set is identified by a couple of values (, ), which refer only to the TP-AGB phase. Our sets span the values and , as summarized in Table 1.
| 0.047* | 0.056 | 0.064 | 0.096 | 0.128 | 0.144 | 0.160 | |
|---|---|---|---|---|---|---|---|
| 0.000 | ✓ | \text | ✓ | \text | ✓ | \text | \text |
| 0.001 | ✓ | ✓ | ✓ | ✓ | ✓ | ✓ | ✓ |
| 0.002 | ✓ | \text | ✓ | \text | ✓ | \text | \text |
| 0.004 | ✓ | \text | ✓ | \text | ✓ | \text | \text |
| 0.008 | ✓ | \text | ✓ | \text | ✓ | \text | \text |
| 0.016 | ✓ | \text | ✓ | \text | ✓ | \text | \text |
| 0.032 | ✓ | \text | \text | \text | \text | \text | \text |
| 0.064 | ✓ | \text | \text | \text | \text | \text | \text |
The tracks span the range of (only a few sets extend to ) and the mass step is depending on the initial mass. Tracks close to and within the IFMR kink have a finer grid than stars outside.
The evolution is calculated from the Pre-Main Sequence (PMS) to the furthest point in the TP-AGB (see Sect. 4). As in Bressan et al. (2012) the code interrupts when a star approaches the He-flash and then it is restarted from a proper Zero Age He-burning model (ZAHB), with mass corresponding to the total mass left at the RGB tip. The transition is so rapid that we can assume the star does not lose mass. We calculated proper ZAHB models for our fiducial set *. Overshooting in the PDCZ clearly does not matter at this stage. We determined that stars do experience He-flash for with an accuracy of . We also estimated our , which corresponds to the H-burning core being convective and from which we start to apply core overshooting and the minimal value for in our fiducial set.
3 Evolutionary properties
In this section, we highlight the evolutionary features of our models, with a specific focus on the core mass evolution. The definition of the core mass varies depending on the evolutionary stage. The evolution before the TP-AGB phase of PARSEC tracks have been thoroughly described recently by Nguyen et al. (2022). Prior to the TP-AGB phase, is equal to the mass of the hydrogen-exhausted core. In order to include the possibility that white dwarfs may retain a thin hydrogen atmosphere on top of the He-intershell and CO core (Saumon et al., 2022), we take
| (2) |
as the definition of the core mass in TP-AGB. is a generic mass coordinate, and are the hydrogen abundance in any mesh point and in the surface respectively. We also mark the beginning of TP-AGB where the thickness of the He-intershell falls below 0.1 (Dotter, 2016).
3.1 Pre-TP-AGB Evolution
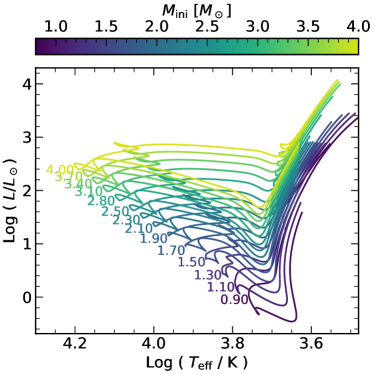
Fig. 1 shows the evolution in the HR diagram of a sub-sample of the spanned mass range until the beginning of the TP-AGB phase. With our assumptions of , this part is common for all sets of tracks.
Before TP-AGB, the core is built up by the ashes of (core and shell) hydrogen and helium burning. The growth can be limited by the first and second dredge-up events (respectively FDU and SDU). These are directly related to the efficiency of envelope overshooting.
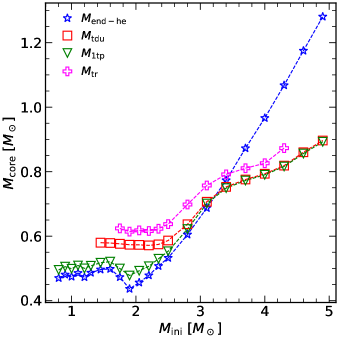
Our study focuses on the core mass evolution and the final mass of the white dwarf left at the end. Our choice for setting the same for all initial masses before TP-AGB fixes the penetration of the envelope during the first and second dredge-up. Observations of the RGB bump constrain during the FDU (Alongi et al., 1991; Fu et al., 2018); later during core He burning, affects the extensions and position of blue loops (Tang et al., 2014). However, there are no direct constraints for the overshooting efficiency during SDU. Therefore we want to make sure the mass of the core and surface C/O ratio are minimally impacted by the SDU experienced by tracks with different values of . The SDU eventually affects stars with (Karakas & Lattanzio, 2014), thus we calculated few intermediate-mass stars tracks setting the value from the PMS, different from the fiducial .. In Figure 2 various mass thresholds are shown with definitions in the figure caption. Where reveals which tracks experience the SDU, in agreement with Karakas & Lattanzio (2014). Table 2 shows the main properties at the on-set of the TP-AGB phase of two models with and , computed with different from the PMS. In particular, the core mass after the second dredge-up and the carbon-to-oxygen ratio are the two main properties that will shape the following evolution of the track. These quantities differ by less than 2% in models with different (from the PMS), and there is no clear trend with increasing overshooting penetration. Thus, we conclude that these differences may be led by purely numerical features, which are intrinsic in the mixing treatment.
Our test confirmed that the SDU is not appreciably affected by the choice of envelope overshooting, at least up to . Then, we modify the value of only during the TP-AGB, ensuring consistency with previous calibrations. PDCZ is only present during a TP, thus the previous evolution is insensitive to .
| 0.047 | 0.096 | 0.144 | |
|---|---|---|---|
| 0.791 | 0.778 | 0.782 | |
| 6.538E-01 | 6.522E-01 | 6.530E-01 | |
| 3.321E-01 | 3.337E-01 | 3.330E-01 | |
| 1.456E-03 | 1.447E-03 | 1.445E-03 | |
| 5.137E-03 | 5.106E-03 | 5.098E-03 | |
| C/Osurf | 3.964E-01 | 3.965E-01 | 3.964E-01 |
| 0.047 | 0.096 | 0.144 | |
| 0.810 | 0.802 | 0.810 | |
| 6.398E-01 | 6.389E-01 | 6.388E-01 | |
| 3.462E-01 | 3.471E-01 | 3.471E-01 | |
| 1.423E-03 | 1.417E-03 | 1.413E-03 | |
| 5.011E-03 | 4.985E-03 | 4.974E-03 | |
| C/Osurf | 3.975E-01 | 3.979E-01 | 3.977E-01 |
3.2 TP-AGB evolution
During the TP-AGB phase, the star undergoes recurring thermal pulses driven by the thermal instability of the geometrically thin helium shell. Following each pulse, the star may experience the TDU (Herwig, 2005; Karakas & Lattanzio, 2014). This event reduces the core mass and transports helium-burning ashes to the surface. The efficiency of the third dredge-up is quantified by the parameter , defined as:
| (3) |
where represents the decrease of the core mass caused by the penetration of the envelope after the -th thermal pulse. is equal to the growth of the core mass between the ()-th and -th pulses. It’s important to acknowledge that is highly sensitive to both the numerical details and the physical inputs of the model (Frost & Lattanzio, 1996; Mowlavi, 1999). To ensure accurate predictions, maintaining consistent numerical prescriptions is crucial when calibrating the physical parameters to prevent potential systematic errors. We also recall that is mainly dependent on the core mass and the envelope mass at fixed metallicity (Straniero et al., 2003). These pieces of information serve as our reference point for the subsequent analysis of our TP-AGB tracks.
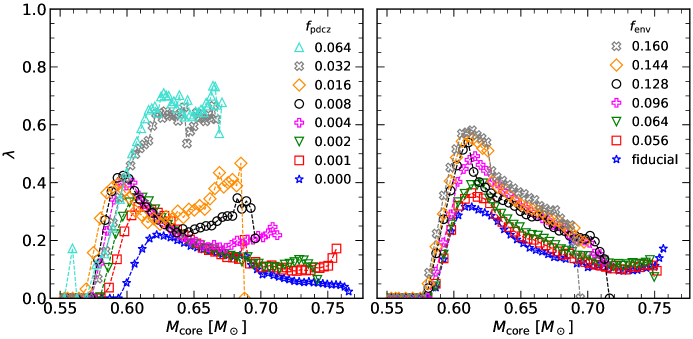
Figure 3 illustrates the evolution of relative to for a star for every set. Generally, increasing envelope overshooting leads to a more efficient dredge-up. That is a standard behavior and what is usually found in literature, as increased overshooting depth destabilizes deeper mass shells. Instead -curves show a unique pattern at varying . Again the TDU efficiency increases with the overshooting parameter (in this case PDCZ), in agreement with Herwig (2000). Nevertheless, the shape of the -curves at varying displays a prominent double maximum, instead of the usual bell-like profile (Straniero et al., 1997, 2003; Cristallo et al., 2011; Marigo, 2022a). We realized that the second rise of with begins roughly at , at which the mass-loss rate changes from a Blöcker wind to the dust-free pulsation-only driven regime. Thus, we argue that the track is moved back to a region of the (, ) plane where TDU is favored (Straniero et al., 2003).
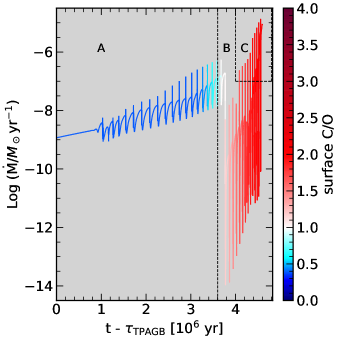
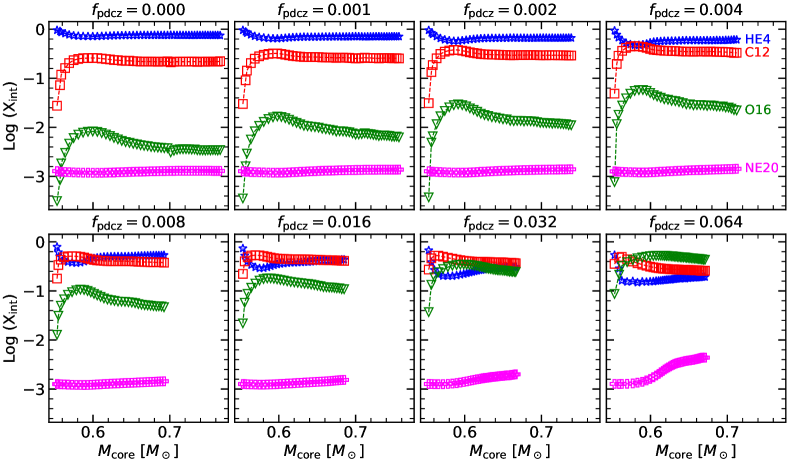
It is important to highlight that is not sufficient to determine completely the star’s evolution. Instead, the interplay of the growth of the core mass and the composition of the dredge-up material is pivotal. Fig. 4 shows an example of mass-loss rate evolution with time of a star from the set (0.128,0.001). Changing or does affect the evolution, as it changes the transition to carbon star in the first place, but it also modifies the duration of the dust-free phase with small mass-loss rates. It is not easy to predict how much the total TP-AGB lifetime changes and thus the effect on the core mass, but it is clear that the two overshooting parameters are mildly degenerate. only impacts the TDU efficiency (as shown in Figure 3), while changes the intershell composition too, as shown in Figure 5. In general, deeper PDCZ overshooting will increase the carbon abundance in the intershell but it increases oxygen abundance too, decreasing the overall C/Ointershell ratio of the material that is being brought to the surface.
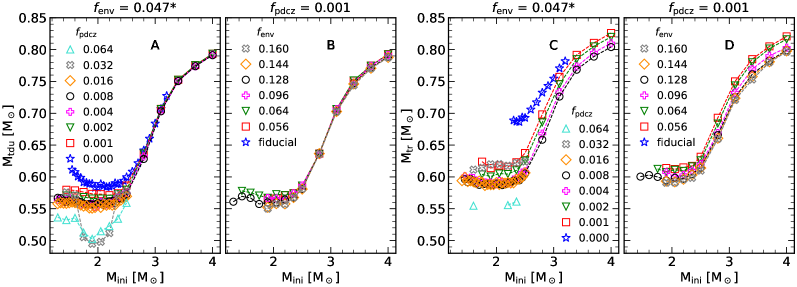
After analyzing the effect of and on , we are interested in the impact on the mass threshold previously presented in Figure 2. Clearly, and are not affected due to our assumptions. Figure 6 shows how the extension of the overshooting region (in the envelope and PDCZ) affects and . The effect of is limited, as both and change by less than 0.05 in the low mass range. At the does not change (in both cases) because it takes place at the first thermal pulse, which is independent of the overshooting parameters. On the other hand has a greater impact on and . The first occurrence of TDU is significantly lowered in core mass at increasing , especially for oxygen-rich intershells. Furthermore, TDU occurs for even lower initial masses, from at to for . That is even more evident in looking at the transition core mass from M-type to C-type. A small value for is enough to make drop from to . Again, it significantly lowers the threshold for the first (initial) mass becoming C-type from for no PDCZ-overshooting to at . However, for , the trend reverses due to a combination of higher TDU efficiency and a C-deficient intershell, leading to delayed or non-existent transitions. For the extreme , only three tracks become C-type, but they remain in this phase for a brief period before reverting to M-type due to dredge-ups from an oxygen-rich intershell.
We have investigated the main effects of the two overshooting parameters and their interplay with mass loss on the quantities that shape the IFMR. These considerations are fundamental in shaping the final form of the Initial-Final Mass Relation (IFMR), which is discussed in the following section.
4 Estimate of the final core mass
As stars approach the end of the TP-AGB phase, they are characterized by high luminosity (, depending on the initial mass) and low effective temperature (). In these advanced phases, issues in finding model convergence arise and it becomes difficult to follow the evolution with PARSEC. This region of the HR diagram is notorious for numerical difficulties (Wood & Faulkner, 1986; Wagenhuber & Weiss, 1994; Herwig, 2001; Karakas, 2003; Miller Bertolami & Althaus, 2006; Karakas & Lattanzio, 2007; Weiss & Ferguson, 2009; Lau et al., 2012). These numerical difficulties appear to be independent of the specific stellar evolution code, computational grid, and time step employed (see also discussion by Addari 2020). We tried to determine with our present tracks whether this challenge stems from purely numerical complications or if it originates from a more physically motivated ground; we have not found conclusive information yet, but a full analysis is out of the scope of this work. As a preliminary note, we observed that if the star’s envelope is swiftly stripped off (achieved by setting a higher mass-loss rate), the track seamlessly approaches the conclusion of the TP-AGB phase and enters the post-AGB phase. We are aware that the mass-loss has a huge impact on TP-AGB evolution, as it sets the lifetime of this phase. Due to our assumptions on stellar winds, in particular the low mass-loss phase (region B in Figure 4), our tracks extend well toward high luminosity and low effective temperature. For this reason, our models usually do not reach the end of the TP-AGB, and the calculation stops a few pulses before the almost complete envelope ejection.
However, it is still possible to get reliable and self-consistent estimates of the final core mass. First, we employ a simple extrapolation scheme (Sect. 4.1) to filter out the extreme cases that cannot reproduce the expected IFMR given by Marigo et al. (2020). Then, we completed the remaining models with the COLIBRI code (Marigo et al., 2013), the characteristics of which are briefly summarized in the Sect. 4.2.
4.1 A simple estimate
Before applying COLIBRI code to complete the tracks, we can get a general understanding of the impact of the overshooting parameters by extrapolating over the last thermal pulses. This technique exploits typical key parameters that influence the TP-AGB evolution. These quantities include: core mass , envelope mass , mass-loss rate , 3DU efficiency , effective temperature and inter-pulse period . The procedure is very similar to that adopted by the COLIBRI code but gives up much of its complexity in order to get a simple, yet effective, estimate. Indeed, the process of extrapolating or extending evolutionary models carries the inherent risk of introducing errors or inaccuracies, especially when venturing beyond simulated data points. To account for that, we introduced error bars to the results given by this extrapolation technique, by assuming parameters that intuitively give the lowest and largest core mass growth in the remaining part after PARSEC evolution. We extensively discuss the results of the extrapolation in Sect. 4.3.
Despite the risk of extending evolutionary models, it is recognized retrospectively that the approach undertaken serves the intended purpose effectively. Specifically, in the context of studying the IFMR, it allows us to get a first-order feeling of the impact of on the final core mass. This preliminary set of information is then used to reject some of the possibilities, reducing the set of tracks that then are properly completed with COLIBRI.
4.2 The COLIBRI code
In comparison to fully synthetic TP-AGB codes (Groenewegen & de Jong, 1993; Izzard et al., 2004), the COLIBRI code leaves much of their analytic formalism in favor of detailed physics applied to a complete envelope model, in which the four stellar structure equations are integrated from the atmosphere to the bottom of the hydrogen-burning shell. It incorporates the ÆSOPUS code (Marigo & Aringer, 2009; Marigo et al., 2022) as a routine to calculate the equation of state and Rosseland mean opacities in the star’s external layers. Furthermore, it accounts for hot-bottom burning nucleosynthesis and energetics using a nuclear network coupled with a diffusive treatment of convection. The TDU is parameterized, but we recently introduced a more physically sound description in which the TDU efficiency is determined by core and envelope mass (Marigo, 2022a).
Several routines are shared by PARSEC and COLIBRI, including those related to convection, atmosphere, opacities, nuclear reactions, mass loss, and the diffusive treatment of convection in the envelope.
As a result, the COLIBRI code is an appropriate tool for completing the TP-AGB evolution computed by PARSEC. COLIBRI calculations start from the last TP computed by PARSEC, at the quiescent stage of pre-flash luminosity maximum. Many structural parameters are loaded into COLIBRI from PARSEC last model, including the intershell chemical composition, which will be kept constant until the end of the evolution.

Figure 7 shows an example of the matching between PARSEC and COLIBRI computations. This TP-AGB model becomes a carbon star, has a final core mass of , and populates the IMFR kink, in agreement with the data (Cummings et al., 2018; Marigo et al., 2020). We also notice that the TDU is already quenched when COLIBRI starts the computations. As a consequence, the number of pulses computed with COLIBRI () is modest in most tracks with , except for a few cases where . We will discuss the final results with the complete tracks in the following section.
4.3 Shape of the IFMR
Marigo et al. (2020) demonstrated that the Initial-Final Mass Relations is not monotonic and exhibits a notable kink between initial masses around . This kink is attributed to the chemical enrichment brought about by the third dredge-up phenomenon, coupled with the diverse regimes of mass loss as ruled by the carbon excess :
| (4) |
where is the number abundance of the element. Stars with carbon excess less than experience extended lifetimes, due to weaker winds (B-regime in Figure 4), and the core grows above the usual monotonic trend.
One advantage of employing purely synthetic or hybrid evolutionary codes is that the TDU efficiency can be treated as a free parameter. The IFMR offers an excellent means to directly calibrate this efficiency without the constraints imposed by more first-principle parameters like convective overshooting efficiency. Instead, we aim to reproduce the shape of the IFMR by setting the values of (, ), which have a wider impact than simply changing .
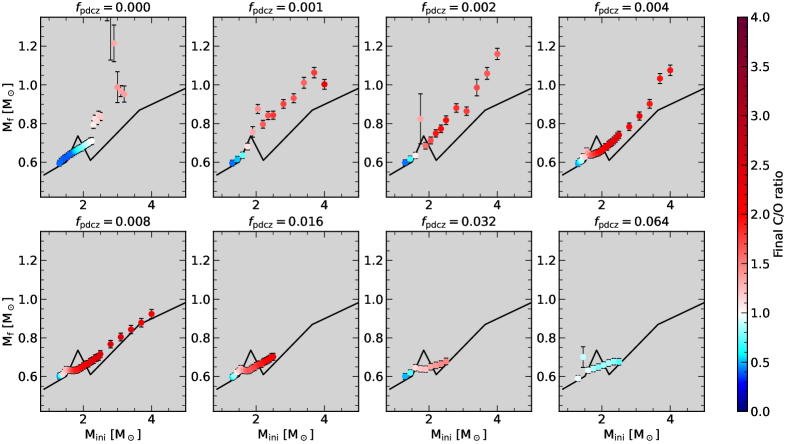
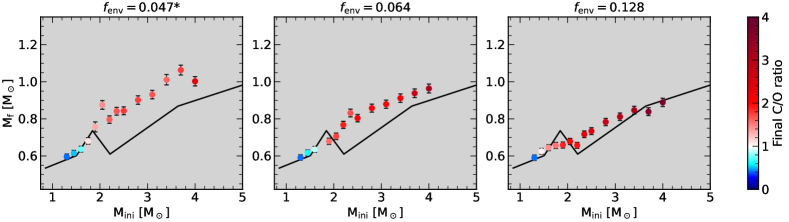
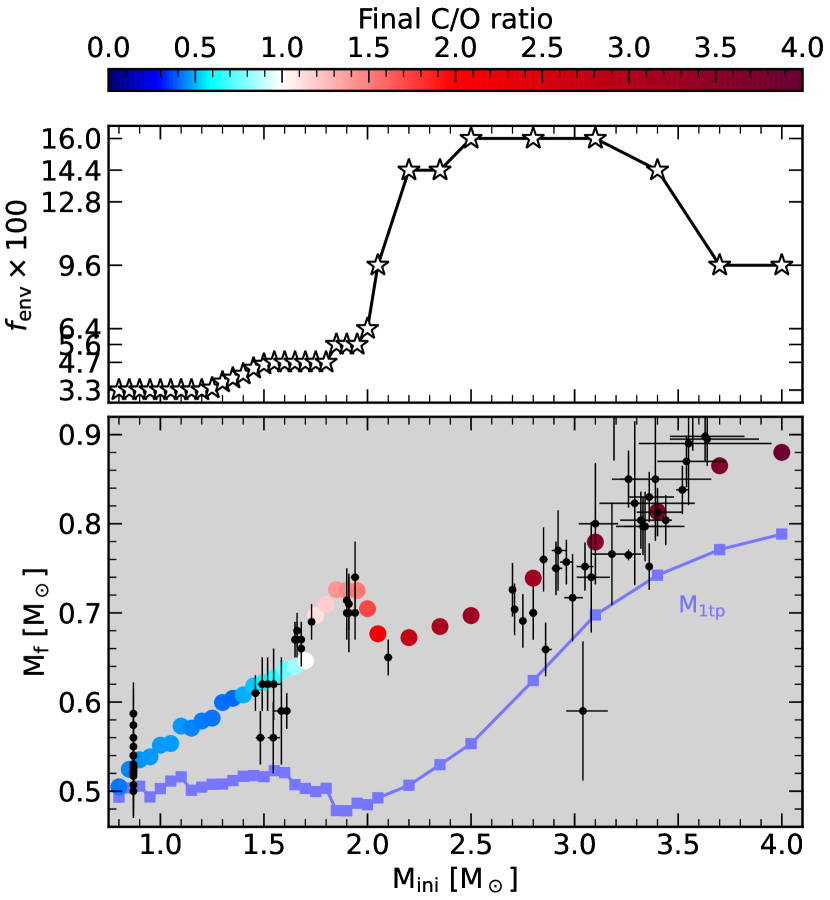
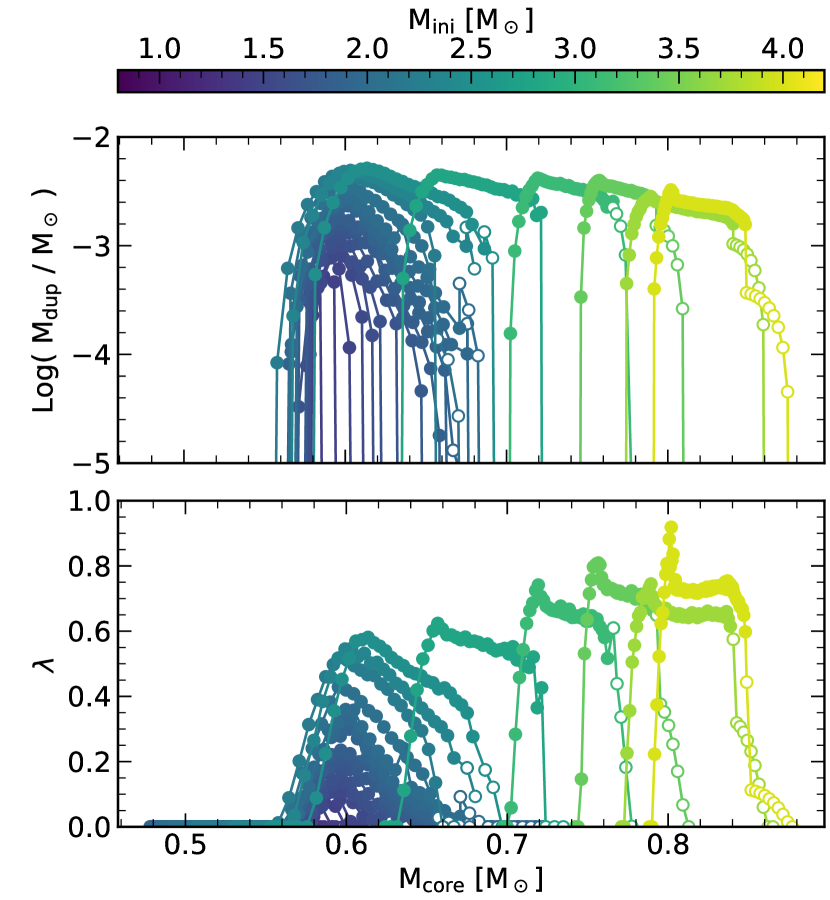
Figure 8 and Figure 9 illustrate the IFMR for varying and , respectively. In most cases, a monotonic trend is evident, without any kink. We can notice how the low mass tracks () are close to the expected IFMR independently on the choice of the parameters. That is because these tracks experience very shallow or no dredge-up, so the core mass have similar evolution even with different (, ). On the other hand, in the intermediate-mass range most of our models overestimate the final mass given by the semi-empirical IFMR. The discrepancy is progressively reduced by increasing or , meaning that a more efficient TDU is needed at these initial masses. This is consistent with the previous IFMR calibrations (Marigo et al., 2020; Marigo, 2022a), which indicate that increases with the initial mass. Our findings show that a fixed couple of overshooting parameters for all masses cannot reproduce the kink at .
At this point we still have two parameters that affect the shape of the IFMR. For the rest of the discussion, we fix the value of and we increase the efficiency of TDU by changing only, thus fixing the intershell composition (see Figure 5). We will discuss the robustness of this assumption later in this section. In this framework, we can immediately reject the extreme cases and . The latter simply does not produce any carbon star. The case with no overshooting in the PDCZ experiences very weak dredge-ups across the whole mass range. Then, the first carbon stars are produced at while we expect to find them at lower masses (Marigo et al., 2021). Figure 8 shows very clearly that even small values of the PDCZ-overshooting, compared to , make the biggest impact on the IFMR. Sets with are already enough to accommodate all initial masses up to the kink maximum at . To select our optimal final set we select , as produce too efficient TDU events (both in envelope penetration and carbon abundance in the intershell) already with the fiducial value () of envelope overshooting. Having set , we can just vary until a satisfactory fit is achieved, and we can complete these tracks with COLIBRI to find more accurate estimates of the final mass. Figure 11 shows the final IFMR on top of observational data used in previous works (Cummings et al., 2018; Marigo et al., 2020; Canton et al., 2021) and Figure 11 shows the impact of each dredge-up on the same set of tracks. We collect the properties of the final set of tracks in Table 3.
| (C/O)f | ||||||||||||
|---|---|---|---|---|---|---|---|---|---|---|---|---|
| 0.80 | 0.033 | 6 | ✗ | 0.503 | ✗ | 0.424 | 102.510 | 16.129 | 1.455 | 0.172 | 0.000 | 0.000 |
| 0.85 | 0.033 | 6 | ✗ | 0.523 | ✗ | 0.441 | 111.940 | 11.547 | 1.791 | 0.119 | 0.000 | 0.000 |
| 0.90 | 0.033 | 7 | ✗ | 0.534 | ✗ | 0.455 | 109.881 | 11.492 | 1.963 | 0.122 | 0.000 | 0.000 |
| 0.95 | 0.033 | 11 | ✗ | 0.538 | ✗ | 0.464 | 113.405 | 14.591 | 2.498 | 0.151 | 0.000 | 0.000 |
| 1.00 | 0.033 | 10 | ✗ | 0.551 | ✗ | 0.462 | 108.428 | 12.715 | 2.545 | 0.141 | 0.000 | 0.000 |
| 1.05 | 0.033 | 9 | ✗ | 0.554 | ✗ | 0.468 | 118.934 | 9.192 | 2.070 | 0.095 | 0.000 | 0.000 |
| 1.10 | 0.033 | 10 | ✗ | 0.573 | ✗ | 0.458 | 112.987 | 9.563 | 2.394 | 0.106 | 0.000 | 0.000 |
| 1.15 | 0.033 | 14 | ✗ | 0.571 | ✗ | 0.438 | 109.913 | 14.758 | 2.908 | 0.161 | 0.000 | 0.000 |
| 1.20 | 0.033 | 14 | ✗ | 0.579 | ✗ | 0.428 | 111.067 | 13.911 | 2.952 | 0.152 | 0.000 | 0.000 |
| 1.25 | 0.034 | 14 | ✗ | 0.582 | ✗ | 0.418 | 108.358 | 13.055 | 2.841 | 0.147 | 0.000 | 0.000 |
| 1.30 | 0.037 | 17 | 1 | 0.598 | 0.599 | 0.413 | 107.687 | 12.026 | 3.018 | 0.140 | 0.000 | 0.000 |
| 1.35 | 0.039 | 16 | 1 | 0.600 | 0.604 | 0.406 | 113.896 | 10.045 | 2.935 | 0.114 | 0.000 | 0.000 |
| 1.40 | 0.041 | 15 | 2 | 0.598 | 0.608 | 0.487 | 120.513 | 8.452 | 2.786 | 0.093 | 0.000 | 0.063 |
| 1.45 | 0.044 | 17 | 1 | 0.614 | 0.618 | 0.520 | 103.378 | 11.132 | 2.914 | 0.136 | 0.000 | 0.072 |
| 1.50 | 0.046 | 18 | 1 | 0.616 | 0.622 | 0.581 | 108.628 | 10.258 | 2.972 | 0.122 | 0.000 | 0.106 |
| 1.55 | 0.047 | 17 | 2 | 0.617 | 0.627 | 0.641 | 121.401 | 7.263 | 2.782 | 0.083 | 0.000 | 0.110 |
| 1.60 | 0.047 | 20 | 1 | 0.635 | 0.637 | 0.741 | 113.248 | 9.355 | 3.055 | 0.110 | 0.000 | 0.137 |
| 1.65 | 0.047 | 23 | 1 | 0.634 | 0.640 | 0.830 | 129.538 | 10.010 | 3.510 | 0.104 | 0.000 | 0.169 |
| 1.70 | 0.047 | 25 | 2 | 0.638 | 0.646 | 0.982 | 117.913 | 13.553 | 3.812 | 0.147 | 0.000 | 0.190 |
| 1.75 | 0.047 | 34 | 4 | 0.679 | 0.697 | 1.103 | 129.467 | 14.204 | 4.311 | 0.143 | 0.657 | 0.210 |
| 1.80 | 0.047 | 34 | 5 | 0.684 | 0.709 | 1.182 | 159.252 | 8.776 | 4.283 | 0.082 | 0.789 | 0.235 |
| 1.85 | 0.056 | 38 | 10 | 0.672 | 0.726 | 1.401 | 267.388 | 17.313 | 5.252 | 0.084 | 1.014 | 0.299 |
| 1.90 | 0.056 | 38 | 12 | 0.662 | 0.725 | 1.454 | 234.687 | 17.506 | 5.149 | 0.097 | 0.890 | 0.321 |
| 1.95 | 0.056 | 38 | 8 | 0.676 | 0.725 | 1.518 | 240.711 | 14.036 | 5.029 | 0.079 | 0.975 | 0.329 |
| 2.00 | 0.064 | 37 | 6 | 0.671 | 0.705 | 1.727 | 195.418 | 18.703 | 4.962 | 0.121 | 0.925 | 0.360 |
| 2.05 | 0.096 | 34 | 4 | 0.657 | 0.677 | 2.127 | 193.298 | 15.462 | 4.690 | 0.104 | 0.939 | 0.429 |
| 2.20 | 0.144 | 34 | 2 | 0.660 | 0.672 | 2.788 | 154.412 | 11.410 | 4.218 | 0.101 | 1.073 | 0.519 |
| 2.35 | 0.144 | 34 | 1 | 0.675 | 0.685 | 3.130 | 126.222 | 8.305 | 3.476 | 0.093 | 1.115 | 0.547 |
| 2.50 | 0.160 | 34 | 2 | 0.686 | 0.697 | 3.287 | 95.420 | 8.453 | 2.935 | 0.119 | 1.193 | 0.581 |
| 2.80 | 0.160 | 35 | 3 | 0.724 | 0.739 | 3.219 | 63.693 | 5.019 | 1.818 | 0.107 | 0.905 | 0.624 |
| 3.10 | 0.160 | 38 | 4 | 0.766 | 0.779 | 3.571 | 43.372 | 3.239 | 1.194 | 0.102 | 0.663 | 0.742 |
| 3.40 | 0.144 | 41 | 7 | 0.793 | 0.814 | 3.626 | 29.673 | 2.559 | 0.955 | 0.118 | 0.583 | 0.809 |
| 3.70 | 0.096 | 62 | 10 | 0.841 | 0.865 | 3.681 | 23.604 | 1.559 | 0.885 | 0.104 | 0.563 | 0.745 |
| 4.00 | 0.096 | 71 | 11 | 0.849 | 0.880 | 3.901 | 17.128 | 1.360 | 0.859 | 0.130 | 0.584 | 0.919 |
As expected, the negative slope region ( ) indicates an increasing , even up to four times greater than the envelope undershooting extend in the lower mass range. Another change of slope is evident at approximately , where a reduction in is necessary to accommodate larger core growth. In this high-mass range, core growth is severely hampered by the combination of high-efficiency TDU and hot bottom burning (HBB), significantly limiting core growth during the interpulse phase. However, the white dwarf data spread for give looser constraints on the and we selected an average value of . Figure 11 shows again that PARSEC calculation stops close to the end of TP-AGB, where TDU is quenched. Then, it is clear that COLIBRI has a limited impact on the results. Nevertheless, it stands out as a very efficient and powerful tool to complete the TP-AGB evolution, where full stellar evolutionary codes usually give up.
Finally, we want to briefly discuss the robustness of the results giving up the assumption of fixed . If we let both parameters free, a simple -fit gives a random distribution of (), with no clear trend with the initial mass. Still leaving it as an open possibility, it would give little or no information on the internal mixing processes and on the efficiency of the third dredge-up. That is because the parameters not only change the envelope penetration but also the intershell composition, thus leading to a mild degeneracy of the parameters. The works by Wagstaff et al. (2020) and Addari (2020) give useful hints on how to overcome this apparent degeneracy. The [WC]-type of central stars of planetary nebula abundances reflects the intershell composition, giving tighter constraints on the only. These findings suggested us to select a value for , and let only vary to adjust the efficiency of TDU. Herwig (2005) and Wagstaff et al. (2020) suggest , which is much higher than found in this work based on IFMR. However, the typical errors for PG 1159 stars abundances (about 0.3-0.5 dex, Werner & Herwig 2006; Werner & Rauch 2014; Werner et al. 2016) and the data spread make it difficult to differentiate between scenarios with low or zero , by relying solely on intershell abundances. Given the intricacies in interpreting observations, primarily due to the potential influence of late thermal pulses, the study of [WC]-type of central stars of planetary nebula is beyond the scope of this work, but we acknowledge that coupling this data with the IFMR can potentially lift the degeneracy of .
5 Concluding remarks
This study undertook a comprehensive exploration of a broad spectrum of values for both envelope and pulse-driven convective zone overshooting, aiming to calibrate them in accordance with the semi-empirical Initial-Final Mass Relation presented by Marigo et al. (2020). Notably, this work stands as the first successful endeavor in reproducing the IFMR kink employing a full stellar evolution code, PARSEC, supported by the COLIBRI code. Given that PARSEC stops in close proximity to the end of their evolution, where the third dredge-up is no longer relevant in shaping the core mass, and considering the inherent scatter in observational data, the validity of our scheme is evident.
It is worth noting that the previous TDU calibration based on the semi-empirical IFMR performed by Marigo et al. (2020) and Marigo (2022a) is supported by this work. White dwarfs populating the kink had progenitor carbon stars that experienced shallow mixing events () with mild carbon enrichment and modest mass-loss rates. Then, the efficiency of the TDU increases with increasing initial mass in both PARSEC and COLIBRI codes. This suggests that the efficient computational capabilities of the COLIBRI code make it a valuable tool for both exploring the parameter space and potentially indicating a calibration pathway.
In this study, we show that the fiducial value of envelope overshooting () alone falls short of explaining the observed outcomes, as such tracks dredge up minimal amounts of mass. Our investigation establishes that a constant envelope penetration is not a viable solution either. On the other hand, a small value for the PDCZ overshooting () with a varying (Figure 11, top panel) proves sufficient to approach a feasible solution in reproducing the IFMR. This work may serve as a practical guideline, focusing on the extent of the envelope penetration (Figure 11) and the composition of the intershell (Fig. 5, panel ). The cumulative effects of these two factors directly influence mass loss, ultimately shaping the star’s evolution to align with the observed IFMR. However, we noted a mild degree of degeneracy between the two overshooting parameters. Our future exploration will go deeper into this aspect, by combining the present results with information from observed intershell composition from [WC]-type central stars of planetary nebulae (Wagstaff et al., 2020). This extension holds the potential to constrain the value of independently, thus leaving only the envelope overshooting efficiency as a free parameter.
Appendix A Shell shifting
The concept of shell shifting was initially introduced by Weigert (1966). This idea stems directly from the principle of energy conservation. The variation in the hydrogen profile during an interpulse phase can be expressed as follows:
| (A1) |
where is the hydrogen abundance (being the one in the convective envelope), is the hydrogen burning luminosity generated in the H-shell, is the effective q-value of the nuclear network, is the nuclear energy generation rate and finally is the mass coordinate. Equation A1 was used to determine the hydrogen profile following the expansion of the core by a certain amount. This approach demonstrated good agreement with calculations using small time steps, albeit with the caveat that computational power in the 1960s was significantly more limited than today’s standards. Nevertheless, contemporary stellar evolution codes have evolved to become more comprehensive, and TP-AGB models, in particular, remain computationally intensive.
Stancliffe et al. (2005) studied the difference in using simultaneous and non-simultaneous solvers in stellar evolution codes. In conclusion, the only difference is that the second type of codes only need shorter timesteps to produce the same results, and there is no inherent problem with using a non-simultaneous method of solution. However, shorter timesteps increase considerably computational time. To address this issue, we have introduced a modified shell-shifting procedure to use during interpulse periods. Diverging from the original method employed by Weigert (1966), our approach involves applying the same principle to refine the solution provided by the chemical module solver. Instead of keeping the structure fixed while solving the nuclear network, we adjust the temperature and density profiles based on the observed shifts in the hydrogen profile. This innovation permits the use of considerably longer time steps, extending from the range of 1-10 years to 100-1000 years. Additionally, we introduced an energy conservation validation mechanism, which is based on an enhanced version of Eq. A1. This validation procedure considers both the hydrogen abundance at the shell’s upper boundary and the collective effective q-value of all hydrogen-burning reactions. This validation step refines the final time step allocated for the chemical solution by introducing a corrective factor that ensures Eq. A1 is respected.
This refined approach substantially reduces computational time, approximately by a third compared to the case of utilizing small time steps, while incurring minimal to no loss in accuracy concerning core growth and energy conservation.
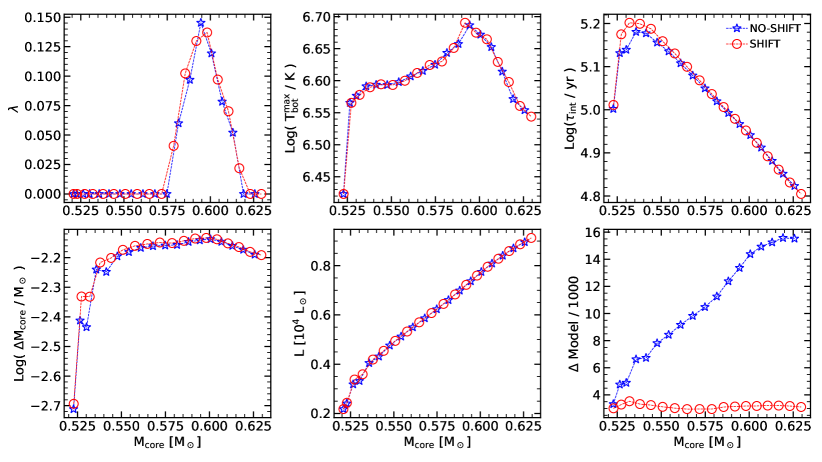
We computed a test track with and without the shell-shifting approach, not changing any other physical or numerical input, and we summarised the result in Figure 12. All physical quantities are in good agreement between the two cases, with only minimal differences in the first few pulses. With a minimal accuracy price, the method can speed up computing time and save storage. In the last panel of Figure 12, the number of models per pulse cycle is shown against the core mass. The shell-shifting track keeps a constant number of models (about 4000 timestamps) against a steeply rising trend topping at about 16000 models, gaining a factor of 3-4 in CPU time.
References
- Addari (2020) Addari, F. 2020, Master’s thesis, University of Padua. https://thesis.unipd.it/handle/20.500.12608/22550
- Alongi et al. (1991) Alongi, M., Bertelli, G., Bressan, A., & Chiosi, C. 1991, Astronomy & Astrophysics, 244, 95. https://articles.adsabs.harvard.edu/pdf/1991A%26A...244...95A
- Bladh et al. (2019) Bladh, S., Eriksson, K., Marigo, P., Liljegren, S., & Aringer, B. 2019, Astronomy & Astrophysics, 623, A119, doi: 10.1051/0004-6361/201834778
- Bloecker (1995) Bloecker, T. 1995, Astronomy and Astrophysics, 297, 727. https://ui.adsabs.harvard.edu/abs/1995A&A...297..727B
- Böhm-Vitense (1958) Böhm-Vitense, E. 1958, ZAp, 46, 108
- Bressan et al. (1986) Bressan, A., Bertelli, G., & Chiosi, C. 1986, Memorie della Societa Astronomica Italiana, 57, 411. https://ui.adsabs.harvard.edu/abs/1986MmSAI..57..411B
- Bressan et al. (2015) Bressan, A., Girardi, L., Marigo, P., Rosenfield, P., & Tang, J. 2015, 39, 25, doi: 10.1007/978-3-319-10993-0_3
- Bressan et al. (2012) Bressan, A., Marigo, P., Girardi, L., et al. 2012, Monthly Notices of the Royal Astronomical Society, 427, 127, doi: 10.1111/j.1365-2966.2012.21948.x
- Bressan et al. (1981) Bressan, A. G., Chiosi, C., & Bertelli, G. 1981, Astronomy and Astrophysics, 102, 25. https://ui.adsabs.harvard.edu/abs/1981A&A...102...25B
- Caffau et al. (2011) Caffau, E., Ludwig, H.-G., Steffen, M., Freytag, B., & Bonifacio, P. 2011, Solar Physics, 268, 255, doi: 10.1007/s11207-010-9541-4
- Canton et al. (2021) Canton, P. A., Williams, K. A., Kilic, M., & Bolte, M. 2021, The Astronomical Journal, 161, 169, doi: 10.3847/1538-3881/abe1ad
- Castellani et al. (1985) Castellani, V., Chieffi, A., Tornambe, A., & Pulone, L. 1985, The Astrophysical Journal, 296, 204, doi: 10.1086/163437
- Chen et al. (2014) Chen, Y., Girardi, L., Bressan, A., et al. 2014, Monthly Notices of the Royal Astronomical Society, 444, 2525, doi: 10.1093/mnras/stu1605
- Choi et al. (2016) Choi, J., Dotter, A., Conroy, C., et al. 2016, The Astrophysical Journal, 823, 102, doi: 10.3847/0004-637X/823/2/102
- Christensen-Dalsgaard et al. (2011) Christensen-Dalsgaard, J., Monteiro, M. J. P. F. G., Rempel, M., & Thompson, M. J. 2011, Monthly Notices of the Royal Astronomical Society, 414, 1158, doi: 10.1111/j.1365-2966.2011.18460.x
- Constantino et al. (2016) Constantino, T., Campbell, S. W., Lattanzio, J. C., & van Duijneveldt, A. 2016, Monthly Notices of the Royal Astronomical Society, 456, 3866, doi: 10.1093/mnras/stv2939
- Costa et al. (2021) Costa, G., Bressan, A., Mapelli, M., et al. 2021, MNRAS, 501, 4514, doi: 10.1093/mnras/staa3916
- Costa et al. (2019a) Costa, G., Girardi, L., Bressan, A., et al. 2019a, Astronomy & Astrophysics, 631, A128, doi: 10.1051/0004-6361/201936409
- Costa et al. (2019b) —. 2019b, Monthly Notices of the Royal Astronomical Society, 485, 4641, doi: 10.1093/mnras/stz728
- Cranmer & Saar (2011) Cranmer, S. R., & Saar, S. H. 2011, The Astrophysical Journal, 741, 54, doi: 10.1088/0004-637X/741/1/54
- Cristallo et al. (2011) Cristallo, S., Piersanti, L., Straniero, O., et al. 2011, The Astrophysical Journal Supplement Series, 197, 17, doi: 10.1088/0067-0049/197/2/17
- Cummings et al. (2019) Cummings, J. D., Kalirai, J. S., Choi, J., et al. 2019, The Astrophysical Journal, 871, L18, doi: 10.3847/2041-8213/aafc2d
- Cummings et al. (2018) Cummings, J. D., Kalirai, J. S., Tremblay, P.-E., Ramirez-Ruiz, E., & Choi, J. 2018, The Astrophysical Journal, 866, 21, doi: 10.3847/1538-4357/aadfd6
- Cummings et al. (2018) Cummings, J. D., Kalirai, J. S., Tremblay, P. E., Ramirez-Ruiz, E., & Choi, J. 2018, ApJ, 866, 21, doi: 10.3847/1538-4357/aadfd6
- Dotter (2016) Dotter, A. 2016, The Astrophysical Journal Supplement Series, 222, 8, doi: 10.3847/0067-0049/222/1/8
- Eriksson et al. (2014) Eriksson, K., Nowotny, W., Höfner, S., Aringer, B., & Wachter, A. 2014, Astronomy & Astrophysics, 566, A95, doi: 10.1051/0004-6361/201323241
- Frost & Lattanzio (1996) Frost, C. A., & Lattanzio, J. C. 1996, The Astrophysical Journal, 473, 383, doi: 10.1086/178152
- Fu et al. (2018) Fu, X., Bressan, A., Marigo, P., et al. 2018, Monthly Notices of the Royal Astronomical Society, 476, 496, doi: 10.1093/mnras/sty235
- Groenewegen & de Jong (1993) Groenewegen, M. A. T., & de Jong, T. 1993, A&A, 267, 410
- Herwig (2000) Herwig, F. 2000, A&A, 360, 952, doi: 10.48550/arXiv.astro-ph/0007139
- Herwig (2001) —. 2001, Ap&SS, 275, 15, doi: 10.48550/arXiv.astro-ph/9912353
- Herwig (2005) Herwig, F. 2005, Annual Review of Astronomy and Astrophysics, 43, 435, doi: 10.1146/annurev.astro.43.072103.150600
- Herwig (2005) Herwig, F. 2005, ARA&A, 43, 435, doi: 10.1146/annurev.astro.43.072103.150600
- Iglesias & Rogers (1996) Iglesias, C. A., & Rogers, F. J. 1996, ApJ, 464, 943, doi: 10.1086/177381
- Itoh et al. (2008) Itoh, N., Uchida, S., Sakamoto, Y., Kohyama, Y., & Nozawa, S. 2008, ApJ, 677, 495, doi: 10.1086/529367
- Izzard et al. (2004) Izzard, R. G., Tout, C. A., Karakas, A. I., & Pols, O. R. 2004, Monthly Notices of the Royal Astronomical Society, 350, 407, doi: 10.1111/j.1365-2966.2004.07446.x
- Kalirai et al. (2009) Kalirai, J. S., Davis, D. S., Richer, H. B., et al. 2009, The Astrophysical Journal, 705, 408, doi: 10.1088/0004-637X/705/1/408
- Kalirai et al. (2008) Kalirai, J. S., Hansen, B. M. S., Kelson, D. D., et al. 2008, The Astrophysical Journal, 676, 594, doi: 10.1086/527028
- Kalirai et al. (2014) Kalirai, J. S., Marigo, P., & Tremblay, P.-E. 2014, ApJ, 782, 17, doi: 10.1088/0004-637X/782/1/17
- Karakas & Lattanzio (2007) Karakas, A., & Lattanzio, J. C. 2007, Publications of the Astronomical Society of Australia, 24, 103, doi: 10.1071/AS07021
- Karakas (2003) Karakas, A. I. 2003, PhD thesis, Monash University
- Karakas (2014) —. 2014, Monthly Notices of the Royal Astronomical Society, 445, 347, doi: 10.1093/mnras/stu1727
- Karakas & Lattanzio (2014) Karakas, A. I., & Lattanzio, J. C. 2014, Publications of the Astronomical Society of Australia, 31, e030, doi: 10.1017/pasa.2014.21
- Komatsu et al. (2011) Komatsu, E., Smith, K. M., Dunkley, J., et al. 2011, ApJS, 192, 18, doi: 10.1088/0067-0049/192/2/18
- Lattanzio et al. (2017) Lattanzio, J. C., Tout, C. A., Neumerzhitckii, E. V., Karakas, A. I., & Lesa, P. 2017, Memorie della Società Astronomica Italiana, 4
- Lau et al. (2012) Lau, H. H. B., Gil-Pons, P., Doherty, C., & Lattanzio, J. 2012, Astronomy & Astrophysics, 542, A1, doi: 10.1051/0004-6361/201218826
- Marigo (2013) Marigo, P. 2013, in Binary Paths to Type Ia Supernovae Explosions, ed. R. Di Stefano, M. Orio, & M. Moe, Vol. 281, 36–43, doi: 10.1017/S1743921312014664
- Marigo (2022a) Marigo, P. 2022a, Universe, 8, 243, doi: 10.3390/universe8040243
- Marigo (2022b) —. 2022b, IAU Symposium, 366, 216, doi: 10.1017/S1743921322000497
- Marigo & Aringer (2009) Marigo, P., & Aringer, B. 2009, Astronomy & Astrophysics, 31
- Marigo et al. (2022) Marigo, P., Aringer, B., Girardi, L., & Bressan, A. 2022, ApJ, 940, 129, doi: 10.3847/1538-4357/ac9b40
- Marigo et al. (2013) Marigo, P., Bressan, A., Nanni, A., Girardi, L., & Pumo, M. L. 2013, Monthly Notices of the Royal Astronomical Society, 434, 488, doi: 10.1093/mnras/stt1034
- Marigo & Girardi (2007) Marigo, P., & Girardi, L. 2007, A&A, 469, 239, doi: 10.1051/0004-6361:20066772
- Marigo et al. (1999) Marigo, P., Girardi, L., & Bressan, A. 1999
- Marigo et al. (2020) Marigo, P., Cummings, J. D., Curtis, J. L., et al. 2020, Nature Astronomy, 4, 1102, doi: 10.1038/s41550-020-1132-1
- Marigo et al. (2021) Marigo, P., Bossini, D., Trabucchi, M., et al. 2021, arXiv:2111.03527 [astro-ph]. http://arxiv.org/abs/2111.03527
- Mattsson et al. (2010) Mattsson, L., Wahlin, R., & Höfner, S. 2010, Astronomy and Astrophysics, 509, A14, doi: 10.1051/0004-6361/200912084
- Miller Bertolami & Althaus (2006) Miller Bertolami, M. M., & Althaus, L. G. 2006, Astronomy and Astrophysics, 454, 845, doi: 10.1051/0004-6361:20054723
- Mowlavi (1999) Mowlavi, N. 1999, Astronomy & Astrophysics
- Nguyen et al. (2022) Nguyen, C. T., Costa, G., Girardi, L., et al. 2022, Astronomy and Astrophysics. http://arxiv.org/abs/2207.08642
- Pastorelli et al. (2019) Pastorelli, G., Marigo, P., Girardi, L., et al. 2019, MNRAS, 485, 5666, doi: 10.1093/mnras/stz725
- Pastorelli et al. (2020) —. 2020, MNRAS, 498, 3283, doi: 10.1093/mnras/staa2565
- Reimers (1975) Reimers, D. 1975, Memoires of the Societe Royale des Sciences de Liege, 8, 369. https://ui.adsabs.harvard.edu/abs/1975MSRSL...8..369R
- Salaris et al. (2009) Salaris, M., Serenelli, A., Weiss, A., & Miller Bertolami, M. 2009, The Astrophysical Journal, 692, 1013, doi: 10.1088/0004-637X/692/2/1013
- Saumon et al. (2022) Saumon, D., Blouin, S., & Tremblay, P.-E. 2022, Physics Reports, 988, 1, doi: 10.1016/j.physrep.2022.09.001
- Stancliffe et al. (2005) Stancliffe, R. J., Izzard, R. G., & Tout, C. A. 2005, Monthly Notices of the Royal Astronomical Society, 356, L1, doi: 10.1111/j.1745-3933.2005.08491.x
- Straniero et al. (1997) Straniero, O., Chieffi, A., Limongi, M., et al. 1997, The Astrophysical Journal, 478, 332, doi: 10.1086/303794
- Straniero et al. (2003) Straniero, O., Domínguez, I., Cristallo, S., & Gallino, R. 2003, Publications of the Astronomical Society of Australia, 20, 389, doi: 10.1071/AS03041
- Sweigart & Demarque (1973) Sweigart, A. V., & Demarque, P. 1973, 36, 221, doi: 10.1007/978-94-010-2590-4_32
- Tang et al. (2014) Tang, J., Bressan, A., Rosenfield, P., et al. 2014, Monthly Notices of the Royal Astronomical Society, 445, 4287, doi: 10.1093/mnras/stu2029
- Ventura et al. (2018) Ventura, P., Karakas, A., Dell’Agli, F., García-Hernández, D. A., & Guzman-Ramirez, L. 2018, Monthly Notices of the Royal Astronomical Society, doi: 10.1093/mnras/stx3338
- Wagenhuber & Weiss (1994) Wagenhuber, J., & Weiss, A. 1994, Astronomy and Astrophysics, 290, 807. https://ui.adsabs.harvard.edu/abs/1994A&A...290..807W
- Wagstaff et al. (2020) Wagstaff, G., Bertolami, M. M. M., & Weiß, A. 2020, Monthly Notices of the Royal Astronomical Society, 493, 4748, doi: 10.1093/mnras/staa362
- Weidemann (2000) Weidemann, V. 2000, Astronomy and Astrophysics, 363, 647. https://ui.adsabs.harvard.edu/abs/2000A&A...363..647W
- Weigert (1966) Weigert, A. 1966, Zeitschrift fur Astrophysik, 64, 395. https://ui.adsabs.harvard.edu/abs/1966ZA.....64..395W
- Weiss & Ferguson (2009) Weiss, A., & Ferguson, J. W. 2009, Astronomy and Astrophysics, 508, 1343, doi: 10.1051/0004-6361/200912043
- Werner & Herwig (2006) Werner, K., & Herwig, F. 2006, Publications of the Astronomical Society of the Pacific, 118, 183, doi: 10.1086/500443
- Werner & Rauch (2014) Werner, K., & Rauch, T. 2014, Astronomy & Astrophysics, 569, A99, doi: 10.1051/0004-6361/201424051
- Werner et al. (2016) Werner, K., Rauch, T., & Kruk, J. W. 2016, Astronomy & Astrophysics, 593, A104, doi: 10.1051/0004-6361/201628892
- Williams et al. (2004) Williams, K. A., Bolte, M., & Koester, D. 2004, ApJ, 615, L49, doi: 10.1086/425995
- Williams et al. (2009) —. 2009, ApJ, 693, 355, doi: 10.1088/0004-637X/693/1/355
- Winters et al. (2000) Winters, J. M., Bertre, T. L., Jeong, K. S., Helling, C., & Sedlmayr, E. 2000, Astronomy & Astrophysics
- Wood & Faulkner (1986) Wood, P. R., & Faulkner, D. J. 1986, The Astrophysical Journal, 307, 659, doi: 10.1086/164451