Mechanical constraints and cell cycle regulation in models of
collective cell migration
1Mathematical Institute, University of Oxford, OX2 6GG Oxford, United Kingdom
2Department of Mechanical and Aerospace Engineering, Princeton University, Princeton, NJ, 08544, USA
3Department of Chemical and Biological Engineering, Princeton University, Princeton, NJ, 08544, USA
∗Correspondence: falcoigandia@maths.ox.ac.uk
The spatiotemporal coordination and regulation of cell proliferation is fundamental in many aspects of development and tissue maintenance. Cells have the ability to adapt their division rates in response to mechanical checkpoints, yet we do not fully understand how cell proliferation regulation impacts cell migration phenomena. Here, we present a minimal continuum model of cell migration with cell cycle dynamics, which includes mechanical constraints and hence can account for cell proliferation regulation. By combining minimal mathematical modelling, Bayesian inference, and recent experimental data, we quantify the impact of mechanical constraints across different cell cycle stages in epithelial tissue expansion experiments. Our model suggests that cells sense local density and adapt cell cycle progression in response, during G1 and the combined S/G2/M phases, providing an explicit relationship between each cell cycle stage duration and local tissue density, which is consistent with several experimental observations. Finally, we compare our mathematical model predictions to different experiments studying cell cycle regulation and present a quantitative analysis on the impact of mechanical constraints on cell migration patterns. Our work presents a systematic approach for investigating and analysing cell cycle data, providing mechanistic insights into how individual cells regulate proliferation, based on population-based experimental measurements.
Introduction
The coordination of cell proliferation across space and time is crucial for the emergence of collective cell migration, which plays a fundamental role in development, including tissue formation and morphogenesis, and also at later stages for tissue regeneration and homeostasis. Cells adapt their division rates in response to mechanical constraints within tissues [1, 2], allowing cell populations to self-organise and eventually form and maintain tissues and complex structures. Moreover, disruptions in the control of cell proliferation often result in tumour formation [3, 4, 5]. Although significant experimental efforts have been devoted to understand the mechanical regulation of cell proliferation [6] and its interplay with collective cell migration, existing mathematical models have failed to describe these constraints and how they affect cell cycle progression [7, 8, 9].
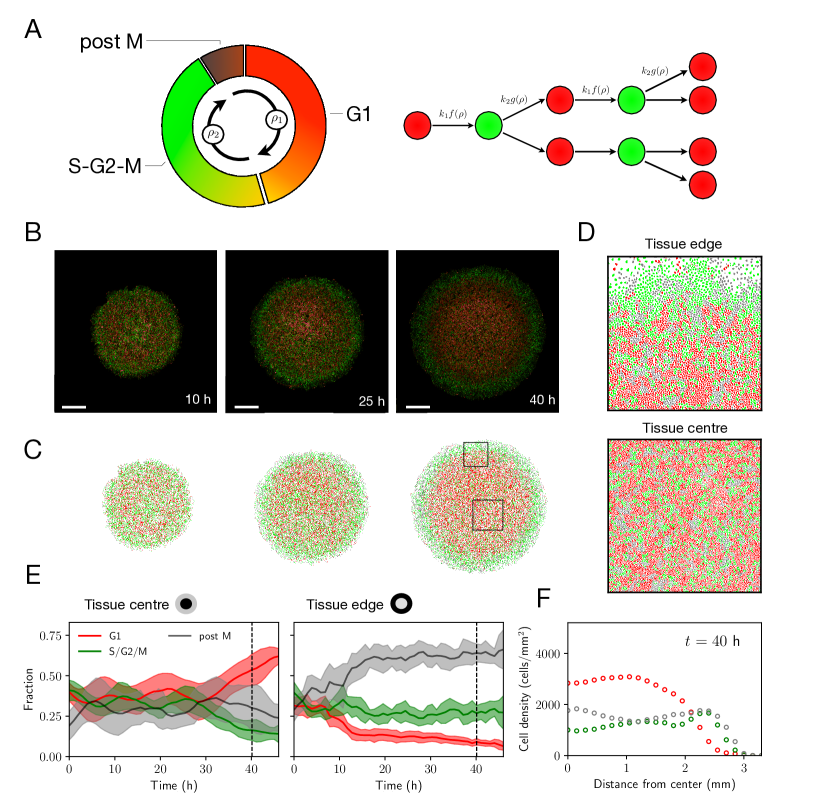
In order to understand cell proliferation regulation, numerous studies have explored how spatial and mechanical constraints within tissues affect different stages of the cell cycle. The experimental visualisation of cell cycle stages can be achieved via the widely used FUCCI cell-cycle marker [10], which consists of red and green fluorescent proteins that are fused to proteins Cdt1 and Geminin, respectively. Cdt1 exhibits elevated levels during the G0/G1 phase and decreased levels throughout the remaining cell cycle stages, whereas Geminin shows high expression during the S, G2, and M phases; allowing thus to distinguish between these different stages — see Fig. 1. Several extensions of the FUCCI system exist now [11]; for instance FUCCI4 allows for the simultaneous visualisation of the G1, S, G2, and M phases [12].
Experimental studies of cell migration are often performed in epithelia due to their strong cell-cell adhesion which gives rise to collective and cohesive motion. Moreover, they play a fundamental role in multicellular organisms as they serve as protective layers for various body surfaces and organs. Within epithelial tissues, quiescent cells in G0 can re-enter the cell cycle following tissue stretching or wounding [2, 13]. In particular, the work of Streichan et al. [2] reveals a mechanical checkpoint at the G1-S boundary, which prevents cells from entering S phase and starting DNA replication if there is no physical space to divide. Moreover, mechanical tension across an epithelial tissue does not only trigger cell cycle reactivation but can also lead to oriented cell division [14].
The extracellular regulation of switches from G0 and G1, and within substages of G1 has been well-known for many years [15]. However, and contrary to initial assumptions, cells also have the ability to regulate progression through stages of the cell cycle following the G1-S transition in response to external cues. These external signals might involve not only mechanical forces [16], but also nutrients and growth factors [17, 18]. In epithelia, this question was explored recently by Donker et al. [19], revealing a mechanical checkpoint in G2 which controls cell division in epithelia. In particular, this checkpoint allows cells to regulate progression through G2, via sensing of local density, explaining why dense regions in epithelia contain groups of cells that are temporarily halted in G2.
Experimental studies employing FUCCI and variations of it have thus successfully linked mechanical constraints to cell cycle progression. These studies have employed qualitative analysis, direct measurements of cell cycle stage durations [19], or metrics associated with cell cycle progression, such as cell area [2], and Geminin/Cdt1 or EdU signals [21, 22]. However, these approaches omit a quantitative comparison between model and data, hence limiting the depth of mechanistic insights that can be derived.
Here, we present a quantitative investigation into the mechanical regulation of cell cycle progression. First, we construct a mathematical model of cell cycle dynamics that accurately captures the impact of mechanical checkpoints. By combining minimal mathematical modelling, Bayesian inference, and recent experimental data [20], we provide further evidence, consistent with previous experimental studies [2, 19], that mechanical constraints operate throughout the cell cycle and together serve as a regulating mechanism for the growth of epithelial tissues. Our work thus constitutes a systematic approach towards the quantification of density-dependent effects regulating cell cycle progression. Moreover, the obtained parameter estimates reveal an explicit relation between the duration of different cell cycle stages and tissue density, which is consistent with the experimental measurements of Donker et al. [19].
Results
Mathematical models of cell cycle dynamics
We build on the model proposed by Vittadello et al. [7] to describe two cell populations, and , in different stages of the cell cycle. We represent by the density of cells that are in G0/G1, while gives the density of cells in the S/G2/M phases of the cell cycle — see Fig. 1. In the model, cell motility is described via linear diffusion, with a diffusion constant for both cell populations [23]. In order to effectively capture density-dependent effects controlling cell cycle progression, we assume that the transitions between different cell cycle stages are regulated by two crowding functions, and , which depend on the total cell density . In particular, the transition rate from G1 to S is given by , while the division rate (from S/G2/M to G1) is given by , where are intrinsic rates of cell cycle progression. With this, the model reads
| (1) |
where the factor of two in the equation for represents cell division into two daughter cells. These equations are solved first in polar coordinates (assuming radial symmetry in two spatial dimensions) to describe epithelial tissue expansion experiments, and then in one spatial dimension to study travelling wave behaviour, and the impact of mechanical checkpoints on cell migration.
In order to accurately capture mechanical constraints regulating cell cycle progression, we assume that and are non-increasing functions of the total density . Again, this is motivated by the experimental observations of Streichan et al. [2] and Donker et al. [19]. Furthermore, we assume , so that and represent density-independent transition rates. Note that setting gives rise to an exponential growth model (i.e. no mechanical constraints). On the other hand, choosing and we recover the Vittadello et al. model [7]. Here, we seek a minimal model of cell cycle dynamics and assume that and decrease linearly with the total cell density so that
| (2) |
where are constants controlling the duration of G1 and the S/G2/M phases, respectively, and . The specific form of these crowding functions is chosen here for simplicity, although other functions sharing the same properties show similar qualitative behaviour.
We follow a Bayesian approach [24, 8, 25, 26] to calibrate the model given in Eqs. (1). In particular, given experimental measurements of the cell densities for , and a vector of model parameters , we estimate the posterior probability distribution , which gives the probability density for the model parameters taking specific values. The posterior distribution, thus, can be used to quantify the uncertainty associated to specific parameter values, given the experimental observation. We refer the reader to the Supplementary Information for more details on Bayesian inference.
Tissue expansion experiments
We compare our model predictions to the experiments performed by Heinrich et al. [20] studying the expansion and growth dynamics of a single circular epithelial tissue — see Fig. 1B. In these experiments, MDCK cells expressing the FUCCI markers are cultured in a silicone stencil for 18 hours and, after stencil removal, the cell population is allowed to freely expand for 46 hours. Given that the cell cycle duration for MDCK cells is around 16 hours, this enables each cell to potentially undergo 2-3 cell divisions during the experiment. Local densities are then quantified by segmenting the fluorescence images in ImageJ and by counting the number of nucleus centroids — Fig. 1C. Note that post-mitotic cells do not fluoresce and appear dark, which makes the FUCCI system unreliable for cell counting. To quantify the density of post-mitotic cells, Heinrich et al. used a convolutional neural network to identify nuclei from phase contrast images [27] — see [20] for more details. Moreover, and in line with previous work [25], the model takes as initial condition the quantified density profile after the first ten hours of the experiment, so that the impact of stencil removal on the dynamics is reduced. Note that after this time, cell densities near the tissue centre are relatively high ( cells/mm2) and a fraction of cells in this region are likely to be found in a quiescent state due to contact inhibition of locomotion and proliferation [28].
The experiments by Heinrich et al. [20] reveal a higher density of cells in G0/G1 at the centre of the tissue, where the total cell density is also higher — see Fig. 1D-E. The tissue edge, in contrast, is characterised by a larger number of cells which are preparing to divide (green) or are directly post-mitotic (gray). This agrees with previous observations of epithelial cells, which are known to control progression from G1 to S in response to spatial constraints [2]. Note, however, that the density of cells in S/G2/M in the tissue centre is low but non-zero, even at later times in the experiment — see Fig. 1D-F — as observed also by Donker et al. [19].
For the sake of simplicity, here we consider post-mitotic cells (gray in Fig. 1) and cells in G1, as one single cell population. Quantifying post-mitotic cell density is crucial in order to estimate both and in Eqs. (2), given that these parameters are measures of contact inhibition of proliferation, typically associated to regions of higher cell density [29].
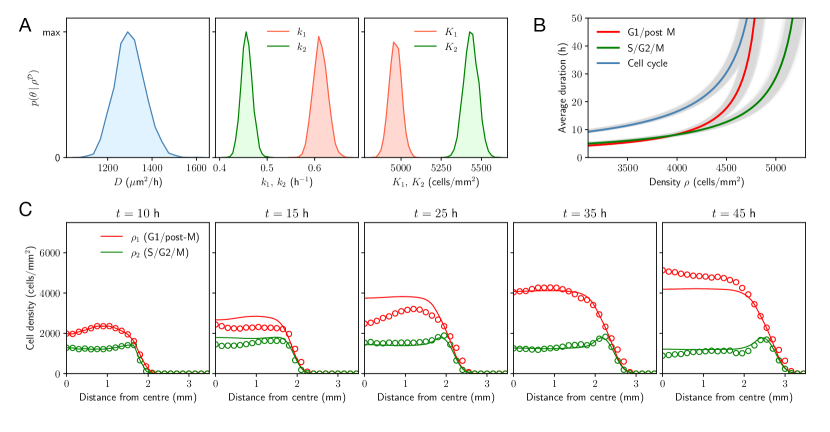
We show the univariate marginal posterior distributions corresponding to the model parameters in Fig. 2A, confirming that all model parameters are practically identifiable. In particular, all marginal posteriors show well-defined and unimodal distributions, with a relatively narrow variance. For plots of the MCMC iterations we refer to the Supplementary Information (Supplementary Fig. 1).
The posterior distributions in Fig. 2A are not only useful to inform further model predictions, but also give insights into the fundamental mechanisms underlying cell proliferation. In particular, given the intrinsic transition rate from G1 to S, , and the constant in Eqs. (2), we can estimate the average duration of the combined G1/post-M phase, for a given fixed density , as . Analogously, the estimated average duration of the S/G2/M phases is given by . In Fig. 2B we plot these timescales as a function of the density , observing how the duration of the different cell cycle stages increases with density. These results confirm again, in line with previous experimental measurements [2, 19], that cell cycle dynamics are tightly regulated by mechanical constraints. In particular, these estimates are consistent with the experimental measurements of Donker et al. [19] – taking into account that the initial cell densities in our datasets are around cells/mm2.
In Fig. 2C we show numerical solutions of our model (Eqs. (1) and (2)), taking the posterior modes as parameter values. These confirm that the model can describe cell cycle dynamics inside expanding epithelial tissues. Notably, the model captures the tissue expansion speed, as well as the S/G2/M density peak near the edge of the tissue, which results from density-dependent effects regulating the cell cycle. We also note that this type of density profile is possible in the model when mechanical constraints are stronger in the early stages of the cell cycle (G1/post-M) and weaker in the latter ones (S/G2/M). In terms of Eqs. (2) this requires having , which is correctly identified from the data.
We observe that the model overestimates the experimental density for early times of the experiment and as a result of the model fit, underestimates it at later times. This is likely due to the transient behaviour that cells exhibit immediately after stencil removal [30, 31], which could have an impact on cell behaviour even after the first ten hours of the expansion, as suggested also in previous studies [25]. However, we emphasise that tissue edge motion can be well described by the model.
A similar behaviour is reported when the model is compared to a second set of experiments performed by Heinrich et al. [20]. In this case, we use the obtained parameter estimates to describe the expansion of initially smaller epithelial monolayers (initial diameter mm). We highlight that the mathematical model can capture the expansion dynamics near the tissue edge as well as the expansion speed (see Supplementary Fig. 2), even though, model parameters were inferred from the large tissue expansions.
Tissue colonisation experiments
Our model, together with the experiments of Heinrich et al., reveals the intrinsic connection between cell cycle progression and mechanical constraints, showcasing how this interplay can give rise to coordinated spatiotemporal patterns of cell proliferation in growing tissues. Next, we show how the model can be used to study and describe similar patterns observed in several other experimental studies using FUCCI and variants of it.
Streichan et al. [2] show, using a tissue barrier assay, how the cell cycle can be reactivated by allowing cells to migrate and colonise free space – see Fig. 3A. These experiments are initialised by growing fully polarised MDCK-2 cells expressing the FUCCI markers within a removable barrier. After barrier removal, the tissue quickly colonises the available space, and cells behind the barrier, which were initially in G0/G1, reactivated their cycle by entering S phase. On the other hand, cells located further behind the barrier remained at high density and did not progress through the cell cycle.
By solving numerically Eqs. (1) on a one-dimensional domain, we immediately observe how a model accounting for mechanical regulation predicts similar behaviour to that observed experimentally222Note that the experimental images from Streichan et al. [2] do not show post-mitotic cells which appear dark in the FUCCI system, and that the total cell density (including post-mitotic cells) was used to estimate the parameters in the model.. In particular, and as inferred from the experimental data of Heinrich et al., the calibrated model predicts that mechanical constraints have a greater impact at the G1-S transition, compared to the S/G2/M phases. In terms of the model and the choice of crowding functions (Eqs. (2)), this once again requires .
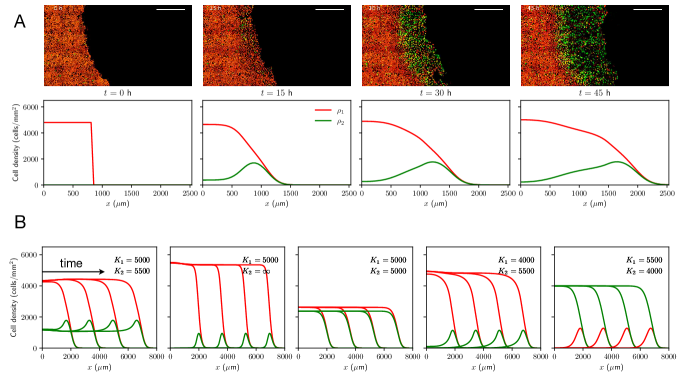
Mechanical constraints and cell migration
Given that assuming seems necessary in order to obtain biologically realistic model predictions, what role do mechanical constraints play in shaping cell migration patterns? We explore this question by varying the values of and in Eqs. (2) – Fig. 3B. First, we observe that a nonzero density of G2 cells in the tissue centre (where the cell density is high [19]) requires . This relationship also results in a distinctive peak in the G2/S/M cell density, concentrated near the tissue edge. However, this phenomenon is lost when . On the other hand, when we assume a higher influence of density during G2/S/M relative to G1/post-M (), we observe that the tissue centre shows a higher fraction of cells in S/G2/M, in contrast with previously reported observation of contact inhibition of proliferation [28].
The numerical solutions in Fig. 3B suggest that low-density initial conditions lead to travelling wave solutions in one spatial dimension: , , with being the wave speed, and denoting the spatial coordinate. Standard arguments – see Supplementary Information – predict the existence of a minimum travelling wave speed in terms of only three model parameters
| (3) |
Interestingly, this suggests that the invasion speed is independent of cell cycle mechanical regulation, and only depends on cell motility (), and the intrinsic, density-independent growth rates ( and ). However, we highlight that, as shown in the figure, mechanical constraints do play an important role in shaping collective migration patterns.
The expression for the minimum travelling wave speed facilitates a comparison between the two-stage model proposed here (Eqs. (1)), and conventional single-population models of collective cell migration of the form
The intrinsic growth rate of the population, , is related to the intrinsic rates of cell cycle progression, and , via . When , Eq. (3) can be approximated by
which agrees with the prediction of the well-known Fisher– Kolmogorov–Petrovsky–Piskunov (FKPP) equation ( for a maximum cellular density ) in one spatial dimension. Using the estimated parameter values we obtain , and in this case, Eq. (3) predicts a minimum travelling wave speed of mh, while the FKPP approximation yields mh; both of them within the measured values by Heinrich et al. [20].
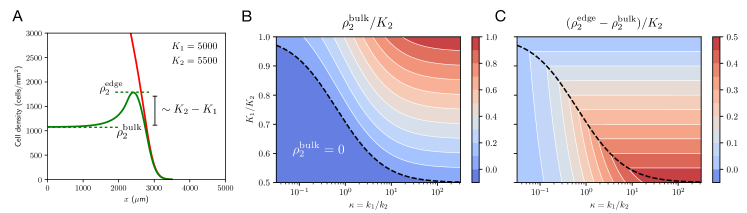
More generally, we noted that does not depend on the choice of crowding functions and ; however, mechanical constraints have an impact on the observed migration patterns (Fig. 3B). To understand how growth and cell cycle regulation lead to the patterns observed experimentally, we investigate travelling wave solutions in a simplified version of our model, utilising the same parameters as in Eqs. (1) and (2) (see Supplementary Information). In particular, we set , and , where denotes the Heaviside function. This reduced model does not accurately approximate the model presented in Eqs. (1) and (2), but nonetheless it captures the same qualitative behaviour, and hence we expect that the relevant phenomena show similar dependence with respect to model parameters (see Supplementary Fig. 3). The analysis of travelling wave solutions for this simpler model suggests that the density of S/G2/M cells in the tissue bulk, , only depends on the ratio of cell cycle progression rates, , and on the ratio of densities associated to mechanical checkpoints, , (Fig. 4). In particular, we obtain
where . A similar dependence with respect to the model parameters is observed numerically for the model given by Eqs. (1) and (2) (Supplementary Fig. 3). For our estimated parameters, the expression above predicts , which is consistent with experimental observations. We also highlight that, as long as , and and are of similar order of magnitude, this expression predicts that the number of cells in S/G2/M in the tissue bulk will be small in comparison to the number of cells in G1/post-M (Fig. 4B). In particular, note that as .
Interestingly, the travelling wave analysis also reveals that, when , the difference in S/G2/M cell density between the tissue bulk, , and the tissue edge, , depends only on the difference between the checkpoint densities associated to the G1-S and G2-M boundaries (Fig. 4C),
where
For our estimated parameters, we obtain cellsmm2, again consistent with the experimental observations. These analytical expressions confirm the impact of mechanical constraints on cell migration, and suggest that cell proliferation patterns originate from differences in the mechanical regulation of cell cycle stages.
Mechanical constraints and experimental design
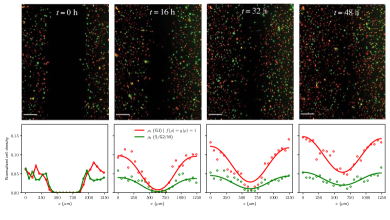
We have demonstrated that our model can be calibrated to experimental data collected by Heinrich et al. [20] to provide confident estimates of all parameters and, from there, used to extract and quantify the mechanical constraints on the cell cycle. An obvious question to ask is whether the model parameters could also be confidently estimated from other datasets, in particular where the cell density remains much lower and the impact of mechanical constraints is reduced. To explore this question, we attempt to estimate the model parameters (including and ) using data from a low-density scratch assay with 1205Lu melanoma cells — see Fig. 5. In this experiment, tissues are seeded at an initial density of cellsmm2 ( of the theoretical maximum packing density [7]), and data is collected every 16 hours, over two full days, allowing cells to potentially undergo 1-2 cell cycles. The posterior distributions obtained for the different model parameters reveal estimates for , and that are consistent with previous studies [8]. However, the low experimental densities do not allow for the quantification of mechanical effects — the parameters and cannot be estimated with any degree of confidence (see Supplementary Fig. 4). This non-identifiability of and suggests the use of a simpler model, which assumes that cell cycle progression is independent of density-dependent effects () and hence is only valid in the low-density regime. Indeed, when calibrated to data from the low-density scratch assay it provides accurate parameters estimates (Supplementary Fig. 5), and an excellent agreement with the experimental data — see Fig. 5. This result clearly illustrates both the key role that mathematical modeling can play in the experimental design process, and the importance of considering parameter identifiability in the process of model construction.
Discussion
In this work, we have presented a new mathematical model of cell migration with cell cycle dynamics which captures and quantifies mechanical constraints regulating cell cycle progression. In line with previous experimental studies, by combining minimal modelling and Bayesian inference, we confirm that cell cycle progression is monitored via mechanical checkpoints [2, 19], and present a systematic approach towards the quantification of interactions regulating cell proliferation. Our model is capable of quantifying cell cycle data from experiments using the FUCCI system, and allows to extract mechanistic insights into how individual cells regulate proliferation based on population-level measures.
Generalisations of the FUCCI system, which allow for a more detailed experimental visualisation of the different cell cycle stages, offer possible avenues of future research using the approach presented here. In particular, fluorescence marker systems such as FUCCI4 [12] allow for the simultaneous visualisation of the four stages of the cell cycle. In line with these methodologies, extensions of our model (Eqs. (1)) to multi-stage cell populations are straightforward, and could enable a more exhaustive explanation of the role of spatial constraints across all four cell cycle stages [19].
In the case of Heinrich et al.’s experiments [20], the excellent imaging quality allowed us to perform an accurate quantification of the cellular density profiles. This, in turn, facilitated model development and the subsequent inference of model parameters from the data, with the estimated parameters showing a low uncertainty. While the parameter identifiability of such mathematical models can be evaluated a priori under the assumption of infinite ideal data [32, 33], biologically realistic datasets are finite, and often contain a significant level of noise, which can, in certain instances, constrain the ability to confidently estimate model parameters. More generally, and as we have illustrated, practical constraints in the experimental data often relate to the level of model complexity which can be inferred from experiments and the confidence in model parameter estimates.
While we assumed a simplistic noise model to perform the parameter inference, model misspecification and the temporal resolution of the measured data are likely to introduce correlations between residuals [34]. In particular, some degree of correlation might be expected given the model parameters are very well-determined with a relatively small variance (Fig. 2). More recently, a binomial measurement error model has been suggested in order to mitigate some of the inconsistencies of the white noise assumption [35]. Other commonly used error models assume different forms of multiplicative noise, which preserve the positivity of the data [36, 37]. A more comprehensive study of the error model is left as a subject for future investigation.
Continuum models are a widely adopted approach for describing cell migration. However, these models come with limitations: they tend to neglect local structure, especially in situations involving multiple cell populations. Such local structure can be observed in Fig. 1; (C) and (D) show some degree of local correlation in the cell phases, however this phenomenon is lost when averaging radially to obtain the density profiles in (E). Agent-based models [22, 38] can help mitigate some of these issues, by providing more understanding of the generation and maintenance of spatial structure, but at the cost of increased computational times for simulation and inference, additional model parameters, and limited analytical tractability. We emphasise, however, that cell cycle dynamics appear to be globally desynchronised, as observed in previous studies [39], and so our differential equation-based model remains appropriate for this study, where the data is generated by averaging over a number of experimental replicates.
The model presented here is minimal in the sense that it assumes that cell movement is random. While local cell density is likely to have an impact on cell motility [20], previous work shows that for individual expanding epithelial tissues, the linear diffusion approximation is reasonable [25]. Note, however, that it is important to account for population pressure and its impact on cell movement when considering tissue-tissue interactions [40]. Moreover, the model given in Eqs. (1) assumes that at low densities, the duration of each of the cell cycle stages follows an exponential distribution. While this assumption contradicts experimental observations [41, 42] and can be mitigated by representing the cell cycle as a multi-stage process [43, 9], such models break the cell cycle into a very large number of stages, limiting the potential for calibration to experimental data. Additional investigation is required to understand the extent to which more complicated models can provide further insights into how cells coordinate proliferation and migration to give rise to complex collective behaviours. For example, in the context of the cell cycle an option is to explicitly incorporate cell cycle stage via the use of an age-structured model [44] that includes mechanical regulation. Our results indicate that adopting a quantitative approach [45], that carefully examines quantitative data through the lens of mathematical modelling and Bayesian inference, can help provide answers to this question.
Acknowledgments
The authors would like to thank I. Breinyn for assistance with the experimental datasets. CF acknowledges support via a fellowship from "la Caixa" Foundation (ID 100010434) with code LCF/BQ/EU21/11890128. JAC was supported by the Advanced Grant Nonlocal-CPD (Nonlocal PDEs for Complex Particle Dynamics: Phase Transitions, Patterns and Synchronization) of the European Research Council Executive Agency (ERC) under the European Union’s Horizon 2020 research and innovation programme (grant agreement No. 883363). JAC was also partially supported by EPSRC grants EP/T022132/1 and EP/V051121/1. REB and DJC would like to thank the Royal Society for an International Exchange Scheme grant. This work was also supported by a grant from the Simons Foundation (MP-SIP-00001828, REB).
Data and Code Availability
Code to solve the model and to perform the parameter estimation is available on Github: https://github.com/carlesfalco/InferenceCellCyclePDE. Data used to calibrate the model can also be found on Github and in [20]. Scratch assay data is taken from [8].
References
- [1] P. Jorgensen and M. Tyers. How cells coordinate growth and division. Current Biology, 14(23):R1014–R1027, 2004.
- [2] S. J. Streichan, C. R. Hoerner, T. Schneidt, D. Holzer, and L. Hufnagel. Spatial constraints control cell proliferation in tissues. Proceedings of the National Academy of Sciences, 111(15):5586–5591, 2014.
- [3] J. Massagué. G1 cell-cycle control and cancer. Nature, 432(7015):298–306, 2004.
- [4] A. I. McClatchey and A. S. Yap. Contact inhibition (of proliferation) redux. Current Opinion in Cell Biology, 24(5):685–694, 2012.
- [5] T. Otto and P. Sicinski. Cell cycle proteins as promising targets in cancer therapy. Nature Reviews Cancer, 17(2):93–115, 2017.
- [6] V. K. Gupta and O. Chaudhuri. Mechanical regulation of cell-cycle progression and division. Trends in Cell Biology, 32(9):773–785, 2022.
- [7] S. T. Vittadello, S. W. McCue, G. Gunasingh, N. K. Haass, and M. J. Simpson. Mathematical models for cell migration with real-time cell cycle dynamics. Biophysical Journal, 114(5):1241–1253, 2018.
- [8] M. J. Simpson, R. E. Baker, S. T. Vittadello, and O. J. Maclaren. Practical parameter identifiability for spatio-temporal models of cell invasion. Journal of the Royal Society Interface, 17(164):20200055, 2020.
- [9] E. Gavagnin, M. J. Ford, R. L. Mort, T. Rogers, and C. A. Yates. The invasion speed of cell migration models with realistic cell cycle time distributions. Journal of Theoretical Biology, 481:91–99, 2019.
- [10] A. Sakaue-Sawano, H. Kurokawa, T. Morimura, A. Hanyu, H. Hama, H. Osawa, S. Kashiwagi, K. Fukami, T. Miyata, H. Miyoshi, et al. Visualizing spatiotemporal dynamics of multicellular cell-cycle progression. Cell, 132(3):487–498, 2008.
- [11] D. A. Ridenour, M. C. McKinney, C. M. Bailey, and P. M. Kulesa. Cycletrak: a novel system for the semi-automated analysis of cell cycle dynamics. Developmental Biology, 365(1):189–195, 2012.
- [12] B. T. Bajar, A. J. Lam, R. K. Badiee, Y.-H. Oh, J. Chu, X. X. Zhou, N. Kim, B. B. Kim, M. Chung, A. L. Yablonovitch, et al. Fluorescent indicators for simultaneous reporting of all four cell cycle phases. Nature Methods, 13(12):993–996, 2016.
- [13] L. Bornes, R. Windoffer, R. E. Leube, J. Morgner, and J. van Rheenen. Scratch-induced partial skin wounds re-epithelialize by sheets of independently migrating keratinocytes. Life Science Alliance, 4(1):e202000765, 2021.
- [14] K. C. Hart, J. Tan, K. A. Siemers, J. Y. Sim, B. L. Pruitt, W. J. Nelson, and M. Gloerich. E-cadherin and lgn align epithelial cell divisions with tissue tension independently of cell shape. Proceedings of the National Academy of Sciences, 114(29):E5845–E5853, 2017.
- [15] A. B. Pardee. G1 events and regulation of cell proliferation. Science, 246(4930):603–608, 1989.
- [16] B. G. Godard and C.-P. Heisenberg. Cell division and tissue mechanics. Current Opinion in Cell Biology, 60:114–120, 2019.
- [17] C. R. McKeown and H. T. Cline. Nutrient restriction causes reversible G2 arrest in Xenopus neural progenitors. Development, 146(20):dev178871, 2019.
- [18] G. L. Celora, S. B. Bader, E. M. Hammond, P. K. Maini, J. M. Pitt-Francis, and H. M. Byrne. A DNA-structured mathematical model of cell-cycle progression in cyclic hypoxia. Journal of Theoretical Biology, 545:111104, 2022.
- [19] L. Donker, R. Houtekamer, M. Vliem, F. Sipieter, H. Canever, M. Gómez-González, M. Bosch-Padrós, W.-J. Pannekoek, X. Trepat, N. Borghi, and M. Gloerich. A mechanical G2 checkpoint controls epithelial cell division through E-cadherin-mediated regulation of Wee1-Cdk1. Cell Reports, 41(2):111475, 2022.
- [20] M. A. Heinrich, R. Alert, J. M. LaChance, T. J. Zajdel, A. Košmrlj, and D. J. Cohen. Size-dependent patterns of cell proliferation and migration in freely-expanding epithelia. eLife, 9:e58945, 2020.
- [21] K. Suh, Y. K. Cho, I. B. Breinyn, and D. J. Cohen. E-cadherin biointerfaces reprogram collective cell migration and cell cycling by forcing homeostatic conditions. bioRxiv 2023.07.25.550505, 2023.
- [22] K. Höllring, L. Nuić, L. Rogić, S. Kaliman, S. Gehrer, C. Wollnik, F. Rehfeldt, M. Hubert, and A.-S. Smith. Capturing the mechanosensitivity of cell proliferation in models of epithelium. bioRxiv 2023.01.31.526438, 2023.
- [23] S. T. Vittadello, S. W. McCue, G. Gunasingh, N. K. Haass, and M. J. Simpson. Examining go-or-grow using fluorescent cell-cycle indicators and cell-cycle-inhibiting drugs. Biophysical Journal, 118(6):1243–1247, 2020.
- [24] K. E. Hines, T. R. Middendorf, and R. W. Aldrich. Determination of parameter identifiability in nonlinear biophysical models: A Bayesian approach. The Journal of General Physiology, 143(3):401–416, 2014.
- [25] C. Falcó, D. J. Cohen, J. A. Carrillo, and R. E. Baker. Quantifying tissue growth, shape and collision via continuum models and Bayesian inference. Journal of the Royal Society Interface, 20(204):20230184, 2023.
- [26] Y. Schälte, F. Fröhlich, P. J. Jost, J. Vanhoefer, D. Pathirana, P. Stapor, P. Lakrisenko, D. Wang, E. Raimúndez, S. Merkt, L. Schmiester, P. Städter, S. Grein, E. Dudkin, D. Doresic, D. Weindl, and J. Hasenauer. pyPESTO: a modular and scalable tool for parameter estimation for dynamic models. Bioinformatics, 39(11):btad711, 2023.
- [27] J. LaChance and D. J. Cohen. Practical fluorescence reconstruction microscopy for large samples and low-magnification imaging. PLoS Computational Biology, 16(12):e1008443, 2020.
- [28] A. Puliafito, L. Hufnagel, P. Neveu, S. Streichan, A. Sigal, D. K. Fygenson, and B. I. Shraiman. Collective and single cell behavior in epithelial contact inhibition. Proceedings of the National Academy of Sciences, 109(3):739–744, 2012.
- [29] D. J. Warne, R. E. Baker, and M. J. Simpson. Optimal quantification of contact inhibition in cell populations. Biophysical Journal, 113(9):1920–1924, 2017.
- [30] W. Jin, E. T. Shah, C. J. Penington, S. W. McCue, L. K. Chopin, and M. J. Simpson. Reproducibility of scratch assays is affected by the initial degree of confluence: Experiments, modelling and model selection. Journal of Theoretical Biology, 390:136–145, 2016.
- [31] W. Jin, E. T. Shah, C. J. Penington, S. W. McCue, P. K. Maini, and M. J. Simpson. Logistic proliferation of cells in scratch assays is delayed. Bulletin of Mathematical Biology, 79(5):1028–1050, 2017.
- [32] M. Renardy, D. Kirschner, and M. Eisenberg. Structural identifiability analysis of age-structured PDE epidemic models. Journal of Mathematical Biology, 84(1):1–30, 2022.
- [33] A. P. Browning, M. Ta\cbscă, C. Falcó, and R. E. Baker. Structural identifiability analysis of linear reaction-advection-diffusion processes in mathematical biology. arXiv preprint arXiv:2309.15326, 2023.
- [34] B. Lambert, C. L. Lei, M. Robinson, M. Clerx, R. Creswell, S. Ghosh, S. Tavener, and D. J. Gavaghan. Autocorrelated measurement processes and inference for ordinary differential equation models of biological systems. Journal of the Royal Society Interface, 20(199):20220725, 2023.
- [35] M. J. Simpson, R. J. Murphy, and O. J. Maclaren. Modelling count data with partial differential equation models in biology. bioRxiv 2023.09.09.556963, 2023.
- [36] S. Schönfeld, A. Ozkan, L. Scarabosio, M. N. Rylander, and C. Kuttler. Environmental stress level to model tumor cell growth and survival. Mathematical Biosciences and Engineering, 19(6):5509–5545, 2022.
- [37] S. Schönfeld, L. Scarabosio, A. Ozkan, M. N. Rylander, and C. Kuttler. Using systemic modeling and Bayesian calibration to investigate the role of the tumor microenvironment on chemoresistance. arXiv preprint arXiv:2310.19688, 2023.
- [38] J. J. Klowss, A. P. Browning, R. J. Murphy, E. J. Carr, M. J. Plank, G. Gunasingh, N. K. Haass, and M. J. Simpson. A stochastic mathematical model of 4d tumour spheroids with real-time fluorescent cell cycle labelling. Journal of the Royal Society Interface, 19(189):20210903, 2022.
- [39] C. M. Nowak, T. Quarton, and L. Bleris. Impact of variability in cell cycle periodicity on cell population dynamics. PLOS Computational Biology, 19(6):e1011080, 2023.
- [40] M. A. Heinrich, R. Alert, A. E. Wolf, A. Košmrlj, and D. J. Cohen. Self-assembly of tessellated tissue sheets by expansion and collision. Nature Communications, 13(1):1–10, 2022.
- [41] J. Smith and L. Martin. Do cells cycle? Proceedings of the National Academy of Sciences, 70(4):1263–1267, 1973.
- [42] T. S. Weber, I. Jaehnert, C. Schichor, M. Or-Guil, and J. Carneiro. Quantifying the length and variance of the eukaryotic cell cycle phases by a stochastic model and dual nucleoside pulse labelling. PLoS Computational Biology, 10(7):e1003616, 2014.
- [43] C. A. Yates, M. J. Ford, and R. L. Mort. A multi-stage representation of cell proliferation as a Markov process. Bulletin of Mathematical Biology, 79:2905–2928, 2017.
- [44] J. C. Kynaston, C. Guiver, and C. A. Yates. Equivalence framework for an age-structured multistage representation of the cell cycle. Physical Review E, 105(6):064411, 2022.
- [45] Y. Liu, K. Suh, P. K. Maini, D. J. Cohen, and R. E. Baker. Parameter identifiability and model selection for partial differential equation models of cell invasion. arXiv preprint arXiv:2309.01476, 2023.
See pages - of supplement.pdf