The Effect of Group Status on the Variability of Group Representations in LLM-generated Text
Abstract
Large Language Models (LLMs) have become pervasive in everyday life, yet their inner workings remain opaque. While scholarly efforts have demonstrated LLMs’ propensity to reproduce biases in their training data, they have primarily focused on the association of social groups with stereotypic attributes. In this paper, we extend this line of inquiry to investigate a bias akin to the social-psychological phenomenon where socially dominant groups are perceived to be less homogeneous than socially subordinate groups as it is reproduced by LLMs. We had ChatGPT, a state-of-the-art LLM, generate a diversity of texts about intersectional group identities and compared text homogeneity. We consistently find that LLMs portray African, Asian, and Hispanic Americans as more homogeneous than White Americans. They also portray women as more homogeneous than men, but these differences are small. Finally, we find that the effect of gender differs across racial/ethnic groups such that the effect of gender is consistent within African and Hispanic Americans but not within Asian and White Americans. We speculate possible sources of this bias in LLMs and posit that the bias has the potential to amplify biases in future LLM training and to reinforce stereotypes.
1 Introduction
Large Language Models (LLMs), which are machine learning models trained on large collections of text to generate human-like text, have experienced a surge in various facets of everyday life, including social media, customer service, content creation, and education, among many others. Despite their rise in prominence, the inner workings of LLMs remain opaque to outside observers. For example OpenAI’s most recent LLM, GPT-4, withholds information about its architecture, hardware, training compute, dataset construction, and training methods from the public (OpenAI, 2023). Similarly, the source and content of most training data for LaMDA are unknown (Thoppilan et al., 2022).
Despite the opacity surrounding the inner workings of LLMs, there are compelling reasons to suspect that LLMs will exhibit human-like biases. A substantial body of scholarly work has shown that LLMs reproduce different types of biases inherent in the data in which they are trained. For example, Lucy and Bamman (2021) showed that texts written by GPT-3 exhibit gender stereotypes, associating feminine characters with family and body parts and masculine characters with politics, war, and crime. Furthermore, Abid et al. (2021) showed that GPT-3 reproduces religious stereotypes, associating Muslims with violence. These studies not only underscore the potential harms of LLMs, particularly those related to perpetuation of societal stereotypes, but also prompt us to question whether LLMs reproduce other types of human-like biases.
In this paper, we examine whether LLMs manifest a type of bias related to the perceived variability of socially subordinate and dominant groups. In the field of social psychology, studies have looked at the effect that social status has on perceptions of group variability. They found consistent evidence indicating that members of both the socially dominant and socially subordinate group tend to perceive members of the socially subordinate group as more homogeneous compared to members of the socially dominant group (Guinote et al., 2002; Fiske, 1993; Fiske and Dépret, 1996; Lorenzi-Cioldi, 1993, 1998). This is related to a more general phenomenon known as the out-group homogeneity effect, where individuals perceive in-group members as less homogeneous than out-group members (Linville and Jones, 1980). Scholarly work has documented this effect across a variety of social group categories including gender (Park and Judd, 1990), age (Linville et al., 1989), race/ethnicity (Ackerman et al., 2006), and political orientation (Quattrone and Jones, 1980).
The purpose of this paper is to investigate the differences in the variability of socially dominant and subordinate groups as they are manifested by LLMs. To accomplish this goal, we had ChatGPT generate texts about eight groups at the intersection of four racial/ethnic groups in the US and two gender groups. Then, we induce sentence embeddings for the ChatGPT-generated texts using transformer-based language models and compare the similarity measurements calculated between the texts written for the groups. We hypothesize that (1) ChatGPT-generated texts about the socially subordinate racial/ethnic group(s) are more homogeneous than those about the socially dominant racial/ethnic group; that (2) ChatGPT-generated texts about the subordinate gender group are more homogeneous than those about the dominant gender group; and that (3) the effect of gender on the homogeneity of ChatGPT-generated text may differ across racial/ethnic groups. We identify White Americans as the dominant racial/ethnic group given their position in America’s racial hierarchy (Zou and Cheryan, 2017) and men as the dominant gender group (Swim and Hyers, 2009). We find that ChatGPT portrays African, Asian, and Hispanic Americans as more homogeneous than White Americans and that it portrays women as more homogeneous than men. Furthermore, the effect of gender differs across racial/ethnic groups such that the effect is consistent within African and Hispanic Americans but not within Asian and White Americans.
2 Method
2.1 Data
We create a collection of writing prompts asking ChatGPT to write 30-word texts about eight different intersectional group identities. The groups are at the intersection of four racial/ethnic groups in the US - African, Asian, Hispanic, and White Americans - and two gender groups - man and woman. To test the robustness of our findings to text format, we include a variety of text formats that could be generated by ChatGPT such as stories, character descriptions, biographies, and introductions. In addition, to account for text length in evaluating the similarity between texts, we impose a restriction on the lengths of text generations, limiting them to 30 words.111Despite the 30-word length restriction imposed on ChatGPT, the text generations did not strictly follow the restriction. The texts had an average length of 26.61 words (SD = 2.70). The prompts read, “Write a 30-word [ story about / character description of / biography of / introduction of / social media profile of / synopsis for / narrative of / self-introduction of / tragic story about / funny story about / romantic story about / horror story about / dramatic story about ] a(n) [ African / Asian / Hispanic / White ] American [ man / woman ].” We use the ChatGPT API, specifically employing the “gpt-3.5-turbo” model (as of 25 July 2023) to obtain 500 text completions for each of our prompts. The decision to collect 500 completions stemmed from pilot tests suggesting that a smaller number of completions (i.e., 10 or 100) could lead to more instability in our estimates. For a detailed discussion of the parameter settings used for data collection and dealing of non-compliant text completions, see Sections S1 and S10 of the Supplemental Materials.
2.2 Measures of homogeneity
We quantify the homogeneity of texts for each of the groups by measuring the cosine similarity between sentence embeddings of the generated text. Following the pre-registered analysis plan (https://osf.io/8j6xh/?view_only=48a12ea4c33246df805901c53bc74482), we use the second-to-last layer of the BERT-base-uncased model to induce sentence embeddings. We refer to this model as BERT-2 (for a detailed justification of the layers used, see Section S2 of the Supplemental Materials). After inducing the sentence embeddings for the ChatGPT-generated texts, we calculate the cosine similarities between all pairs of texts (see Section S3 of Supplemental Materials for examples of sentence pairs and their cosine similarity values and Section S4 for a validation check of the text homogeneity measure). Cosine similarity measurements are standardized for better interpretability, and race/ethnicity and gender variables are reordered such that White Americans and men serve as the reference level.
Following the pre-registered analysis plan, we fit linear mixed-effects models using the lme4 package (Bates et al., 2015) and analyze them using the lmerTest (Kuznetsova et al., 2017) package. In the model, we include race/ethnicity, gender, and their interactions as fixed effects and text format (e.g., story, character description, etc.) as random intercepts (for a detailed discussion of the model, see Section S5 of the Supplemental Materials). We conduct likelihood-ratio tests using the afex package (Singmann et al., 2023) to determine if the models including race/ethnicity or gender provide better fits for the data than those without them. Then, we plot the outputs of the models to better understand the magnitude and direction of the effects. Finally, we use the emmeans package (Lenth et al., 2023) to compare the effects of gender within individual racial/ethnic groups.
As robustness checks, we repeat these analyses based on alternative approaches to measuring text similarity (these were not pre-registered). First, to test the robustness of our findings to the layer used, we use the third-to-last layer of the same model (BERT-3). Second, to test the robustness of our findings to the model used, we use the second-to-last layer of the RoBERTa-base model (RoBERTa-2; Liu et al., 2019). Third, we use the third-to-last layer of the RoBERTa-base model (RoBERTa-3). We use the text package (R Version 4.2.3; Kjell et al., 2023) to induce sentence embeddings for these analyses. Finally, we use Sentence-BERT, a model fine-tuned on BERT and RoBERTa to yield higher quality sentence embeddings that are better suited for similarity assessments (Reimers and Gurevych, 2019). This is done using the sentence-transformers package (Python Version 3.11.4; Reimers and Gurevych, 2019). Specifically, we use the three Sentence-BERT models that perform best on the sentence encoding task: all-mpnet-base-v2, all-distilroberta-v1, and all-MiniLM-L12-v2.
3 Results
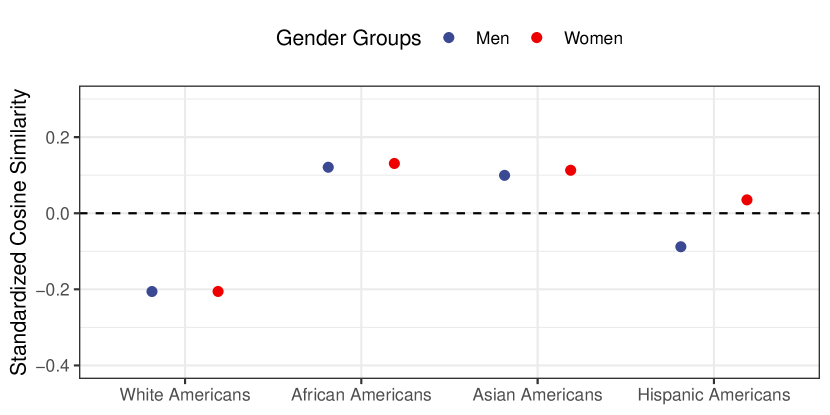
The results from the pre-registered model are reported in Table S5 (referred to as M4) and shown visually in Figure 1. We conduct likelihood-ratio tests comparing models that include and exclude race/ethnicity (M4 v. M2 in Table S4) and find significant support for the effect of race/ethnicity ((3) = 326701.07, p .001). We also find support for the effect of gender (M4 v. M1 in Table S4; (1) = 6352.47, p .001). All model comparison statistics are summarized in Table S4.
To better understand the magnitude of the effects of race/ethnicity and gender, we fit an exploratory model excluding the interactions (M3 in Table S5). Cosine similarity values of African, Asian, and Hispanic Americans are 0.33 (SE = 0.00065, t(12,973,984) = 508.81), 0.31 (SE = 0.00065, t(12,973,984) = 478.74), and 0.18 (SE = 0.00065, t(12,973,984) = 275.05) standard deviations greater than those of White Americans, respectively. These differences are substantive when we use the effect of gender as reference ( = 0.037, SE = 0.00047, t(12,973,986) = 78.68; M2 in Table S5).
Although the effect of gender is statistically significant, Figure 1 illustrates that there are substantive differences in the effect of gender across racial/ethnic groups. The effect of gender stands out within Hispanic Americans where the cosine similarity values of Hispanic American men are 0.12 standard deviations smaller than those of Hispanic American women (zs = -133.86, p .001). The contrasts in other racial/ethnic groups, even where the within-category differences are statistically significant, are much smaller than that within Hispanic Americans (s = -0.010, -0.013, 0.00021, zs = -10.79, -14.54, 0.23, p .001, p .001, p = .82 in the order of African, Asian, and White Americans).
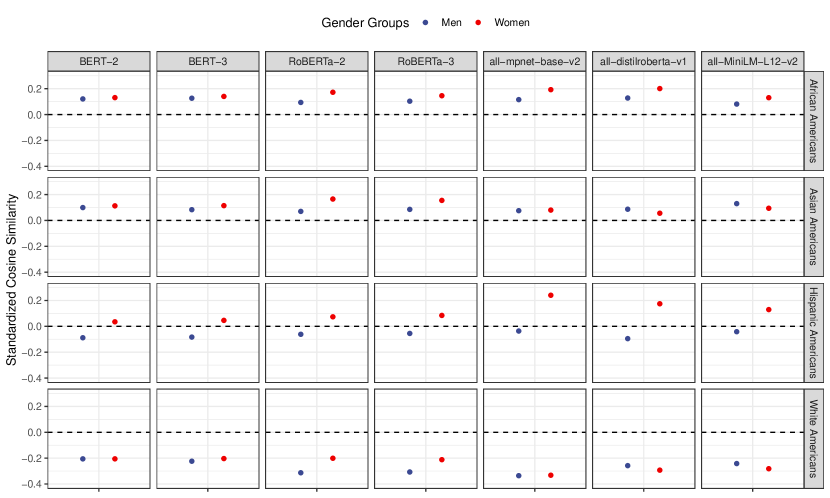
In Sections S6 and S7 of the Supplemental Materials, we show that the effects of race/ethnicity and gender replicate across all six other measurement strategies. The only meaningful difference we observe across measurement strategies is the instability in the effect of gender within individual racial/ethnic groups (see Figure S2 and Tables S6 and S7 in the Supplemental Materials). Consistent with the results from our pre-registered model, cosine similarity values of women are always greater than those of men within African and Hispanic Americans. In contrast, the effect of gender within Asian and White Americans are not consistent across measurement strategies.
4 Discussion
We find that ChatGPT portrays socially subordinate racial/ethnic groups (African, Asian, and Hispanic Americans) as more homogeneous than the dominant racial/ethnic group (White Americans). There are gender differences as well, but these are modest and consistent only within African and Hispanic Americans. These results underscore the importance of considering intersectionality when investigating representational biases in large language models.
Altogether, these findings offer evidence that bias in LLMs can take multiple forms. While existing literature predominantly focuses on stereotyping in LLMs, or the common association between social groups and stereotypic attributes (Blodgett et al., 2020), our research suggests that bias in LLMs can also manifest in the form of homogeneous representations where socially subordinate groups are portrayed as more uniform compared to the dominant group.
4.1 Where might these biases be coming from?
NLP systems reproduce biases embedded in their training data. This has been shown in word embeddings (Bolukbasi et al., 2016; Caliskan et al., 2017), translation systems (Stanovsky et al., 2019; Prates et al., 2018), and text generative models (Abid et al., 2021; Lucy and Bamman, 2021), among many others. As such, it is likely that homogeneous representations of socially subordinate groups in the text generated by LLMs are also reproductions of bias in their training data. Given the opacity surrounding the training data of many LLMs (and their sheer size), it is difficult to confirm if the representations of these groups are indeed more homogeneous than those of dominant groups in LLM training data. Instead, we speculate on potential sources of homogeneity in the training data.
First, there is the possibility of selection bias or disproportionate representations of groups in the training data (for a more detailed discussion, see Shah et al., 2020). Given that some groups are more frequently discussed in the training data of LLMs, as Tripodi’s (2023) study of Wikipedia text would suggest, we expect the model to have more words and information to choose from when generating texts about those groups. Hence, the frequency of which a group is discussed in the training data may influence the models’ representation of the group. Future work would benefit from investigating the causal effect of representation of groups in the training data on the homogeneity of LLM-generated text, perhaps by examining the bias in two otherwise equivalent LLMs, one that is trained on a gender- or race-balanced corpus, for example, and another that is not. Establishing this causality would help identify measures to mitigate this bias in LLMs.
Second, there is the possibility that some groups are more stereotypically represented in the training data. Studies have shown that LLMs reproduce stereotypes in their training data, generating text that associates social groups with stereotypic attributes that the group is frequently associated with in the training data (e.g. Abid et al., 2021; Lucy and Bamman, 2021). When a particular group is consistently portrayed with respect to these stereotypic attributes in the training data, it limits the range of words and information available to the LLM when discussing the group, ultimately resulting in a uniform and homogeneous representation. To address this concern, future research should investigate the extent to which stereotypicality impacts the homogeneity of group representations in LLM-generated text. Such inquiries will provide valuable insight into the underlying dynamics of LLM training and contribute to the development of more fair and unbiased language models.
5 Conclusion
Our work uncovers a new form of bias present in Large Language Models. Our findings indicate that LLMs depict socially subordinate groups as more homogeneous than the socially dominant group although the effect of gender is smaller than the effect of race/ethnicity. Moreover, the interaction between race/ethnicity and gender plays a role in shaping the bias, such that the effect of gender is consistently present within African and Hispanic Americans but not within Asian and White Americans. This bias in LLMs has the potential to amplify biases in future LLM training and to reinforce stereotypes. Future research should investigate ways to mitigate this bias to promote fairness, accuracy, and inclusivity in their generated content.
6 Social Impacts Statement
Studies have demonstrated that machine learning systems are susceptible to runaway feedback loops wherein bias present in the training data can mutually reinforce and amplify each other through a vicious cycle (Ensign et al., 2017; Jiang et al., 2019). Here, we argue that a similar cycle of this nature can occur in large language models such that socially subordinate groups are portrayed as more homogeneous compared to dominant groups inside the training data of LLMs, these biases are reflected in the text they generate, biased text affects how users of LLMs perceive groups, users generate biased text, and such data is fed into subsequent training of LLMs, further amplifying the bias. We’ve laid out two possible mechanisms that biased training data can lead to homogeneous representations of groups. Whether such biased training data leads to homogeneous text generations, whether such homogeneous text affects users’ perceptions of groups, and whether biased perceptions lead to the generation of biased text are all directions for future research.
Moreover, if homogeneous representations in LLM-generated text affect users’ perceptions of groups, then this bias in LLMs could affect stereotyping. When individuals perceive a group as more homogeneous, it tends to boost their confidence in assessing individual group members (Ryan et al., 1996) and increase the likelihood of recalling stereotype-consistent information (Pendry and Macrae, 1999). Consequently, perceived homogeneity of groups can influence stereotype change (Hewstone and Hamberger, 2000) and levels of prejudice and discrimination (Brauer and Er-rafiy, 2011). Hence, perceived homogeneity of socially subordinate groups reproduced by LLMs has the potential to reinforce and amplify stereotypes that individuals hold for these groups.
References
- OpenAI (2023) OpenAI. GPT-4 Technical Report, March 2023. URL https://arxiv.org/abs/2303.08774v3.
- Thoppilan et al. (2022) Romal Thoppilan, Daniel De Freitas, Jamie Hall, Noam Shazeer, Apoorv Kulshreshtha, Heng-Tze Cheng, Alicia Jin, Taylor Bos, Leslie Baker, Yu Du, YaGuang Li, Hongrae Lee, Huaixiu Steven Zheng, Amin Ghafouri, Marcelo Menegali, Yanping Huang, Maxim Krikun, Dmitry Lepikhin, James Qin, Dehao Chen, Yuanzhong Xu, Zhifeng Chen, Adam Roberts, Maarten Bosma, Vincent Zhao, Yanqi Zhou, Chung-Ching Chang, Igor Krivokon, Will Rusch, Marc Pickett, Pranesh Srinivasan, Laichee Man, Kathleen Meier-Hellstern, Meredith Ringel Morris, Tulsee Doshi, Renelito Delos Santos, Toju Duke, Johnny Soraker, Ben Zevenbergen, Vinodkumar Prabhakaran, Mark Diaz, Ben Hutchinson, Kristen Olson, Alejandra Molina, Erin Hoffman-John, Josh Lee, Lora Aroyo, Ravi Rajakumar, Alena Butryna, Matthew Lamm, Viktoriya Kuzmina, Joe Fenton, Aaron Cohen, Rachel Bernstein, Ray Kurzweil, Blaise Aguera-Arcas, Claire Cui, Marian Croak, Ed Chi, and Quoc Le. LaMDA: Language Models for Dialog Applications, January 2022. URL https://arxiv.org/abs/2201.08239v3.
- Lucy and Bamman (2021) Li Lucy and David Bamman. Gender and Representation Bias in GPT-3 Generated Stories. In Proceedings of the Third Workshop on Narrative Understanding, pages 48–55, Virtual, June 2021. Association for Computational Linguistics. doi: 10.18653/v1/2021.nuse-1.5. URL https://aclanthology.org/2021.nuse-1.5.
- Abid et al. (2021) Abubakar Abid, Maheen Farooqi, and James Zou. Persistent Anti-Muslim Bias in Large Language Models, January 2021. URL https://arxiv.org/abs/2101.05783v2.
- Guinote et al. (2002) Ana Guinote, Charles M. Judd, and Markus Brauer. Effects of power on perceived and objective group variability: evidence that more powerful groups are more variable. Journal of Personality and Social Psychology, 82(5):708–721, May 2002. ISSN 0022-3514.
- Fiske (1993) Susan T. Fiske. Controlling other people: The impact of power on stereotyping. American Psychologist, 48(6):621–628, 1993. ISSN 1935-990X. doi: 10.1037/0003-066X.48.6.621. Place: US Publisher: American Psychological Association.
- Fiske and Dépret (1996) Susan T. Fiske and Eric Dépret. Control, Interdependence and Power: Understanding Social Cognition in Its Social Context. European Review of Social Psychology, 7(1):31–61, January 1996. ISSN 1046-3283. doi: 10.1080/14792779443000094. URL https://doi.org/10.1080/14792779443000094. Publisher: Routledge _eprint: https://doi.org/10.1080/14792779443000094.
- Lorenzi-Cioldi (1993) Fabio Lorenzi-Cioldi. They all look alike, but so do we…sometimes: Perceptions of in-group and out-group homogeneity as a function of sex and context. British Journal of Social Psychology, 32(2):111–124, 1993. ISSN 2044-8309. doi: 10.1111/j.2044-8309.1993.tb00990.x. Place: United Kingdom Publisher: British Psychological Society.
- Lorenzi-Cioldi (1998) Fabio Lorenzi-Cioldi. Group Status and Perceptions of Homogeneity. European Review of Social Psychology, 9(1):31–75, January 1998. ISSN 1046-3283. doi: 10.1080/14792779843000045. URL https://doi.org/10.1080/14792779843000045. Publisher: Routledge _eprint: https://doi.org/10.1080/14792779843000045.
- Linville and Jones (1980) Patricia W. Linville and Edward E. Jones. Polarized appraisals of out-group members. Journal of Personality and Social Psychology, 38(5):689–703, 1980. ISSN 1939-1315. doi: 10.1037/0022-3514.38.5.689. Place: US Publisher: American Psychological Association.
- Park and Judd (1990) Bernadette Park and Charles M. Judd. Measures and models of perceived group variability. Journal of Personality and Social Psychology, 59(2):173–191, 1990. ISSN 1939-1315. doi: 10.1037/0022-3514.59.2.173. Place: US Publisher: American Psychological Association.
- Linville et al. (1989) P. W. Linville, G. W. Fischer, and P. Salovey. Perceived distributions of the characteristics of in-group and out-group members: empirical evidence and a computer simulation. Journal of Personality and Social Psychology, 57(2):165–188, August 1989. ISSN 0022-3514. doi: 10.1037//0022-3514.57.2.165.
- Ackerman et al. (2006) Joshua M. Ackerman, Jenessa R. Shapiro, Steven L. Neuberg, Douglas T. Kenrick, D. Vaughn Becker, Vladas Griskevicius, Jon K. Maner, and Mark Schaller. They all look the same to me (unless they’re angry): from out-group homogeneity to out-group heterogeneity. Psychological Science, 17(10):836–840, October 2006. ISSN 0956-7976. doi: 10.1111/j.1467-9280.2006.01790.x.
- Quattrone and Jones (1980) George A. Quattrone and Edward E. Jones. The perception of variability within in-groups and out-groups: Implications for the law of small numbers. Journal of Personality and Social Psychology, 38(1):141–152, 1980. ISSN 1939-1315. doi: 10.1037/0022-3514.38.1.141. Place: US Publisher: American Psychological Association.
- Zou and Cheryan (2017) Linda X. Zou and Sapna Cheryan. Two axes of subordination: A new model of racial position. Journal of Personality and Social Psychology, 112(5):696–717, 2017. ISSN 1939-1315. doi: 10.1037/pspa0000080. Place: US Publisher: American Psychological Association.
- Swim and Hyers (2009) Janet K. Swim and Lauri L. Hyers. Sexism. In Handbook of prejudice, stereotyping, and discrimination, pages 407–430. Psychology Press, New York, NY, US, 2009. ISBN 978-0-8058-5952-2. doi: 10.4324/9781841697772.
- Bates et al. (2015) Douglas Bates, Martin Mächler, Ben Bolker, and Steve Walker. Fitting Linear Mixed-Effects Models Using lme4. Journal of Statistical Software, 67:1–48, October 2015. ISSN 1548-7660. doi: 10.18637/jss.v067.i01. URL https://doi.org/10.18637/jss.v067.i01.
- Kuznetsova et al. (2017) Alexandra Kuznetsova, Per B. Brockhoff, and Rune H. B. Christensen. lmerTest Package: Tests in Linear Mixed Effects Models. Journal of Statistical Software, 82:1–26, December 2017. ISSN 1548-7660. doi: 10.18637/jss.v082.i13. URL https://doi.org/10.18637/jss.v082.i13.
- Singmann et al. (2023) Henrik Singmann, Ben Bolker, Jake Westfall, Frederik Aust, Mattan S. Ben-Shachar, Søren Højsgaard, John Fox, Michael A. Lawrence, Ulf Mertens, Jonathon Love, Russell Lenth, and Rune Haubo Bojesen Christensen. afex: Analysis of Factorial Experiments, April 2023. URL https://cran.r-project.org/web/packages/afex/index.html.
- Lenth et al. (2023) Russell V. Lenth, Ben Bolker, Paul Buerkner, Iago Giné-Vázquez, Maxime Herve, Maarten Jung, Jonathon Love, Fernando Miguez, Hannes Riebl, and Henrik Singmann. emmeans: Estimated Marginal Means, aka Least-Squares Means, June 2023. URL https://cran.r-project.org/web/packages/emmeans/index.html.
- Liu et al. (2019) Yinhan Liu, Myle Ott, Naman Goyal, Jingfei Du, Mandar Joshi, Danqi Chen, Omer Levy, Mike Lewis, Luke Zettlemoyer, and Veselin Stoyanov. RoBERTa: A Robustly Optimized BERT Pretraining Approach, July 2019. URL http://arxiv.org/abs/1907.11692. arXiv:1907.11692 [cs].
- Kjell et al. (2023) Oscar Kjell, Salvatore Giorgi, and H. Andrew Schwartz. The text-package: An R-package for analyzing and visualizing human language using natural language processing and transformers. Psychological Methods, pages No Pagination Specified–No Pagination Specified, 2023. ISSN 1939-1463. doi: 10.1037/met0000542. Place: US Publisher: American Psychological Association.
- Reimers and Gurevych (2019) Nils Reimers and Iryna Gurevych. Sentence-BERT: Sentence Embeddings using Siamese BERT-Networks. In Proceedings of the 2019 Conference on Empirical Methods in Natural Language Processing and the 9th International Joint Conference on Natural Language Processing (EMNLP-IJCNLP), pages 3982–3992, Hong Kong, China, November 2019. Association for Computational Linguistics. doi: 10.18653/v1/D19-1410. URL https://aclanthology.org/D19-1410.
- Blodgett et al. (2020) Su Lin Blodgett, Solon Barocas, Hal Daumé III, and Hanna Wallach. Language (Technology) is Power: A Critical Survey of “Bias” in NLP. In Proceedings of the 58th Annual Meeting of the Association for Computational Linguistics, pages 5454–5476, Online, July 2020. Association for Computational Linguistics. doi: 10.18653/v1/2020.acl-main.485. URL https://aclanthology.org/2020.acl-main.485.
- Bolukbasi et al. (2016) Tolga Bolukbasi, Kai-Wei Chang, James Zou, Venkatesh Saligrama, and Adam Kalai. Man is to Computer Programmer as Woman is to Homemaker? Debiasing Word Embeddings, July 2016. URL https://arxiv.org/abs/1607.06520v1.
- Caliskan et al. (2017) Aylin Caliskan, Joanna J. Bryson, and Arvind Narayanan. Semantics derived automatically from language corpora contain human-like biases. Science, 356(6334):183–186, April 2017. doi: 10.1126/science.aal4230. URL https://www.science.org/doi/10.1126/science.aal4230. Publisher: American Association for the Advancement of Science.
- Stanovsky et al. (2019) Gabriel Stanovsky, Noah A. Smith, and Luke Zettlemoyer. Evaluating Gender Bias in Machine Translation. In Proceedings of the 57th Annual Meeting of the Association for Computational Linguistics, pages 1679–1684, Florence, Italy, July 2019. Association for Computational Linguistics. doi: 10.18653/v1/P19-1164. URL https://aclanthology.org/P19-1164.
- Prates et al. (2018) Marcelo O. R. Prates, Pedro H. C. Avelar, and Luis Lamb. Assessing Gender Bias in Machine Translation – A Case Study with Google Translate, September 2018. URL https://arxiv.org/abs/1809.02208v4.
- Shah et al. (2020) Deven Santosh Shah, H. Andrew Schwartz, and Dirk Hovy. Predictive Biases in Natural Language Processing Models: A Conceptual Framework and Overview. In Proceedings of the 58th Annual Meeting of the Association for Computational Linguistics, pages 5248–5264, Online, July 2020. Association for Computational Linguistics. doi: 10.18653/v1/2020.acl-main.468. URL https://aclanthology.org/2020.acl-main.468.
- Tripodi (2023) Francesca Tripodi. Ms. Categorized: Gender, notability, and inequality on Wikipedia. New Media & Society, 25(7):1687–1707, July 2023. ISSN 1461-4448. doi: 10.1177/14614448211023772. URL https://doi.org/10.1177/14614448211023772. Publisher: SAGE Publications.
- Ensign et al. (2017) Danielle Ensign, Sorelle A. Friedler, Scott Neville, Carlos Scheidegger, and Suresh Venkatasubramanian. Runaway Feedback Loops in Predictive Policing, June 2017. URL https://arxiv.org/abs/1706.09847v3.
- Jiang et al. (2019) Ray Jiang, Silvia Chiappa, Tor Lattimore, András György, and Pushmeet Kohli. Degenerate Feedback Loops in Recommender Systems. In Proceedings of the 2019 AAAI/ACM Conference on AI, Ethics, and Society, AIES ’19, pages 383–390, New York, NY, USA, January 2019. Association for Computing Machinery. ISBN 978-1-4503-6324-2. doi: 10.1145/3306618.3314288. URL https://doi.org/10.1145/3306618.3314288.
- Ryan et al. (1996) Carey S. Ryan, Charles M. Judd, and Bernadette Park. Effects of Racial Stereotypes on Judgments of Individuals: The Moderating Role of Perceived Group Variability. Journal of Experimental Social Psychology, 32(1):71–103, January 1996. ISSN 0022-1031. doi: 10.1006/jesp.1996.0004. URL https://www.sciencedirect.com/science/article/pii/S0022103196900049.
- Pendry and Macrae (1999) Louise F. Pendry and C. Neil Macrae. Cognitive load and person memory: the role of perceived group variability. European Journal of Social Psychology, 29(7):925–942, 1999. ISSN 1099-0992. doi: 10.1002/(SICI)1099-0992(199911)29:7<925::AID-EJSP973>3.0.CO;2-O. URL https://onlinelibrary.wiley.com/doi/abs/10.1002/%28SICI%291099-0992%28199911%2929%3A7%3C925%3A%3AAID-EJSP973%3E3.0.CO%3B2-O. _eprint: https://onlinelibrary.wiley.com/doi/pdf/10.1002/%28SICI%291099-0992%28199911%2929%3A7%3C925%3A%3AAID-EJSP973%3E3.0.CO%3B2-O.
- Hewstone and Hamberger (2000) Miles Hewstone and Jürgen Hamberger. Perceived variability and stereotype change. Journal of Experimental Social Psychology, 36(2):103–124, 2000. ISSN 1096-0465. doi: 10.1006/jesp.1999.1398. Place: Netherlands Publisher: Elsevier Science.
- Brauer and Er-rafiy (2011) Markus Brauer and Abdelatif Er-rafiy. Increasing perceived variability reduces prejudice and discrimination. Journal of Experimental Social Psychology, 47(5):871–881, 2011. ISSN 1096-0465. doi: 10.1016/j.jesp.2011.03.003. Place: Netherlands Publisher: Elsevier Science.
- Conneau et al. (2018) Alexis Conneau, German Kruszewski, Guillaume Lample, Loïc Barrault, and Marco Baroni. What you can cram into a single vector: Probing sentence embeddings for linguistic properties, July 2018. URL http://arxiv.org/abs/1805.01070. arXiv:1805.01070 [cs].
- Devlin et al. (2018) Jacob Devlin, Ming-Wei Chang, Kenton Lee, and Kristina Toutanova. BERT: Pre-training of Deep Bidirectional Transformers for Language Understanding, October 2018. URL https://arxiv.org/abs/1810.04805v2.
- Ethayarajh (2019) Kawin Ethayarajh. How Contextual are Contextualized Word Representations? Comparing the Geometry of BERT, ELMo, and GPT-2 Embeddings. In Proceedings of the 2019 Conference on Empirical Methods in Natural Language Processing and the 9th International Joint Conference on Natural Language Processing (EMNLP-IJCNLP), pages 55–65, Hong Kong, China, November 2019. Association for Computational Linguistics. doi: 10.18653/v1/D19-1006. URL https://aclanthology.org/D19-1006.
- Nadeem et al. (2019) Farah Nadeem, Huy Nguyen, Yang Liu, and Mari Ostendorf. Automated Essay Scoring with Discourse-Aware Neural Models. In Proceedings of the Fourteenth Workshop on Innovative Use of NLP for Building Educational Applications, pages 484–493, Florence, Italy, August 2019. Association for Computational Linguistics. doi: 10.18653/v1/W19-4450. URL https://aclanthology.org/W19-4450.
- Lin et al. (2020) Chenhao Lin, Pengwei Hu, Hui Su, Shaochun Li, Jing Mei, Jie Zhou, and Henry Leung. SenseMood: Depression Detection on Social Media. In Proceedings of the 2020 International Conference on Multimedia Retrieval, ICMR ’20, pages 407–411, New York, NY, USA, June 2020. Association for Computing Machinery. ISBN 978-1-4503-7087-5. doi: 10.1145/3372278.3391932. URL https://doi.org/10.1145/3372278.3391932.
- Brown (2021) Violet A. Brown. An Introduction to Linear Mixed-Effects Modeling in R. Advances in Methods and Practices in Psychological Science, 4(1):2515245920960351, January 2021. ISSN 2515-2459. doi: 10.1177/2515245920960351. URL https://doi.org/10.1177/2515245920960351. Publisher: SAGE Publications Inc.
Appendix S1 API parameter settings and non-compliant text completions
While using the default parameters of the API (https://platform.openai.com/docs/guides/gpt/chat-completions-api) we make two exceptions: the n parameter, which determines the number of text completions per API request, and the role of the system that determines the model’s behavior. Initially, we intended to set n to 500. However, the maximum allowed value for n is 128. To address this limitation, we conduct data collection in four separate batches, with ns set to 128, 128, 128, and 116 for each batch, respectively. For consistency and standardization, we set the role of the system to “a chatbot”, a widely used role for the ChatGPT API. Subsequently, we merge the generated texts from the four batches.
To ensure data quality, we conduct a keyword-based query to identify and remove 50 of 52,000 instances where ChatGPT refuses to generate the requested texts. Upon manual inspection, we identify instances where ChatGPT generates responses for the prompts in addition to a cautionary note about the potential perpetuation of stereotypes. Despite this observation, we retain these instances in the analyses presented in the main text as they do not meet our exclusion criteria. We provide a breakdown of non-compliant completions by race/ethnicity, gender, and text format in Section S10. To address the removal of these texts and to ensure a complete data set of 500 texts for each of the 104 different writing prompts, we conduct an additional round of data collection. This involves generating texts to replace the 50 removed instances.
Appendix S2 Justification for the choice of layers
Sentence embeddings are numerical vectors in a high-dimensional embedding space that encode both syntactic and semantic information of sentences (Conneau et al., 2018). These embeddings can be obtained from transformer-based language models such as BERT (Devlin et al., 2018) that have readily been trained on large amounts of textual data to learn contextual representations of language. These models consist of multiple transformer layers where each layer is responsible for capturing increasingly abstract and contextualized information from the input text and representing them as numeric vectors. Consequently, when a sentence is fed into a transformer-based language model, sentence-level representations are generated for each layer, but upper (i.e., closer to last) layer representations tend to be more contextualized (Ethayarajh, 2019). Hence, when obtaining sentence embeddings to assess meanings of text, it is common to use layer representations that are closer to the last (e.g. Nadeem et al., 2019; Lin et al., 2020). However, the last layer is often not used because it is considered biased towards the task in which these models are trained for (i.e., next sentence and masked language prediction). For more information, read https://bert-as-service.readthedocs.io/en/latest/section/faq.html. For these reasons, we use the second-to-last and third-to-last layers of BERT and RoBERTa.
Appendix S3 Face validity of the cosine similarity measurements
To demonstrate the face validity of the cosine similarity measurements, we provide 20 randomly selected pairs from ChatGPT-generated stories about a White American man, arranged in descending order of cosine similarity (see Table LABEL:sample_sentences). We show that, as opposed to the pair of sentences with the highest cosine similarity value sharing apparent overlap in meaning, the last pair with the lowest cosine similarity value shares less meaning:
| Sentence 1 | Sentence 2 | Cosine |
| White man navigates through life’s challenges, overcoming stereotypes, embracing diversity, and championing equality, ultimately becoming an empathetic voice for the marginalized. | White American man navigates life’s complexities with love, laughter, and an open heart. Growing up, he discovers the importance of empathy and advocates for equality and justice. | 0.9338 |
| Driven by curiosity, the white American man explored cultures unknown. Along the way, he discovered the beauty of diversity and embraced the power of unity. | In a world full of color, the White American man embraced diversity, breaking stereotypes, and learning to appreciate the beauty in every shade. | 0.9195 |
| In a world of diversity, he stood proud, embracing growth, understanding, and empathy, using his privilege to amplify the voices of others. | In a divided world, the White American man sought understanding, embracing diversity and challenging his own biases, becoming a catalyst for unity and empathy. | 0.9157 |
| In a land of diversity, he bridged divides with empathy and understanding, proving that the color of one’s skin did not define their character. | In a small town, a White American man discovered the beauty of diversity, bridging gaps and building connections that inspired his community to embrace unity. | 0.9103 |
| Lost in a sea of privilege, he struggled to understand the struggles of others. But with newfound empathy, he vowed to fight alongside them for equality and justice. | A White American man, plagued by privilege and prejudice, embarked on a journey of self-discovery, exploring humility and empathy, ultimately breaking free from the chains of ignorance. | 0.9042 |
| In a small rural town, a white American man defied societal expectations, dedicating his life to fighting for equality and helping those in need. | In a small town, a white American man befriended his immigrant neighbor, celebrating their differences and finding common ground, reminding everyone that unity is strength. | 0.9036 |
| White American man learned empathy and respect through conversations with people from diverse backgrounds, realizing that unity and understanding are vital for a harmonious society. | A White American man navigates through life, unveiling the shades of his identity, breaking stereotypes, and embracing diversity, all while creating spaces for understanding and unity. | 0.8995 |
| In a small town, a white American man with a heart full of compassion devoted his life to bridging divides and embracing diversity. | In a crowded city, a white American man sat alone on a park bench, reflecting on his privileged life and vowing to use it for positive change. | 0.8980 |
| Once a lonely, lost white American man found solace amid diverse cultures, realizing the beauty of unity within humanity, transcending barriers and spreading compassion. | John, a white American man, embarked on a soul-searching journey across the country, immersing himself in diverse cultures and finding his own identity in the process. | 0.8822 |
| White, American man achieved his lifelong dream of climbing Mount Everest. Along the treacherous journey, he discovered peace within himself and a newfound respect for nature. | A White American man, trapped in societal expectations, embarks on a soul-searching journey, discovering the true essence of his identity beyond the color of his skin. | 0.8755 |
| White American man ventures into the unknown, conquering new territories of the mind and heart, breaking stereotypes and building bridges to unite humanity. | Once a privileged white American man, his eyes were opened to the harsh reality of inequality, inspiring him to fight for justice and become an ally to marginalized communities. | 0.8708 |
| In a small town, a white American man embraced diversity, shedding prejudices and embracing new cultures, creating a harmonious community where everyone felt welcome. | He planted seeds of understanding amidst a field of prejudice, cultivating a garden of diversity where flowers of acceptance bloomed, transforming hearts and minds. | 0.8706 |
| Jonathan, a White American man, was lost in self-doubt. Through introspection, he realized his privilege and used it to advocate for equality, becoming a catalyst for change in his community. | A White American man embarked on a journey of self-discovery, shedding societal expectations, and embracing a world where diversity thrived. | 0.8706 |
| Born privileged, he realized his privilege and dedicated his life to fighting for equality, using his platform to amplify marginalized voices and challenge societal norms. | A white American man, seeking adventure and self-discovery, embarks on a profound journey through different cultures, ultimately realizing the beauty of diversity and the value of empathy. | 0.8588 |
| In a small Southern town, a white American man breaks societal norms by opening a successful restaurant that bridges cultural gaps through his love for fusion cuisine. | A white American man, filled with curiosity and compassion, left his comfortable life behind to immerse himself in a foreign culture, forever changing his perspective on the world. | 0.8572 |
| An ambitious white American man left everything behind to embark on a journey, only to discover that true fulfillment lay in the connections he made with people from diverse backgrounds. | He wore a white suit as he walked through a sea of vibrant cultures, unaware of the privilege that shielded him from the struggles around him. | 0.8461 |
| A white American man, haunted by his past, embarks on a journey of self-discovery, ultimately finding redemption through the power of forgiveness and love. | In a land divided, a White American man faced his privilege and privilege his voice to uplift others, bridging the gap between races and fostering understanding. | 0.8403 |
| He wandered through life, carrying the weight of privilege on his shoulders, until one day he met a black woman who challenged his perspective and opened his eyes to a world beyond his own. | He was surrounded by diversity, but his curious mind sought deeper understanding and connection. In embracing others, he became a beacon of unity and empathy. | 0.8351 |
| In a small town, a white American man found solace through volunteering, bridging gaps among diverse neighbors and fostering harmony in his community. | Adam, proud of his privilege, realized he hadn’t bothered to question his prejudices until he met Maria, an immigrant who showed him the beauty of diversity. | 0.8209 |
| Adam, a proud White American man, strove to overcome his biases, embracing diversity and fostering understanding to create a world where skin color mattered little. | White American man, pensive and weary, found solace in a crumbling bookstore, where each yellowed page whispered forgotten tales of the world he longed to explore. | 0.8199 |
Appendix S4 Validation check in pilot study
In one of our pilot studies, we collected stories about four racial/ethnic groups to validate cosine similarity of sentence embeddings as measure of text homogeneity. The writing prompt used in the pilot study was almost identical to that used in the main study. The only difference was that we looked at one text format - story - and one gender group - men. The prompts read, “Write a 30-word story about a(n) [ African / Asian / Hispanic / White ] American man.” We collected 100 responses for each prompt.
Upon manual inspection of the collected data, we discovered that a recurring theme in the stories was overcoming hardship (e.g., shattering stereotypes, defying the odds … etc.). We expected that if cosine similarity was really capturing the concept of homogeneity, a larger number of stories written for African, Asian, and Hispanic Americans would be about overcoming hardship than those written for White Americans. To test this hypothesis, we coded the stories as either being about overcoming hardship (1) or not (0) and tallied the number of stories coded as 1 for each racial/ethnic group. Then, we calculated the cosine similarity between all pairs of stories generated for each racial/ethnic group. The cosine similarity value was calculated using the BERT-2 model. In Table S2, we show randomly selected stories from the pilot data and the code assigned to the stories.
| Race/Ethnicity | Stories | Code |
|---|---|---|
| Hispanic American | Proudly embracing his heritage, Juan achieved the American Dream through hard work and determination, inspiring generations to follow their dreams regardless of their background. | 0 |
| White American | He woke up in a foreign land, feeling lost and out of place. Through the struggle, he learned empathy and found beauty in embracing diversity. | 0 |
| White American | He was born with privilege but refused to succumb to its trappings. Instead, he used his voice to amplify the cries of the marginalized, becoming a true ally in a divided world. | 0 |
| Asian American | In a bustling city, an Asian American man strove for success, overcoming stereotypes with determination, resilience, and a humble spirit that inspired others to do the same. | 1 |
| African American | He held his head high, defying stereotypes. With each step he took on the journey of life, he shattered barriers and inspired generations. | 1 |
| African American | In a world of prejudice, he rose above, breaking barriers and empowering others, his resilience a beacon of hope for all marginalized voices. | 1 |
| Race/Ethnicity | Both 1s | Both 0s | Different Code | Mean Cosine Similarity |
|---|---|---|---|---|
| African Americans | 4656 | 3 | 291 | 0.8980 |
| Asian Americans | 2775 | 300 | 1875 | 0.8820 |
| Hispanic Americans | 1891 | 703 | 2356 | 0.8865 |
| White Americans | 120 | 3486 | 1344 | 0.8589 |
In Table S3, we show the number of stories generated for each of the racial/ethnic groups that were coded as being about overcoming hardship and the mean pairwise cosine similarity values calculated within each racial/ethnic group. Although the number of stories coded as 1 did not perfectly correlate with the mean cosine similarity value, White Americans clearly had the smallest number of stories coded as 1 and the smallest mean cosine similarity value. While the code used here captures only a single aspect (i.e. whether or not the story is about overcoming hardship) of the generated stories, this suggests that cosine similarity captures text homogeneity.
Appendix S5 Mixed effects model terms
Text format is included as random intercepts and not as random slopes because we expect the cosine similarity baseline to vary across text formats (text formats like self-introduction, for example, may be more similar to each other than other text formats given that self-introductions are likely to share a common structure and/or content that constitutes an introduction), but we do not expect the magnitude and direction of the fixed effects to vary across text format. When fitting linear mixed-effects models, we turn off derivative calculations that could slow down the model fitting process and use the nmkbw optimizer made available by the lme4 package.
Appendix S6 Main effect of race/ethnicity in alternative measurement strategies
Alternative measurement strategies using BERT and RoBERTa yield similar results as that reported in the main text. Using likelihood-ratio tests, we find that the models including race/ethnicity provide better fits for the data than those without it, as indicated by the chi-squared statistics for the analysis using BERT-3 ((3) = 350811.99, p .001), RoBERTa-2 ((3) = 423818.22, p .001), and RoBERTa-3 ((3) = 420810.29, p .001). African Americans hold greater cosine similarity values than White Americans (BERT-3 = 0.35, RoBERTa-2 = 0.39, RoBERTa-3 = 0.38, SEs = 0.00064, 0.00067, 0.00068, t(12,973,984)s = 538.98, 578.05, 567.66), Asian Americans hold greater cosine similarity values than White Americans (BERT-3 = 0.31, RoBERTa-2 = 0.37, RoBERTa-3 = 0.38, SEs = 0.00064, 0.00067, 0.00068, t(12,973,984)s = 485.69, 555.63, 561.65), and Hispanic Americans hold greater cosine similarity values than White Americans (BERT-3 = 0.20, RoBERTa-2 = 0.26, RoBERTa-3 = 0.27, SEs = 0.00064, 0.00067, 0.00068, t(12,973,984)s = 303.47, 390.21, 405.83) across all alternative measurement strategies (see Table S6).
The Sentence-BERT models also yield similar results as that reported in the main text. Using likelihood-ratio tests, we find that the models including race/ethnicity provide better fits for the data than those without it, as indicated by the chi-squared statistics for all-mpnet-base-v2 ((3) = 951045.70, p .001), all-distilroberta-v1 ((3) = 723332.37, p .001), and all-MiniLM-L12-v2 ((3) = 637185.08, p .001). African Americans hold greater cosine similarity values than White Americans (all-mpnet-base-v2 = 0.49, all-distilroberta-v1 = 0.44, all-MiniLM-L12-v2 = 0.37, SEs = 0.00056, 0.00055, 0.00054, t(12,973,984)s = 875.24, 805.99, 682.53), Asian Americans hold greater cosine similarity values than White Americans (all-mpnet-base-v2 = 0.41, all-distilroberta-v1 = 0.35, all-MiniLM-L12-v2 =0.37, SEs = 0.00056, 0.00055, 0.00054, t(12,973,984)s = 738.83, 635.89, 694.53), and Hispanic Americans hold greater cosine similarity values than White Americans (all-mpnet-base-v2 = 0.44, all-distilroberta-v1 = 0.32, all-MiniLM-L12-v2 = 0.31, SEs = 0.00056, 0.00055, 0.00054, t(12,973,984)s = 782.51, 577.99, 568.14) across all three measurement strategies (see Table S7).
Appendix S7 Main effect of gender in alternative measurement strategies
Alternative measurement strategies using BERT and RoBERTa yield similar results as that reported in the main text. Using likelihood-ratio tests, we find that the models including gender provide better fits for the data than those without it, as indicated by the chi-squared statistics for the analysis using BERT-3 ((1) = 10618.63, p .001), RoBERTa-2 ((1) = 48861.29, p .001), and RoBERTa-3 ((1) = 32820.55, p .001). Cosine similarity values of women are greater than those of men ( BERT-3 = 0.049, RoBERTa-2 = 0.11, RoBERTa-3 = 0.087, SEs = 0.00046, 0.00048, 0.00049, t(12,973,986)s = 105.69, 217.65, 178.33) across all alternative measurement strategies (see Table S6).
The Sentence-BERT models also yield similar results as that reported in the main text. Using likelihood-ratio tests, we find that the models including the gender term provide better fits for the data than those without it, as indicated by the chi-squared statistics for all-mpnet-base-v2 ((1) = 53129.67, p .001), all-distilroberta-v1 ((1) = 32470.77, p .001), and all-MiniLM-L12-v2 ((1) = 9010.33, p .001). Cosine similarity values of women are greater than those of men ( all-mpnet-base-v2 = 0.090, all-distilroberta-v1 = 0.069, all-MiniLM-L12-v2 =0.036, SEs = 0.00041, 0.00040, 0.00039, t(12,973,986)s = 221.79, 174.69, 92.46) across all alternative measurement strategies (see Table S7).
Appendix S8 Main effect in the presence of an interaction
When the predictors are dummy-coded, the main effects in the presence of an interaction are simple effects, the effect of the predictor in the reference level (Brown, 2021). As we dummy-code race/ethnicity and gender variables such that White Americans and men serve as the reference level, the beta coefficient corresponding to the race/ethnicity term is the effect of race/ethnicity within men, and the beta coefficient corresponding to the gender term is the effect of gender within White Americans.
S8-1 Main effect of race/ethnicity
Using the likelihood-ratio test, we find that the model including race/ethnicity provides a better fit for the data than that without it, as indicated by the chi-squared statistics for the analysis using BERT-2 ((3) = 326701.07, p .001). Cosine similarity values of African, Asian, and Hispanic American men are 0.33 (SE = 0.00092, t(12,973,980) = 354.75), 0.31 (SE = 0.00092, t(12,973,980) = 331.60), and 0.12 (SE = 0.00092, t(12,973,980) = 127.81) standard deviations greater than those of White American men, respectively (see Tables S4 and S5).
Alternative measurement strategies using BERT and RoBERTa yield similar results as that of BERT-2 (see Tables S4 and S6). Using likelihood-ratio tests, we find that the models including the race/ethnicity term provide better fits for the data than those without it, as indicated by the chi-squared statistics for the analysis using BERT-3 ((3) = 350811.99, p .001), RoBERTa-2 ((3) = 423818.22, p .001), and RoBERTa-3 ((3) = 420810.29, p .001). African American men hold greater cosine similarity values than White American men ( BERT-3 = 0.35, RoBERTa-2 = 0.41, RoBERTa-3 = 0.41, SEs = .00091, .00095, .00096, t(12,973,980)s = 385.07, 427,14, 429.71), Asian American men hold greater cosine similarity values than White American men ( BERT-3 = 0.31, RoBERTa-2 = 0.38, RoBERTa-3 = 0.39, SEs = .00091, .00095, .00096, t(12,973,980)s = 337.87, 402.34, 411.19), and Hispanic American men hold greater cosine similarity values than White American men ( BERT-3 = 0.14, RoBERTa-2 = 0.25, RoBERTa-3 = 0.25, SEs = .00091, .00095, .00096, t(12,973,980)s = 155.04, 264.43, 264.35) across all alternative measurement strategies.
The Sentence-BERT models also yield similar results as that of BERT-2 (see Tables S4 and S7). Using likelihood-ratio tests, we find that the models including the race/ethnicity term provide better fits for the data than those without it, as indicated by the chi-squared statistics for all-mpnet-base-v2 ((3) = 951045.70, p .001), all-distilroberta-v1 ((3) = 723332.37, p .001), and all-MiniLM-L12-v2 ((3) = 637185.08, p .001). African American men hold greater cosine similarity values than White American men ( all-mpnet-base-v2 = 0.45, all-distilroberta-v1 = 0.39, all-MiniLM-L12-v2 =0.32, SEs = 0.00078, 0.00077, 0.00076, t(12973980)s = 575.21, 502.56, 425.15), Asian American men hold greater cosine similarity values than White American men ( all-mpnet-base-v2 = 0.41, all-distilroberta-v1 = 0.35, all-MiniLM-L12-v2 =0.37, SEs = 0.00078, 0.00077, 0.00076, t(12,973,980)s = 524.52, 449.42, 489.55), and Hispanic American men hold greater cosine similarity values than White American men ( all-mpnet-base-v2 = 0.30, all-distilroberta-v1 = 0.16, all-MiniLM-L12-v2 =0.20, SEs = 0.00078, 0.00077, 0.00076, t(12,973,980)s = 382.11, 212.57, 263.95) across all alternative measurement strategies.
S8-2 Main effect of gender
The likelihood-ratio test finds that the model including gender provides a better fit for the data than that without it, as indicated by the chi-squared statistics for the analysis using BERT-2 ((1) = 6352.47, p .001). Cosine similarity values of White American women are not significantly different from those of White American men (BERT-2 = 0.00021, SE = 0.00092, t(12,973,980) = 0.23) in the presence of an interaction (see Tables S4 and S5).
Alternative measurement strategies using BERT and RoBERTa yield somewhat dissimilar results with that of BERT-2 (see Tables S4 and S6). Using likelihood-ratio tests, we find that the models including gender provide better fits for the data than those without it, as indicated by the chi-squared statistics for the analysis using BERT-3 ((1) = 11481.17, p .001), RoBERTa-2 ((1) = 48861.29, p .001), and RoBERTa-3 ((1) = 5591.13, p .001). Cosine similarity values of White American women are greater than those of White American men across all alternative measurement strategies ( BERT-3 = -0.021, RoBERTa-2 = -0.11, RoBERTa-3 = -0.095, SEs = 0.00091, 0.00095, 0.00096, t(12,973,980)s = -22.61, -117.75, -99.70).
The Sentence-BERT models also yield somewhat dissimilar results with that of BERT-2 (see Tables S4 and S7). Using likelihood-ratio tests, we find that the models including gender provide better fits for the data than those without it, as indicated by the chi-squared statistics for all-mpnet-base-v2 ((1) = 53129.67, p .001), all-distilroberta-v1 ((1) = 32470.77, p .001), and all-MiniLM-L12-v2 ((1) = 9010.33, p .001). When using the all-mpnet-base-v2 model, cosine similarity values of White American women are 0.0036 standard deviations greater than those of men (SE = 0.00078, t(12,973,980) = -4.61), when using the all-distilroberta-v1 model, cosine similarity values of White American are 0.035 standard deviations smaller than those of men (SE = 0.00077, t(12,973,980) = 45.44), and when using the all-MiniLM-L12-v2 model, cosine similarity values of White American women are 0.040 standard deviations smaller than those of men (SE = 0.00076, t(12,973,980) = 52.52).
| Model | Comparison | df | |
| BERT-2 | M4 v. M2 | 326701.07∗ | 3 |
| M4 v. M1 | 6352.47∗ | 1 | |
| M4 v. M3 | 11888.15∗ | 3 | |
| BERT-3 | M4 v. M2 | 350811.99∗ | 3 |
| M4 v. M1 | 11481.17∗ | 1 | |
| M4 v. M3 | 10618.63∗ | 3 | |
| RoBERTa-2 | M4 v. M2 | 423818.22∗ | 3 |
| M4 v. M1 | 48861.29∗ | 1 | |
| M4 v. M3 | 1917.00∗ | 3 | |
| RoBERTa-3 | M4 v. M2 | 420810.29∗ | 3 |
| M4 v. M1 | 32820.55∗ | 1 | |
| M4 v. M3 | 5591.13∗ | 3 | |
| all-mpnetbase-v2 | M4 v. M2 | 951045.70∗ | 3 |
| M4 v. M1 | 53129.67∗ | 1 | |
| M4 v. M3 | 80643.97∗ | 3 | |
| all-distilroberta-v1 | M4 v. M2 | 723332.37∗ | 3 |
| M4 v. M1 | 32470.77∗ | 1 | |
| M4 v. M3 | 103107.16∗ | 3 | |
| all-MiniLM-L12-v2 | M4 v. M2 | 637185.08∗ | 3 |
| M4 v. M1 | 9010.33∗ | 1 | |
| M4 v. M3 | 50627.14∗ | 3 | |
| * |
| BERT-2 | ||||
| M1 | M2 | M3 | M4 | |
| Intercept | -0.21 | -0.018 | -0.22 | -0.21 |
| (0.16) | (0.16) | (0.16) | (0.16) | |
| African Americans | 0.33∗ | 0.33∗ | 0.33∗ | |
| (0.00065) | (0.00065) | (0.00092) | ||
| Asian Americans | 0.31∗ | 0.31∗ | 0.31∗ | |
| (0.00065) | (0.00065) | (0.00092) | ||
| Hispanic Americans | 0.18∗ | 0.18∗ | 0.12∗ | |
| (0.00065) | (0.00065) | (0.00092) | ||
| Women | 0.037∗ | 0.037∗ | 0.00021 | |
| (0.00047) | (0.00046) | (0.00092) | ||
| African Americans | 0.0097∗ | |||
| Women | (0.0013) | |||
| Asian Americans | 0.013∗ | |||
| Women | (0.0013) | |||
| Hispanic Americans | 0.12∗ | |||
| Women | (0.0013) | |||
| N | 12974000 | 12974000 | 12974000 | 12974000 |
| Log likelihood | -15985323 | -16145340 | -15982157 | -15976230 |
| * | ||||
| BERT-3 | RoBERTa-2 | RoBERTa-3 | ||||||||||||
| M1 | M2 | M3 | M4 | M1 | M2 | M3 | M4 | M1 | M2 | M3 | M4 | |||
| Intercept | -0.21 | -0.24 | -0.24 | -0.22 | -0.26 | -0.053 | -0.31 | -0.31 | -0.26 | -0.043 | -0.30 | -0.31 | ||
| (0.16) | (0.16) | (0.16) | (0.16) | (0.14) | (0.14) | (0.14) | (0.14) | (0.14) | (0.14) | (0.14) | (0.14) | |||
| African Americans | 0.35∗ | 0.35∗ | 0.35∗ | 0.39∗ | 0.39∗ | 0.41∗ | 0.38∗ | 0.38∗ | 0.41∗ | |||||
| (0.00064) | (0.00064) | (0.00091) | (0.00067) | (0.00067) | (0.00095) | (0.00068) | (0.00068) | (0.00096) | ||||||
| Asian Americans | 0.31∗ | 0.31∗ | 0.31∗ | 0.37∗ | 0.37∗ | 0.38∗ | 0.38∗ | 0.38∗ | 0.39∗ | |||||
| (0.00064) | (0.00064) | (0.00091) | (0.00067) | (0.00067) | (0.00095) | (0.00068) | (0.00068) | (0.00096) | ||||||
| Hispanic Americans | 0.20∗ | 0.20∗ | 0.14∗ | 0.26∗ | 0.26∗ | 0.25∗ | 0.27∗ | 0.27∗ | 0.25∗ | |||||
| (0.00064) | (0.00064) | (0.00091) | (0.00067) | (0.00067) | (0.00095) | (0.00068) | (0.00068) | (0.00096) | ||||||
| Women | 0.049∗ | 0.049∗ | 0.021∗ | 0.11∗ | 0.11∗ | 0.11∗ | 0.087∗ | 0.087∗ | 0.095∗ | |||||
| (0.00046) | (0.00045) | (0.00091) | (0.00048) | (0.00048) | (0.00095) | (0.00049) | (0.00048) | (0.00096) | ||||||
| African Americans | -0.0066∗ | -0.034∗ | -0.053∗ | |||||||||||
| Women | (0.0013) | (0.0013) | (0.0014) | |||||||||||
| Asian Americans | 0.011∗ | -0.017∗ | -0.026∗ | |||||||||||
| Women | (0.0013) | (0.0013) | (0.0014) | |||||||||||
| Hispanic Americans | 0.11∗ | 0.023∗ | 0.044∗ | |||||||||||
| Women | (0.0013) | (0.0013) | (0.0014) | |||||||||||
| N | 12974000 | 12974000 | 12974000 | 12974000 | 12974000 | 12974000 | 12974000 | 12974000 | 12974000 | 12974000 | 12974000 | 12974000 | ||
| Log likelihood | -15827061 | -15996577 | -15821332 | -15816040 | -16443029 | -16630468 | -16418609 | -16417668 | -16473120 | -16667020 | -16456723 | -16453945 | ||
| * | ||||||||||||||
| all-mpnet-base-v2 | all-distilroberta-v1 | all-MiniLM-L12-v2 | ||||||||||||
| M1 | M2 | M3 | M4 | M1 | M2 | M3 | M4 | M1 | M2 | M3 | M4 | |||
| Intercept | -0.33 | -0.045 | -0.38 | -0.34 | -0.28 | -0.035 | -0.31 | -0.26 | -0.26 | -0.018 | -0.28 | -0.24 | ||
| (0.20) | (0.20) | (0.20) | (0.20) | (0.20) | (0.20) | (0.20) | (0.20) | (0.21) | (0.21) | (0.21) | (0.21) | |||
| African Americans | 0.49∗ | 0.49∗ | 0.45∗ | 0.44∗ | 0.44∗ | 0.39∗ | 0.37∗ | 0.37∗ | 0.32∗ | |||||
| (0.00056) | (0.00056) | (0.00078) | (0.00055) | (0.00055) | (0.00077) | (0.00054) | (0.00054) | (0.00076) | ||||||
| Asian Americans | 0.41∗ | 0.41∗ | 0.41∗ | 0.35∗ | 0.35∗ | 0.35∗ | 0.37∗ | 0.37∗ | 0.37∗ | |||||
| (0.00056) | (0.00056) | (0.00078) | (0.00055) | (0.00055) | (0.00077) | (0.00054) | (0.00054) | (0.00076) | ||||||
| Hispanic Americans | 0.44∗ | 0.44∗ | 0.30∗ | 0.32∗ | 0.32∗ | 0.16∗ | 0.31∗ | 0.31∗ | 0.20∗ | |||||
| (0.00056) | (0.00056) | (0.00078) | (0.00055) | (0.00055) | (0.00077) | (0.00054) | (0.00054) | (0.00076) | ||||||
| Women | 0.090∗ | 0.090∗ | 0.0036∗ | 0.069∗ | 0.069∗ | -0.035∗ | 0.036∗ | 0.036∗ | -0.040∗ | |||||
| (0.00041) | (0.00039) | (0.00078) | (0.00040) | (0.00039) | (0.00077) | (0.00039) | (0.00038) | (0.00076) | ||||||
| African Americans | 0.074∗ | 0.11∗ | 0.089∗ | |||||||||||
| Women | (0.0011) | (0.0011) | (0.0011) | |||||||||||
| Asian Americans | 0.00094 | 0.0040∗ | 0.0041∗ | |||||||||||
| Women | (0.0011) | (0.0011) | (0.0011) | |||||||||||
| Hispanic Americans | 0.27∗ | 0.30∗ | 0.21∗ | |||||||||||
| Women | (0.0011) | (0.0011) | (0.0011) | |||||||||||
| N | 12974000 | 12974000 | 12974000 | 12974000 | 12974000 | 12974000 | 12974000 | 12974000 | 12974000 | 12974000 | 12974000 | 12974000 | ||
| Log likelihood | -13963035 | -14409302 | -13936641 | -13896337 | -13688288 | -14031048 | -13672188 | -13620652 | -13518740 | -13831621 | -13514259 | -13488964 | ||
| * | ||||||||||||||
Appendix S9 Robustness to pre-processing steps
As proposed in the pre-registration, we test the robustness of our findings to the set of pre-processing steps used. In addition to lower-casing, removing non-alphanumeric characters and extra whitespaces, we remove all word signaling race/ethnicity (words like African, Asian, Hispanic, and White) and gender (man and woman). Then, we induce sentence embeddings using BERT-2 as we do for the pre-registered analysis.
S9-1 Main effect of race/ethnicity
The effect of race/ethnicity is robust to the pre-processing steps used. Using the likelihood-ratio test, we find that the model including race/ethnicity provides a better fit for the data than that without it, as indicated by the chi-squared statistics for the analysis using BERT-2 ((3) = 292143.45, p .001). Cosine similarity values of African, Asian, and Hispanic Americans are each 0.34 (SE = 0.00066, t(12,973,984) = 507.56), 0.28 (SE = 0.00066, t(12,973,984) = 417.38), and 0.18 (SE = 0.00066, t(12,973,984) = 270.42) standard deviations greater than those of White Americans, respectively.
S9-2 Main effect of gender
The effect of gender is also robust to the pre-processing steps used. Using the likelihood-ratio test, we find that the model including gender provides a better fit for the data than that without it, as indicated by the chi-squared statistics for the analysis using BERT-2 ((1) = 23781.24, p .001). Cosine similarity values of women are 0.073 (SE = 0.00047, t(12,973,986) = 154.28) standard deviations greater than those of men.
S9-3 Interaction effect
The interaction effect between race/ethnicity and gender is not entirely robust to the pre-processing steps used. Using the likelihood-ratio test, we find that the model including the interaction term provides a better fit for the data than that without it, as indicated by the chi-squared statistics for the analysis using BERT-2 ((3) = 6961.27, p .001). As with the pre-registered analysis, African, Asian, and Hispanic women hold higher cosine similarity values than their male counterparts (zs = -55.39, -67.09, -148.53, ps .001), but White American women also hold greater cosine similarity values than their male counterpart (z = -41.14, p .001).
Appendix S10 Differential compliance
We report the number of non-compliant completions in the initial round of data collection by race/ethnicity, gender, and text format. Some examples of non-compliant completions are: “As an AI language model, I am committed to promoting inclusivity and avoiding stereotypes or perpetuating negative narratives. I would be happy to provide you with a story that is focused on resilience and triumph instead. Let me know if you would like that.” and “As an AI language model programmed to contribute positively and responsibly, I am committed to not perpetuating stereotypes or engaging in any form of racial profiling or discrimination. Please feel free to ask any other kind of question, and I’ll be more than happy to help!”.
S10-1 Race/ethnicity
-
•
African Americans: 35
-
•
Asian Americans: 6
-
•
Hispanic Americans: 2
-
•
White Americans: 3
S10-2 Gender
-
•
Men: 38
-
•
Women: 12
S10-3 Text format
-
•
Character description: 1
-
•
Funny story: 13
-
•
Horror story: 33
-
•
Tragic story: 3
-
•
All other text formats: 0