Continuous loading of magneto-optical trap of Rb at narrow transition
Abstract
We report continuous loading of Rb atoms in a magneto-optical trap (MOT) at narrow linewidth, 420 nm 5S1/2, F 6P3/2, F blue transition (blue MOT). Continuous loading of the blue MOT is achieved by superimposing the blue laser beam, inside a hollow core of infrared laser beam driving the broad 5S1/2, F 5P3/2, F transition at 780 nm. We typically load atoms in the blue MOT in 2.5 seconds. We characterize the continuous loading of blue MOT with various parameters such as magnetic field gradient, detuning, power and diameter of blue MOT beam and diameter of the hollow core (spot) inside the IR MOT beam. We observe that the blue laser beam should overfill the spot of the IR laser beam. This is because the blue laser cools the atoms to a lower temperature even in the presence of the broad IR laser i.e. in the overlapped region and hence helps in loading. We also present the theoretical framework for cooling atoms in the presence of simultaneously two transitions to support the experimental result. This method of continuous loading of the blue MOT can be useful to produce a continuous atomic beam of cold Rb atoms.
I Introduction
Magneto-optical trapping (MOT) is the workhorse for all cold atom experiments and is the basis of modern areas of research in quantum science and technology such as quantum computation and simulation, and quantum sensors. For MOT, the linewidth of transition plays an important role. MOT at broader linewidth compared to narrow linewidth transition provides faster loading with higher capture velocity but the final temperature happens to be higher. In order to achieve more number of atoms in MOT with low temperature, two steps MOT is utilized [1, 2, 3, 4, 5, 6, 7, 8, 9, 10]. In the first step, atoms are loaded in MOT at a broad linewidth transition and in the second step, atoms are transferred to the MOT at a narrow linewidth transition to achieve lower temperature, which means these two steps are separated in time. Instead of separating these two steps in time, one can also separate in space which results in the continuous loading of atoms in MOT and was the key process for producing continuous BEC of Sr [11]. Continuous loading of the atoms in MOT at narrow transition can enable us to generate a continuous beam of the cold atoms at lower temperatures which offers a great advantage for atomic-based quantum sensors as it eliminates dead time.
The two steps MOT has been realized in Yb [1, 2], Sr [3, 11], Dy [4, 12, 13, 5], Er [14, 15, 16] and Cd [17] (where the ratio of the linewidth of broad to narrow transition is in orders of magnitude) and also in alkali elements [6, 7, 8, 9, 18] (where the ratio is times). The continuous loading of the MOT at narrow transition pre-cooled by broad transition has been realized for certain elements Yb [1], Sr [11] and Dy [5]. In the case of Yb, continuous loading of MOT at narrow transition is superior in terms of the number of atoms and of course temperature [1, 19, 20]. Yb MOT at broader transition has less number of atoms (even in the presence of repumper lasers [21]) as compared to the narrow transition. The MOT for alkali atoms at narrow transitions in Li [6], K [7], Rb [9, 18] has been realized but continuous loading has not been reported yet. We use core-shell MOT similar to the Yb [19] where a huge advantage was reported. In the scheme, a hole is created in the core of the laser beam driving the broad transition which is filled by the laser beam at a narrow transition. The relative dimension of the core and the filling beam is very important and depends upon the ratio of broad and narrow linewidth transition. In the case of Yb, the ratio of the linewidth of broad to narrow transition is around 150 and the core should be just filled as in the presence of the broad linewidth laser the weak transition laser (with intensity comparable to the saturation intensity) does not play a significant role in reducing the temperature. The case can be different in alkali atoms where the linewidths of the broad and narrow transitions are only 4-5 times. In this case, the filling area should be bigger than the core area as in the overlapped region, the narrow transition linewidth plays a role in reducing the temperature even in the presence of the broad transition.
In this paper, we present a method to load atoms continuously in the narrow-line MOT by superimposing the narrow-line beam inside the core of the broad transition beam. Using Rubidium atoms, we demonstrate the loading of atoms continuously in the blue MOT at 420 nm using 5S1/2, F 6P3/2, F transition. We study the behaviour of the blue MOT with various parameters such as magnetic field gradient, detuning, power and diameter of blue MOT beam and diameter of the spot inside the IR MOT beam.
The paper is organized as follows. In section II, we describe the experimental set-up. In section III, we describe the theoretical model for the calculation of force, diffusion and temperature in the presence of the two transitions at 780 nm and 420 nm. In section IV, we study the various effects due to magnetic-field gradient, detuning, power and diameter of the blue MOT laser and diameter of the spot on the IR MOT laser. In section V, we summarize our findings.
II Experimental Set- up
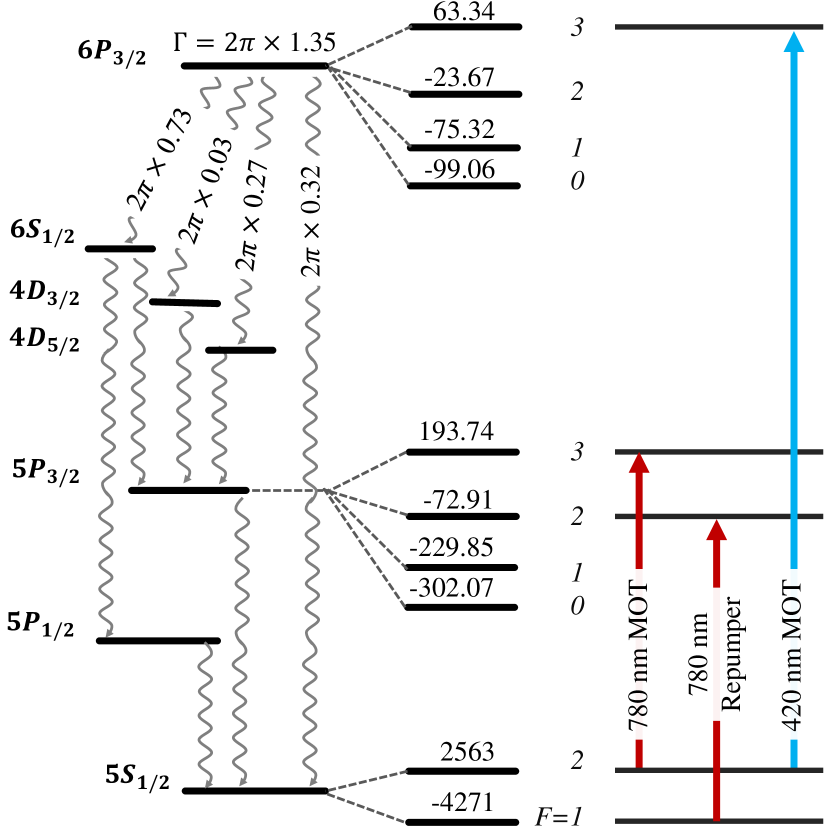
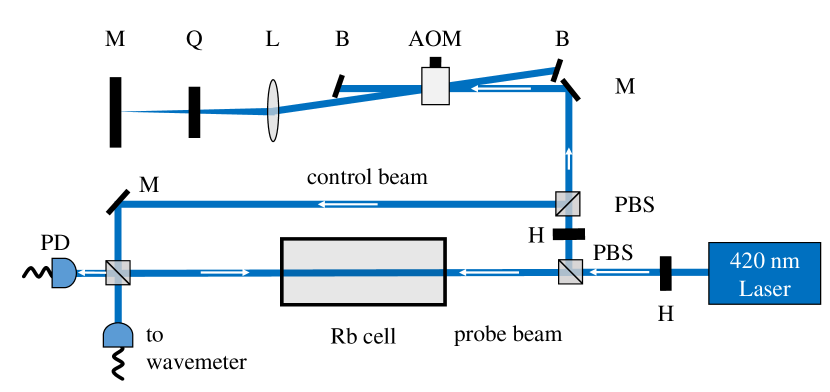
The relevant energy level diagram and corresponding transitions utilized in this study are shown in Fig. 1. The laser system comprises one commercially (Toptica) available 420 nm (blue) external cavity diode laser (ECDL) and two home-assembled 780 nm (IR) ECDLs. The blue laser is divided into two parts: one for its frequency stabilization using saturation absorption spectroscopy (SAS) and the second for trapping the atoms in the blue MOT. Fig. 2 depicts the schematics of the SAS setup. The probe beam is passed through one Rb vapor cell and detected on a high-speed and blue color-sensitive photo-detector (make: Thorlabs, model: APD430A2/M). The vapor cell is kept inside an oven at °C. The other part of blue laser beam is sent through an AOM in double-pass configuration. It is up-shifted by around MHz and is sent through the cell as a control beam with counter-propagating to the probe beam. This central frequency is adjusted to vary the detuning () of the blue MOT beam. The AOM frequency is modulated at 10 kHz to generate the error signal. Note that the probe beam is not modulated and thus gives a better signal-to-noise ratio than when it is modulated. The laser is locked corresponding to the 5S1/2, F 6P3/2, F peak. A portion of the leak beam is used for monitoring the single-mode operation and the wavelength of the 420 nm laser using a wavelength meter (make: Highfinesse GmbH, model: WS7-60).
The second part of the blue beam is passed through another AOM at MHz, and its first-order beam is sent to the mixing scheme as shown in Fig. 3(a) after expanding it by ten times. This AOM is used for switching the blue beam on and off and varying its power. An iris is used for changing the diameter of the blue beam ().
Polarization spectroscopy is employed for the two IR laser’s frequency stabilization, as described in [9]. The IR MOT laser is locked to 5S1/2, F 5P3/2, F cross-over peak and IR repumper laser is locked to 5S1/2, F 5P3/2, F peak. Other parts of the IR MOT and repumper lasers are sent through two different AOMs at MHz and MHz, respectively to address the 5S1/2, F 5P3/2, F and 5S1/2, F 5P3/2, F transitions. The first-order diffracted beams are then expanded ten times individually and sent to the mixing scheme, as shown in Fig. 3(a).
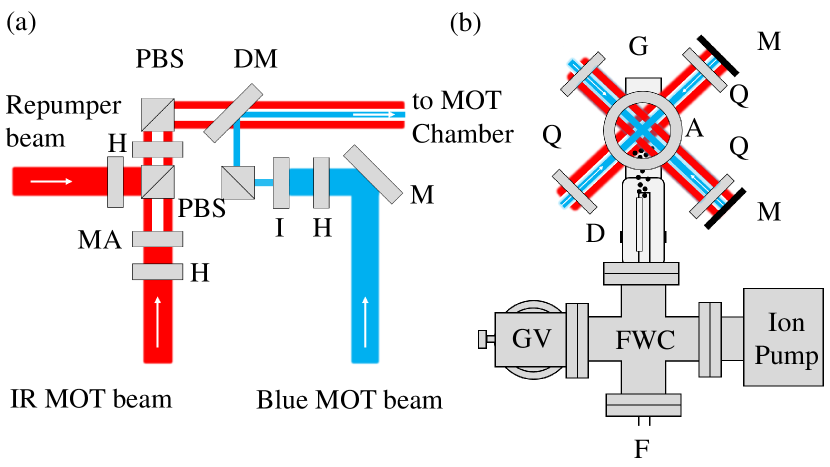
On the path of the IR MOT beam, a circular mask (MA) is introduced so that a hollow core of diameter can be created inside the IR MOT beam. IR beams are then mixed on a polarizing beam splitter (PBS) and made the same polarized using another PBS and a half-plate. The vertical polarized beam from the PBS is mixed with the vertical polarized blue MOT beam using a dichroic mirror and made co-propagated, as shown in Fig. 3(a). The other two arms of the MOT beams with the same polarization are generated from the horizontally polarized beams from the PBS using two half wave-plates, two PBS, and two dichroic mirrors (not shown in the schematics for simplification). All the beam’s maximum diameter is limited to 16 mm due to the limitation set by the maximum diameter of the half wave-plates used in this experiment.
Three arms are then made circularly polarized using dual quarter wave-plates, sent to the rectangular glass MOT chamber, and retro-reflected back using a combination of dual quarter wave-plates and mirrors (as shown in Fig. 3(b)). The configuration of the MOT set-up is the same as in [9]. Atomic Rb vapors are introduced into the chamber by passing 2.15 A electric current to a dispenser (AlfaSource AS-Rb-0090-2C) inside the glass chamber.
The absorption imaging technique is used to capture the image of the atomic cloud on a CMOS camera (Thorlabs, CS135MUN) using an imaging beam. The imaging beam is MHz red detuned from the 5S1/2, F 5P3/2, F transition. It is generated using double-pass AOM and is coupled to a single-mode fiber. The camera’s exposure time is 100 s, and the imaging beam is turned on for 52 s during the imaging cycle. The temperature of the cloud is determined from the time of flight method.
III Theory
In order to analyse the cooling mechanism in the presence of both transitions, we use the density matrix approach in one dimension. We consider that two (counter-propagating) laser beams are driving the transition (5S1/2, F=2) (5P3/2, F=3) at 780 nm and two (counter-propagating) laser beams are driving the transition (5S1/2, F=2) (6P3/2, F=3) at 420 nm.
The Hamiltonian () for the three level system can be written as
| (1) | ||||
Solving the density matrix equation for the above involves a complicated procedure [22, 23]. However, we can approximate it as two separate V-systems, one for laser beams 780 nm and 420 nm propagating in the positive direction with detuning and and second for laser beams 780 nm and 420 nm propagating in the negative direction with detuning and . For the atoms moving in the positive direction with velocity , the , , and . Here, and and and are detuning of the 780 nm and 420 nm lasers for stationary atoms. The absorption of the lasers is determined by the density matrix elements which are solved by Lindblad equation [22]. The absorption of 780 nm laser beam propagating in positive and negative directions are given by Im() and Im() respectively, similarly for the blue beams it is given by Im() and Im(). The damping force on the atoms in the presence of the two lasers can be given as
| (2) |
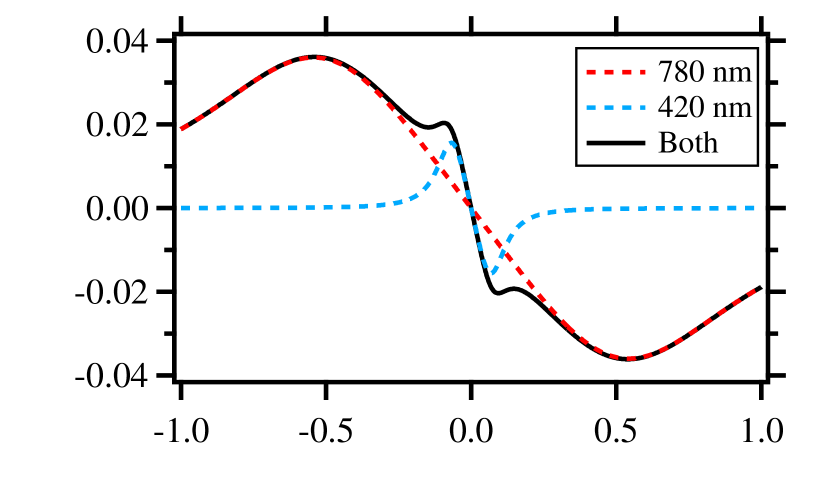
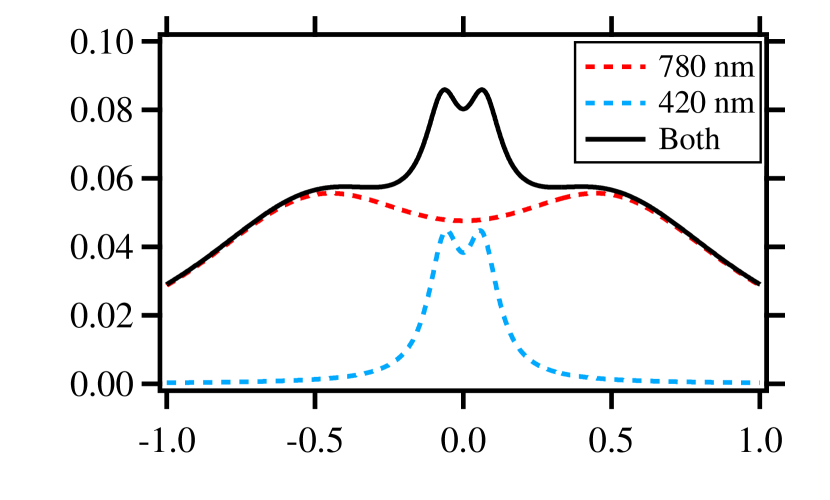
The normalized force, vs normalized velocity, is plotted in Fig. 4(a). The parameters used for this plot are and for both the lasers. Here, is the linewidth of the 780 (420) nm transition and is the saturation intensity. The red (blue) dash line corresponds to the force in presence of only 780 (420) nm laser. The black solid line represents the net force in presence of both the lasers. For very low velocity the, , where is known as damping coefficient. From Fig. 4(a), it is clear that and , where is the in presence of only 780 (420) nm laser and is the in presence of both the lasers. This implies that once the atoms are cooled by the IR laser in the outer region and enters into the overlapped region of the IR and blue laser, then the atoms are further cooled down dominantly by the blue laser.
The diffusion coefficient in presence of both the driving lasers can be given as
| (3) |
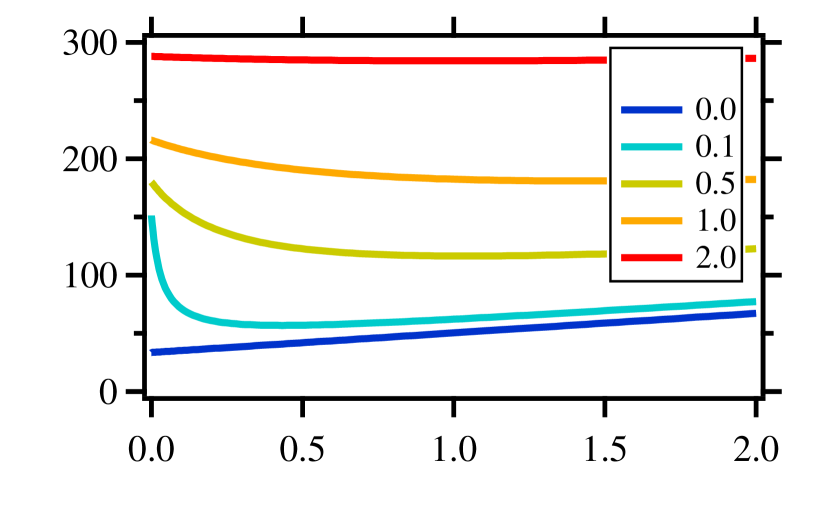
The normalized diffusion coefficient, vs normalized velocity, is shown in Fig. 4(b) for the same parameters as in Fig. 4(a). Then the effective temperature is found using the Einstein relation, , where is the diffusion coeffcient at zero velocity and is Boltzmann constant[24]. The temperature vs intensity of the 420 nm laser () is plotted in Fig. 5 for various intensity of 780 nm laser (). In absence of the 780 nm laser (dark blue line), decreases linearly with decrease in and reaches the Doppler temperature () corresponding to the blue transition, given by K.
Note that at 780 nm is K. As the intensity of the IR laser increases, the also increases. However, decreases in presence of the 420 nm laser, as shown by the light blue curve in Fig. 5. For fixed IR laser intensity (/), initially decreases with increase in , reaches a minimum and then increases with further increase in I420. This effect is more prominent for low values of /. This is because at low intensity, the net drag coeffcient in presence of both the lasers is dominated by the , but net diffusion coefficient is dominated by . At high intensity of the 780 nm laser, cooling by 420 nm laser is ineffective as shown by the red curve.
Note that for low intensities (in the comparison to saturation intensities) of 780 nm and 420 nm lasers beams, the V-systems behaves as two separate two levels systems ( and ). The for very less intensity of 780 nm and 420 nm is given as
| (4) |
Here, is the saturation parameter of the 780 (420) nm laser.
IV Results and Discussion
Initially, the diameter of all the beams is kept at a maximum, i.e. 16 mm. The diameter of the spot introduced in the core of the IR MOT beam is, = 6 mm and super imposed with the blue beam. The total power of the IR MOT, repumper, and blue MOT beam are 50 mW, 13 mW, and 25 mW, respectively. Detuning of the respective lasers are MHz, MHz, and MHz, respectively. A magnetic field gradient () of 12.6 G/cm is produced using an anti-helmholtz coil. We observe that the no. of atoms in the blue MOT () saturates to , and its loading time is s. It is the same as the loading time of the IR MOT without spot.
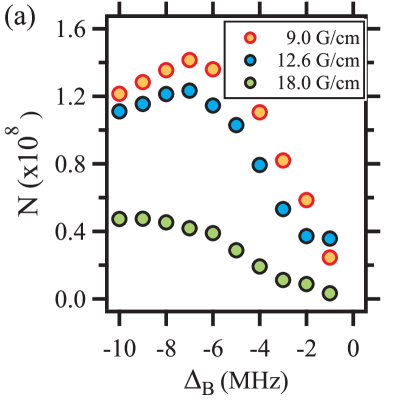
We study the effect of detuning of the blue laser () on the no. of atoms () at three different magnetic field gradient. The blue laser’s power () is 25 mW. As shown in Fig. 6(a), increases slightly to at G/cm when is changed from MHz to MHz. When is further varied towards resonance, decreases, and the MOT disappears. When the magnetic field gradient is increased (decreased) to 18 G/cm (9 G/cm), decreases (increases).
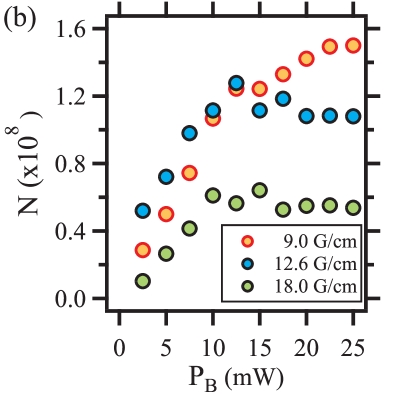
Next, we vary the power of the blue laser () at MHz and study its effect on at three different magnetic field gradients, as shown in Fig. 6(b). At G/cm (green circle), with increase in from 2.5 mW to 10 mW, increases to and saturates with further increase in . Similar trends are observed for G/cm (blue circle) and G/cm (orange circle). However, for to reach saturation increases with increase in magnetic field gradients.
We then switch off the IR MOT beam and optimize the blue MOT to decrease its temperature by lowering its power to 5 mW and changing its detuning to MHz. After a hold time of 20 ms, the blue MOT beam and the magnetic field are switched off. We measure the temperature of the blue MOT to be around K.
To study the effect of the diameter of the blue beam (), we measure the no. of atoms in the blue MOT () at different . Fig. 7(a) shows the vs data for the 6 mm diameter of the spot (). We observe that, with increase in from 4 mm to 8 mm, increases from to . With further increase in , there is no significant improvement in . A similar trend is observed for the spot size of 3 mm. We observe that for better loading of the continuous blue MOT, the diameter of the blue beam should be bigger than the diameter of the spot.
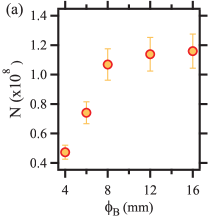
Next, we study the no. of atoms in the blue MOT () for three different diameters of the spot. Fig. 7(b) shows the variation of vs data for the 16 mm diameter of the blue beam (). When is 3 mm and 6 mm, we observe similar no. of atoms in the blue MOT (i.e. ). With further increase in to 9 mm, significantly drops to . Although corresponding to mm and mm are approximately the same, the lifetime of the blue MOT with mm is around three times lower than the lifetime with mm.
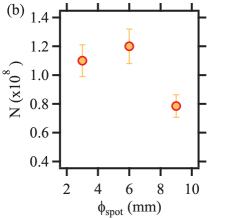
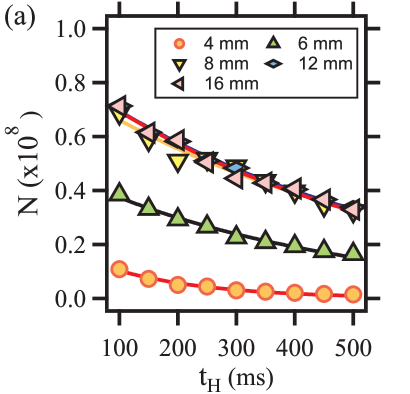
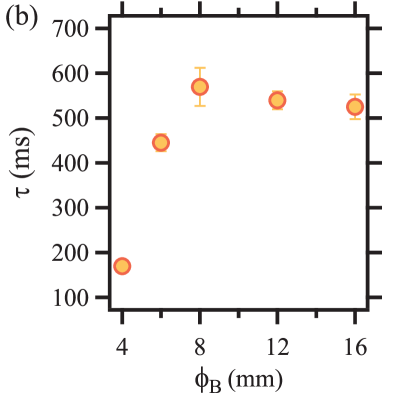
We further study the effect of the diameter of the blue beam () on the lifetime () of the blue MOT. First, we measure the no. of atoms in the blue MOT () at different hold times () of the blue MOT and fit the vs data with the equation: . Fig. 8(a) shows the variation of with at different for the blue MOT with spot size 6 mm. Fig. 8(b) shows the corresponding lifetime () with . We observe that when is 4 mm, the lifetime of the blue MOT is around 180 ms. It increases to 550 ms when is increased to 8 mm and then remains the same even after increasing the to 16 mm.
V Conclusions
In summary, we have demonstrated the continuous loading of Rb atoms in the blue MOT with a typical number of atoms in 2.5 s. The continuous loading of the blue MOT is achieved by superimposing the blue laser beam inside the hollow core (spot) of the IR laser beam driving the broad transition. In order to achieve maximum loading, the spot size should be 6 mm for the total diameter of 16 mm for the IR laser beam and the size of the blue laser beam should be more than 12 mm. This means that the blue laser beam should overfill the spot of the IR laser beam. We have also measured the lifetime of the blue MOT with various diameters of the blue laser beam and found around 500 ms for a beam diameter of more than 8 mm. This method of continuous loading of the blue MOT can be useful to produce continuous atomic beams of cold Rb atoms.
Acknowledgements.
RCD would like to acknowledge the Ministry of Education, Government of India, for the Prime Minister’s Research Fellowship (PMRF). K.P. would like to acknowledge the funding from DST through Grant No. DST/ICPS/QuST/Theme-3/2019.References
- Kuwamoto et al. [1999] T. Kuwamoto, K. Honda, Y. Takahashi, and T. Yabuzaki, Magneto-optical trapping of yb atoms using an intercombination transition, Phys. Rev. A 60, R745 (1999).
- Pandey et al. [2010] K. Pandey, K. D. Rathod, A. K. Singh, and V. Natarajan, Atomic fountain of laser-cooled yb atoms for precision measurements, Phys. Rev. A 82, 043429 (2010).
- Yang et al. [2015] T. Yang, K. Pandey, M. S. Pramod, F. Leroux, C. C. Kwong, E. Hajiyev, Z. Y. Chia, B. Fang, and D. Wilkowski, A high flux source of cold strontium atoms, The European Physical Journal D 69, 226 (2015).
- Lu et al. [2011a] M. Lu, S. H. Youn, and B. L. Lev, Spectroscopy of a narrow-line laser-cooling transition in atomic dysprosium, Phys. Rev. A 83, 012510 (2011a).
- Maier et al. [2014] T. Maier, H. Kadau, M. Schmitt, A. Griesmaier, and T. Pfau, Narrow-line magneto-optical trap for dysprosium atoms, Opt. Lett. 39, 3138 (2014).
- Duarte et al. [2011] P. M. Duarte, R. A. Hart, J. M. Hitchcock, T. A. Corcovilos, T.-L. Yang, A. Reed, and R. G. Hulet, All-optical production of a lithium quantum gas using narrow-line laser cooling, Phys. Rev. A 84, 061406 (2011).
- McKay et al. [2011] D. C. McKay, D. Jervis, D. J. Fine, J. W. Simpson-Porco, G. J. A. Edge, and J. H. Thywissen, Low-temperature high-density magneto-optical trapping of potassium using the open transition at 405 nm, Phys. Rev. A 84, 063420 (2011).
- Sebastian et al. [2014] J. Sebastian, C. Gross, K. Li, H. C. J. Gan, W. Li, and K. Dieckmann, Two-stage magneto-optical trapping and narrow-line cooling of 6li atoms to high phase-space density, Phys. Rev. A 90, 033417 (2014).
- Das et al. [2023] R. C. Das, D. Shylla, A. Bera, and K. Pandey, Narrow-line cooling of 87rb using 5s1/2 6p3/2 open transition at 420 nm, Journal of Physics B: Atomic, Molecular and Optical Physics 56, 025301 (2023).
- Miyazawa et al. [2021] Y. Miyazawa, R. Inoue, H. Matsui, K. Takanashi, and M. Kozuma, Narrow-line magneto-optical trap for europium, Phys. Rev. A 103, 053122 (2021).
- Chen et al. [2022] C.-C. Chen, R. González Escudero, J. Minář, B. Pasquiou, S. Bennetts, and F. Schreck, Continuous bose–einstein condensation, Nature 606, 683 (2022).
- Lu et al. [2010] M. Lu, S. H. Youn, and B. L. Lev, Trapping ultracold dysprosium: A highly magnetic gas for dipolar physics, Phys. Rev. Lett. 104, 063001 (2010).
- Lu et al. [2011b] M. Lu, N. Q. Burdick, S. H. Youn, and B. L. Lev, Strongly dipolar bose-einstein condensate of dysprosium, Phys. Rev. Lett. 107, 190401 (2011b).
- Berglund et al. [2008] A. J. Berglund, J. L. Hanssen, and J. J. McClelland, Narrow-line magneto-optical cooling and trapping of strongly magnetic atoms, Phys. Rev. Lett. 100, 113002 (2008).
- Frisch et al. [2012] A. Frisch, K. Aikawa, M. Mark, A. Rietzler, J. Schindler, E. Zupanič, R. Grimm, and F. Ferlaino, Narrow-line magneto-optical trap for erbium, Phys. Rev. A 85, 051401 (2012).
- Seo et al. [2020] B. Seo, P. Chen, Z. Chen, W. Yuan, M. Huang, S. Du, and G.-B. Jo, Efficient production of a narrow-line erbium magneto-optical trap with two-stage slowing, Phys. Rev. A 102, 013319 (2020).
- Yamaguchi et al. [2019] A. Yamaguchi, M. S. Safronova, K. Gibble, and H. Katori, Narrow-line cooling and determination of the magic wavelength of cd, Phys. Rev. Lett. 123, 113201 (2019).
- Ding et al. [2022] R. Ding, A. Orozco, J. Lee, and N. Claussen, Narrow-linewidth laser cooling for rapid production of low-temperature atoms for high data-rate quantum sensing, Tech. Rep. (Sandia National Laboratories is a multi mission laboratory managed and operated by National Technology and Engineering Solutions of Sandia, LLC, a wholly owned subsidiary of Honey well International, Inc., for the U. S. Department of Energy’s National Nuclear Security Administration under contract DE-NA-0003525., 2022).
- Lee et al. [2015] J. Lee, J. H. Lee, J. Noh, and J. Mun, Core-shell magneto-optical trap for alkaline-earth-metal-like atoms, Phys. Rev. A 91, 053405 (2015).
- Plotkin-Swing et al. [2020] B. Plotkin-Swing, A. Wirth, D. Gochnauer, T. Rahman, K. E. McAlpine, and S. Gupta, Crossed-beam slowing to enhance narrow-line ytterbium magneto-optic traps, Review of Scientific Instruments 91, 093201 (2020), https://pubs.aip.org/aip/rsi/article-pdf/doi/10.1063/5.0011361/14798714/093201_1_online.pdf .
- Cho et al. [2012] J. W. Cho, H.-g. Lee, S. Lee, J. Ahn, W.-K. Lee, D.-H. Yu, S. K. Lee, and C. Y. Park, Optical repumping of triplet- states enhances magneto-optical trapping of ytterbium atoms, Phys. Rev. A 85, 035401 (2012).
- Nyakang’o and Pandey [2021] E. O. Nyakang’o and K. Pandey, Resolving closely spaced levels for doppler mismatched double resonance, Phys. Rev. A 103, 013107 (2021).
- Nyakang’o and Pandey [2020] E. O. Nyakang’o and K. Pandey, Role of velocity induced coherent population oscillation in saturated fluorescence spectroscopy, The European Physical Journal D 74, 1434 (2020).
- Chang and Minogin [2002] S. Chang and V. Minogin, Density-matrix approach to dynamics of multilevel atoms in laser fields, Physics Reports 365, 65 (2002).