Influence of temperature, doping, and amorphization on the electronic structure and magnetic damping of iron
Abstract
Hybrid magnonic quantum systems have drawn increased attention in recent years for coherent quantum information processing, but too large magnetic damping is a persistent concern when metallic magnets are used. Their intrinsic damping is largely determined by electron-magnon scattering induced by spin-orbit interactions. In the low scattering limit, damping is dominated by intra-band electronic transitions, which has been theoretically shown to be proportional to the electronic density of states at the Fermi level. In this work, we focus on body-centered-cubic iron as a paradigmatic ferromagnetic material. We comprehensively study its electronic structure using first-principles density functional theory simulations and account for finite lattice temperature, boron (B) doping, and structure amorphization. Our results indicate that temperature induced atomic disorder and amorphous atomic geometries only have a minor influence. Instead, boron doping noticeably decreases the density of states near the Fermi level with an optimal doping level of 6.25 %. In addition, we show that this reduction varies significantly for different atomic geometries and report that the highest reduction correlates with a large magnetization of the material. This may suggest materials growth under external magnetic fields as a route to explore in experiment.
I Introduction
Hybrid magnonics is gaining growing interest due to its potential for coherent quantum information processing [1, 2, 3, 4]. This was triggered by the experimental demonstration of coherent coupling between a magnon and a superconducting qubit, mediated by a microwave cavity, by Tabuchi et al. [5] As one key ingredient in hybrid magnonic systems, magnons possess unique advantages such as easily tunable resonance frequencies through external magnetic fields or materials anisotropy, microwave bandwidths that match state-of-the-art superconducting quantum devices, and intrinsic non-reciprocity that is promising for noise-resilient quantum state transduction [6, 4]. In recent years, more research has established coupling between magnons and microwave photons in a cavity or a coplanar circuit structure [7, 8, 9, 10].
However, one essential challenge is the damping of magnon excitations that limits the coherence time of hybrid quantum states [4, 11]. Therefore, exploring materials with low magnetic damping is crucial for achieving hybrid magnonic quantum devices with long coherence time. One of the best-known materials in this context is the ferrimagnetic insulator yttrium iron garnet (YIG), Y3Fe5O12, whose magnetic damping parameter can be as low as in bulk crystals [12]. However, insulators such as YIG are not desired for many spintronics applications that require a charge current through the material [13]. In addition, YIG is not well suited to be integrated into on-chip devices for circuit quantum electrodynamics due to experimental constraints. One of the reasons, is that in order to have sufficient crystalline quality for low damping, YIG films need to be grown on specific substrates for achieving epitaxy. The standard substrate choice for this task is gadolinium gallium garnet (GGG, Gd3Ga5O12), but at very low temperatures the increased magnetic susceptibility due to ordering of the Gd magnetic moments can increase the magnetic damping of YIG films considerably [14, 15, 16, 17, 18]. Ferromagnetic metals and alloys are an alternative category of promising materials that are significantly easier to integrate on-chip. It is therefore desirable to explore and optimize metallic magnets towards low magnetic damping for hybrid magnonic quantum devices [19].
A major contribution to magnetic damping in metallic magnets arises from conduction electrons that dissipate magnons through the spin-orbit (SO) interaction [20, 21, 22]. This mechanism is described by two early theories, the breathing Fermi surface (BFS) model and the later torque correlation (TC) model that were developed by Kamberský [23, 21]. The TC model is more general and describes how the SO torque induces intra-band () and inter-band () electronic transitions which are interpreted as conductivity-like and resistivity-like damping pathways for magnons, respectively [24, 22, 25, 26]. In its low scattering limit, when the spectral overlap between different bands is small, damping is largely dominated by the intra-band part, in agreement with the BFS model. Damping is shown to be approximately proportional to the electronic density of states (EDOS) at the Fermi level [23, 21, 27]. Many experimental works confirm that the lowest damping coincides with the lowest EDOS at the Fermi level (EDOS-FL) for ferromagnetic alloys such as cobalt-iron (Co-Fe) and iron-vanadium (Fe-V) [28, 29, 30]. Therefore, one practical way to reduce magnetic damping is to minimize EDOS-FL by electronic-structure engineering.
In this work, we focus on the paradigmatic ferromagnetic material, body-centered-cubic (BCC) iron (Fe). We use first-principles electronic-structure theory to comprehensively study its EDOS-FL under the conditions of (i) thermal atomic disorder, (ii) boron (B) doping, and (iii) structure amorphization. We account for the effect of thermal disorder on EDOS-FL since real devices always work at non-zero temperature, although for superconducting quantum devices the operating temperature can be extremely low. Typical superconducting quantum circuits, such as qubits, are operated at temperatures of a few 10s mK. Meanwhile, recent experimental work has shown that doping carbon (C) or B into ferromagnetic alloys can make the structure amorphous and reduce magnetic damping [31, 32]. Hence, it is interesting to investigate the origin of the reduced damping in doped amorphous alloys and the extent to which it can be attributed to reduced EDOS-FL. To explore this, we study the effects of B doping and structure amorphization individually and compare EDOS-FL for crystalline Fe doped with B and amorphous Fe, as well as pure crystalline Fe. Finally, we consider amorphous Fe with B doping to investigate the combined effect.
The remainder of this paper is organized as follows: We first introduce the methods that are used to construct our simulation cells including BCC Fe supercells with phonon excitations, BCC Fe supercells doped with B, amorphous Fe supercells, and amorphous Fe supercells doped with B, in Sec. II. The details of our DFT simulations are also explained in Sec. II. In Sec. III, we discuss our main results for the EDOS of the different structures. In general, we find that phonon excitations do not significantly change EDOS-FL up to at least 500 K. Doping B into BCC Fe decreases EDOS-FL, while making the Fe amorphous increases EDOS-FL. Overall, amorphous Fe doped with B can have lower EDOS-FL than pure BCC Fe. Finally, we give our conclusions in Sec. IV.
II Methodology
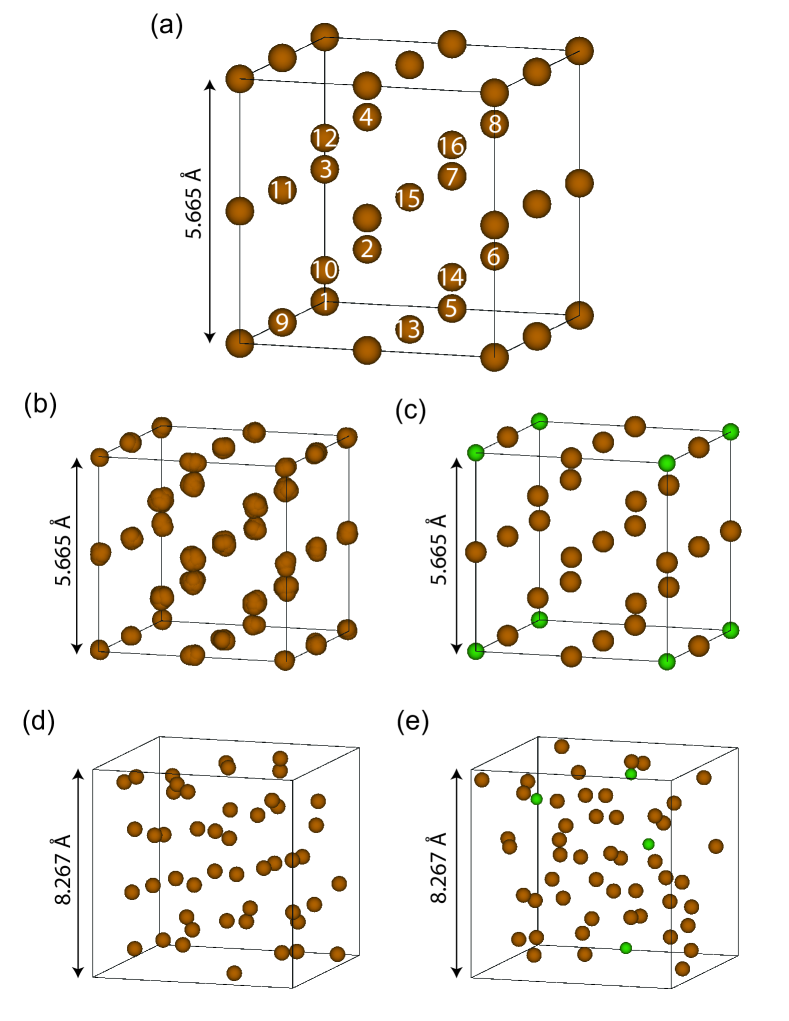
Thermal disorder of the atomic positions in the BCC Fe lattice is modeled by considering phonons that displace nuclei from their ideal 0 K lattice positions of the BCC crystal structure [see Fig. 1(a)]. Simulation cells of the thermally disordered lattice are constructed by superimposing harmonic phonon modes with random phases and amplitudes according to classical statistics at different temperatures [34]. In this work, we consider three different temperatures of 10 K, 300 K, and 500 K. For each temperature, 50 random snapshots of the disordered BCC Fe supercell are generated for simulations. In Fig. 1(b), we show the disordered supercell superimposing 50 snapshots for K as an example. The supercell snapshots for K and K are similar but with different amplitudes of the atomic displacements. For analyzing the EDOS, we average over all 50 snapshots for each temperature.
| class | degeneracy | representation | |
|---|---|---|---|
| 1 | 1 | 16 | 1 |
| 2 | 2 | 64 | 1, 2 |
| 3 | 24 | 1, 3 | |
| 4 | 24 | 1, 7 | |
| 5 | 8 | 1, 15 | |
| 3 | 6 | 192 | 1, 2, 3 |
| 7 | 192 | 1, 2, 7 | |
| 8 | 64 | 1, 2, 15 | |
| 9 | 48 | 1, 3, 5 | |
| 10 | 48 | 1, 3, 13 | |
| 11 | 16 | 1, 7, 11 | |
| 4 | 12 | 48 | 1, 2, 3, 4 |
| 13 | 384 | 1, 2, 3, 5 | |
| 14 | 96 | 1, 2, 3, 6 | |
| 15 | 192 | 1, 2, 3, 8 | |
| 16 | 384 | 1, 2, 3, 13 | |
| 17 | 96 | 1, 2, 3, 14 | |
| 18 | 96 | 1, 2, 3, 16 | |
| 19 | 48 | 1, 2, 7, 8 | |
| 20 | 128 | 1, 2, 7, 11 | |
| 21 | 96 | 1, 2, 7, 12 | |
| 22 | 96 | 1, 2, 7, 16 | |
| 23 | 16 | 1, 2, 15, 16 | |
| 24 | 12 | 1, 3, 5, 7 | |
| 25 | 16 | 1, 3, 5, 9 | |
| 26 | 48 | 1, 3, 5, 11 | |
| 27 | 48 | 1, 3, 5, 15 | |
| 28 | 12 | 1, 3, 13, 15 | |
| 29 | 4 | 1, 7, 11, 13 |
Lattice geometries for B doped BCC Fe are constructed using a cluster-expansion method which was used before for studying binary alloys [35, 36, 37, 38, 39, 40]. This method starts with a BCC Fe supercell with 16 atoms and replaces Fe atoms with B atoms. Generally, there are ways of distributing Fe atoms and B atoms, however, symmetries of the lattice structure reduce the total number of non-equivalent configurations to a few classes with different folds of degeneracy (see Table 1 for all different considered in this paper). Electronic-structure simulations are carried out for only one representative of each class, which significantly reduces the computational effort and allows us to study an alloy with +=16 atoms. In this work, we consider =1 (see Fig. 1(c) for Fe15B1), 2, 3, and 4 that correspondingly have 1, 4, 6, and 18 non-equivalent classes (see Table 1). For each doping level , we compute the EDOS by averaging over the non-equivalent classes weighted by their degeneracies (third column in Table 1). There are different methods to determine the weights used for averaging, introduced in Ref. [35], corresponding to different thermodynamic conditions of the alloy. The weights we use here correspond to a simplification of the strict regular solution, with the macroscopic alloy composition or doping level consisting exclusively of microscopic structures with exactly the same concentration of elements.
We construct amorphous Fe (a-Fe) atomic geometries by simulating heating and quenching processes using molecular dynamics (MD) simulations as implemented in the LAMMPS code [41]. The inter-atomic interactions between Fe atoms are described via a ‘magnetic’ interatomic potential that was developed by Dudarev and Derlet [42, 43, 44], based on the embedded atom method. The inter-atomic potential for our simulation is obtained from the OpenKim website [45, 46, 47, 48]. The same potential has been used previously [49] to generate a-Fe geometries and was shown to produce characteristic features observed in the experimentally measured radial distribution function (RDF) [50]. In our NVT canonical ensemble MD simulations, we use a supercell of BCC Fe with 2000 atoms. The system is then heated to 10,000 K using a Nosé-Hoover thermostat, leading to a completely liquid state. We then implement a cooling process where first the temperature is decreased to 4,000 K in 50 picoseconds (ps) and maintained at 4,000 K for 250 ps. Subsequently, is decreased to 3,000 K in 250 ps. Finally, is decreased to 300 K (room temperature) in 50 ps and maintained for another 50 ps. We compute the RDF for this final structure and find good agreement with the result from Ma et al. [49] and the experimental observation from Ichikawa [50] (see Fig. 1 in the supplemental information).
We then extract smaller cubic cells from this result, corresponding to volumes of a BCC Fe cell [see Fig. 1(d)], and use these for first-principles calculations of the electronic structure. We cut 10 such a-Fe snapshots from random positions of the large a-Fe structure, simulate all of them, and average the results. To generate a-Fe doped with B (a-FeB), we use a single a-Fe snapshot and randomly replace Fe atoms by B atoms according to the doping level [see Fig. 1(e)]. For each doping level, 10 different configurations of random replacement are constructed for our simulations in order to approach a statistical average.
For all these different atomic geometries, we compute electronic densities of states (EDOS) using density functional theory (DFT) as implemented in the Vienna Ab-initio Simulation Package (VASP) [51, 52]. A plane-wave basis with a cutoff energy of 500 eV is applied to expand Kohn-Sham states. The generalized-gradient approximation (GGA) parametrized by Perdew, Burke, and Ernzerhof (PBE) is used for the exchange-correlation functional [53]. All simulations are carried out with spin-polarized DFT which does not include the effect of spin-orbit coupling (SOC). We use different -point grids to sample the Brillouin zone (BZ) of the different simulation cells: These parameters are determined based on the convergence of the BCC Fe unit-cell for which a MP -grid is enough to achieve convergence of the total energy per atom to within 2 meV. For larger supercells, we maintain a similar -grid density by scaling the sampling points inversely with the supercell size. For the supercell of ideal BCC Fe and its thermally disordered lattices, we use a Monkhorst-Pack (MP) grid [54]. For the B doped crystalline Fe structures, FeB, a MP grid is applied, and we tested that this converges the total energy to within 1 meV/atom. For amorphous structures, we use a MP grid. Due to the reduced symmetry of a-Fe, a MP -grid is computationally too expensive and we use points.
Structural relaxations for ideal BCC Fe and B doped BCC Fe are performed with a force tolerance of 5 meV/Å. We first relax undoped a-Fe structures within classical MD to a force tolerance of 0.01 eV/Å and refer to these as “MD relaxed” a-Fe. They are then further relaxed by DFT, labeled as “MD+DFT relaxed” a-Fe, with a force tolerance of 0.15 eV/Å, which is the level that we can achieve within a reasonable computational time. We generate B doped a-Fe from the “MD relaxed” geometries and relax these within DFT to the same force tolerance of 0.15 eV/Å. Thermally disordered lattices are not relaxed to maintain the frozen snapshots of the vibrating lattice.
III Results and discussion
III.1 Thermally induced atomic disorder
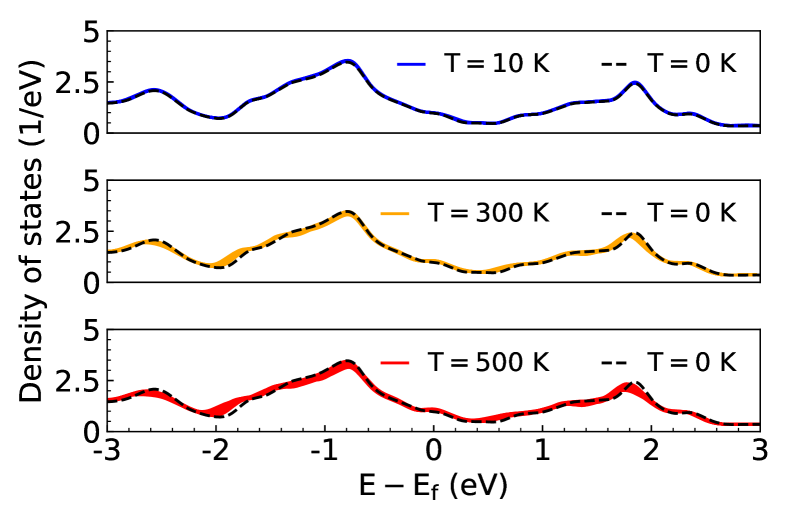
First, we investigate the effect of finite lattice temperature and the resulting atomic disorder on the EDOS of Fe for temperatures of K, 300 K, and 500 K. Phonon excitations displace nuclei from their equilibrium positions, which increasingly disorders atomic geometries with increasing temperature. The EDOS results for all 50 calculated snapshots are plotted in Fig. 2 for each temperature and compared to the EDOS of ideal BCC Fe at K.
These results show that increasing the temperature generally broadens the linewidth of the EDOS relative to the zero-temperature counterpart due to the randomness in the atomic positions for the disordered lattice structure. For and 500 K, noticeable changes to the EDOS are observed especially near peaks at eV, eV, and 1.8 eV as well as valleys near eV and 0.6 eV, see Fig. 2. While the density of states at the Fermi level (EDOS-FL) is much less affected, we provide a quantitative analysis of these changes since they may directly influence electron-magnon damping. Towards this, we compute the average and standard deviation of EDOS-FL for each temperature and find for K that eV-1, for K eV-1, and for K eV-1. These three values are all larger than eV-1 for ideal BCC Fe at zero temperature, showing that increasing temperature increases EDOS-FL for Fe. However, even the increase of about at K is not significant, compared to the influence of doping and amorphization that we discuss later.
While our results show that EDOS-FL of Fe does not significantly change at low temperatures, this does not imply that magnetic damping is temperature independent, since mechanisms other than conductivity like damping also contribute. Conductivity-like electron-magnon damping in the intra-band scattering limit can be approximately described by an empirical formula [55, 56, 22, 24], where is the strength of the spin–orbit interaction near the Fermi level and is the electron relaxation time from the Drude model. The proportionality of to the electron relaxation time implies that conductivity-like damping [22, 24] is more pronounced at lower temperatures or in cleaner crystals where is large. This somewhat counter-intuitive increase of magnetic damping with increasing has been experimentally observed in a recent work on Fe [57] and an earlier work on cobalt (Co) and Nickel (Ni) [58]. We note that in this work, we only study the dependence of on , however, the relaxation time also can dependent on the phonon temperature or lattice disorder, including defects. Our simulation results clearly indicate that the EDOS-FL, one of the factors determining the intrinsic magnetic damping in metallic magnets, is not significantly affected by low temperatures. In addition to conductivity like damping, resistivity like damping may also be affected by temperature, but is not discussed in this study.
III.2 Boron doping
Next, we compare the EDOS of BCC Fe doped with B to that of pure BCC Fe. Four different doping levels are considered and modeled by the structures ( B), ( B), ( B), and ( B), constructed using the cluster expansion method (see Sec. II). Except for the case which is represented by only one class, we calculate weighted average and standard deviation (error bar) over all classes in Table 1 for the other doping levels.
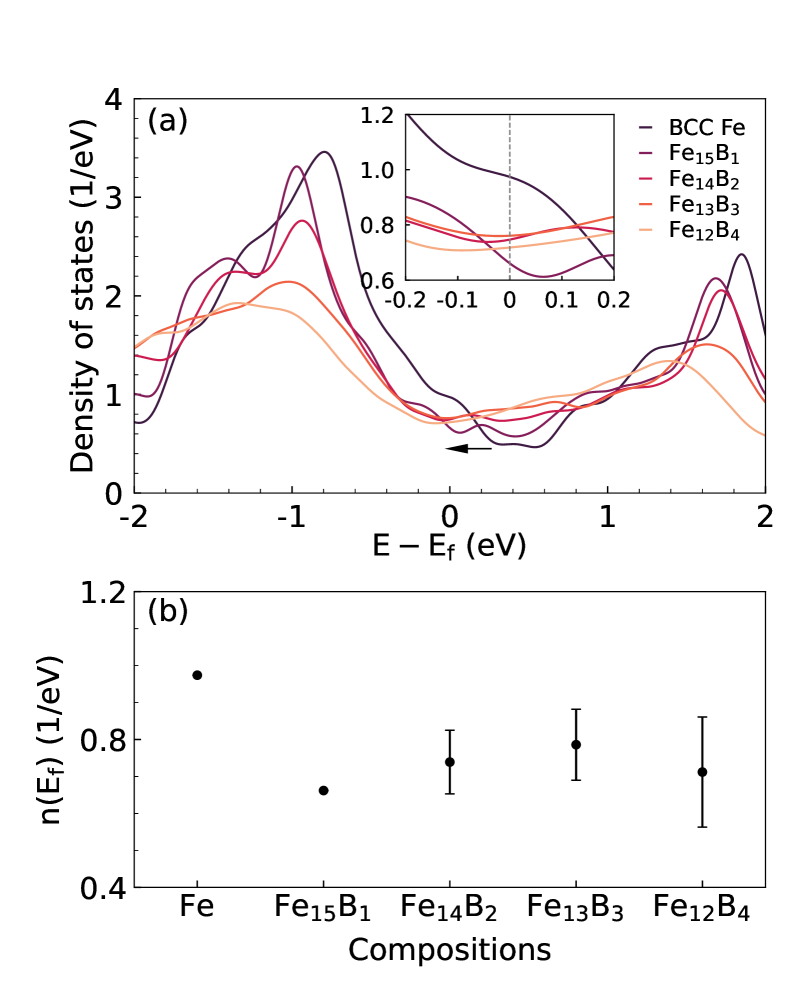
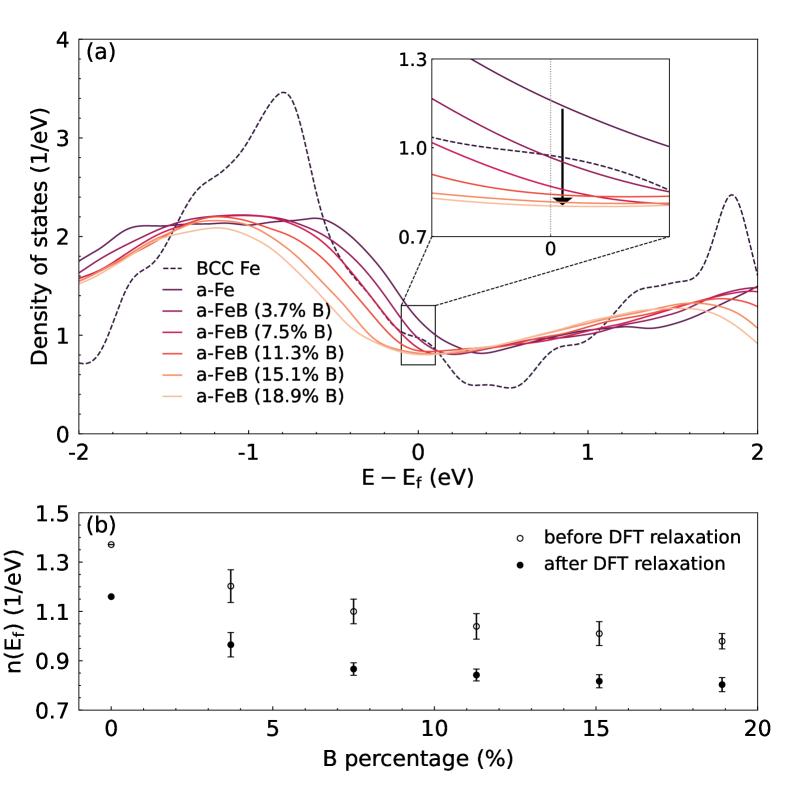
We find that doping B into BCC Fe leads to a reduced EDOS-FL compared to pure BCC Fe for all doping levels considered here [see Fig. 3(a)]. This is because doping with B shifts the entire EDOS to lower energies, such that the Fermi level shifts to the dip in the original non-doped EDOS, as indicated by the black arrow in Fig. 3(a). Main peaks in the EDOS, i.e. at eV and eV, are also shifted to lower energies with increasing B doping. Meanwhile, peak intensities are decreased and peaks widths are broadened with increasing B doping.
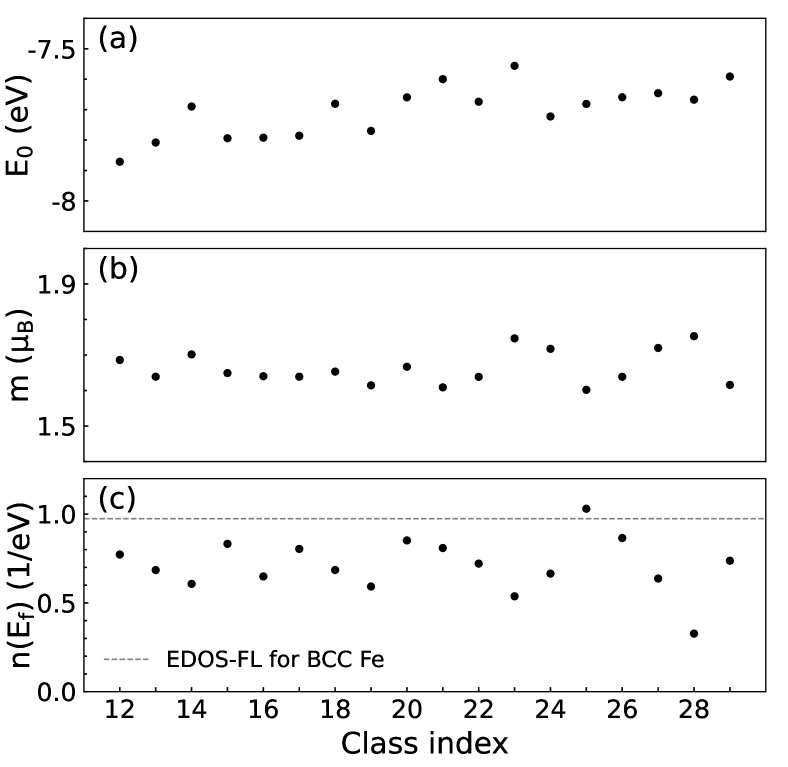
Our data also points to a non-monotonic dependence of on the B doping concentration and, as a result, the possibility of optimizing the doping level to minimize magnon damping. Figure 3(b) shows the average value and the error bar for different doped systems and pure BCC Fe. Our results indicate an optimal B doping level of , which leads to the lowest eV-1. At the same time, with increasing number of B atoms in the doped cell, there are more non-equivalent classes as seen from Table 1, and the error bar increases from =2 to =4. In particular, EDOS-FL for Fe12B4 has a large error bar, which implies that the value of for the 18 non-equivalent classes (see Table 1) spreads over a large range. These classes, although having the same composition, are microscopically quite different regarding the distribution of B on the Fe lattice. In Fig. 4, we analyze the ground state total energy , the magnetic moment , and EDOS-FL for the 18 non-equivalent classes. While spans over a big range from 0.327 eV-1 to 1.030 eV-1, all values remain smaller than the value of the pure BCC Fe, except for the class with the index 25 (see Table 1). This confirms that doping B still decreases EDOS-FL in general. The difference between maximum and minimum value of , , and amounts to 4.09 %, 9.08 %, and 98.74 %, respectively, relative to their average values. We do not identify obvious correlation between the total energy and EDOS-FL in Fig. 4, with a correlation coefficient of . For the lowest-energy class with index of , eV-1, which is larger than the average, while the class with index 28 has a relatively large energy, but the lowest EDOS-FL. However, we do find noticeable negative correlation between the magnetic moment and EDOS-FL with a correlation coefficient of . This observation is benefitial for real magnetic devices, where lower magnetic damping and higher magnetization is often desirable for applications. It could also suggest that growing B doped Fe under an external magnetic field, and thus making high magnetic moment atomic geometries more likely, could lead to samples with lower magnetic damping. It is already well established that synthesis or annealing of amorphous ferromagnets in applied magnetic fields may lead to induced magnetic anisotropies due to modifications of the short-range order [59]. Similar, it is conceivable that applying fields during growth or during a post-annealing may stabilize larger saturation magnetizations [60].
III.3 Structure amorphization
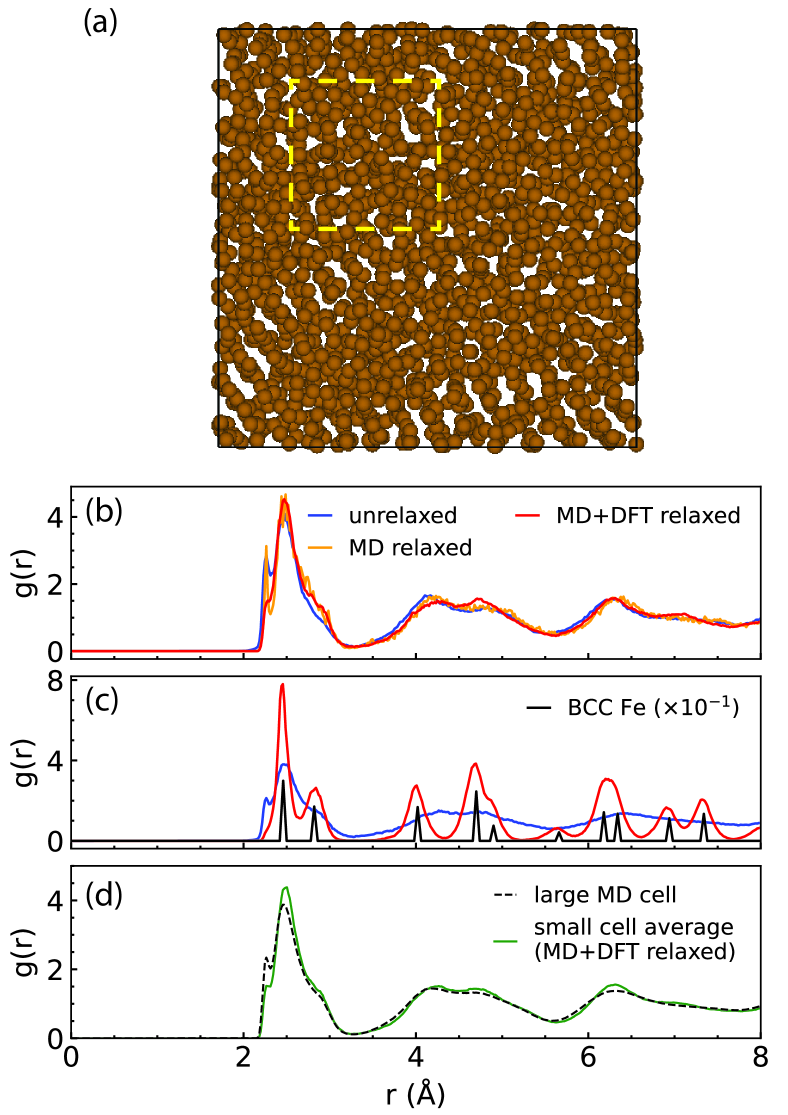
Next, we study the influence of structure amorphization by characterizing a-Fe via the radial distribution function (RDF) . As explained in Sec. II, we use molecular dynamics (MD) to compute atomic positions for a large a-Fe supercell, from which we randomly cut ten small cubic cells [see yellow box in Fig. 5(a)] and subsequently relax using MD (“MD-relaxed”) or MD and DFT (“MD+DFT relaxed”). For eight of these cells, MD and DFT relaxation does not change the RDF and maintains amorphousness, while the other two relax and recrystallize, as evidenced by their RDF. This is shown in Fig. 5(b) for one representative a-Fe cell for which relaxation does not change the amorphousness but simply smoothens . In contrast, Fig. 5(c) shows one example for which DFT relaxation recrystallizes the amorphous structure and discrete sharp peaks appear that coincide with the RDF of ideal BCC Fe. For our purpose of studying EDOS-FL for a-Fe, we exclude the two recrystallized samples. The averaged RDF of the remaining eight a-Fe cells is calculated and compared in Fig. 5(d) to the RDF of the large initial a-Fe supercell, depicted in Fig. 5(a). We can see that for large they almost overlap. For small around , the two curves slightly differ, but still show similar peak structure. Based on this, we conclude that the average of the small a-Fe cells approximates the large a-Fe cell well enough to study EDOS-FL for a-Fe.
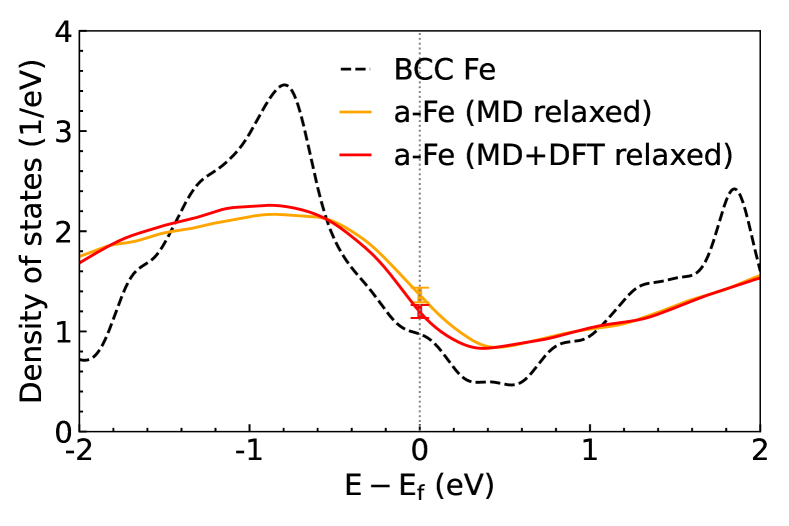
Figure 6 shows that a-Fe has a broadened distribution of the average EDOS and an increased value of EDOS-FL, compared to ideal BCC Fe. The peak structure of the EDOS of BCC Fe is lost for a-Fe and the entire EDOS is smoother and broadened. We note that performing a DFT relaxation on top of the MD relaxed structure can decrease even further, see Fig. 6. However, the increase of EDOS-FL for a-Fe is larger than the error bar for both structure relaxation approaches. Since DFT relaxations with tight force convergence criteria are computationally expensive, we do not explore this in more detail in this work. Instead, we conclude that it is not desirable to reduce of Fe by structure amorphization.
Finally, our results illustrate that the a-Fe structures generated from our MD simulations are fundamentally different from the Fe structure up to a temperature of =500 K, even though in both cases the original perfect BCC Fe lattice structure is appreciably disordered (see details in Fig. S2 of SI). Comparing to the of the perfect BCC Fe at zero lattice temperature, the temperature induced disorder just broadens the original peaks. Some individual peaks are merged if they are too close to each other along the -axis. The a-Fe structure, however, has a fundamentally different . A new distinct peak appears below the lowest inter-atomic distance of BCC Fe, which is even lying outside the broadening observed for =500 K. Meanwhile, for larger has a nearly continuous distribution instead of a discrete distribution sharply peaked at specific distances. This is consistent with our result of only a minor influence of lattice temperature on EDOS-FL and a more noticeable change for a-Fe.
III.4 Amorphous iron with boron doping
Finally, after showing in Sec. III.2 that B doping can decrease the electronic density of states at the Fermi level (EDOS-FL) for crystalline Fe, we now consider B doping of a-Fe. For each doping level, the random distribution of B sites is considered by calculating ten possible configurations. They are constructed as described in Sec. II and subsequently relaxed using DFT until forces on all atoms are smaller than , i.e., the same force tolerance used for “MD+DFT relaxed” a-Fe. For each of these the EDOS is computed and averaged for analysis.
Our results in Fig. 7(a) show that B doping decreases the averaged EDOS at the Fermi level (EDOS-FL) for a-FeB, similar to what we observed for crystalline BCC Fe. With increasing B doping, the EDOS-FL of a-FeB monotonically decreases in the range from 0 % to 18.9 % B, and starts to saturate around 15 %. The inset in Fig. 7(a) focuses on this trend near the Fermi energy (see black arrow). Interestingly, doping B into a-Fe can lead to an EDOS-FL that is even smaller than that of pure BCC Fe, overcoming the increase we discussed for a-Fe (see Fig. 6). This implies that a-FeB is potentially advantageous for reducing intrinsic intra-band magnon-electron damping, even though undoped a-Fe is not.
This is illustrated more clearly in Fig. 7(b) via average and standard deviation. The decrease of with increasing B doping from 0 to 18.9 % is outside the statistical error bars and gradually saturates when the doping percentage is . Therefore, we do not consider larger doping percentages in this work. It is possible that further increasing the doping percentage may even increase similar to what we have observed for B doped BCC Fe in Fig. 3(b). Exploring this is outside the scope of this work, since it is undesired for reducing magnetic damping. Our simulations indicate that of B doping is near the optimal doping level that corresponds to the lowest for a-FeB.
Finally, for all simulated a-FeB structures, DFT relaxation leads to a reduction of EDOS-FL, similar to what we observed for a-Fe in Fig. 6. Figure 7(b) shows for different B doping percentages that this reduction is beyond the range of the statistical error bar. The trend in this figure indicates that while relaxing the amorphous structure to even lower force tolerance is computationally costly, it could lead to slightly lower values of EDOS-FL.
| Structures | EDOS-FL () | Error | |
|---|---|---|---|
| BCC Fe | =0 K | 0.974 | — |
| =10 K | 0.991 | 0.004 | |
| =300 K | 1.038 | 0.012 | |
| =500 K | 1.058 | 0.019 | |
| B-doped BCC Fe | 6.25 % B | 0.662 | — |
| 12.50 % B | 0.739 | 0.086 | |
| 18.75 % B | 0.786 | 0.096 | |
| 25.00 % B | 0.712 | 0.149 | |
| a-Fe | 1.199 | 0.065 | |
| a-FeB | 3.7 % B | 0.965 | 0.049 |
| 7.5 % B | 0.866 | 0.025 | |
| 11.3 % B | 0.842 | 0.024 | |
| 15.1 % B | 0.817 | 0.027 | |
| 18.9 % B | 0.803 | 0.029 | |
We summarize our numerical results for averages and standard deviations of EDOS-FL for all simulated structures in Table 2. This shows that crystalline BCC Fe doped with 6.25 % B leads to the lowest EDOS-FL among all structures considered. Previous experimental work demonstrated that doping carbon into Co-Fe alloys can naturally make the structure amorphous and that amorphous Co-Fe-C alloys can have smaller magnetic damping than polycrystalline Co-Fe alloys [31]. Recent experiments confirmed that similar effects can be achieved with B doping [32]. While this is explained by smaller grain sizes in the amorphous material and, therefore, reduced sample inhomogeneity leading to lower damping, our results indicate that B doping of amorphous Fe is an additional factor that can reduce the intrinsic magnetic damping by decreasing the EDOS-FL.
IV Conclusions
We used first-principles simulations to quantitatively study the influence of lattice temperature, boron doping, and structure amorphization on the electronic structure of iron. Using our results, we discussed how these factors affect the electronic density of states at the Fermi level, as one important quantity determining the intrinsic magnetic damping in metallic magnets within Kamberský’s breathing Fermi surface model. Generally, we showed that both structural effects modify the density of states near the Fermi level to a lesser extent. Instead, doping with B is advantageous in crystalline and amorphous Fe to reduce damping and an optimal doping level of 6.25 % B reduces EDOS-FL by 32 % in crystalline Fe. We also showed that different arrangements of the B atoms on Fe sites affect the resulting magnetization and EDOS-FL values differently. This possibly suggests materials growth under an external magnetic field to favor arrangements with large magnetization and small damping. While this work points to a reduction of EDOS-FL as one reason for reduced magnetic damping in B doped Fe, we expect similar mechanisms to govern C doped material and Co-Fe alloys.
Acknowledgements.
We thank Brian R. Robinson for insightful discussions and valuable suggestion during the development of this manuscript. This work was supported by the U.S. DOE, Office of Science, Basic Energy Sciences, Materials Sciences and Engineering Division under contract No. DE-SC0022060. This work made use of the Illinois Campus Cluster, a computing resource that is operated by the Illinois Campus Cluster Program (ICCP) in conjunction with the National Center for Supercomputing Applications (NCSA) and which is supported by funds from the University of Illinois at Urbana-Champaign.References
- Li et al. [2020] Y. Li, W. Zhang, V. Tyberkevych, W. K. Kwok, A. Hoffmann, and V. Novosad, Hybrid magnonics: Physics, circuits, and applications for coherent information processing, Journal of Applied Physics 128, 130902 (2020).
- Awschalom et al. [2021] D. D. Awschalom, C. R. Du, R. He, F. J. Heremans, A. Hoffmann, J. Hou, H. Kurebayashi, Y. Li, L. Liu, V. Novosad, J. Sklenar, S. E. Sullivan, D. Sun, H. Tang, V. Tyberkevych, C. Trevillian, A. W. Tsen, L. R. Weiss, W. Zhang, X. Zhang, L. Zhao, and C. H. Zollitsch, Quantum engineering with hybrid magnonic systems and materials, IEEE Transactions on Quantum Engineering 2, 10.1109/TQE.2021.3057799 (2021).
- Yuan et al. [2022] H. Y. Yuan, Y. Cao, A. Kamra, R. A. Duine, and P. Yan, Quantum magnonics: When magnon spintronics meets quantum information science, Physics Reports 965, 1 (2022).
- Jiang et al. [2023] Z. Jiang, J. Lim, Y. Li, W. Pfaff, T.-H. Lo, J. Qian, A. Schleife, J.-M. Zuo, V. Novosad, and A. Hoffmann, Integrating magnons for quantum information, Applied Physics Letters 123, 10.1063/5.0157520/2912767 (2023).
- Tabuchi et al. [2015] Y. Tabuchi, S. Ishino, A. Noguchi, T. Ishikawa, R. Yamazaki, K. Usami, and Y. Nakamura, Coherent coupling between a ferromagnetic magnon and a superconducting qubit, Science 349, 405 (2015).
- Rezende [2020] S. M. Rezende, Fundamentals of magnonics, Vol. 969 (Springer International Publishing, 2020).
- Kostylev et al. [2016] N. Kostylev, M. Goryachev, and M. E. Tobar, Superstrong coupling of a microwave cavity to yttrium iron garnet magnons, Applied Physics Letters 108, 10.1063/1.4941730/594143 (2016).
- Bhoi et al. [2014] B. Bhoi, T. Cliff, I. S. Maksymov, M. Kostylev, R. Aiyar, N. Venkataramani, S. Prasad, and R. L. Stamps, Study of photon-magnon coupling in a yig-film split-ring resonant system, Journal of Applied Physics 116, 243906 (2014).
- Li et al. [2019a] Y. Li, T. Polakovic, Y. L. Wang, J. Xu, S. Lendinez, Z. Zhang, J. Ding, T. Khaire, H. Saglam, R. Divan, J. Pearson, W. K. Kwok, Z. Xiao, V. Novosad, A. Hoffmann, and W. Zhang, Strong coupling between magnons and microwave photons in on-chip ferromagnet-superconductor thin-film devices, Physical Review Letters 123, 107701 (2019a).
- Hou and Liu [2019] J. T. Hou and L. Liu, Strong coupling between microwave photons and nanomagnet magnons, Physical Review Letters 123, 107702 (2019).
- Schmidt et al. [2020] G. Schmidt, C. Hauser, P. Trempler, M. Paleschke, and E. T. Papaioannou, Ultra thin films of yttrium iron garnet with very low damping: A review, physica status solidi (b) 257, 1900644 (2020).
- Glass and Elliot [1976] H. L. Glass and M. T. Elliot, Attainment of the intrinsic fmr linewidth in yttrium iron garnet films grown by liquid phase epitaxy, Journal of Crystal Growth 34, 285 (1976).
- Hirohata et al. [2020] A. Hirohata, K. Yamada, Y. Nakatani, L. Prejbeanu, B. Diény, P. Pirro, and B. Hillebrands, Review on spintronics: Principles and device applications, Journal of Magnetism and Magnetic Materials 509, 166711 (2020).
- Jermain et al. [2017] C. L. Jermain, S. V. Aradhya, N. D. Reynolds, R. A. Buhrman, J. T. Brangham, M. R. Page, P. C. Hammel, F. Y. Yang, and D. C. Ralph, Increased low-temperature damping in yttrium iron garnet thin films, Phys. Rev. B 95, 174411 (2017).
- Danilov et al. [1989] V. Danilov, D. Lyfar’, Y. V. Lyubon’ko, A. Y. Nechiporuk, and S. Ryabchenko, Low-temperature ferromagnetic resonance in epitaxial garnet films on paramagnetic substrates, Soviet Physics Journal 32, 276 (1989).
- Danilov and Nechiporuk [2002] V. Danilov and A. Y. Nechiporuk, Experimental investigation of the quantum amplification effect for magnetostatic waves in ferrite-paramagnet structures, Technical Physics Letters 28, 369 (2002).
- Mihalceanu et al. [2018] L. Mihalceanu, V. I. Vasyuchka, D. A. Bozhko, T. Langner, A. Y. Nechiporuk, V. F. Romanyuk, B. Hillebrands, and A. A. Serga, Temperature-dependent relaxation of dipole-exchange magnons in yttrium iron garnet films, Phys. Rev. B 97, 214405 (2018).
- Kosen et al. [2019] S. Kosen, A. F. van Loo, D. A. Bozhko, L. Mihalceanu, and A. D. Karenowska, Microwave magnon damping in YIG films at millikelvin temperatures, APL Materials 7, 101120 (2019), https://pubs.aip.org/aip/apm/article-pdf/doi/10.1063/1.5115266/14563526/101120_1_online.pdf .
- Azzawi et al. [2023] S. Azzawi, A. Umerski, L. C. Sampaio, S. A. Bunyaev, G. N. Kakazei, and D. Atkinson, Synthetic route to low damping in ferromagnetic thin-films, APL Materials 11, 10.1063/5.0147172/2905618 (2023).
- Korenman and Prange [1972] V. Korenman and R. E. Prange, Anomalous damping of spin waves in magnetic metals, Physical Review B 6, 2769 (1972).
- Kamberský [1976] V. Kamberský, On ferromagnetic resonance damping in metals, Czechoslovak Journal of Physics 26, 1366 (1976).
- Gilmore et al. [2007] K. Gilmore, Y. U. Idzerda, and M. D. Stiles, Identification of the dominant precession-damping mechanism in Fe, Co, and Ni by first-principles calculations, Phys. Rev. Lett. 99, 027204 (2007).
- Kamberský [1970] V. Kamberský, On the Landau–Lifshitz relaxation in ferromagnetic metals, Canadian Journal of Physics 48, 2906 (1970).
- Kamberský [2007] V. Kamberský, Spin-orbital Gilbert damping in common magnetic metals, Physical Review B - Condensed Matter and Materials Physics 76, 134416 (2007).
- Gilmore et al. [2008] K. Gilmore, Y. U. Idzerda, and M. D. Stiles, Spin-orbit precession damping in transition metal ferromagnets (invited), Journal of Applied Physics 103, 7 (2008).
- Thonig and Henk [2014] D. Thonig and J. Henk, Gilbert damping tensor within the breathing fermi surface model: anisotropy and non-locality, New Journal of Physics 16, 13032 (2014).
- Mizukami et al. [2011] S. Mizukami, F. Wu, A. Sakuma, J. Walowski, D. Watanabe, T. Kubota, X. Zhang, H. Naganuma, M. Oogane, Y. Ando, and T. Miyazaki, Long-lived ultrafast spin precession in manganese alloys films with a large perpendicular magnetic anisotropy, Physical Review Letters 106, 117201 (2011).
- Schoen et al. [2016] M. A. Schoen, D. Thonig, M. L. Schneider, T. J. Silva, H. T. Nembach, O. Eriksson, O. Karis, and J. M. Shaw, Ultra-low magnetic damping of a metallic ferromagnet, Nature Physics 2016 12:9 12, 839 (2016).
- Schoen et al. [2017] M. A. Schoen, J. Lucassen, H. T. Nembach, B. Koopmans, T. J. Silva, C. H. Back, and J. M. Shaw, Magnetic properties in ultrathin 3d transition-metal binary alloys. II. Experimental verification of quantitative theories of damping and spin pumping, Physical Review B 95, 134411 (2017).
- Arora et al. [2021] M. Arora, E. K. Delczeg-Czirjak, G. Riley, T. J. Silva, H. T. Nembach, O. Eriksson, and J. M. Shaw, Magnetic Damping in Polycrystalline Thin-Film Fe-V Alloys, Physical Review Applied 15, 054031 (2021).
- Wang et al. [2019] J. Wang, C. Dong, Y. Wei, X. Lin, B. Athey, Y. Chen, A. Winter, G. M. Stephen, D. Heiman, Y. He, H. Chen, X. Liang, C. Yu, Y. Zhang, E. J. Podlaha-Murphy, M. Zhu, X. Wang, J. Ni, M. McConney, J. Jones, M. Page, K. Mahalingam, and N. X. Sun, Magnetostriction, Soft Magnetism, and Microwave Properties in Co-Fe-C Alloy Films, Physical Review Applied 12, 034011 (2019).
- Lourembam et al. [2021] J. Lourembam, K. H. Khoo, J. Qiu, H. Xie, S. K. Wong, Q. J. Yap, and S. T. Lim, Tuning Damping and Magnetic Anisotropy in Ultrathin Boron-Engineered MgO/Co–Fe–B/MgO Heterostructures, Advanced Electronic Materials 7, 2100351 (2021).
- Momma and Izumi [2011] K. Momma and F. Izumi, Vesta 3 for three-dimensional visualization of crystal, volumetric and morphology data, urn:issn:0021-8898 44, 1272 (2011).
- Åberg et al. [2013] D. Åberg, P. Erhart, and V. Lordi, Contributions of point defects, chemical disorder, and thermal vibrations to electronic properties of alloys, Physical Review B - Condensed Matter and Materials Physics 88, 045201 (2013).
- Schleife et al. [2010] A. Schleife, M. Eisenacher, C. Rödl, F. Fuchs, J. Furthmüller, and F. Bechstedt, Ab initio description of heterostructural alloys: Thermodynamic and structural properties of and , Physical Review B 81, 245210 (2010).
- Schleife et al. [2011] A. Schleife, C. Rödl, J. Furthmüller, and F. Bechstedt, Electronic and optical properties of and from ab initio calculations, New Journal of Physics 13, 085012 (2011).
- Sanchez et al. [1984] J. M. Sanchez, F. Ducastelle, and D. Gratias, Generalized cluster description of multicomponent systems, Physica A: Statistical Mechanics and its Applications 128, 334 (1984).
- Zunger et al. [1994] A. Zunger, P. Turchi, and A. Gonis, Statics and dynamics of alloy phase transformations, NATO ASI Series. Series B, Physics 319 (1994).
- Teles et al. [2000] L. Teles, J. Furthmüller, L. M. R. Scolfaro, J. Leite, and F. Bechstedt, First-principles calculations of the thermodynamic and structural properties of strained and alloys, Physical Review B 62, 2475 (2000).
- Caetano et al. [2006] C. Caetano, L. K. Teles, M. Marques, A. D. Pino, and L. G. Ferreira, Phase stability, chemical bonds, and gap bowing of alloys: Comparison between cubic and wurtzite structures, Physical Review B - Condensed Matter and Materials Physics 74, 045215 (2006).
- Thompson et al. [2022] A. P. Thompson, H. M. Aktulga, R. Berger, D. S. Bolintineanu, W. M. Brown, P. S. Crozier, P. J. in ’t Veld, A. Kohlmeyer, S. G. Moore, T. D. Nguyen, R. Shan, M. J. Stevens, J. Tranchida, C. Trott, and S. J. Plimpton, Lammps - a flexible simulation tool for particle-based materials modeling at the atomic, meso, and continuum scales, Computer Physics Communications 271, 108171 (2022).
- Dudarev and Derlet [2005] S. L. Dudarev and P. M. Derlet, A ‘magnetic’ interatomic potential for molecular dynamics simulations, Journal of Physics: Condensed Matter 17, 7097 (2005).
- L and M [2007] D. S. L and D. P. M, A ‘magnetic’ interatomic potential for molecular dynamics simulations., Journal of Physics: Condensed Matter 19, 239001 (2007).
- Derlet and Dudarev [2007] P. M. Derlet and S. L. Dudarev, Million-atom molecular dynamics simulations of magnetic iron, Progress in Materials Science 52, 299 (2007).
- Elliott and Tadmor [2011] R. S. Elliott and E. B. Tadmor, Knowledgebase of Interatomic Models (KIM) application programming interface (API), https://openkim.org/kim-api (2011).
- Tadmor et al. [2011] E. B. Tadmor, R. S. Elliott, J. P. Sethna, R. E. Miller, and C. A. Becker, The potential of atomistic simulations and the Knowledgebase of Interatomic Models, JOM 63, 17 (2011).
- Gilbert [2018] M. R. Gilbert, EAM potential for magnetic bcc metals with cubic spline interpolation v002, OpenKIM, https://doi.org/10.25950/9776664f (2018).
- Dudarev and Derlet [2018] S. Dudarev and P. Derlet, EAM potential (magnetic, cubic tabulation) for magnetic Fe developed by Dudarev and Derlet (2005) v002, OpenKIM, https://doi.org/10.25950/eb4996de (2018).
- Ma et al. [2007] P. W. Ma, W. C. Liu, C. H. Woo, and S. L. Dudarev, Large-scale molecular dynamics simulation of magnetic properties of amorphous iron under pressure, Journal of Applied Physics 101, 73908 (2007).
- Ichikawa [1973] T. Ichikawa, Electron diffraction study of the local atomic arrangement in amorphous iron and nickel films, physica status solidi (a) 19, 707 (1973).
- Kresse and Furthmüller [1996a] G. Kresse and J. Furthmüller, Efficiency of ab-initio total energy calculations for metals and semiconductors using a plane-wave basis set, Computational Materials Science 6, 15 (1996a).
- Kresse and Furthmüller [1996b] G. Kresse and J. Furthmüller, Efficient iterative schemes for ab initio total-energy calculations using a plane-wave basis set, Physical Review B 54, 11169 (1996b).
- Perdew et al. [1996] J. P. Perdew, K. Burke, and M. Ernzerhof, Generalized Gradient Approximation Made Simple, Physical Review Letters 77, 3865 (1996).
- Monkhorst and Pack [1976] H. J. Monkhorst and J. D. Pack, Special points for brillouin-zone integrations, Physical Review B 13, 5188 (1976).
- Li et al. [2019b] Y. Li, F. Zeng, S. S. Zhang, H. Shin, H. Saglam, V. Karakas, O. Ozatay, J. E. Pearson, O. G. Heinonen, Y. Wu, A. Hoffmann, and W. Zhang, Giant Anisotropy of Gilbert Damping in Epitaxial CoFe Films, Physical Review Letters 122, 117203 (2019b).
- Fähnle et al. [2008] M. Fähnle, D. Steiauf, and J. Seib, The Gilbert equation revisited: anisotropic and nonlocal damping of magnetization dynamics, Journal of Physics D: Applied Physics 41, 164014 (2008).
- Khodadadi et al. [2020] B. Khodadadi, A. Rai, A. Sapkota, A. Srivastava, B. Nepal, Y. Lim, D. A. Smith, C. Mewes, S. Budhathoki, A. J. Hauser, M. Gao, J. F. Li, D. D. Viehlad, Z. Jiag, J. J. Heremas, P. V. Balachadra, T. Mewes, and S. Emori, Conductivitylike Gilbert Damping due to Intraband Scattering in Epitaxial Iron, Physical Review Letters 124, 157201 (2020).
- Bhagat and Lubitz [1974] S. M. Bhagat and P. Lubitz, Temperature variation of ferromagnetic relaxation in the 3d transition metals, Physical Review B 10, 179 (1974).
- Berry and Pritchet [1975] B. S. Berry and W. C. Pritchet, Magnetic annealing and directional ordering of an amorphous ferromagnetic alloy, Phys. Rev. Lett. 34, 1022 (1975).
- Wu et al. [2016] C. Wu, K. Wang, D. Li, C. Lou, Y. Zhao, Y. Gao, and Q. Wang, Tuning microstructure and magnetic properties of electrodeposited CoNiP films by high magnetic field annealing, Journal of Magnetism and Magnetic Materials 416, 61 (2016).