ATLAS January 15, 2024
Measurements of single top quark production processes with the ATLAS and CMS experiments
Laura Pintucci111Contact: laura.pintucci@cern.ch on behalf of the ATLAS and CMS Collaborations
INFN Sezione di Trieste, Gruppo Collegato di Udine
Università degli Studi di Trieste
This report contains a brief summary of the latest single top quark production cross-section measurements performed by the ATLAS and CMS collaborations on collisions collected during Run 2 of the LHC. Various results for channel, channel and associated single top production are discussed. Particular attention is given to the main techniques used by the analyses and the main systematic uncertainties limiting these precise measurements.
††Copyright 2023 CERN for the benefit of the ATLAS and CMS Collaborations.
Reproduction of this article or parts of it is allowed as specified in the CC-BY-4.0 license.
PRESENTED AT
International Workshop on Top Quark Physics
(Top2023), 24–29 September, 2023
1 Introduction
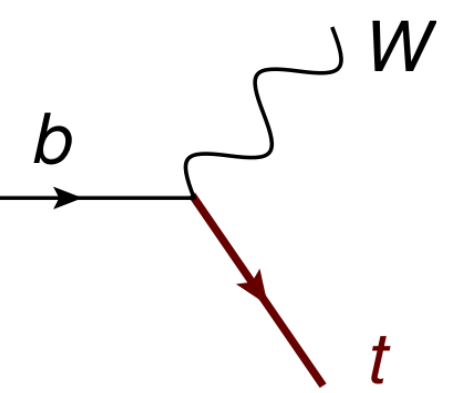
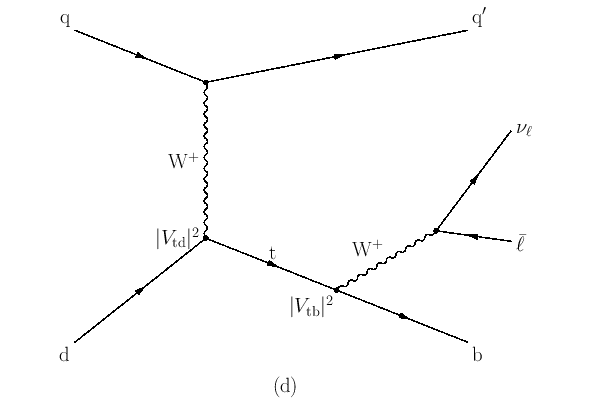
The top quark can be produced at hadron collider, such as the LHC, via the strong interaction or the EW interaction. In the first case, a top quark and an anti-quark are produced in pair (), while in the second case, a top quark (or anti-quark) is produced, referred to as single top production. In the Standard Model (SM) the single top production is a charged current electroweak process, that has a vertex involving a top quark, a bottom quark and a boson ( vertex), as shown in Figure 1. Based on how the vertex is oriented one can have different modes for the single top production: the channel is the one with the largest cross-section at the LHC and it is characterized by the exchange of a virtual boson between a light quark and a top quark; the channel has the smallest cross-section and it is the production and decay of an off-shell boson; the associated production has in its final state a top quark and a boson.
One of the interesting properties of single top production is that its cross-section is proportional to the square root of the Cabibbo Kobayashi Maskawa (CKM) matrix element . Moreover, single top cross-section measurements and charge asymmetry measurements of top quark versus top anti-quark can have an important impact on constraining PDFs, and the three channels are complementary to each other and to production.
In the following sections, some of the latest single top quark production cross-section measurements performed by the ATLAS and CMS collaborations on collisions collected during Run 2 of the LHC are presented.
2 Single top channel production
In this section, four different channel measurements are described, two of which are performed using data collected by the CMS experiment [1], and the other two have been released in the last year using data collected by the ATLAS experiment [2].
The latest result for the channel cross-section measurement from the CMS Collaboration uses data at the centre-of-mass energy of TeV with a luminosity of fb-1 [3]. In this analysis, events are selected if they contain one electron or muon, two or three jets of which at maximum two of them must be tagged as jets (tagged jets). Boosted Decision Trees (BDTs) are used to separate the signal from the background. A profile likelihood fit is performed to extract yields of the single top quark, and anti-quark production using the BDTs distributions and the transverse mass of the reconstructed boson (). Differential cross-section measurements are extracted with an unfolding at parton and particle level, and good agreement is found between data distributions and Monte Carlo (MC) prediction with the 4 and 5 flavour schemes.
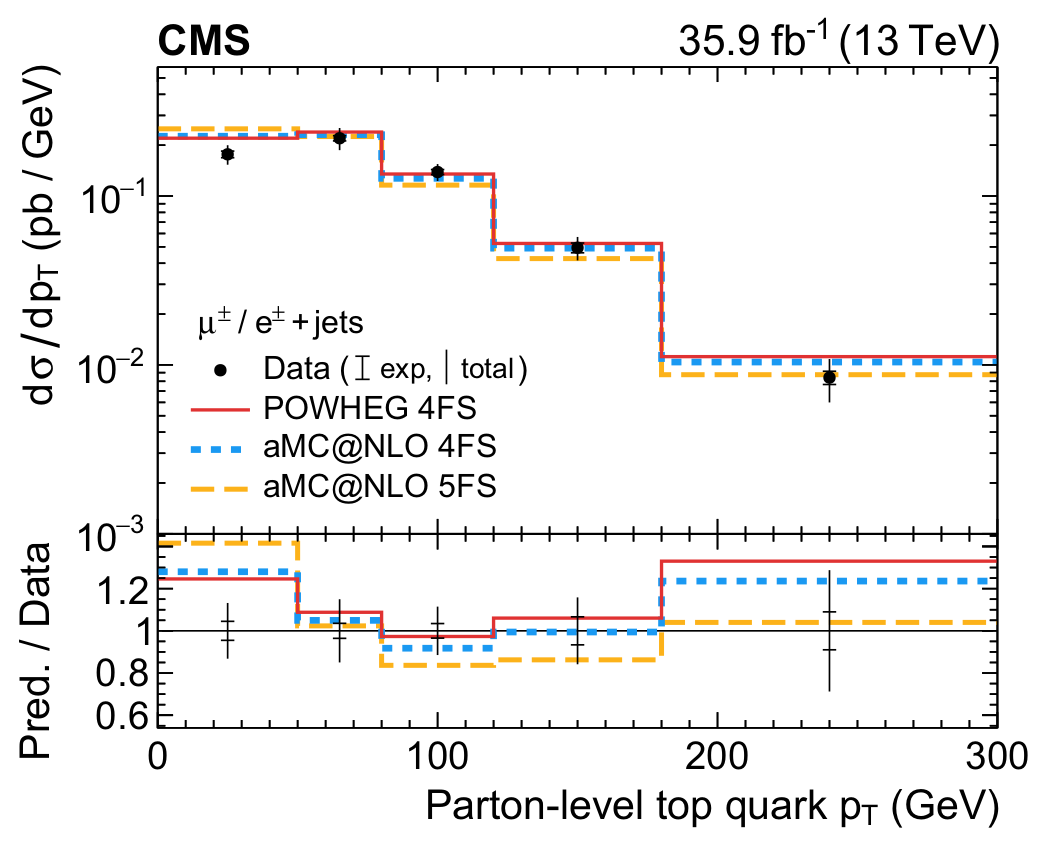
Only for the transverse momentum of the reconstructed top quark and boson the 5 flavour MC predictions do not agree as well with the data, as shown in Figure 2. Differential ratios of the top quark production rates to the sum of the top quark and antiquark rates are compared to predictions from three different PDF sets which are all found to be in good agreement. The spin asymmetry111The normalised differential cross section as a function of at the parton level is related to the top quark polarisation as , where the polarising angle is computed in the top quark rest frame. is extracted from the differential cross-section distribution with respect to the polarizing angle at parton level, and it is found to be in good agreement with the SM prediction.
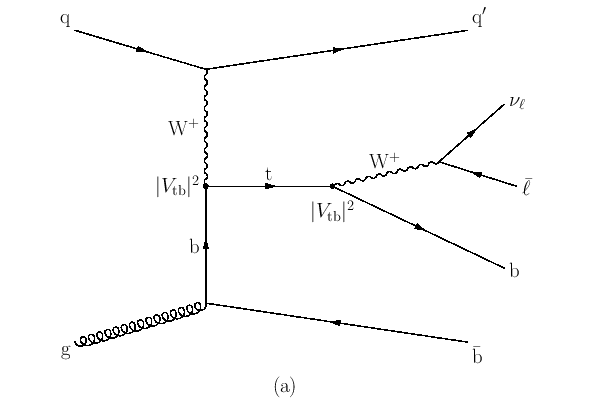
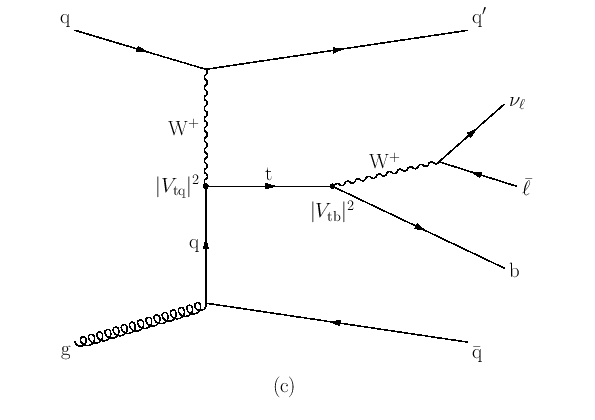
In a different CMS analysis, the objective is to measure the CKM matrix elements , and through the channel cross-section at TeV with data corresponding to an integrated luminosity of fb-1 [4]. Events are selected if they contain one isolated electron or muon and have GeV. Various signal topologies are considered, based on which vertex the Feynman diagram has in the single top production point and decay point. The vertexes can be either proportional to the element or to the one222In this analysis only the quark referred to as indicates a light jet with , as shown in Figure 3.

Different signal regions are selected based on the number of jets and tagged jets in the final state: two jets of which one tagged is the region enriched in events involving in both production and decay, three jets of which one tagged is enriched in events involving in only production or decay, and three jets of which two tagged is enriched in events with in both production and decay. For each region, a BDT is trained and a maximum Likelihood fit is performed on their distributions. Confidence intervals are measured at 95% CL in the SM scenario, assuming the SM unitarity constrain , and they are found to be and . Two unconstrained Beyond the SM (BSM) scenarios are then considered, in the second one the assumption is that the mixing of the three families of quarks is negligible, and the measured values are and .
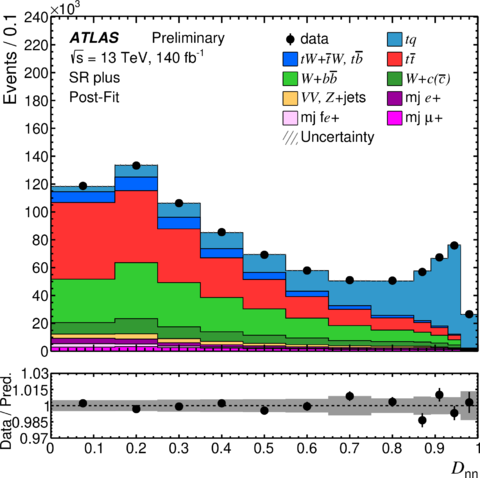
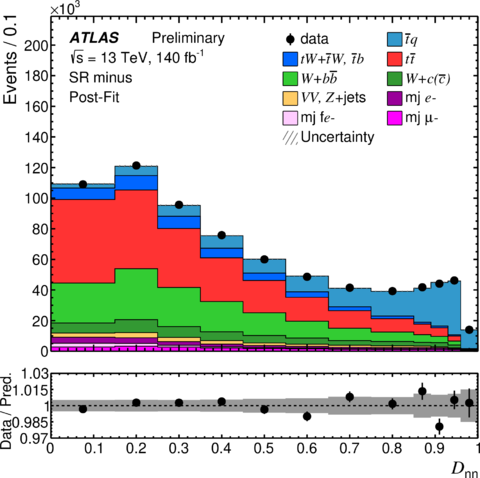
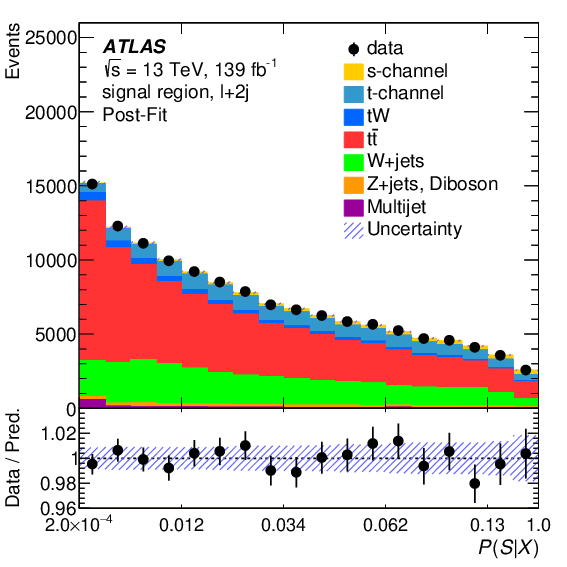
The ATLAS Collaboration has measured the inclusive single top channel cross-section at the centre of mass energy of TeV with data corresponding to an integrated luminosity of fb-1 [5]. Events are selected if they contain one isolated electron or muon, two jets, one of which tagged. Further selection on the missing transverse energy , transverse momentum of the lepton , and are applied to reduce multi-jet background and a selection on the invariant mass of the lepton and tagged jet is used to avoid bad modelling of top decays. To better separate signal versus background, a neural network (NN) is trained using 17 input kinematics variables of reconstructed objects, boson, and top quark. The NN is applied to data in two different regions based on the lepton charge and its distributions are used for the Profile likelihood fit to extract the total channel cross-section , the top quark and top anti-quark cross-sections and their ratio , the expected and measured values are shown in Table 1. The NN distributions after the fit are shown in Figure 4.
| [pb] | [pb] | [pb] | ||
|---|---|---|---|---|
| Measured | ||||
| Predicted |
The systematic uncertainties which have the highest impact on the cross-section measurements in this analysis are those relative to the top-quark production process modelling, such as the NLO-matching scale, the parton shower and final state radiation, and systematics relative to the jet energy scale and the tagging of jets originating from bottom quarks. In the ratio measurement many systematic uncertainties cancel out, and those that still have a big impact are those related to the -jets background cross-section, the top quark parton shower and PDFs.
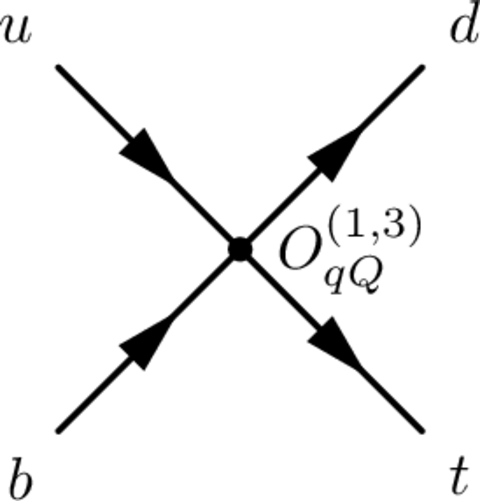
In the contest of Effective Field Theory (EFT) interpretation, dimension 6 operators are considered in this analysis to parameterise new physics effects, in particular the four-quark operator which leads to single top quark production via non-SM interactions, as shown in Figure 5. A maximum Likelihood scan on the corresponding Willson coefficient is used to extract the 95% CL interval that is determined to be: .
Furthermore, the analysis extracts the value for the CKM matrix element assuming that and the top quark always decay to a boson and a bottom quark, obtaining . In a more generalised CKM interpretation the assumption on the contribution of is removed, and nine different contributions to the single top production are considered, based on the quark that is present in the vertex in production and decay. The setup used is to set one CKM element to 0 and perform a 2D maximum likelihood scan over the other two CKM elements.
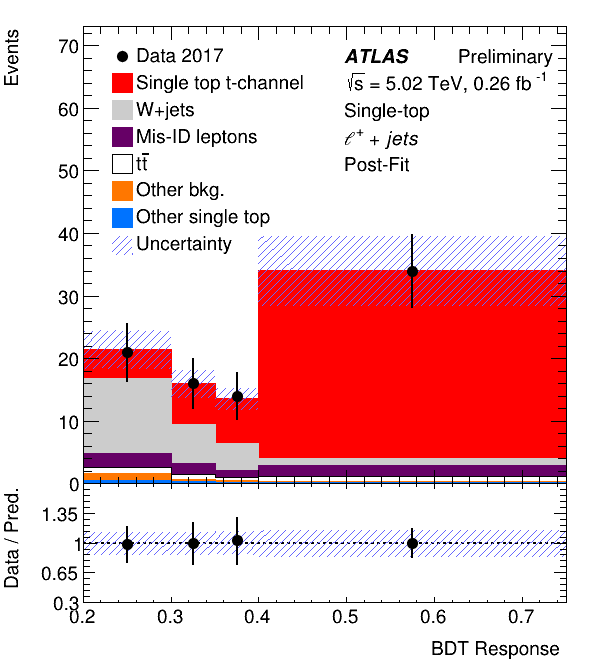
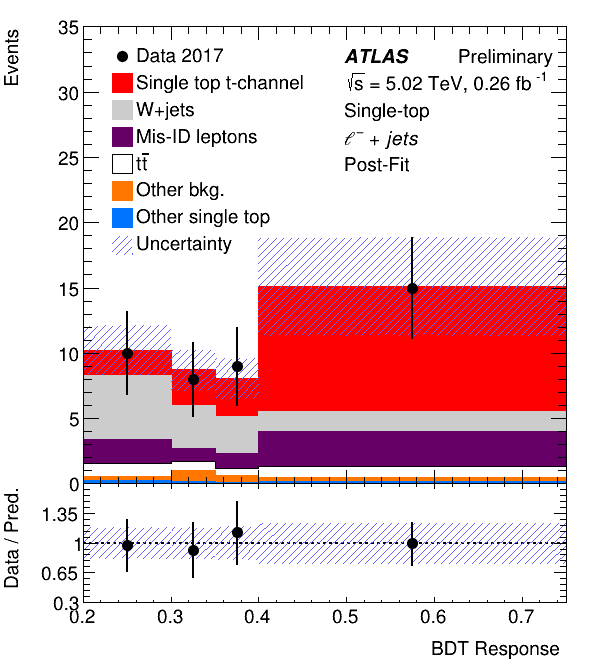
The ATLAS Collaboration measured the channel single top production cross-section also at the centre-of-mass energy of TeV with data corresponding to an integrated luminosity of pb-1 [6]. The sample of data used has a low pile-up, with an average number of interactions per bunch crossing . In this analysis, events are selected if they contain one isolated electron or muon, exactly two jets, one of which tagged, with a separation in pseudo-rapidity between the two jets . Further selections are applied on kinematic observables to reduce the mis-identified background and increase the signal purity. A BDT is trained on 9 input variables and a three-fold cross-validation is used to test the performances and check for over-training effects. A profile maximum likelihood fit is performed on the BDT output distribution in two different regions, defined based on the lepton charge, to extract the total channel cross-section , the top quark and top anti-quark cross-sections and their ratio , the expected and measured values are shown in Table 2.
| [pb] | [pb] | [pb] | ||
|---|---|---|---|---|
| Measured | ||||
| Predicted |
Figure 6 shows the BDT output distributions after the fit. The single top channel production process is observed with a significance of standard deviations at TeV with respect to the background-only hypothesis. The total uncertainty on this cross-section measurement has a similar contribution from the statistical and systematic error, while the ratio measurement is statistically dominated.
3 Single top channel production
Measurements of single top production in the channel are very challenging at the LHC because of its little production cross-section ( pb) and because it is challenging to separate it from its main background (top quark pair production). The ATLAS Collaboration has observed evidence of this process using the full Run 2 dataset at an energy in the centre-of-mass of TeV [7]. Events are selected if they contain one electron or muon, GeV and GeV and they contain at least two tagged jets. The Matrix Element Method (MEM) [8] is used to separate signal events from background ones: it is a per-event likelihood calculation that returns the probability that a certain final state is of the process ().
Then applying Bayes’ theorem a discriminant is obtained: its distribution is shown in Figure 7. The measured cross-section is pb, and the background-only hypothesis is rejected with an observed significance of standard deviations. In the cross-section measurement the systematic uncertainties with the highest impact are related to the background normalisation and modelling, the channel modelling, jet energy resolution and scale and MC statistics.
4 Single top associated production
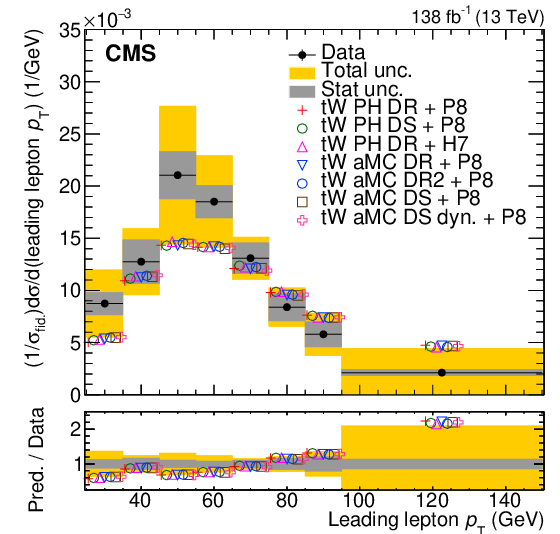
In this section two recent CMS measurements of the single top associated production () are reported: one is in the dileptonic decay channel, while the other is in the single-lepton decay channel. The first one is the differential production cross-section measurement at TeV with data corresponding to an integrated luminosity of fb-1 [9]. Events are selected if they have one electron and one muon of opposite charge in the final state, and their invariant mass is greater than GeV. For the inclusive cross-section measurement, selected events are separated into three orthogonal samples: one with one tagged jet, one with two jets one of which tagged, and a control region for the background. A profile likelihood fit is performed on the output distribution of a BDT applied to the first two samples defined and to the sub-leading jet transverse momentum in the control region. The measured cross-section is pb. Differently in the case of the differential measurements, only the signal region with events that contain one tagged jet is considered with the further request to have no other jets with GeV GeV. A profile likelihood unfolding is used to obtain normalised particle-level differential cross-sections in a dedicated fiducial volume. Differential distributions are found to be in good agreement with Monte Carlo predictions, even if a slight disagreement is found for the distribution and for the leading lepton as shown in Figure 8.
A different analysis has observed the associated production in the single-lepton decay channel at an energy in the centre-of-mass of TeV with data corresponding to an integrated luminosity of fb-1 [10]. Events are selected if they have one electron or muon and at least two jets, one of which must be tagged. Events are divided based on the number of jets in the final state: three jets for the signal region, two jets for events in the control region for the background and 4 jets for the production background control region. The background normalisation and the multi-jet background normalisation and template are extracted from the data. Two BDTs are trained on events with electrons or muons in the final state to separate the signal from the background production and their output distributions are used for a maximum likelihood fit, as shown in Figure 9.
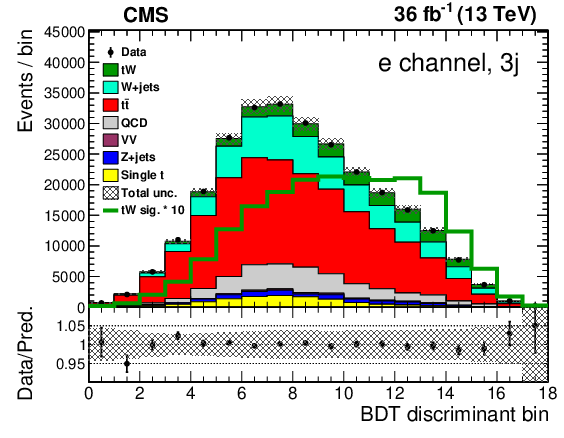
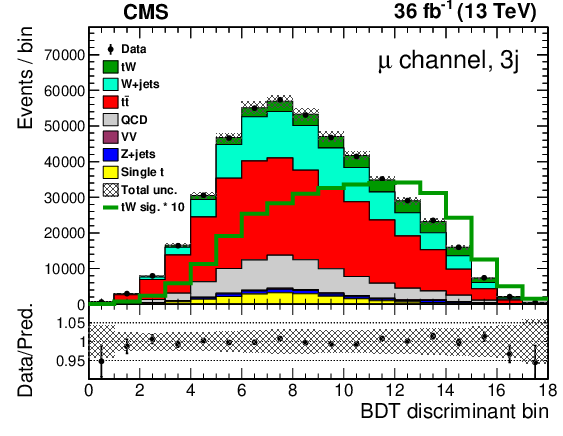
The measured cross-section is pb which is compatible with the SM prediction.
5 Conclusions
In this report, an overview of recent single top results by the ATLAS and CMS Collaborations using collisions collected during the Run 2 of the LHC has been given. Considering only the inclusive measurements included in this work, the relative uncertainties reached for the three main production modes of single top are: a relative uncertainty for the channel cross-section and a for the top quark and anti-quark ratio in [5], a relative uncertainty of on the channel cross-section in [7], and a relative uncertainty of on the production in [9]. In the analysis discussed in this report, we can see that the leading systematic uncertainties are: signal and background modelling and jet-related uncertainties in the channel and channel single top measurements and background normalization and jet energy scale for the single top production.
These results show that we have gained a deep understanding of the single top production processes and reached good precision, especially in the channel single top measurements. In general, all measurements are found to be in agreement with the SM predictions both for inclusive and differential results.
References
- [1] CMS Collaboration. The CMS Experiment at the CERN LHC. JINST, 3:S08004, 2008.
- [2] ATLAS Collaboration. The ATLAS Experiment at the CERN Large Hadron Collider. JINST, 3:S08003, 2008.
- [3] CMS Collaboration. Measurement of differential cross sections and charge ratios for t-channel single top quark production in proton–proton collisions at . Eur. Phys. J. C, 80(5):370, 2020.
- [4] CMS Collaboration. Measurement of CKM matrix elements in single top quark -channel production in proton-proton collisions at 13 TeV. Phys. Lett. B, 808:135609, 2020.
- [5] ATLAS Collaboration. http://cds.cern.ch/record/2860644. ATLAS-CONF-2023-026.
- [6] ATLAS Collaboration. http://cds.cern.ch/record/2862022. ATLAS-CONF-2023-033.
- [7] ATLAS Collaboration. Measurement of single top-quark production in the s-channel in proton–proton collisions at = 13 TeV with the ATLAS detector. JHEP, 06:191, 2023.
- [8] K. Kondo. Dynamical Likelihood Method for Reconstruction of Events With Missing Momentum. 1: Method and Toy Models. J. Phys. Soc. Jap., 57:4126–4140, 1988.
- [9] CMS Collaboartion. Measurement of inclusive and differential cross sections for single top quark production in association with a W boson in proton-proton collisions at = 13 TeV. JHEP, 07:046, 2023.
- [10] CMS Collaboration. Observation of tW production in the single-lepton channel in pp collisions at = 13 TeV. JHEP, 11:111, 2021.