A Model parameters

Table 1: Constant model parameters and baseline values of the input parameters
\toprule Parameter Value Unit
\midrule      \multirow10*\makecellBaseline values for
input parameters Ravsubscript𝑅𝑎𝑣R_{av} 6.0 \multirow5*mmHgms/mlmmHgmsml\mathrm{mmHg\;ms/ml}
Raosubscript𝑅𝑎𝑜R_{ao} 240.0
Rartsubscript𝑅𝑎𝑟𝑡R_{art} 1125.0
Rvcsubscript𝑅𝑣𝑐R_{vc} 9.0
Rmvsubscript𝑅𝑚𝑣R_{mv} 4.1
\cmidrule3-5 Caosubscript𝐶𝑎𝑜C_{ao} 0.3 \multirow3*ml/mmHgmlmmHg\mathrm{ml/mmHg}
Cartsubscript𝐶𝑎𝑟𝑡C_{art} 3.0
Cvcsubscript𝐶𝑣𝑐C_{vc} 133.3
\cmidrule3-5 Ees,lvsubscript𝐸𝑒𝑠𝑙𝑣E_{es,lv} 3.00 mmHg/mlmmHgml\mathrm{mmHg/ml}
ttr,lvsubscript𝑡𝑡𝑟𝑙𝑣t_{tr,lv} 420 msms\mathrm{ms}
\midrule\multirow17*\makecellConstant
Parameters \multirow5*Closed-Loop Vtotalsubscript𝑉𝑡𝑜𝑡𝑎𝑙V_{total} 5200 \multirow4*mlml\mathrm{ml}
Vao,rsubscript𝑉𝑎𝑜𝑟V_{ao,r} 100
Vart,rsubscript𝑉𝑎𝑟𝑡𝑟V_{art,r} 900
Vvc,rsubscript𝑉𝑣𝑐𝑟V_{vc,r} 2800
\cmidrule3-5 Tcsubscript𝑇𝑐T_{c} 800 msms\mathrm{ms}
\cmidrule2-5 \multirow5*Left-Ventricle Alvsubscript𝐴𝑙𝑣A_{lv} 1.00 mmHg/mlmmHgml\mathrm{mmHg/ml}
Blvsubscript𝐵𝑙𝑣B_{lv} 0.027 1/ml1ml1/\mathrm{ml}
Vlv,rsubscript𝑉𝑙𝑣𝑟V_{lv,r} 10 mlml\mathrm{ml}
\cmidrule3-5 Tmax,lvsubscript𝑇𝑚𝑎𝑥𝑙𝑣T_{max,lv} 280 \multirow2*msms\mathrm{ms}
τlvsubscript𝜏𝑙𝑣\tau_{lv} 25
\cmidrule2-5 \multirow7*Left-Atrium Ees,lasubscript𝐸𝑒𝑠𝑙𝑎E_{es,la} 0.45 mmHg/mlmmHgml\mathrm{mmHg/ml}
Alasubscript𝐴𝑙𝑎A_{la} 0.45 mmHg/mlmmHgml\mathrm{mmHg/ml}
Blasubscript𝐵𝑙𝑎B_{la} 0.05 1/ml1ml1/\mathrm{ml}
Vla,rsubscript𝑉𝑙𝑎𝑟V_{la,r} 10 mlml\mathrm{ml}
\cmidrule3-5 Tmax,lasubscript𝑇𝑚𝑎𝑥𝑙𝑎T_{max,la} 150 \multirow3*msms\mathrm{ms}
τlasubscript𝜏𝑙𝑎\tau_{la} 25
ttr,lasubscript𝑡𝑡𝑟𝑙𝑎t_{tr,la} 225
\bottomrule

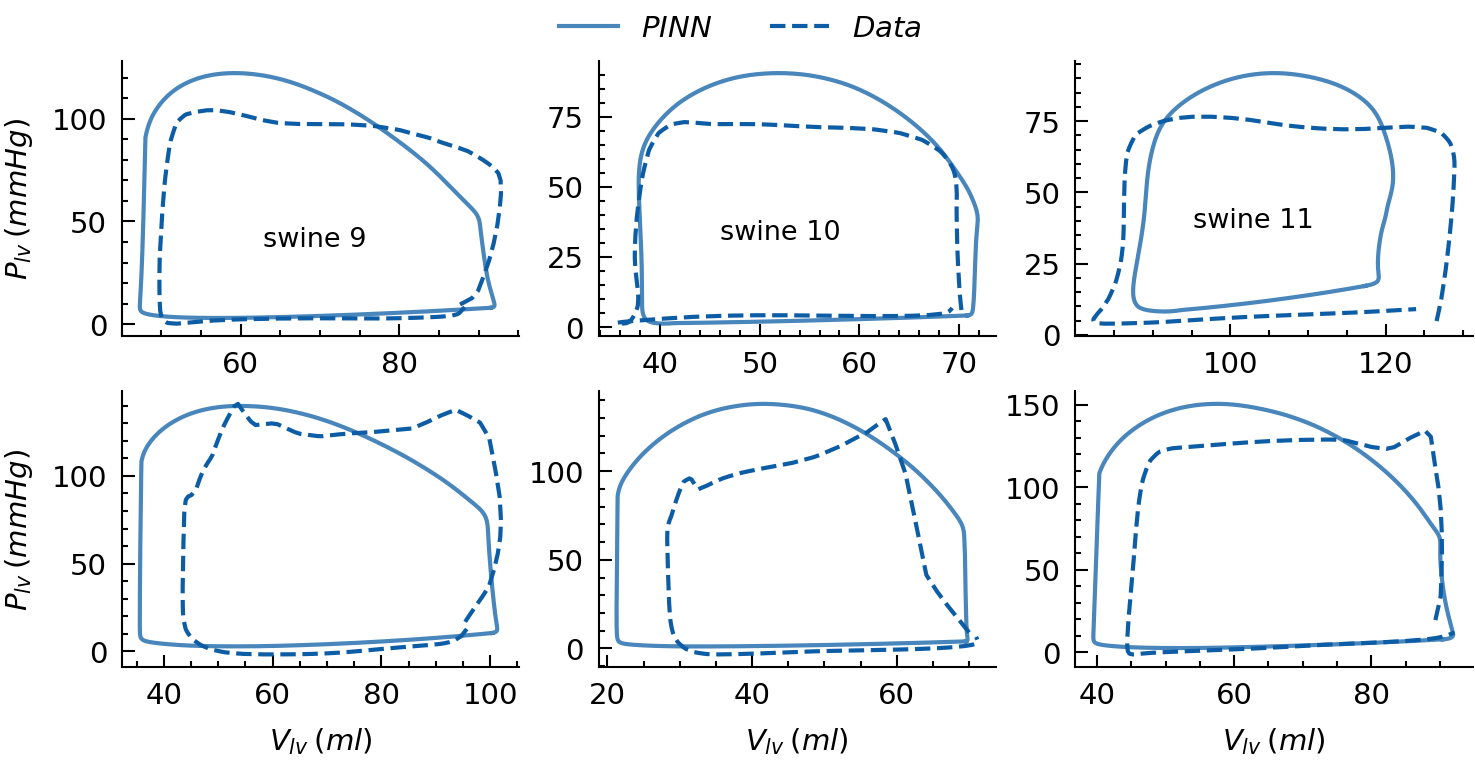
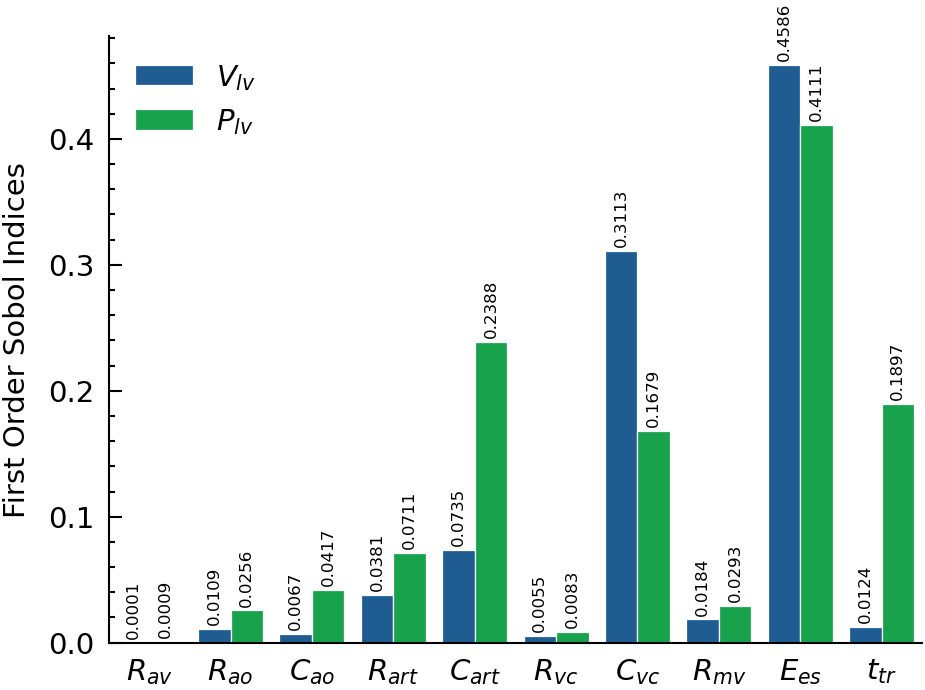
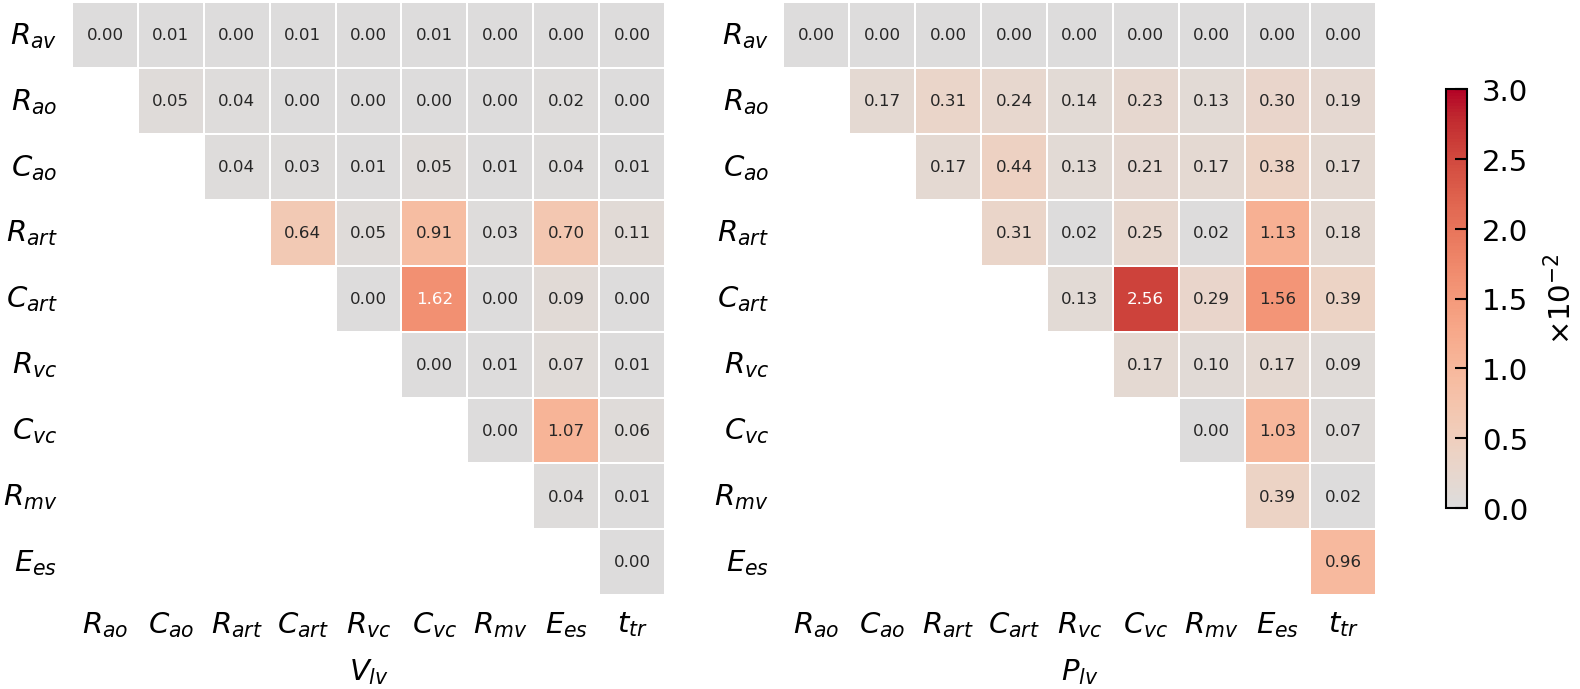
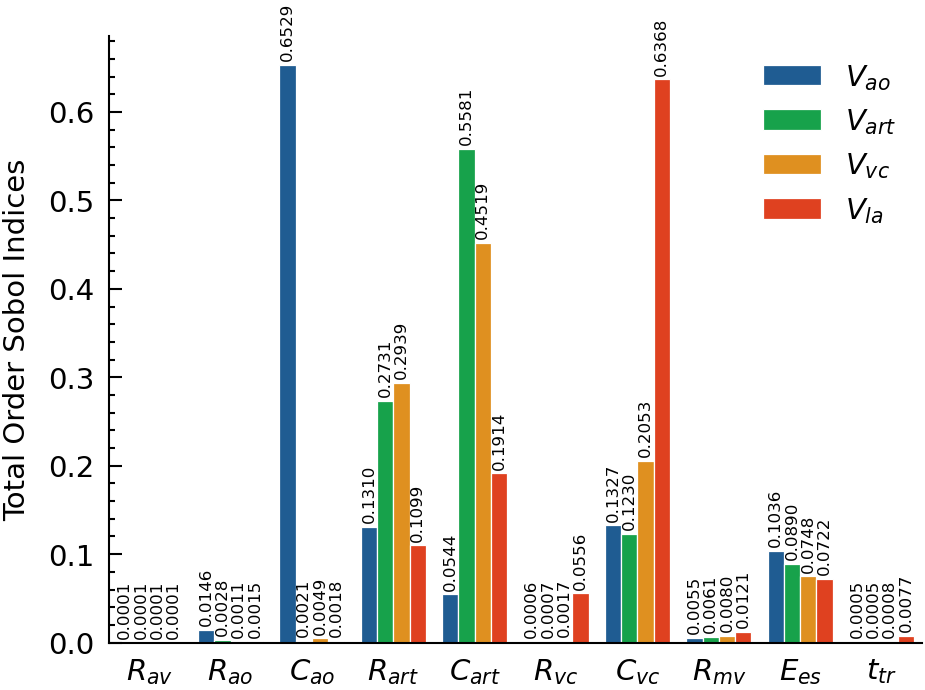
B Supplementary plots

Refer to caption
Figure 1: First order Sobol indices associated with Vlvsubscript𝑉𝑙𝑣V_{lv} and Plvsubscript𝑃𝑙𝑣P_{lv} for each input parameter
Refer to caption
Figure 2: Second order Sobol indices associated with Vlvsubscript𝑉𝑙𝑣V_{lv} and Plvsubscript𝑃𝑙𝑣P_{lv} for each input parameter
Refer to caption
Figure 3: Total order Sobol indices associated with Vaosubscript𝑉𝑎𝑜V_{ao}, Vartsubscript𝑉𝑎𝑟𝑡V_{art}, Vvcsubscript𝑉𝑣𝑐V_{vc}, and Vlasubscript𝑉𝑙𝑎V_{la} for each input parameter
{subfigure}

[b]0.98 Refer to caption

Figure 4: PV loops for eight swine subjects at their baseline
{subfigure}

[b]0.85 Refer to caption

Figure 5: PV loops for three swine subjects before (top panel) and after (bottom) Dobutamine administration
Figure 6: Comparison of the PV loops from inverse modeling with the corresponding measurements from the swine models